
the Creative Commons Attribution 4.0 License.
the Creative Commons Attribution 4.0 License.
 | 14 Sep 2026
Mechanisms of enhancing soil fertility without obviously elevating global warming potential under an optimal rice straw incorporation rate in a paddy soil
Mengxue Zhang
Rujia Liao
Wenzhao Zhang
Cheng Fang
Simon Guerrero-Cruz
András Táncsics
Baoli Zhu
Wenxue Wei
Rong Sheng

The utility of rice straw as an organic fertilizer has been widely recognized as a promising approach to enhancing soil fertility. However, straw return is currently in a dilemma, as it may also provoke greenhouse gas (GHG) emissions, leading to serious environmental consequences. It is urgent to reveal the feasibility of straw incorporation regarding soil fertility improvement without notable increases in GHG emissions. Here, a soil microcosm experiment was conducted using paddy soils collected from a long-term rice straw incorporation field experiment. The treatments of the field experiment, namely CK, ST1, ST2, and ST3 corresponding to the straw application rates of 0 %, 50 %, 100 %, and 150 % of the local rice straw yield, respectively, were continued in the microcosm experiment. The dynamics of GHG fluxes and concentrations in soils, and the variations in the abundances of soil microbial communities were systematically determined. The results indicated that ST1 treatment obviously improved soil fertility but did not induce significant elevation of global warming potential (GWP) with only 3 % increase compared to CK. Although ST2 and ST3 treatments showed greater improvements in soil fertility, they significantly increased GWP by up to 151 %. The minimal GWP increase under ST1 was mainly attributed to the significant reduction in N2O emission and the slight rise in CH4 emission compared to CK. The further investigations revealed that ST1 possessed the highest nosZII abundance and the lowest nirS/nosZII ratio, indicating its highest N2O consumption ability. Meanwhile, its CH4 production ability fluctuated around the soil CH4 holding capacity (190 mmol mol−1), and most of the produced CH4 was consumed by methanotrophs in soil. In conclusion, rice straw can be incorporated into paddy soils at a suitable application rate, which can effectively enhance soil fertility without inducing an additional warming effect.
- Article
(1609 KB) - Full-text XML
-
Supplement
(1720 KB) - BibTeX
- EndNote


Rice cultivation not only provides staple food for nearly half of the global population, but also produces massive rice straw that is estimated to be 800×106 to 1000×106 t yr−1 globally (Yuan et al., 2021; Harun et al., 2022). Rice straw has long been a valuable organic resource that can be incorporated into rice paddies to improve soil productivity (Huo et al., 2024; Zhou et al., 2024). The incorporation can enhance soil carbon (C) sequestration (Chen et al., 2025; Li et al., 2025a). It was estimated that about 15 %–25 % of the incorporated straw C was converted into soil organic carbon (SOC) (Liu et al., 2023b). Straw return can also provide abundant available nutrients for rice plant growth, including nitrogen (N), phosphorus (P), and potassium (K) (Yin et al., 2018; Van Hung et al., 2020; Wang et al., 2020). Thus, rice straw incorporation has been proposed to be an important agronomic practice for sustainable rice agriculture.
However, rice straw return was also revealed to exacerbate greenhouse gas (GHG) emissions from paddy fields (Shi et al., 2023; He et al., 2024). Rice cultivation contributes around 12 % of global agricultural GHG emissions (FAO, 2020) with straw incorporation being one of the key drivers. Numerous studies indicated that compared to straw removal, rice straw incorporation substantially promoted methane (CH4) emissions (Han et al., 2023; Song et al., 2024; Qin et al., 2025). The increases in CH4 emissions varied widely across observations, which approximately ranged from 23 % to 1192 % (Shen et al., 2014; Jiang et al., 2019; Lee et al., 2020; Nan et al., 2022; Song et al., 2024). Straw incorporation may also elevate carbon dioxide (CO2) fluxes from rice paddies, for example, by 9 % to 67 % (Shen et al., 2014; Lee et al., 2020; Han et al., 2023; Song et al., 2024). However, the effect of rice straw incorporation on nitrous oxide (N2O) emissions from rice fields was inconsistent and controversial across studies (Shen et al., 2014; Wang et al., 2015; Han et al., 2023; Qin et al., 2023). The variations in N2O emissions were about −73 % to 137 % in comparison with their controls (Shen et al., 2014; Wang et al., 2015; Han et al., 2023; Qin et al., 2023). The variability in GHG emissions could be affected by several factors, such as soil properties, agricultural management, and climate conditions, with the amount of straw incorporated potentially playing a vital role. Optimizing the straw input rate was suggested to mitigate straw-induced GHG emissions (Shen et al., 2014; Chen et al., 2018; Li et al., 2024). For instance, incorporating half of the harvested rice straw effectively reduced CH4 emission by 48 % relative to full straw incorporation (Shen et al., 2014). However, most studies focused either on the influence of straw return on soil productivity (Huo et al., 2024; Zhou et al., 2024) or on GHG emissions (Shi et al., 2023; He et al., 2024), rarely taking both into consideration to reveal the rational straw application. As a result, the balance and underlying mechanisms between soil fertility and GHG emissions are still poorly understood, leaving no clear consensus on how much straw should be incorporated appropriately. Hence, it is of high priority to investigate the suitable straw incorporation rate and the mechanisms in improving soil fertility while not triggering substantial GHG emissions.
Soil GHG emissions are predominantly regulated by the microbially mediated production and consumption processes. CH4 production and oxidation are catalyzed by methyl-coenzyme M reductase of methanogens and particulate methane monooxygenase of methanotrophs, with their active subunits encoded by mcrA and pmoA genes, respectively (Gao et al., 2020; Liu et al., 2025). The potential for N2O production in paddy soils is closely associated with nitrite reduction, with nitrite reductases encoded by nirK and nirS genes (Chen et al., 2010, 2024; Kong et al., 2024). N2O reduction is typically mediated by two distinct clades of N2O reductase, encoded by nosZI and nosZII genes, respectively (Jones et al., 2013; Hallin et al., 2018; Liu et al., 2023a; Yang et al., 2024). While straw incorporation generally enhanced CH4 production, its effects on CH4 oxidation and N2O production and reduction remain controversial. Some studies reported negligible effects of straw application on pmoA abundance (Wang et al., 2018), but others found increases in pmoA abundance (Jiang et al., 2019; Zhou et al., 2020a). For instance, long-term straw amendment increased pmoA abundance by 59 % (Yang et al., 2022). Likewise, straw incorporation led to inconsistent responses from N2O-related genes (Wang et al., 2018, 2021). The abundances of nirK, nirS, nosZI, and nosZII were reported to increase, decrease, or remain unchanged following straw application (Wang et al., 2018). Taken together, the microbial mechanisms underlying GHG responses to straw incorporation remain insufficiently understood, particularly how key functional microbial communities respond to different straw application rates and thereby regulate GHG emissions.
Here, we hypothesized that there would be a moderate straw incorporation rate, which could well balance improving soil fertility and minimizing the increase in GWP. Considering that field experiments can hardly avoid the influences of climate and other factors, and the advantages of microcosm experiment including controlled environment and high operability in frequent gas and soil sampling, a soil microcosm experiment was employed to continue the field experiment with 5-year rice straw incorporation at different rates. The incubation was set with flooding and drying periods. The dynamics of GHG emissions and concentrations in soils were determined, and the variations in the abundance of soil microbial communities involved in GHG production and consumption were measured. This study aimed to reveal the mechanisms of boosting soil fertility without elevating GWP under an optimal rice straw incorporation rate.
2.1 Site description and experimental design
A long-term straw return field experiment was initiated in 2017, which was located at the Taoyuan Agroecosystem Research Station (28°55′ N, 111°26′ E), Hunan, China. The region has a subtropical monsoon climate with a mean annual rainfall of 1440 mm and a mean annual temperature of 16.5 °C. The soil was derived from quaternary red clay and classified as Ultisol according to USDA soil taxonomy. The experiment contained various rates of rice straw amendments with three replications in a randomized block design. Each plot was 30 m2 (7.5 m × 4 m) and the cropping was single rice. Rice straw cut into 10 cm segments was evenly spread on the surface of the corresponding plots and turned over into the plow layer (0–20 cm) in each early May. Urea, superphosphate, and potassium chloride were annually applied to all treatments at 112.60 kg N ha−1, 46.33 kg P ha−1, and 135.46 kg K ha−1, respectively. All treatments were subjected to the same water management. During the rice season, all plots were continuously flooded except for two drying events. The first drying event occurred at the end of the tillering stage and lasted for one to two weeks. The second drying event happened one week before harvest. In the fallow season, all plots remained unirrigated.
2.2 Soil and straw sampling and preparation
Soils (0–20 cm) were separately taken from CK, ST1, ST2, and ST3 treatments of the field experiment in May 2022 before straw application. The corresponding straw incorporation rates were 0, 3750, 7500, and 11 250 kg ha−1, representing 0 %, 50 %, 100 %, and 150 % of the local rice straw yield, respectively. The soil from each treatment was collected by taking five points following an “S” pattern in each plot and mixed, and then transported to the lab. The fresh soils were directly flooded and homogenized into slurries to avoid the impact of air–drying on microbial communities. Plant residues and gravel were removed by sieving the slurries through a 2 mm mesh, and the resulting soil slurries were pre-incubated under flooding at room temperature for 30 d. The soil physicochemical properties were shown in Table 1.
Table 1Soil properties after five-year straw incorporation at different rates.
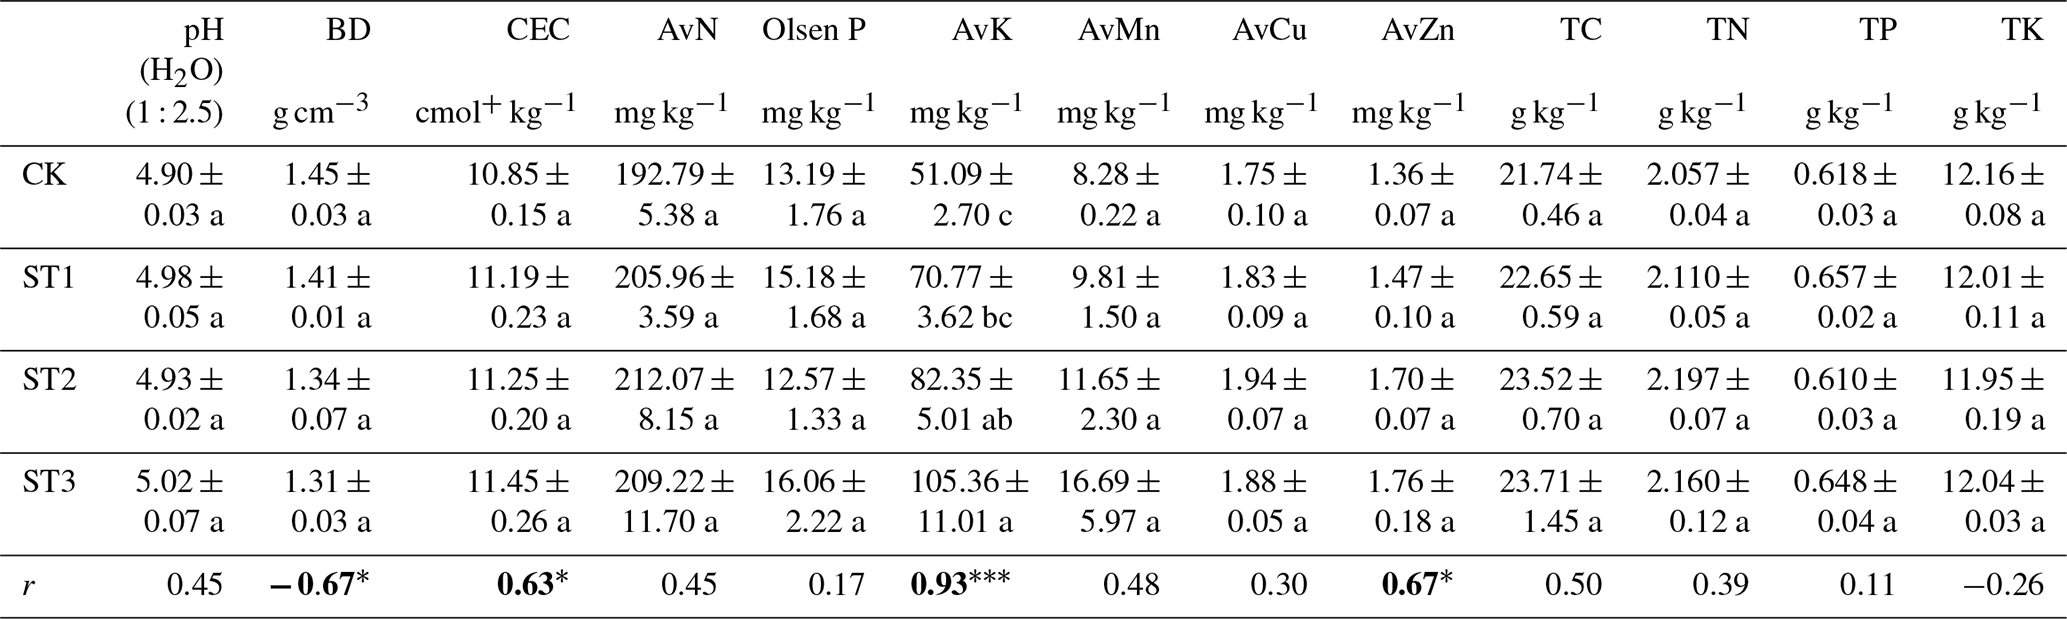
These soils were collected from the plots of a long-term field experiment for the microcosm experiment. CK, ST1, ST2, and ST3 received 0 %, 50 %, 100 %, and 150 % of the local harvested rice straw, respectively. Different lower-case letters indicate significant differences between treatments (α=0.05). Data are given in average ± standard error (n=3). The Spearman correlation coefficient (r) between soil properties and straw rate is presented in the last row, and significant values are shown in bold. * α=0.05; α=0.01; α=0.001. BD, bulk density; CEC, cation exchange capacity; AvN, available nitrogen; Olsen P, available phosphorus; AvK, available potassium; AvMn, available manganese; AvCu, available copper; AvZn, available zinc; TC, total carbon; TN, total nitrogen; TP, total phosphorus; TK, total potassium.
Rice straw was prepared by collecting it from the field in October 2021, followed by air–drying and grinding (< 1 mm) for the microcosm experiment. The sieved straw can be evenly distributed and in uniform contact with soil particles, generating similar decomposition speeds among the pots of each treatment. The rice straw contained 44.14 % of C, 0.817 % of N, 2.34 % of K, and 0.143 % of P.
2.3 Microcosm experiment
The incubation pots were prepared by sealing the bottoms of PVC cylinders (height 15 cm, diameter 15.5 cm). The pots for gas sampling were further equipped as follows (Fig. S1 in the Supplement). For gas flux sampling, a hollow rectangular groove (deep 2 cm) was fixed on the top fringe of each pot for water sealing during sampling. The gas flux samples were collected using a static chamber (height 29.5 cm, diameter 19.5 cm) fitted with a small electric fan at the inner top. For soil profile gas sampling, two holes (diameter 1.7 cm) across the cylinder were drilled at positions of 5 cm from the bottom, filled with a gas-permeable silicone tube (length 15.5 cm, inner diameter 1.2 cm) closed at both ends with silicone septa. One end of the tube was connected with a three-way stopcock outside the cylinder via a stainless steel tube (diameter 0.2 cm) through the septum. The drilled holes in the cylinder wall were then sealed.
The pre-incubated soils drained of surface water from the different field treatments were separately filled into the pots. Each pot was filled with wet soil to 10 cm in height containing 1.27 kg of dry soil. The straw addition amounts in the incubation were 0, 2.00, 4.00, and 6.00 g straw kg−1 dry soil for CK, ST1, ST2, and ST3 treatments, respectively, which were converted from the straw incorporation rates of the field experiment. Each treatment had eight pots: three for gas sampling, three for soil sampling, and two for replacing sampling-induced soil columns to minimize gas exchange from the sampled holes.
Urea was prepared as a stock solution (12.70 g N L−1), and 10 mL of this solution was added to each pot, equivalent to 100 mg N kg−1 dry soil. After urea and straw were applied, the soil was thoroughly mixed immediately to ensure that the straw and N fertilizer can be uniformly distributed in the soil. Then, deionized water was added to form a 3 cm surface water layer. The prepared microcosms were randomly positioned and incubated in the dark at 30 °C for 91 d (28 d flooding and 63 d drying). This incubation period was based on our pre-experiment to cover both CH4 and N2O emission peaks. During flooding, a 3 cm top water layer was maintained with deionized water. The drying process was carried out by removing the top water from the microcosm with a syringe on day 28 and then drying by natural evaporation in the room.
2.4 Gas and soil sampling
Gas samples for GHG fluxes and soil profile concentrations were taken between 09:00 and 11:00 a.m. local time (UTC+8). every 1–3 d. At each sampling event, after the groove was filled with water and covered by the chamber, 30 mL of headspace gas was taken with a syringe separately at 0 and 60 min from each gas sampling pot (Wang et al., 2017; Zhou et al., 2020b). The electric fan was running during the sampling period. Immediately after collecting all headspace gas samples, 1 mL of soil gas was taken from each buried silicone tube, with an equal volume of helium injected back. The gas from the silicone tube was used to determine the soil CO2, CH4, and N2O concentrations. All the gas samples were stored in 12 mL pre-evacuated exetainer vials (Labco, UK).
Soil samples (0–5 cm) were taken every two weeks via a modified syringe sampler with its head cut off. At each sampling event, three cores (diameter 1.5 cm) were sampled from each pot and mixed, weighing about 35 g wet soil. During flooding, the soil samples were collected directly without removing the overlying water to minimize the disturbance (Cai et al., 2022, 2025). Before starting soil sampling, placing the front end of the syringe sampler as close as possible to the soil surface effectively reduced the collection of the overlying water. A part of the sample was used for soil moisture measurement, and the rest was flash-frozen in liquid nitrogen and stored at −80 °C for molecular analysis. After sampling, the holes were immediately refilled with the cores taken from the soil replacement pots.
2.5 Analysis of gas concentrations and soil properties
Gas samples were analyzed using a gas chromatography (7890A, Agilent, USA) equipped with an electron capture detector for N2O and a flame ionization detector for CH4 and CO2. Gas fluxes were calculated based on the Ideal Gas Law (Eqs. 1 and 2), and cumulative emissions by the Trapezoidal Rule (Eq. 3). Global warming potential (GWP) was calculated using cumulative emissions (Eq. 4).
Where F is the gas flux (µg m−2 h−1); Δm is the mass of gas collected in a single sampling event (µg); A is the soil surface area covered by the static chamber (m−2); Δt is the time interval after chamber closure (h).
Where M is the molar mass of gas (g mol−1); Δn is the amount of substance of gas collected in a single sampling event (mol); p is the atmospheric pressure (Pa); V is the active volume of the static chamber during sampling (m3); Δc is the gas concentration difference (ppm); R is the gas constant (8.314 J mol−1 K−1); T is the temperature during sampling (K).
Where CE is the gas cumulative emission (g m−2); F is the gas flux (µg m−2 h−1); 1000 in the denominator is to transform µg to g; t is the sampling time (d); i and i+1 represent the ith and (i+1)th sampling events, respectively; 24 is the transform factor from day to hour; n is the total number of sampling events.
Where the unit of GWP is g CO2 equivalent m−2. CE, CE, and CE represent the cumulative emissions (g m−2) of CO2, CH4, and N2O, respectively. The factors 27.9 and 273 are the latest-updated 100-year global warming potentials for CH4 and N2O, respectively (Forster et al., 2021).
Soil properties were measured by standard protocols (Bao, 2000). Soil pH was determined using soil slurry at a soil–water ratio of 1 : 2.5 by a pH meter (FE28–Standard, Mettler Toledo, Switzerland). Soil bulk density (BD) was measured by the ring knife method. Soil cation exchange capacity (CEC) was extracted by 1.66 cM Co(NH3)6Cl3 at a soil–extractant ratio of 7 : 100. Olsen P was extracted by 0.5 M NaHCO3 at a soil–extractant ratio of 1 : 20. Soil CEC and Olsen P were quantified colorimetrically via a continuous–flow automatic analyzer (AutoAnalyzer 3, SEAL Analytic, Germany). Available N (AvN) was determined by the alkaline diffusion method. Available K (AvK) was extracted by 1 M NH4OAc at a soil–extractant ratio of 1 : 10 and analyzed via an atomic absorption spectrometer (novAA350, Analytic Jena, Germany). Soil available manganese (AvMn), copper (AvCu), and zinc (AvZn) were simultaneously extracted by 5 mM DTPA–CaCl2–TEA at a soil–extractant ratio of 1 : 2 and determined by an inductively coupled plasma emission spectrometer (ICP–OES 5110, Agilent, USA). Soil total C (TC) and total N (TN) were analyzed by combustion using an elemental analyzer (Vario MAX cube, Elementar, Germany). Soil total P (TP) and total K (TK) were measured by the ICP–OES after digestion by HNO3–HClO4–HF.
2.6 DNA extraction and real-time quantitative PCR
Soil DNA was extracted manually as previously described (Chen et al., 2010). Each sample was performed in triplicate. The quality and concentration of DNA were measured by a NanoDrop ND–1000 spectrophotometer (Thermo Scientific, USA). The abundances of bacterial 16S rRNA, fungal 18S rRNA, mcrA, pmoA, nirK, nirS, nosZI, and nosZII were determined by real-time quantitative PCR (qPCR). The qPCR primers and thermal programs were shown in Table S1 in the Supplement. All qPCR reactions were conducted in triplicate on 384-well plates by a LightCycler 480II (Roche, Switzerland). Each reaction (10 µL) contained 1 µL of template DNA (5 ng µL−1), 5 µL of SYBR Green Pro Taq HS Premix (Accurate Biotechnology, China), and 0.3–1.2 µL of each primer (10 µM). Negative controls were included in each plate by replacing the template DNA with sterile H2O. Standard curves were prepared by ten-fold serial dilutions of target gene-carrying plasmids. The amplification efficiency was 87 %–88 % for nosZII and 90 %–102 % for other genes.
2.7 Statistical analysis
Statistical tests were performed in IBM SPSS Statistics 25 (NY, USA) and OriginPro 2026 (OriginLab Corporation, MA, USA). Homoscedasticity (α=0.05) was checked with Levene's test. Significant differences between treatments (α=0.05) were tested by one-way analysis of variance (ANOVA), followed by Tukey's Honestly Significant Difference (HSD) test when data were homoscedastic or Games–Howell (GH) test when data were heteroscedastic. Spearman correlation analysis was conducted using corrplot package in R v4.5.3 (α=0.05, 0.01, or 0.001).
3.1 Influence of straw incorporation on soil fertility
Soil physicochemical characteristics were clearly affected by continuous straw incorporation at various rates for five years (Table 1). The results indicated that soil BD was negatively and significantly correlated with the rice straw incorporation rate (p<0.05), and soil pH, CEC (p<0.05), AvN, AvK (p<0.001), AvMn, AvCu, AvZn (p<0.05), TC, and TN were positively related to the straw application rate. Although most of the characteristics were not statistically significant among treatments under field conditions, when compared with CK, even the least amount of straw input (ST1) induced the decrease of BD by 2.76 % and the increases of CEC, TC, TN, AvN, Olsen P, and AvK by 3.13 %, 4.19 %, 2.58 %, 6.83 %, 15.09 %, and 38.52 %, respectively. ST1 treatment also resulted in obvious increases in soil micronutrient concentrations in comparison with CK, with the contents of AvMn, AvCu, and AvZn elevated by 18.48 %, 4.57 %, and 8.09 %, respectively. These data suggested an improving trend in soil fertility resulting from rice straw incorporation.
3.2 Influence of straw incorporation on GHG emissions and global warming potential
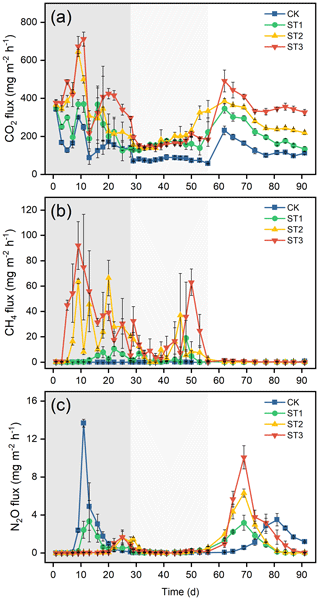
Greenhouse gas emissions were obviously influenced by straw incorporation (Fig. 1, Table 2). Generally, the CO2 flux was positively related to the straw incorporation rate throughout the incubation (Fig. 1a, Table 3). Compared to CK, ST1 caused a significant increase in the cumulative CO2 emission by 66 % (p<0.05, Table 2). With the straw amount increasing, the cumulative CO2 emissions of ST2 and ST3 treatments rose to 2.2 and 2.5 times those of CK (p<0.05), respectively. A significant difference was also detected between ST2 and ST3 (p<0.05).
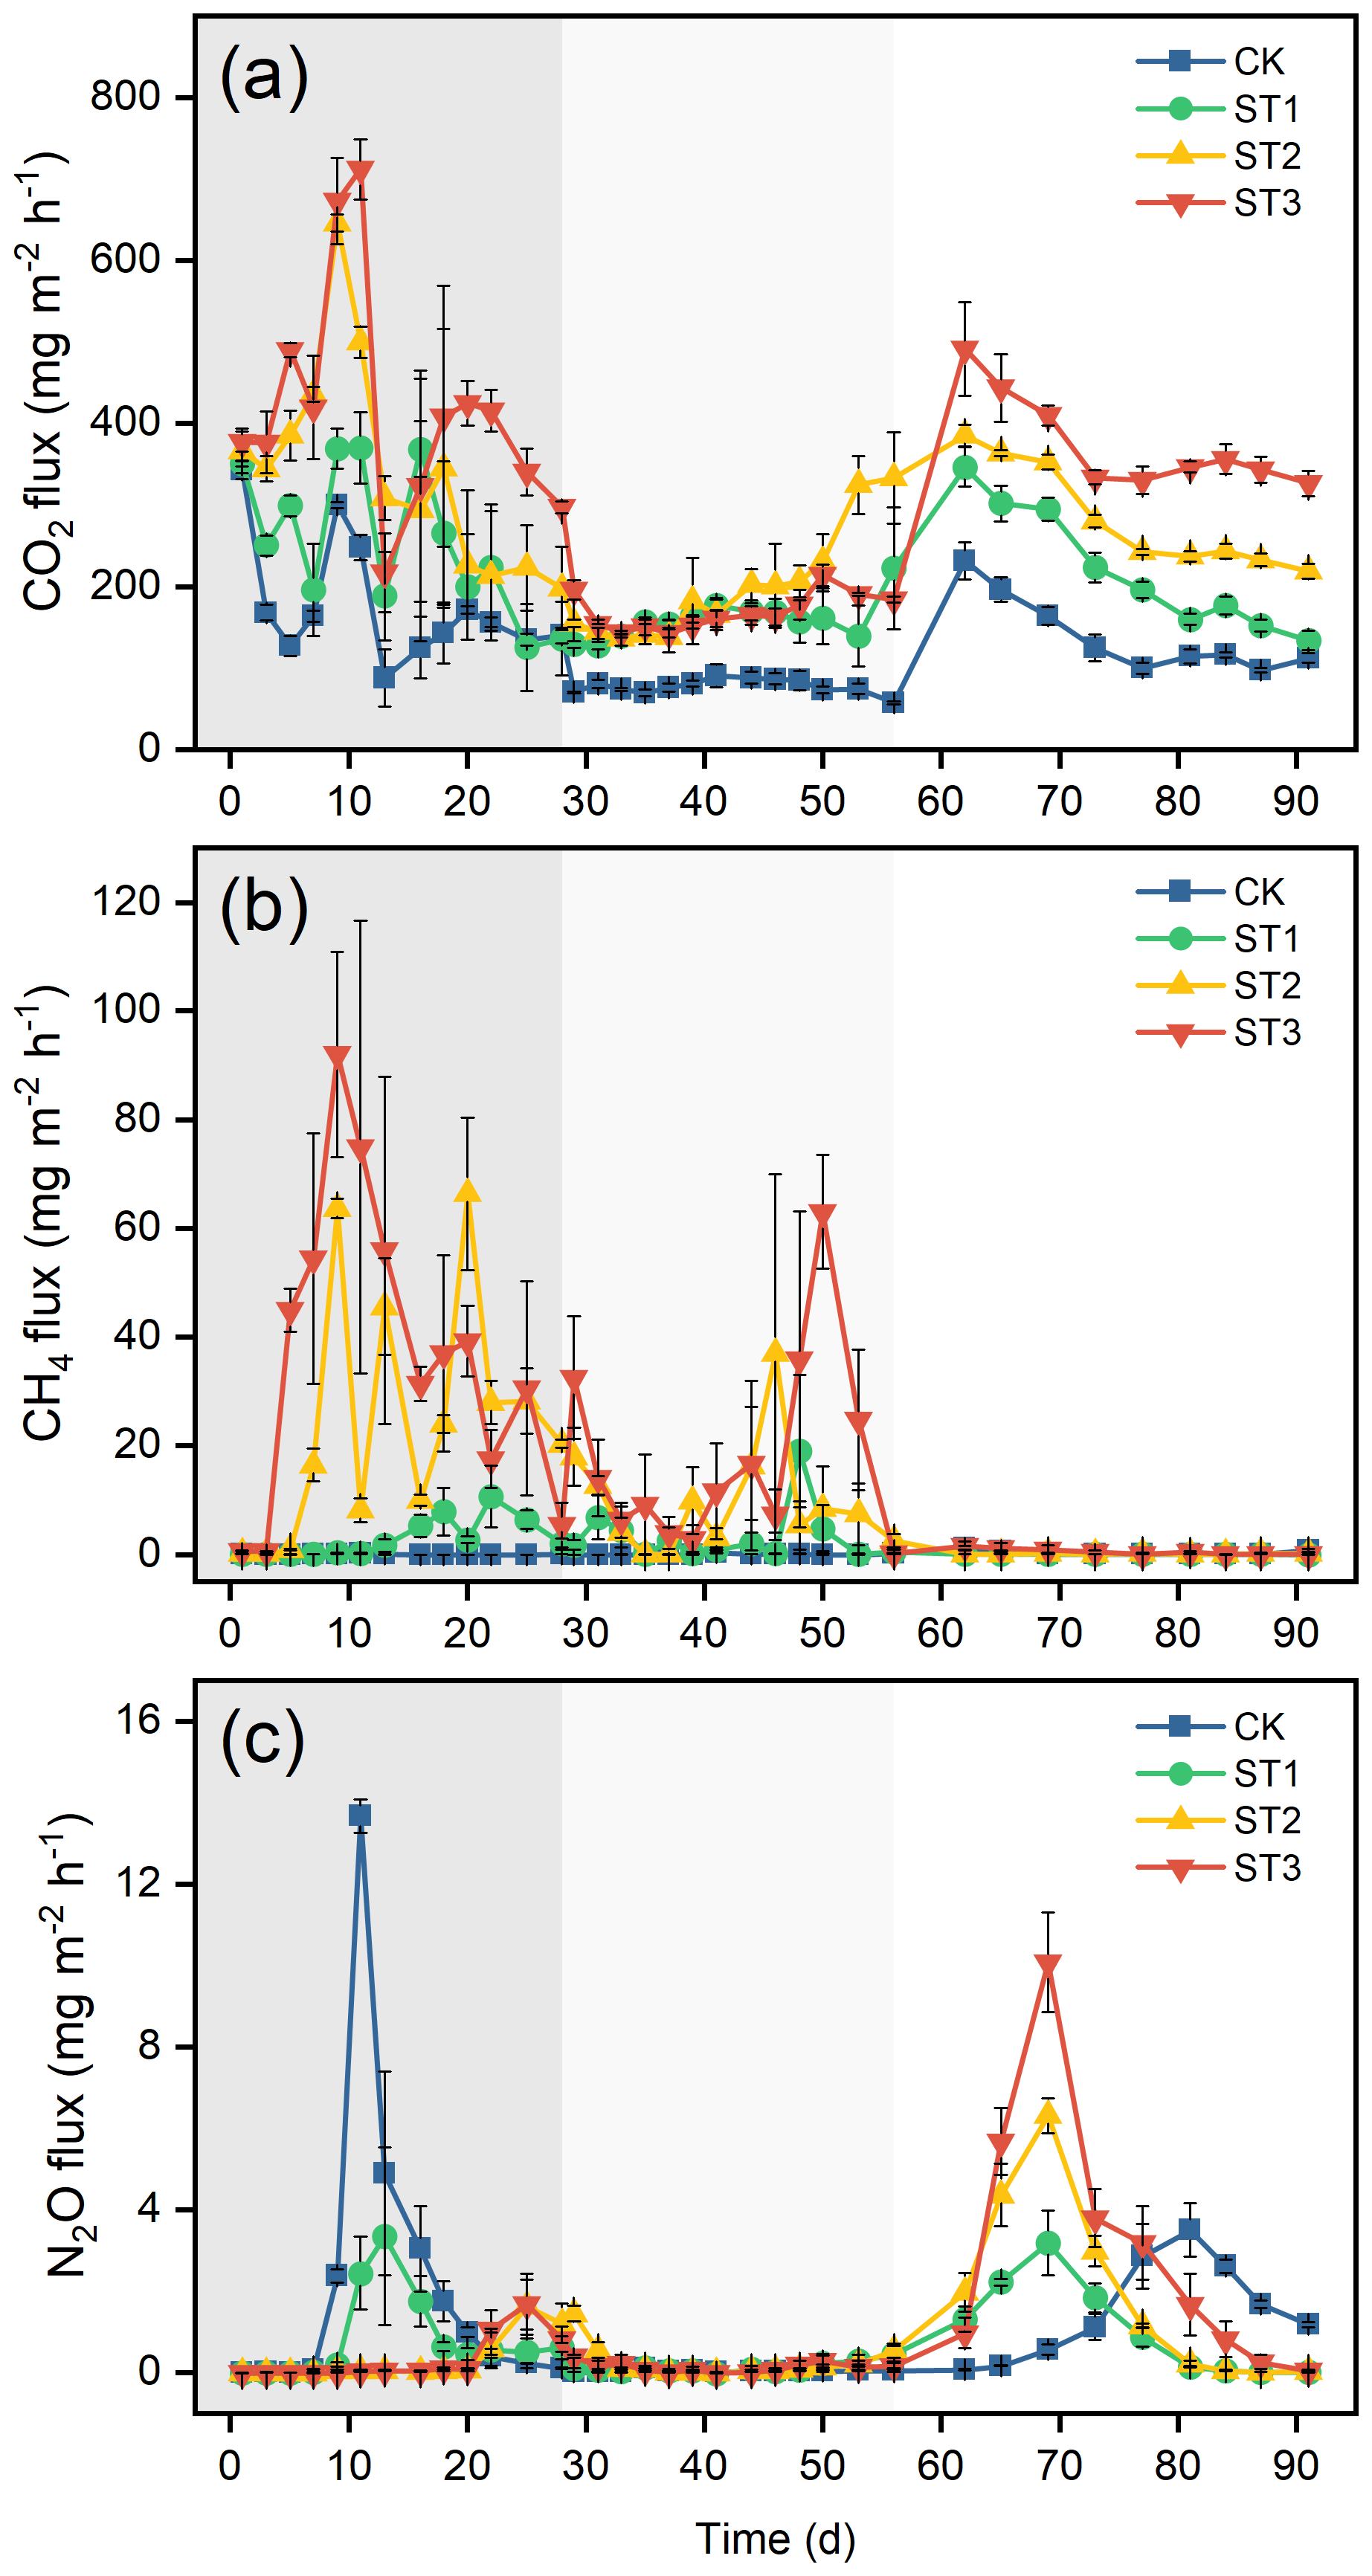
Figure 1Dynamics of GHG fluxes during the incubation. (a) CO2; (b) CH4; (c) N2O. CK, ST1, ST2, and ST3 received 0 %, 50 %, 100 %, and 150 % of the local harvested rice straw, respectively. Data are given in average ± standard error (n=3). Grey, lighter grey, and white areas indicate the flooding, the early drained, and the late drained period, respectively.
Table 2Cumulative emissions and global warming potential.
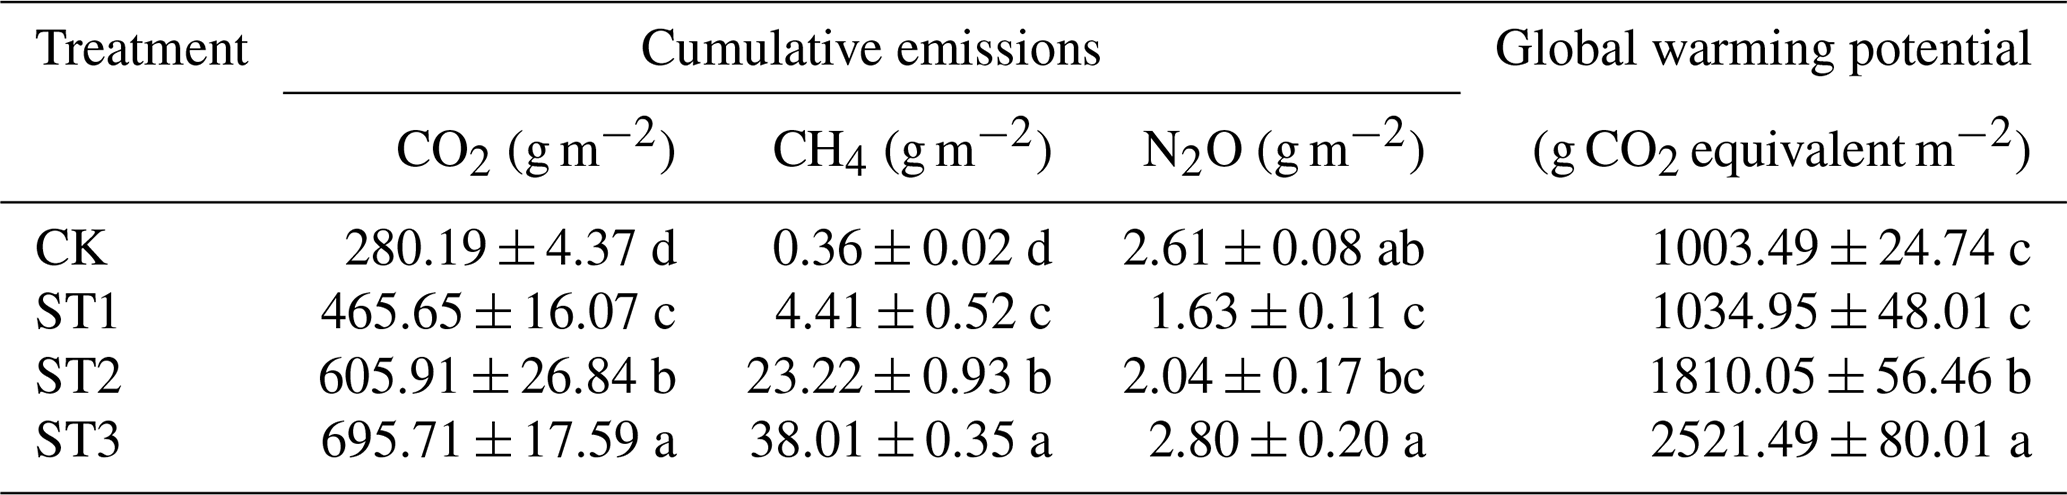
CK, ST1, ST2, and ST3 received 0 %, 50 %, 100 %, and 150 % of the local harvested rice straw, respectively. Different lower-case letters indicate significant differences between treatments (α=0.05). Data are given in average ± standard error (n=3).
Table 3Spearman correlation between straw rate, cumulative GHG emissions, and microbial gene abundances.

CO2, CH4, and N2O represent the corresponding cumulative emissions. Significant values are shown in bold. * α=0.05; α=0.01; α=0.001.
The CH4 fluxes occurred mainly during flooding (day 0–day 28), and partly during the transition time from flooding to drying (day 29–day 56, Fig. 1b, Table S2). It was observed that CK emitted minimal CH4, while ST1 emitted a slightly higher CH4 than CK. Further increasing the straw rate induced significant elevations of CH4 fluxes. The more straw input, the more CH4 was emitted. The cumulative CH4 emission of ST1 was only 4.41 g m−2, while the cumulative CH4 emissions of ST2 and ST3 were approximately 4 and 8 times higher than those of ST1 (p<0.05), respectively, reaching about 23 and 38 g m−2 (Table 2).
The dynamics of N2O emission exhibited two distinct types of peaks, with one type peaking as early as day 11 after fertilization and the other during the late drying period (Fig. 1c). However, the variation patterns of the two peaks differed markedly both among treatments and between periods. During the first peak, CK emitted most N2O, followed by ST1, while the N2O emitted from ST2 and ST3 were negligible. However, this order reversed in the latter drying period, where the highest N2O flux was from ST3, followed by ST2, whereas the N2O fluxes of ST1 and CK were similarly low, despite that the peak of CK appeared about 10 d late. The cumulative N2O emission indicated that ST1 emitted significantly lower N2O than CK (p<0.05) with only 1.63 g m−2 (Table 2). Meanwhile, ST2 also generated about 22 % lower N2O than CK, while the treatment receiving the highest amount of straw (ST3) possessed a similar cumulative N2O emission to CK.
Overall, ST1 displayed a slightly higher GWP than CK without a significant difference, but both ST2 and ST3 showed significantly higher GWPs than CK (p<0.05).
3.3 Dynamics of CO2, CH4, and N2O concentrations in soils
The soil concentrations of the three GHGs were deeply affected by the amendments of rice straw but exhibited distinct patterns (Fig. 2). Straw incorporation boosted the soil CO2 concentration compared to the continuously declining CK, with the peaking time of straw–amended treatments occurring around 10 d of the incubation (Fig. 2a). The outstanding characteristic was that the increases were proportional to the straw incorporation rates. For example, at the peak, the increments in ST1, ST2, and ST3 relative to CK were approximately 50 %, 100 %, and 150 %, respectively.
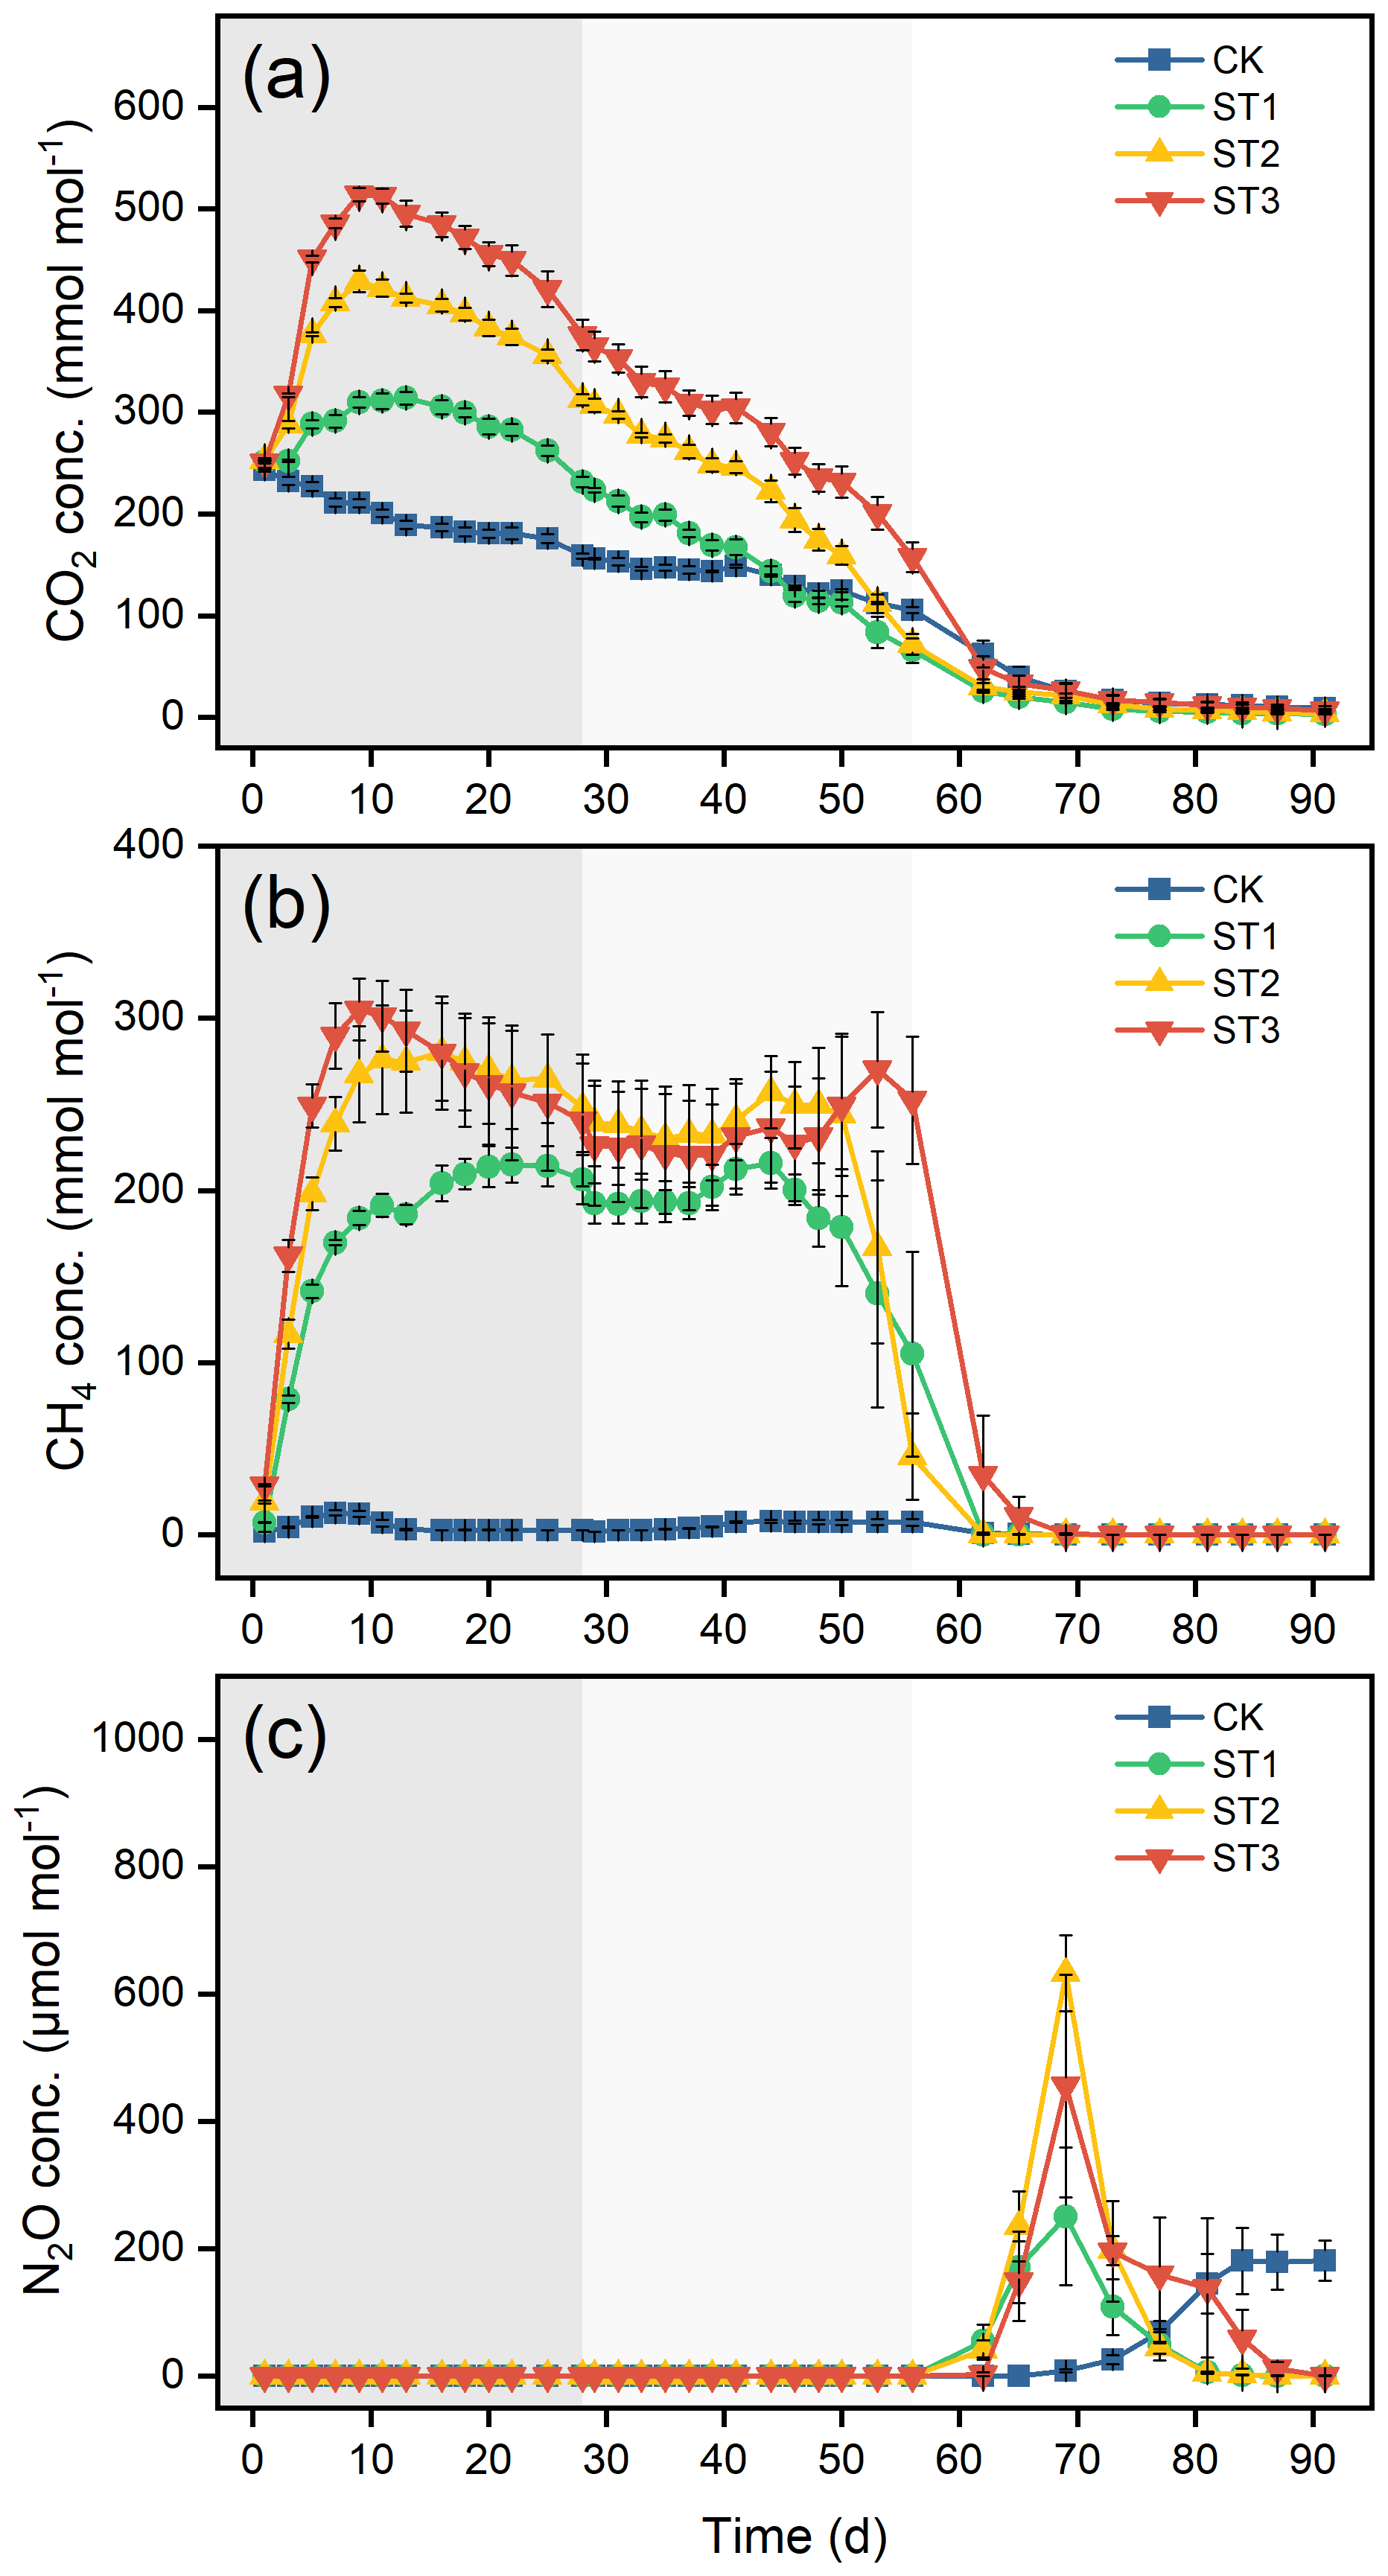
Figure 2Dynamics of GHG concentrations in soils during the incubation. (a) CO2; (b) CH4; (c) N2O. CK, ST1, ST2, and ST3 received 0 %, 50 %, 100 %, and 150 % of the local harvested rice straw, respectively. The abbreviation conc. means concentration. Data are given in average ± standard error (n=3). Grey, lighter grey, and white areas indicate the flooding, the early drained, and the late drained period, respectively.
The soil CH4 concentrations indicated that straw incorporation resulted in sharp increases since day 3 (Fig. 2b). On average, the CH4 concentrations of ST1, ST2, and ST3 were about 45, 57, and 58 times that of CK between day 1 and day 56. It was also observed that the CH4 concentrations of ST1 fluctuated around 200 mmol mol−1. ST2 and ST3 further promoted soil CH4 concentrations but there was no obvious differences between them.
The soil N2O concentrations were only detectable between days 62 and 87 under drying phase (Fig. 2c). The unique feature was that the N2O contents of CK and ST1 were quite similar despite the peaking time in CK was delayed. It was observed that the N2O concentration of ST2 was almost two times that of ST1. Although the peak of ST3 was not as high as that of ST2, ST3 maintained high N2O concentrations for longer in the soil.
3.4 Variations in microbial abundance
3.4.1 The abundance of bacteria and fungi
Across the six sampling days, the average copy numbers of 16S rRNA were 3.92×10¹², 4.50×10¹², 4.76×10¹², and 5.71×10¹² per g dry soil for CK, ST1, ST2, and ST3, respectively (Fig. 3). The corresponding values for 18S rRNA were 2.04 × 10⁹, 2.78 × 10⁹, 3.03 × 10⁹, and 3.63 × 10⁹ per g dry soil, respectively. The bacterial and fungal population sizes exhibited similar temporal dynamics during the incubation. They were obviously affected by straw incorporation on day 14 under flooding, when ST2 and ST3 induced significantly higher abundances of bacteria and fungi than CK (p<0.05), but no significant differences were detected between ST1 and CK. Afterwards, the populations of bacteria and fungi fluctuated among treatments until day 56 during the early drained phase, on which the influence of straw incorporation on the microbial abundances appeared again and ST3 showed significantly higher population sizes of bacteria and fungi than CK (p<0.05). During the late drained period on days 70 and 84, this influence continued, where ST3 possessed significantly larger bacterial populations than CK (p<0.05), and the three straw–amended treatments resulted in significantly higher fungal abundances than CK (p<0.05).
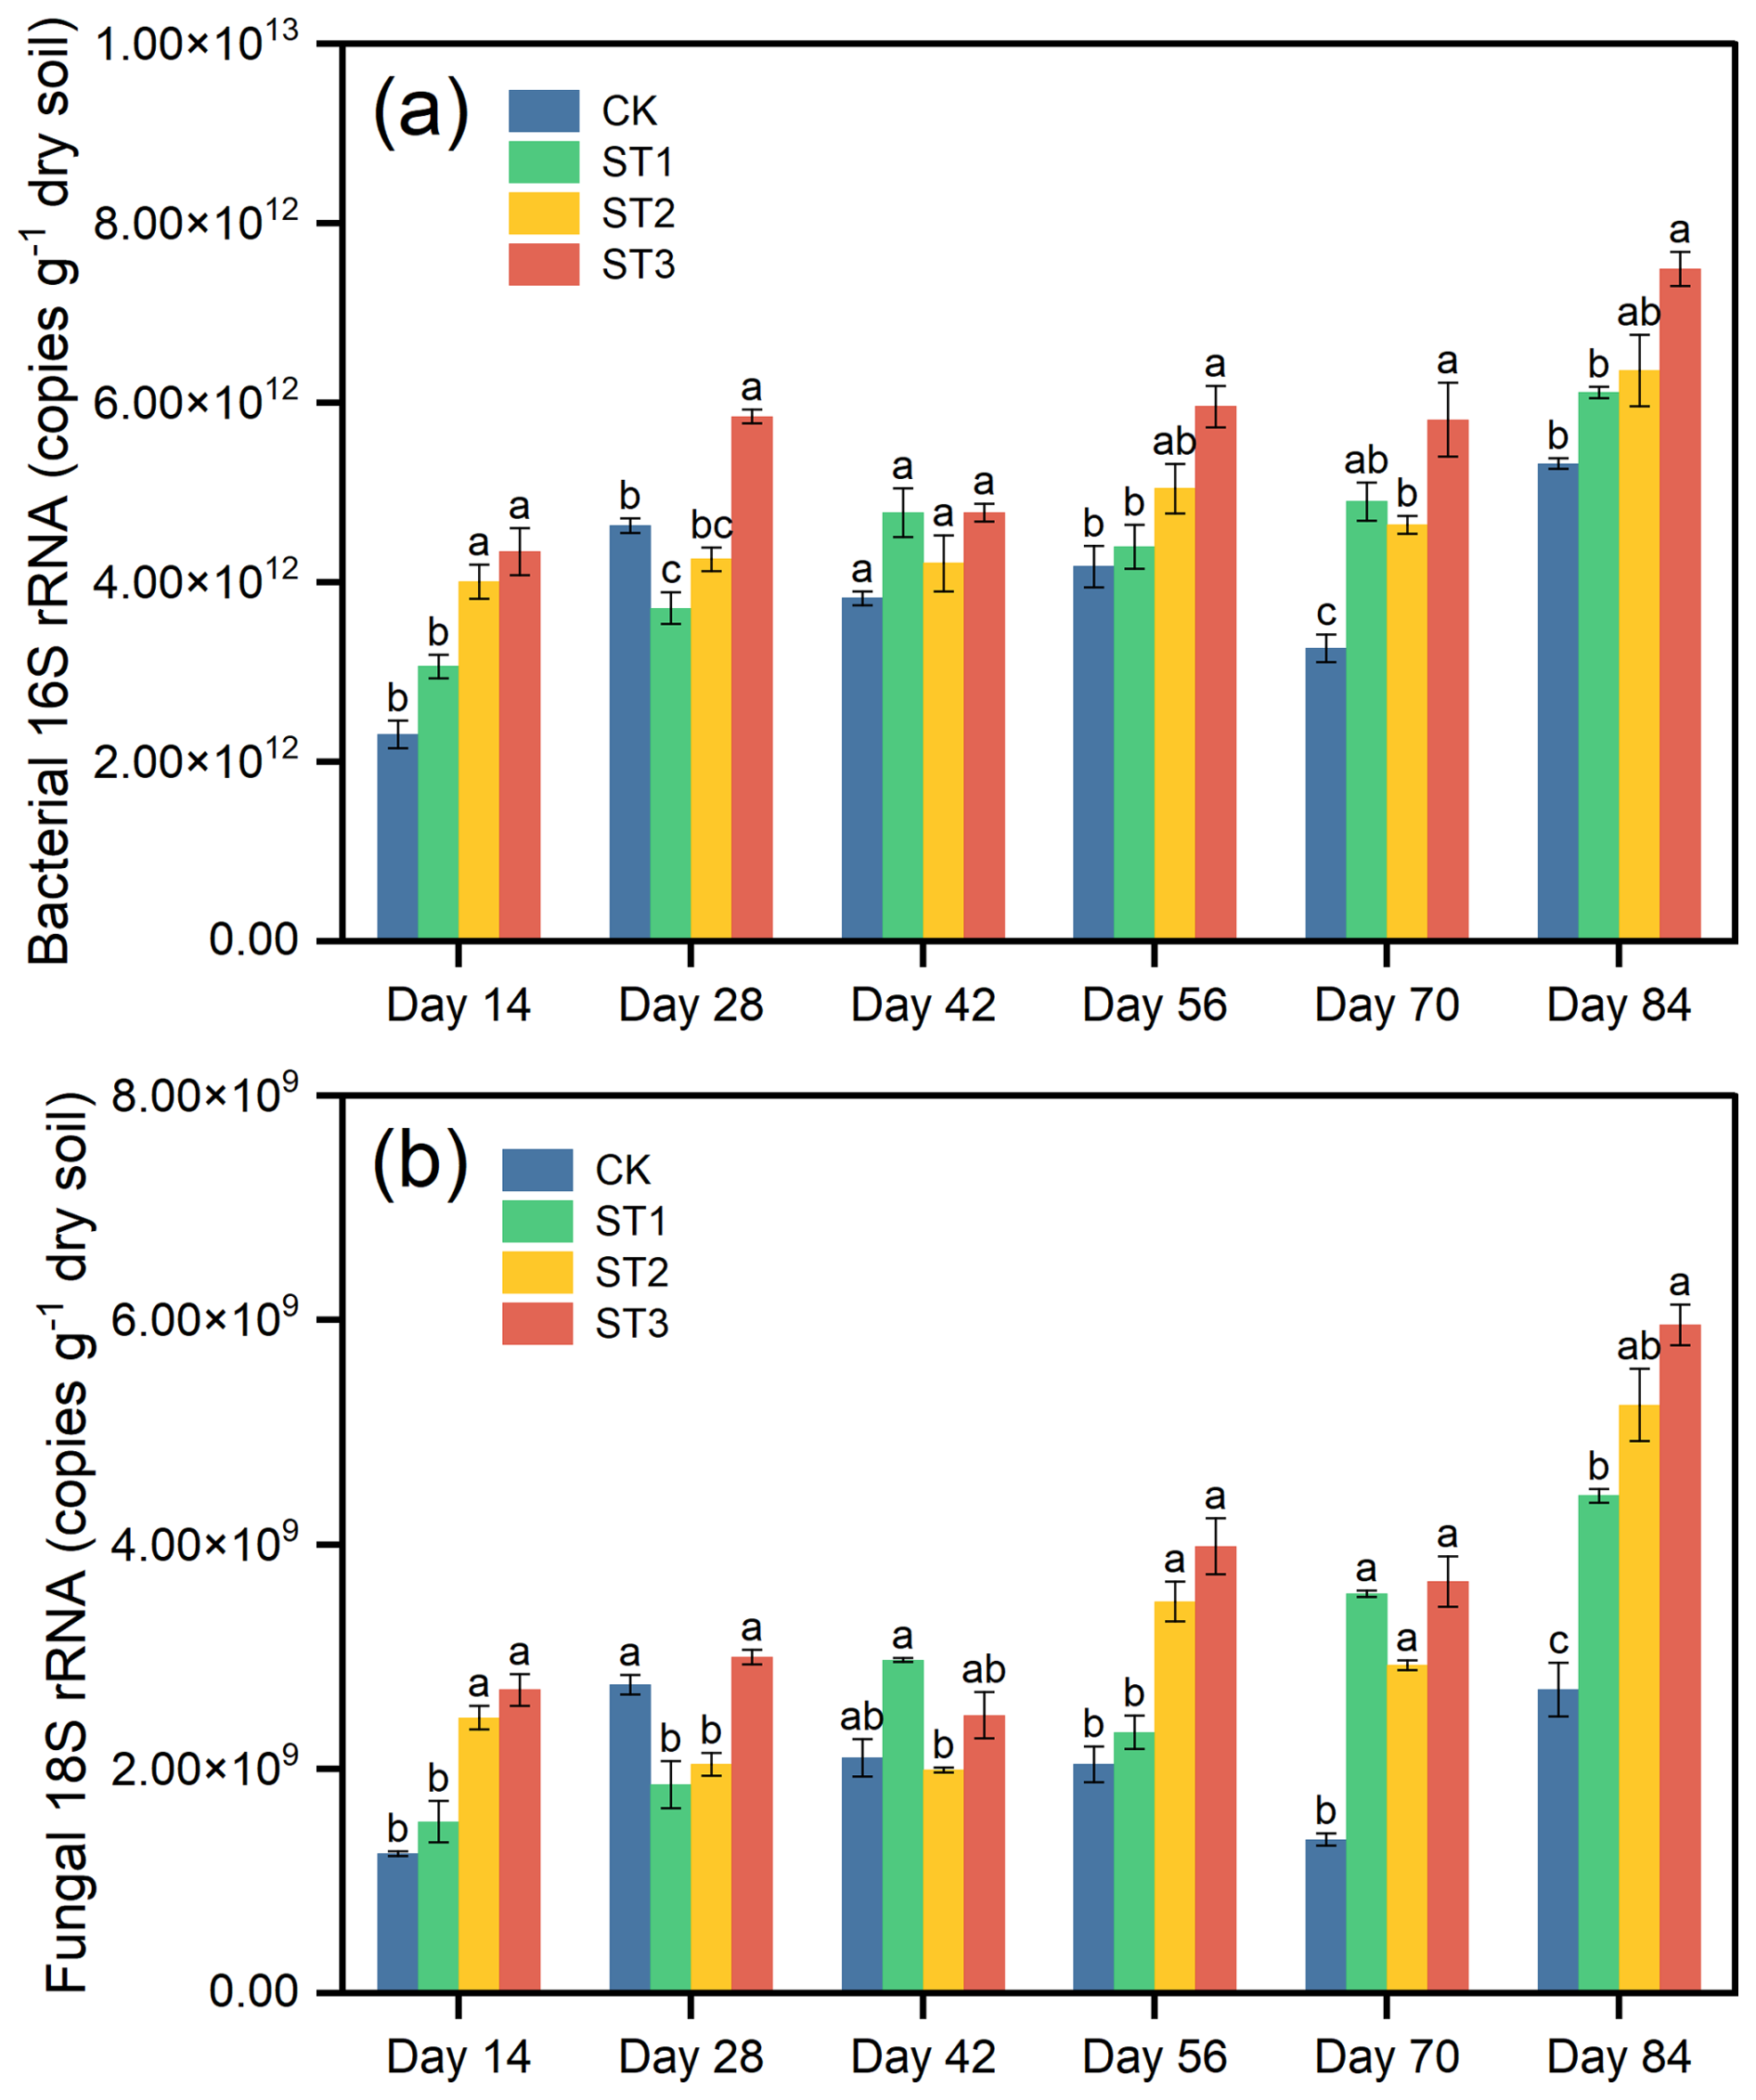
Figure 3Dynamics of bacterial 16S rRNA abundance (a) and fungal 18S rRNA abundance (b) during the incubation. CK, ST1, ST2, and ST3 received 0 %, 50 %, 100 %, and 150 % of the local harvested rice straw, respectively. Different lower-case letters denote significant differences between treatments (α=0.05). Data are given in average ± standard error (n=3). Days 14 and 28 correspond to the flooding period, days 42 and 56 to the early drained period, and days 70 and 84 to the late drained period, respectively.
3.4.2 The abundance of methanogens and methanotrophs
The copy number of mcrA was markedly affected by straw incorporation and positively related to the straw input rate (Fig. 4a, Table 3). The average mcrA abundance during the CH4 fluxing period between day 14 and day 56 was significantly and positively related to the straw input rate. In comparison with CK, the least average increase occurred in ST1 with 32 %, while the highest happened in ST3 with 129 %.
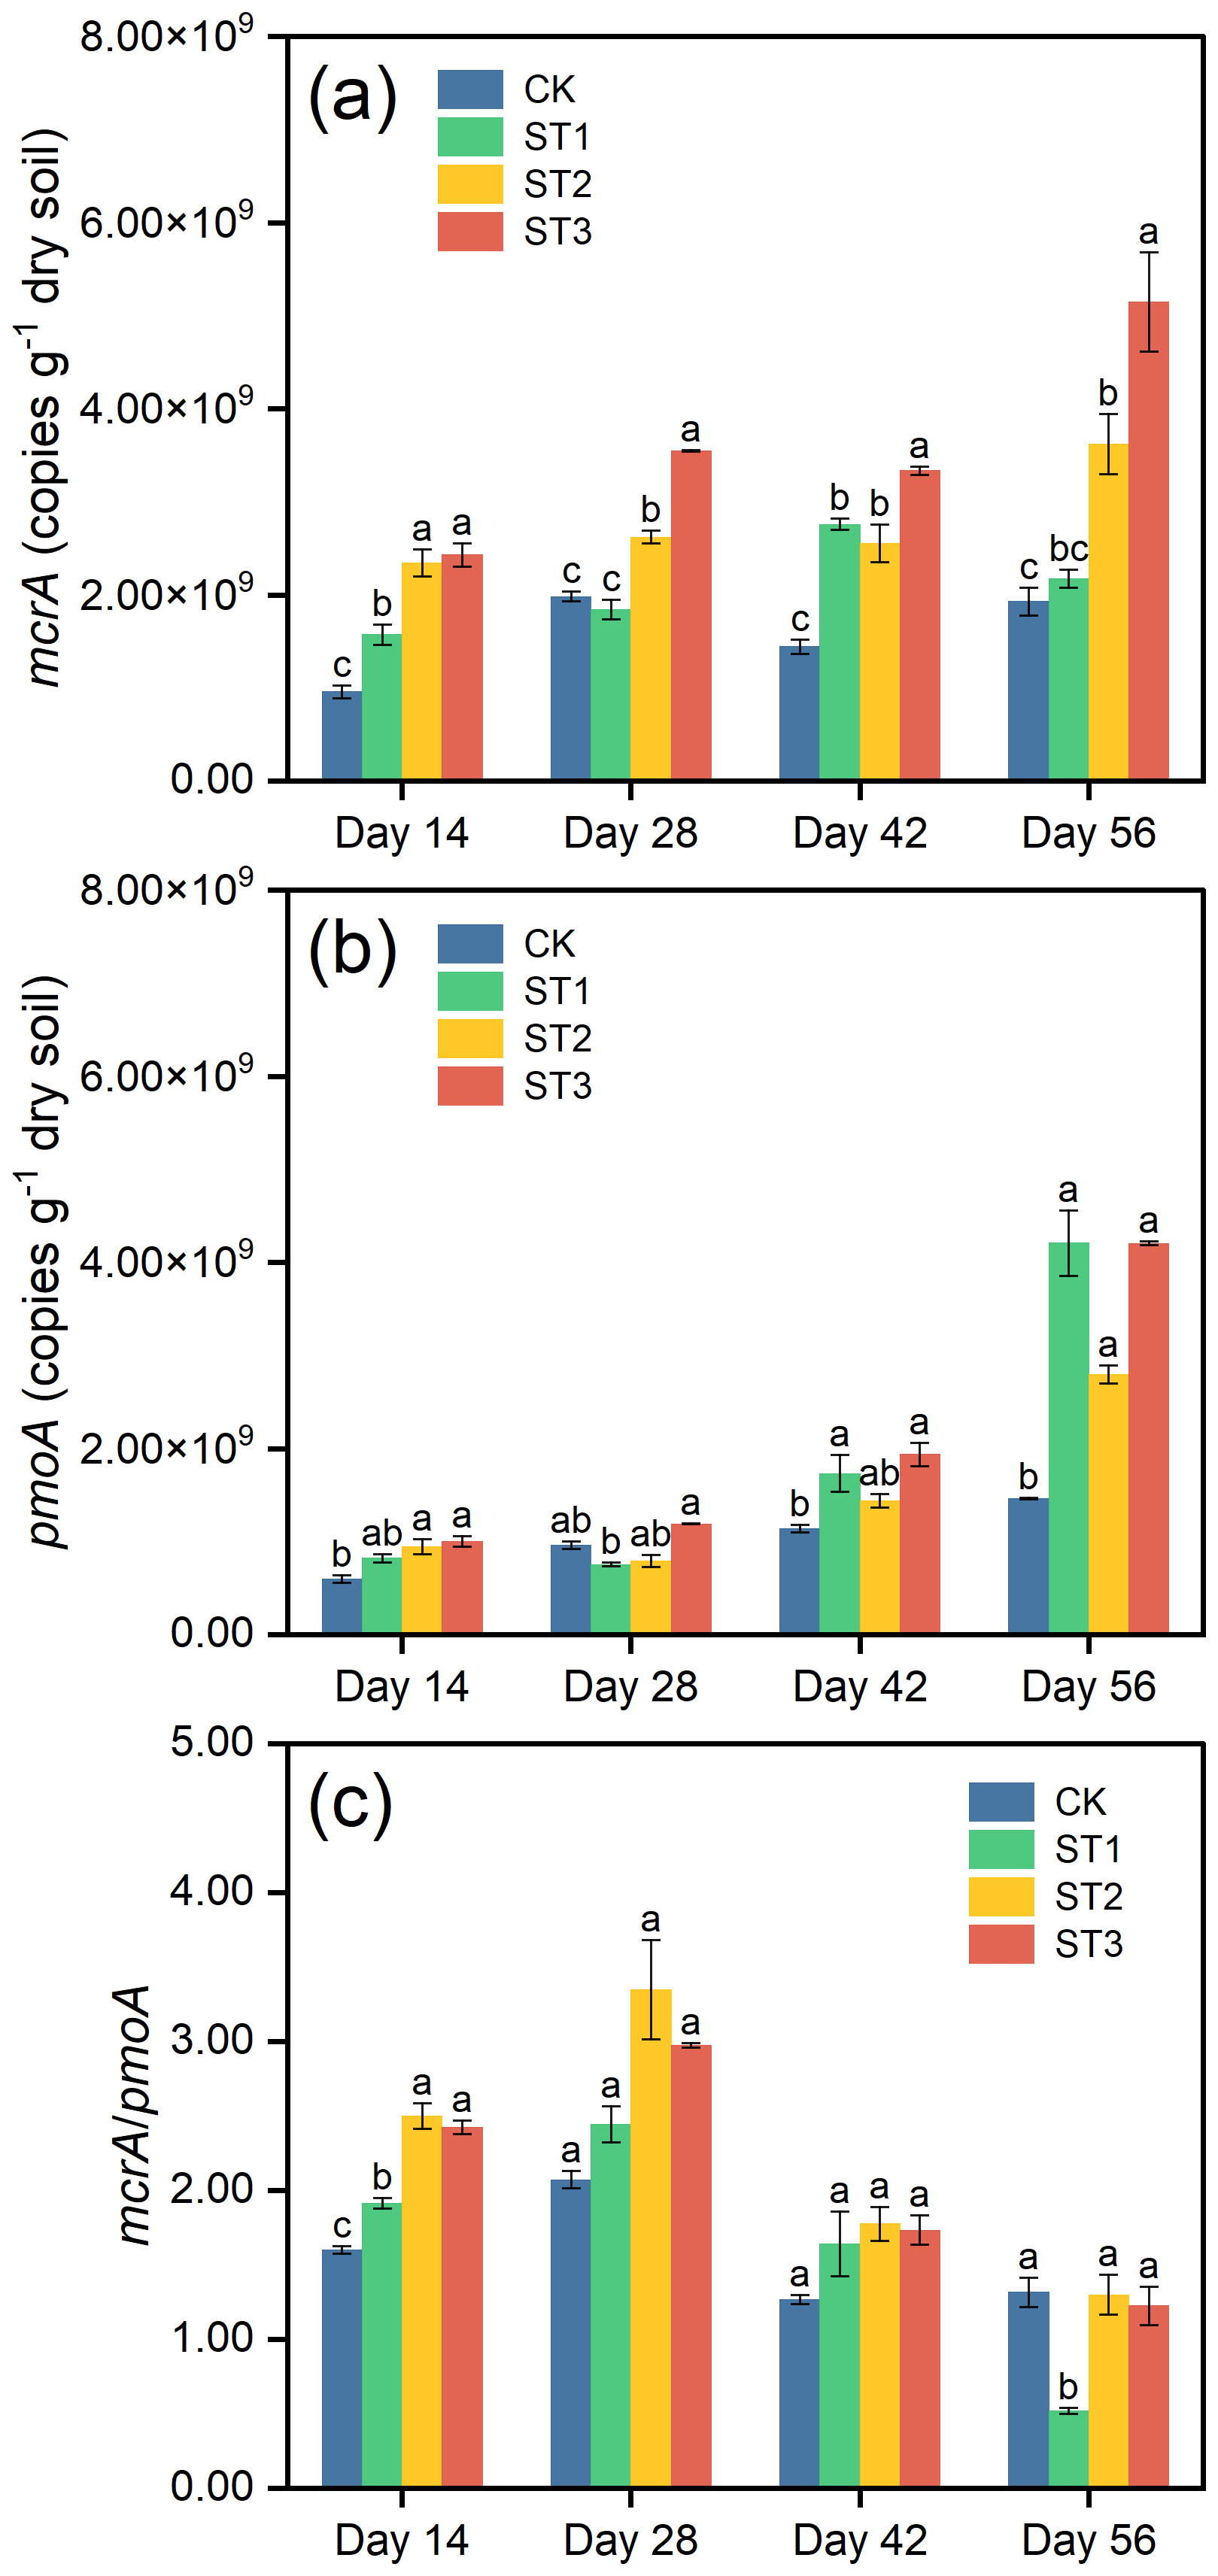
Figure 4Dynamics of mcrA abundance (a), pmoA abundance (b), and mcrA pmoA ratio (c) during the CH4 fluxing period. CK, ST1, ST2, and ST3 received 0 %, 50 %, 100 %, and 150 % of the local harvested rice straw, respectively. Different lower-case letters denote significant differences between treatments (α=0.05). Data are given in average ± standard error (n=3). Days 14 and 28 correspond to the flooding period, and days 42 and 56 to the early drained period, respectively.
For pmoA, although straw incorporation also clearly promoted its copy number, the treatment with the lowest amount of straw (ST1) induced a substantial increase in methanotrophs compared to CK by approximately 81 % on average between day 14 and day 56 (Fig. 4b). Further increasing the straw amount failed to cause significant elevations in comparison with ST1.
When concerning mcrA pmoA, the average ratio of ST1 between day 14 and day 56 was quite similar to that of CK, while the ratios of ST2 and ST3 were much higher than that of CK (Fig. 4c).
3.4.3 The abundance of N2O-producing and N2O-reducing communities
The population size of nirS was relatively stable, and the variations among treatments were negligible under flooding (Fig. 5a). In contrast, under drying, the copy number of nirS increased and was clearly affected by straw incorporation. All the straw–amended treatments outstandingly increased nirS abundance compared to CK. Among the treatments, ST3 possessed the highest nirS copy numbers, while ST2 and ST1 had similarly lower abundances. By comparison, the abundances of nirK declined after drainage and were less affected by straw incorporation (Fig. S2a) than those of nirS (except ST3).
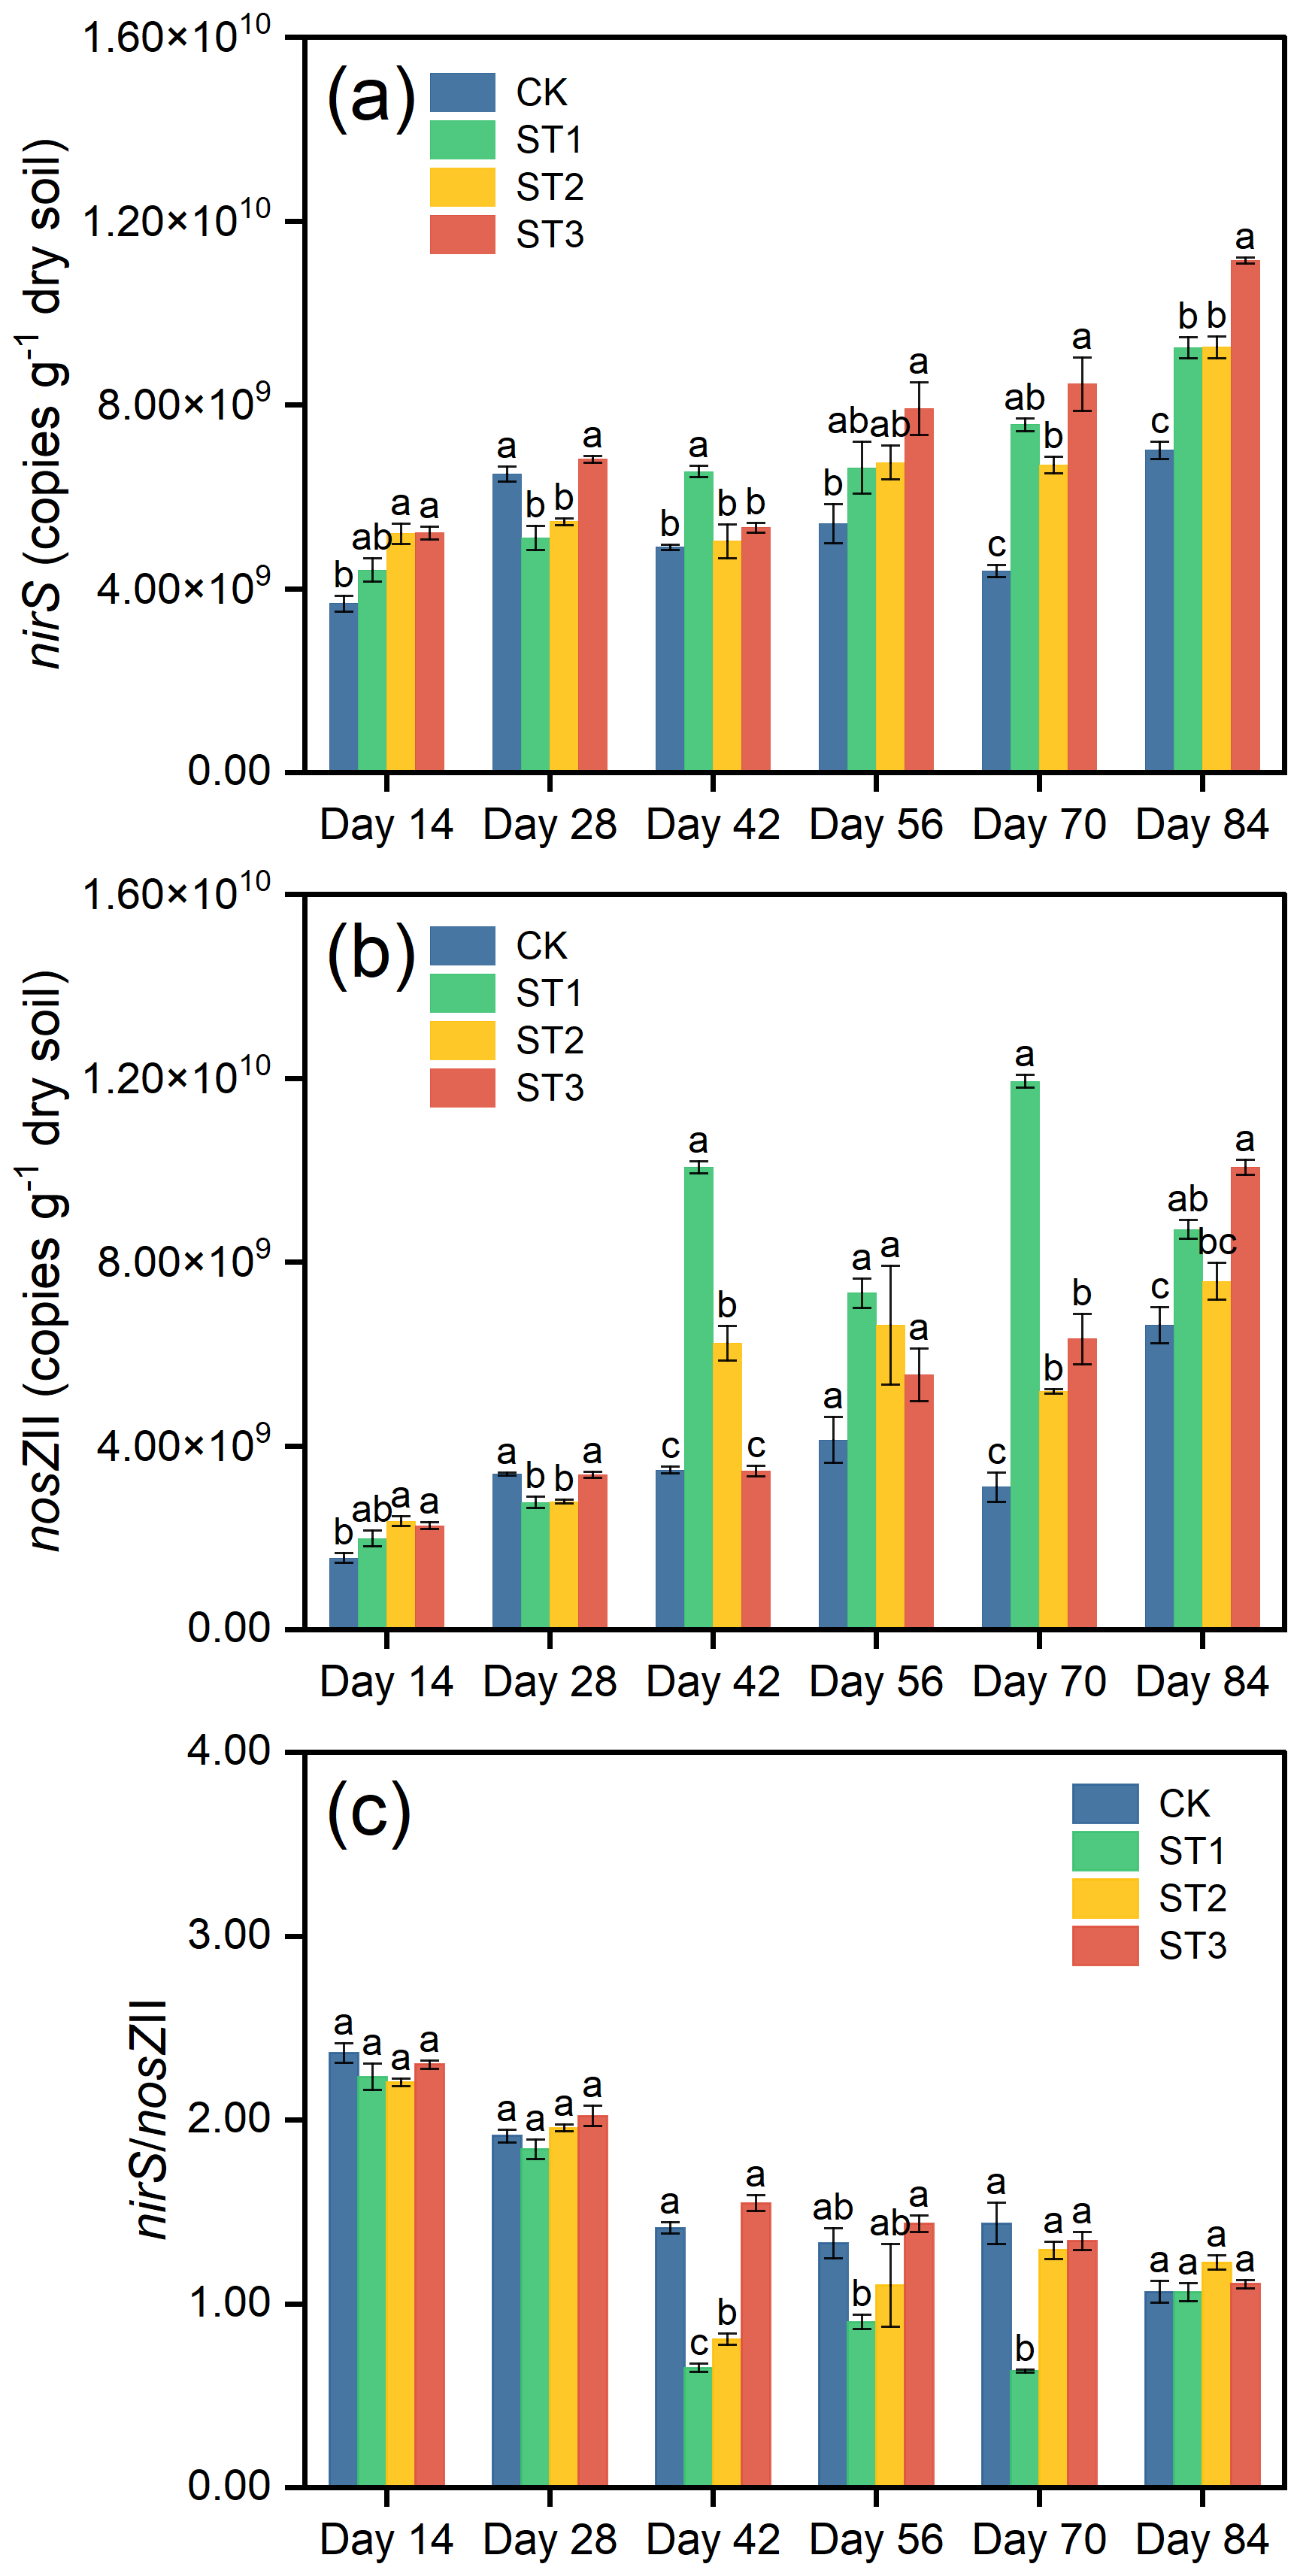
Figure 5Dynamics of nirS abundance (a), nosZ II abundance (b), and nirS nosZII ratio (c) during the incubation. CK, ST1, ST2, and ST3 received 0 %, 50 %, 100 %, and 150 % of the local harvested rice straw, respectively. Different lower-case letters denote significant differences between treatments (α=0.05). Data are given in average ± standard error (n=3). Days 14 and 28 correspond to the flooding period, days 42 and 56 to the early drained period, and days 70 and 84 to the late drained period, respectively.
In general, the dynamics of nosZII abundance during the incubation were similar to those of nirS abundance (Fig. 5b). Interestingly, the abundance of nosZII in ST1 was the highest, which was higher than the second highest treatment (ST3) during drying, especially during the peaking time of N2O flux on day 70. In contrast, the abundance differences in nosZI among treatments (Fig. S2b) were far less pronounced than those in nosZII.
When concerning the abundance ratio of nirS nosZII during drying, ST1 displayed the lowest average ratio of 0.81, while the average ratios of other treatments were higher, ranging from 1.11 to 1.36 (Fig. 5c).
Rice straw is an important organic resource and has been used to improve soil productivity (Huo et al., 2024; Zhou et al., 2024), which was also observed in this study. Since rice straw return may also exacerbate GHG emissions from paddy fields (Shi et al., 2023; He et al., 2024), which could offset the benefits of rice straw returning to paddy systems, it is urgent to investigate the feasibility of straw incorporation in relation to soil fertility improvement and GHG emission control. Soil fertility is the capability of soil to continuously supply water, nutrients, air, and suitable thermal conditions for plant growth, which can be reflected by soil physical, chemical, and microbial characteristics (Theresa et al., 2026). We found that soil BD was negatively related to the straw incorporation rate, and soil CEC and soil available nutrient concentrations were positively related to the rate. The results strongly suggested that five-year rice straw incorporation improved soil fertility by increasing soil aeration, soil cation holding capacity, and nutrient supply ability, consistent with previous studies (Xing et al., 2025). In this study, the least amount of straw incorporation (ST1) generated the lowest GWP among straw–amended treatments. If this treatment can also lead to the elevation of soil fertility, it would support our hypothesis. The results showed that although the soil physicochemical properties of ST1 were not significantly different from those of CK, an improving trend in soil fertility was evident from the decreased BD and increased soil nutrient contents, and this trend was supported by ST2 and ST3 treatments. More importantly, ST1 treatment did not cause a significant increase in GWP compared to CK. It was observed that the cumulative CO2 and CH4 emissions of ST1 were significantly higher than those of CK, but the cumulative N2O emission was significantly lower. Since the warming potentials over a 100-year horizon of CO2, CH4, and N2O are 1, 27.9, and 273, respectively (Forster et al., 2021), the major contributor to the low GWP under ST1 would be the significantly lower N2O emission. The interesting point is why this happened.
It was detected that the CO2 fluxes were positively related to the straw incorporation rate, and the higher input induced the higher CO2 emission. Among straw–amended treatments, ST1 generated the lowest cumulative CO2 emission, which was about 1.7 times of CK. This would be linked to the small amount of organic substrate for the soil microbial communities and the limited growth of microbial population (Miller et al., 2008; Li et al., 2022). Although the CO2 emission of ST1 increased significantly compared to CK, its SOC content rose simultaneously, indicating this rate of straw returning was beneficial for the elevation of SOC.
We detected two N2O flux peaks during the incubation: one occurred after N fertilization under flooding and the other appeared within drying, which were consistent with other studies (Zhou et al., 2020b; Senbayram et al., 2022; Li et al., 2025b). We found that only CK emitted considerable N2O while the emissions from straw–amended treatments were markedly lower at the first peak. This would be partially due to the competition of soil microorganisms for soil available N. Generally, organic materials incorporated into paddy soil will stimulate mass propagation of soil microorganisms, and these fast reproducing microbial communities will compete for soil free N as their nutrient (Cucu et al., 2014; L'Espérance et al., 2024; Zhang et al., 2025). On the contrary, the N fertilizer in CK could be an available N source for nitrification and denitrification, leading to a substanial N2O emission. However, during drying, oxygen continuously penetrated the soil profile, and abundant available N was released mainly through the mineralization of soil organic matter (Chiriac et al., 2025). Organic matter also contributed more electron donors to denitrification when the soil moisture declined (Yi et al., 2022). These means if a soil contains higher SOC, it would produce more mineral N as the substrate and provide more electron donors for N2O production and reduction (Yi et al., 2022; Chiriac et al., 2025). Although ST1 contained slightly higher SOC than CK, there was no clear difference in N2O fluxes between them during drying. The reasons would be as follows. N2O emission largely relies on N2O production ability and consumption activity, which are driven by the related functional microorganisms (Hu et al., 2015; He et al., 2025). Among these microorganisms, the denitrifiers of nirS-type and nosZII-type communities were indicated as the more active microbial groups in paddy soils (Jones et al., 2013; Wei et al., 2015; Jin et al., 2020; Chen et al., 2024; Yang et al., 2024). Among all treatments, ST1 contained a relatively low abundance of nirS and the highest nosZII copy number, as well as the lowest nirS nosZII ratio. These results strongly suggested that ST1 would possess relatively low N2O production but high N2O transformation activities. As a result, the N2O emission from ST1 was significantly lower than that from CK.
Applying organic materials to paddy fields often intensified CH4 flux from soils (Han et al., 2023; Song et al., 2024; Qin et al., 2025). Similar results were also observed in this study, and the CH4 emission was significantly and positively related to the straw input rate. Interestingly, the cumulative CH4 emission from ST1 treatment remained low, whereas ST2 and ST3 sharply elevated the emissions to about 5 and 9 times that of ST1, respectively. CH4 emission depends on CH4 production and consumption, which are driven by methanogens and methanotrophs (Conrad, 2020; Nwokolo and Enebe, 2025). The population size of mcrA in ST1 was clearly higher than that in CK but significantly lower than ST2 and ST3, indicating that the CH4 production capacity of ST1 would be higher than that of CK but lower than the treatments receiving higher amounts of straw. Another important aspect in determining CH4 flux is the soil CH4 consumption capability (Conrad, 2020; Nwokolo and Enebe, 2025). Soil CH4 consumption would be strongly linked to soil CH4 holding capacity (Ariani et al., 2022), as the retained CH4 can be oxidized by methanotrophs. Once CH4 producing ability is over the soil CH4 holding capacity, the extra CH4 would be emitted into the atmosphere. We observed that the soil CH4 holding capacity was about 190 mmol mol−1 under the anaerobic environment, and below this level CH4 emission was almost undetectable. It was detected that the CH4 concentrations of ST2 and ST3 were clearly over the holding capacity, and CH4 emissions notably occurred. In contrast, the soil CH4 concentrations of ST1 fluctuated around 200 mmol mol−1 under anaerobic conditions, leading to the minimal CH4 emission among straw–amended treatments. Moreover, the microbial gene abundances in this study were at the higher end of the ranges reported in the literature (Ma et al., 2012; Zhou et al., 2020b; Wang et al., 2022; Yi et al., 2024; Cai et al., 2025; Zheng et al., 2026). This could be attributed to the differences in soil properties among studies and to straw incorporation that provided substrates for microbial growth.
In general, rice straw incorporation could improve soil nutrient supply ability for crops and simultaneously intensify GHG emissions. However, we revealed that when the straw was incorporated at a suitable amount, i.e., 50 % of the local rice straw yield, GHG emissions remained at low levels that did not cause a significant increase in GWP compared to CK, and soil fertility was well maintained. The major contributors to this consequence were strongly linked to the highest nosZII copy number and the lowest nirS nosZII ratio, resulting in a significantly lower N2O cumulative emission than CK. The CH4 producing ability under ST1 fluctuated around the soil CH4 holding capacity, leading to most of the produced CH4 being consumed by methanotrophs in soil and minimal CH4 being emitted into the atmosphere. These findings offer scientific guidance for rational straw use, sustainable rice farming, and eco-friendly paddy management. Because different soils possess various soil properties, their CH4 holding capacities and nitrogen transformation processes would be different. Therefore, the field tests with different soil types are necessary.
Due to the intellectual property and data management policies of the university and affiliated research institute, the data are available from the corresponding author upon reasonable request.
The supplement related to this article is available online at https://doi.org/10.5194/soil-12-871-2026-supplement.
MZ: Conceptualization, Data Curation, Formal analysis, Investigation, Methodology, Validation, Visualization, Writing – Original Draft, Writing – Review & Editing. RL: Data Curation, Formal analysis. WZ: Conceptualization, Resources, Supervision, Writing – Review & Editing. CF: Resources. SGC and AT: Writing – Review & Editing. BZ: Conceptualization, Resources, Supervision, Writing – Review & Editing. WW: Conceptualization, Methodology, Resources, Supervision, Validation, Writing – Original Draft, Writing – Review & Editing. RS: Conceptualization, Funding acquisition, Resources, Supervision, Writing – Original Draft, Writing – Review & Editing.
The contact author has declared that none of the authors has any competing interests.
Publisher's note: Copernicus Publications remains neutral with regard to jurisdictional claims made in the text, published maps, institutional affiliations, or any other geographical representation in this paper. The authors bear the ultimate responsibility for providing appropriate place names. Views expressed in the text are those of the authors and do not necessarily reflect the views of the publisher.
We thank Xingan Fu and Xiaohua Yang from Taoyuan Agroecosystem Research Station for their help in soil and gas sampling. We thank Laurent Philippot from INRAE, France for his constructive suggestions in paper writing.
This work was supported by the International Partnership Program of Chinese Academy of Sciences (grant no. 092GJHZ2022057FN), and the Training Program for Outstanding Youth of Changsha (grant no. kq2306030). Simon Guerrero-Cruz received support from the NXPO Thailand under PMU-B, through the European and SE Asia joint funding scheme (JFS-2021-100: Micro-GRICE).
This paper was edited by Ping He and reviewed by Abel Veloso and two anonymous referees.
Ariani, M., Hanudin, E., and Haryono, E.: The effect of contrasting soil textures on the efficiency of alternate wetting-drying to reduce water use and global warming potential, Agr. Water Manage., 274, 107970, https://doi.org/10.1016/j.agwat.2022.107970, 2022.
Bao, S.: Soil and Agricultural Chemistry Analysis, Beijing, China, China Agriculture Press, ISBN 978-7-109-06644-1, 2000.
Cai, Y., Liu, Z., Zhang, S., Liu, H., Nicol, G. W., and Chen, Z.: Microbial community structure is stratified at the millimeter-scale across the soil–water interface, ISME Commun., 2, 53, https://doi.org/10.1038/s43705-022-00138-z, 2022.
Cai, Y., Zhang, H., Hu, X., Yang, Y., Hazard, C., Nicol, G. W., He, J., Shen, J., He, Z., Zhang, L., Zhang, J., Liu, H., Zhang, S., and Chen, Z.: Millimeter-scale niche differentiation of N-cycling microorganisms across the soil-water interface has implications for N2O emissions from wetlands, ISME J., 19, wraf062, https://doi.org/10.1093/ismejo/wraf062, 2025.
Chen, D., Wang, C., Shen, J., Li, Y., and Wu, J.: Response of CH4 emissions to straw and biochar applications in double-rice cropping systems: Insights from observations and modeling, Environ. Pollut., 235, 95–103, https://doi.org/10.1016/j.envpol.2017.12.041, 2018.
Chen, K., Feng, J., Bodelier, P. L. E., Yang, Z., Huang, Q., Delgado-Baquerizo, M., Cai, P., Tan, W., and Liu, Y.: Metabolic coupling between soil aerobic methanotrophs and denitrifiers in rice paddy fields, Nat. Commun., 15, 3471, https://doi.org/10.1038/s41467-024-47827-y, 2024.
Chen, P., Xu, J., Wang, K., Zhang, Z., Zhou, Z., Li, Y., Li, T., Nie, T., Wei, Q., and Liao, L.: Straw return combined with water-saving irrigation increases microbial necromass accumulation by accelerating microbial growth-turnover in Mollisols of paddy fields, Geoderma, 454, 117211, https://doi.org/10.1016/j.geoderma.2025.117211, 2025.
Chen, Z., Luo, X., Hu, R., Wu, M., Wu, J., and Wei, W.: Impact of long-term fertilization on the composition of denitrifier communities based on nitrite reductase analyses in a paddy soil, Microb. Ecol., 60, 850–861, https://doi.org/10.1007/s00248-010-9700-z, 2010.
Chiriac, O. P., Pittarello, M., Moretti, B., and Zavattaro, L.: Factors influencing nitrogen derived from soil organic matter mineralisation: Results from a long-term experiment, Agr. Ecosyst. Environ., 381, 109444, https://doi.org/10.1016/j.agee.2024.109444, 2025.
Conrad, R.: Methane production in soil environments – Anaerobic biogeochemistry and microbial life between flooding and desiccation, Microorganisms, 8, 881, https://doi.org/10.3390/microorganisms8060881, 2020.
Cucu, M. A., Said-Pullicino, D., Maurino, V., Bonifacio, E., Romani, M., and Celi, L.: Influence of redox conditions and rice straw incorporation on nitrogen availability in fertilized paddy soils, Biol. Fertil. Soils, 50, 755–764, https://doi.org/10.1007/s00374-013-0893-4, 2014.
FAO: FAOSTAT Database, https://www.fao.org/faostat/en/#data/GT/visualize (last access: 16 October 2023), 2020.
Forster, P., Storelvmo, T., Armour, K., Collins, W., Dufresne, J.-L., Frame, D., Lunt, D., Mauritsen, T., Palmer, M., Watanabe, M., Wild, M., and Zhang, H.: Chapter 7: The Earth's Energy Budget, Climate Feedbacks, and Climate Sensitivity. Climate Change 2021: The Physical Science Basis. Contribution of Working Group I to the Sixth Assessment Report of the Intergovernmental Panel on Climate Change, UK, USA, https://doi.org/10.1017/9781009157896.009, 2021.
Gao, D., Sheng, R., Whiteley, A. S., Moreira-Grez, B., Qin, H., Zhang, W., Zhan, Y., and Wei, W.: Effect of phosphorus amendments on rice rhizospheric methanogens and methanotrophs in a phosphorus deficient soil, Geoderma, 368, 114312, https://doi.org/10.1016/j.geoderma.2020.114312, 2020.
Hallin, S., Philippot, L., Löffler, F. E., Sanford, R. A., and Jones, C. M.: Genomics and ecology of novel N2O-reducing microorganisms, Trends Microbiol., 26, 43–55, https://doi.org/10.1016/j.tim.2017.07.003, 2018.
Han, Y., Zhang, Z., Li, T., Chen, P., Nie, T., Zhang, Z., and Du, S.: Straw return alleviates the greenhouse effect of paddy fields by increasing soil organic carbon sequestration under water-saving irrigation, Agr. Water Manage., 287, 108434, https://doi.org/10.1016/j.agwat.2023.108434, 2023.
Harun, S. N., Hanafiah, M. M., and Noor, N. M.: Rice straw utilisation for bioenergy production: A brief overview, Energies, 15, 5542, https://doi.org/10.3390/en15155542, 2022.
He, G., Wang, W., Chen, G., Xie, Y., Parks, J. M., Davin, M. E., Hettich, R. L., Konstantinidis, K. T., and Löffler, F. E.: A novel bacterial protein family that catalyses nitrous oxide reduction, Nature, 646, 152–160, https://doi.org/10.1038/s41586-025-09401-4, 2025.
He, Z., Cao, H., Qi, C., Hu, Q., Liang, J., and Li, Z.: Straw management in paddy fields can reduce greenhouse gas emissions: A global meta-analysis, Field Crops Res., 306, 109218, https://doi.org/10.1016/j.fcr.2023.109218, 2024.
Hu, H., Chen, D., and He, J.: Microbial regulation of terrestrial nitrous oxide formation: understanding the biological pathways for prediction of emission rates, FEMS Microbiol. Rev., 39, 729–749, https://doi.org/10.1093/femsre/fuv021, 2015.
Huo, R., Wang, J., Wang, K., Zhang, Y., Ren, T., Li, X., Cong, R., and Lu, J.: Long-term straw return enhanced crop yield by improving ecosystem multifunctionality and soil quality under triple rotation system: An evidence from a 15 years study, Field Crops Res., 312, 109395, https://doi.org/10.1016/j.fcr.2024.109395, 2024.
Jiang, Y., Qian, H., Huang, S., Zhang, X., Wang, L., Zhang, L., Shen, M., Xiao, X., Chen, F., Zhang, H., Lu, C., Li, C., Zhang, J., Deng, A., van Groenigen, K. J., and Zhang, W.: Acclimation of methane emissions from rice paddy fields to straw addition, Sci. Adv., 5, eaau9038, https://doi.org/10.1126/sciadv.aau9038, 2019.
Jin, W., Cao, W., Liang, F., Wen, Y., Wang, F., Dong, Z., and Song, H.: Water management impact on denitrifier community and denitrification activity in a paddy soil at different growth stages of rice, Agr. Water Manage., 241, 106354, https://doi.org/10.1016/j.agwat.2020.106354, 2020.
Jones, C. M., Graf, D. R. H., Bru, D., Philippot, L., and Hallin, S.: The unaccounted yet abundant nitrous oxide-reducing microbial community: a potential nitrous oxide sink, ISME J., 7, 417–426, https://doi.org/10.1038/ismej.2012.125, 2013.
Kong, D., Zhang, X., Yu, Q., Jin, Y., Jiang, P., Wu, S., Liu, S., and Zou, J.: Mitigation of N2O emissions in water-saving paddy fields: Evaluating organic fertilizer substitution and microbial mechanisms, J. Integr. Agr., 23, 3159–3173, https://doi.org/10.1016/j.jia.2024.03.047, 2024.
Lee, J. H., Lee, J. G., Jeong, S. T., Gwon, H. S., Kim, P. J., and Kim, G. W.: Straw recycling in rice paddy: Trade-off between greenhouse gas emission and soil carbon stock increase, Soil Till. Res., 199, 104598, https://doi.org/10.1016/j.still.2020.104598, 2020.
L'Espérance, E., Bouyoucef, L. S., Dozois, J. A., and Yergeau, E.: Tipping the plant-microbe competition for nitrogen in agricultural soils, iScience, 27, 110973, https://doi.org/10.1016/j.isci.2024.110973, 2024.
Li, R., Tian, Y., Wang, F., Sun, Y., Lin, B., Dang, Y. P., Zhao, X., Zhang, H., and Xu, Z.: Optimizing the rate of straw returning to balance trade-offs between carbon emission budget and rice yield in China, Sustain. Prod. Consump., 47, 166–177, https://doi.org/10.1016/j.spc.2024.03.026, 2024.
Li, S., Cui, Y., Xia, Z., Zhang, X., Zhu, M., Gao, Y., An, S., Yu, W., and Ma, Q.: The mechanism of the dose effect of straw on soil respiration: Evidence from enzymatic stoichiometry and functional genes, Soil Biol. Biochem., 168, 108636, https://doi.org/10.1016/j.soilbio.2022.108636, 2022.
Li, S., Nie, J., Liang, H., Zhou, G., Zhang, J., Liao, Y., Lu, Y., Tao, Y., Gao, S., and Cao, W.: Paddy fields can gain high productivity with low net global warming potential by utilizing green manure, J. Environ. Manage., 377, 124596, https://doi.org/10.1016/j.jenvman.2025.124596, 2025a.
Li, X., Wang, R., Du, Y., Han, H., Guo, S., Song, X., and Ju, X.: Significant increases in nitrous oxide emissions under simulated extreme rainfall events and straw amendments from agricultural soil, Soil Till. Res., 246, 106361, https://doi.org/10.1016/j.still.2024.106361, 2025b.
Liu, C., Zhang, W., Hou, H., Liao, R., Wei, W., and Sheng, R.: Effect of long-term land use on the nosZI- and nosZII-containing microbial communities, Appl. Soil Ecol., 189, 104961, https://doi.org/10.1016/j.apsoil.2023.104961, 2023a.
Liu, H., Sun, L., Zhou, G., Wan, L., Li, G., Chen, X., Qin, W., Lin, Y., and Liu, J.: Delayed flooding after green manure incorporation decreases methane emissions and greenhouse gas intensity in rice paddy fields, Geoderma, 462, 117528, https://doi.org/10.1016/j.geoderma.2025.117528, 2025.
Liu, L., Liu, D., Ding, X., Chen, M., and Zhang, S.: Straw incorporation and nitrogen fertilization enhance soil carbon sequestration by altering soil aggregate and microbial community composition in saline-alkali soil, Plant Soil, 341–356 https://doi.org/10.1007/s11104-023-06439-z, 2023b.
Ma, K., Conrad, R., and Lu, Y.: Responses of methanogen mcrA genes and their transcripts to an alternate dry/wet cycle of paddy field soil, Appl. Environ. Microb., 78, 445–454, https://doi.org/10.1128/AEM.06934-11, 2012.
Miller, M. N., Zebarth, B. J., Dandie, C. E., Burton, D. L., Goyer, C., and Trevors, J. T.: Crop residue influence on denitrification, N2O emissions and denitrifier community abundance in soil, Soil Biol. Biochem., 40, 2553–2562, https://doi.org/10.1016/j.soilbio.2008.06.024, 2008.
Nan, Q., Fang, C., Cheng, L., Hao, W., and Wu, W.: Elevation of NO-N from biochar amendment facilitates mitigating paddy CH4 emission stably over seven years, Environ. Pollut., 295, 118707, https://doi.org/10.1016/j.envpol.2021.118707, 2022.
Nwokolo, N. L. and Enebe, M. C.: Methane production and oxidation – A review on the pmoA and mcrA gene abundances for understanding the functional potentials of agricultural soils, Pedosphere, 35, 161–181, https://doi.org/10.1016/j.pedsph.2024.05.006, 2025.
Qin, J., Long, X., Zhou, Y., Jiang, L., and Yuan, P.: Straw incorporation mitigates methane emissions by facilitating the conversion of particulate organic carbon to mineral-associated organic carbon, Agr. Ecosyst. Environ., 393, 109780, https://doi.org/10.1016/j.agee.2025.109780, 2025.
Qin, X., Lu, Y., Wan, Y., Wang, B., Nie, J., Li, Y. E., and Liao, Y.: Rice straw application improves yield marginally and increases carbon footprint of double cropping paddy rice (Oryza sativa L.), Field Crops Res., 291, 108796, https://doi.org/10.1016/j.fcr.2022.108796, 2023.
Senbayram, M., Wei, Z., Wu, D., Shan, J., Yan, X., and Well, R.: Inhibitory effect of high nitrate on N2O reduction is offset by long moist spells in heavily N loaded arable soils, Biol. Fertil. Soils, 58, 77–90, https://doi.org/10.1007/s00374-021-01612-x, 2022.
Shen, J., Tang, H., Liu, J., Wang, C., Li, Y., Ge, T., Jones, D. L., and Wu, J.: Contrasting effects of straw and straw-derived biochar amendments on greenhouse gas emissions within double rice cropping systems, Agr. Ecosyst. Environ., 188, 264–274, https://doi.org/10.1016/j.agee.2014.03.002, 2014.
Shi, W., Fang, Y., Chang, Y., and Xie, G.: Toward sustainable utilization of crop straw: Greenhouse gas emissions and their reduction potential from 1950 to 2021 in China, Resour. Conserv. Recy., 190, 106824, https://doi.org/10.1016/j.resconrec.2022.106824, 2023.
Song, H. J., Park, S. Y., Chae, H. G., Kim, P. J., and Lee, J. G.: Benefits of organic amendments on soil C stock may be offset by increased methane flux in rice paddy field, Agr. Ecosyst. Environ., 359, 108742, https://doi.org/10.1016/j.agee.2023.108742, 2024.
Theresa, K., Vijayakumar, S., Muthukrishnan, R., and Raja, V.: Soil quality index assessment for conventional, organic and INM based rice cropping systems using key indicators as influenced by imbalanced fertilization, Frontiers in Environmental Science, 13, 1698081, https://doi.org/10.3389/fenvs.2025.1698081, 2026.
Van Hung, N., Maguyon-Detras, M. C., Migo, M. V., Quilloy, R., Balingbing, C., Chivenge, P., and Gummert, M.: Rice straw overview: Availability, properties, and management practices, in: Sustainable Rice Straw Management, edited by: Gummert, M., Hung, N. V., Chivenge, P., and Douthwaite, B., Springer International Publishing, Cham, 1–13, https://doi.org/10.1007/978-3-030-32373-8_1, 2020.
Wang, L., Sheng, R., Yang, H., Wang, Q., Zhang, W., Hou, H., Wu, J., and Wei, W.: Stimulatory effect of exogenous nitrate on soil denitrifiers and denitrifying activities in submerged paddy soil, Geoderma, 286, 64–72, https://doi.org/10.1016/j.geoderma.2016.10.023, 2017.
Wang, L., Xu, H., Liu, C., Yang, M., Zhong, J., Wang, W., Li, Z., and Li, K.: Stronger link of nosZI than nosZII to the higher total N2O consumption in anoxic paddy surface soils, Geoderma, 425, 116035, https://doi.org/10.1016/j.geoderma.2022.116035, 2022.
Wang, N., Zhao, Y., Yu, J., Xue, L., Li, H., and Yang, L.: Roles of bulk and rhizosphere denitrifying bacteria in denitrification from paddy soils under straw return condition, J. Soils Sediments, 21, 2179–2191, https://doi.org/10.1007/s11368-021-02942-x, 2021.
Wang, W., Lai, D. Y. F., Sardans, J., Wang, C., Datta, A., Pan, T., Zeng, C., Bartrons, M., and Peñuelas, J.: Rice straw incorporation affects global warming potential differently in early vs. late cropping seasons in Southeastern China, Field Crops Res., 181, 42–51, https://doi.org/10.1016/j.fcr.2015.07.007, 2015.
Wang, X., Yang, Z., Liu, X., Huang, G., Xiao, W., and Han, L.: The composition characteristics of different crop straw types and their multivariate analysis and comparison, Waste Manage., 110, 87–97, https://doi.org/10.1016/j.wasman.2020.05.018, 2020.
Wang, Y., Bai, R., Di, H., Mo, L., Han, B., Zhang, L., and He, J.: Differentiated mechanisms of biochar mitigating straw-induced greenhouse gas emissions in two contrasting paddy soils, Front. Microbiol., 9, https://doi.org/10.3389/fmicb.2018.02566, 2018.
Wei, W., Isobe, K., Nishizawa, T., Zhu, L., Shiratori, Y., Ohte, N., Koba, K., Otsuka, S., and Senoo, K.: Higher diversity and abundance of denitrifying microorganisms in environments than considered previously, ISME J., 9, 1954–1965, https://doi.org/10.1038/ismej.2015.9, 2015.
Xing, Y., Xie, Y., and Wang, X.: Enhancing soil health through balanced fertilization: a pathway to sustainable agriculture and food security, Front. Microbiol., 16, 1536524, https://doi.org/10.3389/fmicb.2025.1536524, 2025.
Yang, L., Li, S., Shangguan, H., Qiao, Z., Huang, X., Zhou, S., Li, H., Su, X., Sun, X., Zhu, Y., and Yang, X.: Diversity and activity of soil N2O-reducing bacteria shaped by urbanization, Environ. Sci. Technol., 58, 17295–17303, https://doi.org/10.1021/acs.est.4c01750, 2024.
Yang, Y., Shen, L., Zhao, X., Shan, J., Wang, S., Zhou, W., Liu, J., Liu, X., Tian, M., Yang, W., Jin, J., and Wu, H.: Long-term incorporation of wheat straw changes the methane oxidation potential, abundance and community composition of methanotrophs in a paddy ecosystem, Appl. Soil Ecol., 173, 104384, https://doi.org/10.1016/j.apsoil.2021.104384, 2022.
Yi, L., Sheng, R., Wei, W., Zhu, B., and Zhang, W.: Differential contributions of electron donors to denitrification in the flooding-drying process of a paddy soil, Appl. Soil Ecol., 177, 104527, https://doi.org/10.1016/j.apsoil.2022.104527, 2022.
Yi, T., Deshun, X., Chang, Y., Kancheng, L., Xinxin, T., Hengyu, M., Guang, C., Kai, Y., Chunmei, X., and Danying, W.: Compound Microbial Agent Improves Soil Redox Status to Reduce Methane Emissions from Paddy Fields, Rice Science, 31, 740–750, https://doi.org/10.1016/j.rsci.2024.05.002, 2024.
Yin, H., Zhao, W., Li, T., Cheng, X., and Liu, Q.: Balancing straw returning and chemical fertilizers in China: Role of straw nutrient resources, Renew. Sust. Energ. Rev., 81, 2695–2702, https://doi.org/10.1016/j.rser.2017.06.076, 2018.
Yuan, S., Linquist, B. A., Wilson, L. T., Cassman, K. G., Stuart, A. M., Pede, V., Miro, B., Saito, K., Agustiani, N., Aristya, V. E., Krisnadi, L. Y., Zanon, A. J., Heinemann, A. B., Carracelas, G., Subash, N., Brahmanand, P. S., Li, T., Peng, S., and Grassini, P.: Sustainable intensification for a larger global rice bowl, Nat. Commun., 12, 7163, https://doi.org/10.1038/s41467-021-27424-z, 2021.
Zhang, N., Bai, L., Wei, X., Li, T., Tang, Y., Wen, J., Peng, Z., Zhang, Y., Wang, Y., Zeng, X., and Su, S.: Effects of organic material addition on carbon cycling and soil fertility in paddy soil, J. Environ. Manage., 379, 124898, https://doi.org/10.1016/j.jenvman.2025.124898, 2025.
Zheng, S., Xia, Y., Qiao, H., Liu, J., Jia, F., Zhang, M., Yuan, H., Zhang, Y., He, X., Wu, J., Su, Y., and Chen, X.: Patterns and geographical drivers for the abundance of CO2-assimilating bacteria, methanotrophs and CO-oxidizing bacteria in agricultural soils across eastern China, J. Integr. Agr., 25, 553–564, https://doi.org/10.1016/j.jia.2025.10.020, 2026.
Zhou, G., Gao, S., Xu, C., Dou, F., Shimizu, K., and Cao, W.: Rational utilization of leguminous green manure to mitigate methane emissions by influencing methanogenic and methanotrophic communities, Geoderma, 361, 114071, https://doi.org/10.1016/j.geoderma.2019.114071, 2020a.
Zhou, J., Tang, S., Pan, W., Liu, X., Han, K., Si, L., Ma, Q., Mao, X., Fu, H., and Wu, L.: Long-term non-flooded cultivation with straw return maintains rice yield by increasing soil pH and soil quality in acidic soil, Eur. J. Agron., 159, 127208, https://doi.org/10.1016/j.eja.2024.127208, 2024.
Zhou, W., Jones, D. L., Hu, R., Clark, I. M., and Chadwick, D. R.: Crop residue carbon-to-nitrogen ratio regulates denitrifier N2O production post flooding, Biol. Fertil. Soils, 56, 825–838, https://doi.org/10.1007/s00374-020-01462-z, 2020b.