
the Creative Commons Attribution 4.0 License.
the Creative Commons Attribution 4.0 License.
 | 27 Jul 2026
Challenges in soil carbon modelling and measurement: a decade of experimental data vs. RothC simulations in an organic olive grove
Francisco Contreras
María L. Cayuela
María Sánchez-García
Erika Ronchin
Claudio Mondini
Miguel A. Sánchez-Monedero
Modelling the persistence of soil organic carbon (SOC) is currently recognised as a key approach to enhance our understanding of its potential contribution to climate change mitigation. Despite its value, SOC modelling is challenged by soil heterogeneity and the limited availability of reliable data for model calibration and validation, often resulting in discrepancies between simulated and measured SOC dynamics. This study employs a modified version of the RothC model, adapted for amended soils, to simulate soil C dynamics under an 11-year experiment in an organic olive grove. The experiment evaluated four treatments of soil amendment: Compost, Biochar, a Mixture of both, and a Control soil without amendment. By comparing the SOC data simulated by the RothC model with experimental field-sampling data, we assessed the model's accuracy in estimating SOC accumulation and stability in the soil. Both field measurements and RothC simulations consistently identified Biochar as the most effective amendment for soil carbon accumulation over the 11-year period, followed by the Mixture and Compost treatments. Estimated soil carbon sequestration rates ranged from 1.67 to 2.66 Mg C ha−1 yr−1 based on field measurements and from 2.98 to 5.34 Mg C ha−1 yr−1 according to model simulations. However, treatment-dependent discrepancies were observed between modelled and field-based SOC stocks. While Compost and Mixture showed close agreement, Biochar exhibited the largest mismatch, likely due to its intrinsic properties that complicate field quantification and are not fully represented in current SOC models, posing challenges for monitoring and verification within carbon accounting frameworks.
- Article
(1388 KB) - Full-text XML
-
Supplement
(764 KB) - BibTeX
- EndNote


Soil Organic Carbon (SOC) is a fundamental component of the global biogeochemical carbon cycle and a central target for carbon management in agricultural systems (Peralta et al., 2022; Witzgall et al., 2021). Soil Carbon Sequestration (SCS) through the application of organic amendments aims to store carbon in stable organic forms within the soil, contributing to both short- and long-term carbon storage. Consequently, SCS is increasingly recognized as a potential strategy for atmospheric CO2 removal and climate change mitigation (Don et al., 2024; Lal et al., 2018; Smith et al., 2020).
Field experiments involving SOC quantification based on soil sampling and analysis have long been fundamental for evaluating SOC dynamics under different management practices. Compared with laboratory experiments, their longer-term nature provides the empirical foundation for SOC assessments worldwide, offering critical insights into carbon stabilization mechanisms, soil quality improvement, and the role of microbial activity in carbon cycling. However, the high costs associated with spatial heterogeneity and repeated sampling limit the scope of these studies, hindering their ability to represent long-term, large-scale carbon dynamics. Understanding SOC behavior, therefore, requires integrating experimental observations with process-based simulations, as each provides complementary insights into carbon turnover. This integration is particularly relevant in soils receiving exogenous organic matter (EOM), which is widely applied as an effective strategy to enhance SOC levels in agricultural systems (Dai et al., 2021; Rasmussen and Parton, 1994; Van-Camp et al., 2004). The addition of organic amendments temporarily alters soil properties and carbon stabilization mechanisms, increasing heterogeneity and challenging the accurate monitoring of SOC changes. In this context, soil carbon modelling offers a valuable complementary approach to simulate SOC dynamics beyond the spatial and temporal limitations of field measurements, enabling a more comprehensive understanding of long-term carbon processes in managed agroecosystems.
Carbon turnover modelling is an approach that simulates soil dynamics and carbon persistence over a specific time scale (Coleman et al., 1997). It serves as a powerful tool to replicate various scenarios under different land management practices, climatic conditions, soil texture characteristics, and land uses. These models are based on the decomposition of organic matter and its transformation that can lead either to the stabilisation of organic carbon in the soil or to its release into the atmosphere as CO2 (Coleman et al., 1997; Nemo et al., 2017; Stockmann et al., 2013). Several models have been successfully applied to simulate carbon turnover dynamics in soils. The most widely used C models including organic amendments are: the Rothamsted Carbon (RothC) Model (Keel et al., 2023; Mondini et al., 2017; Peltre et al., 2012a; Peralta et al., 2022; Senapati et al., 2014; Shirato et al., 2011), CENTURY (Badewa et al., 2023; Paustian et al., 1992), DAISY (Delhez et al., 2025; Peltre et al., 2016; Rydgård et al., 2024), and NCSOIL (Antil et al., 2011; Noirot-Cosson et al., 2016). In addition, microbial models such as MIMICS (Han et al., 2024) have been developed to better represent microbial-derived decomposition processes associated with organic amendments. However, these models generally require a larger number of input parameters which are difficult to obtain.
Modelling carbon turnover requires long-term validation based on experimental field data (FAO, 2019; Pulcher et al., 2022; Shirato et al., 2005). This presents a challenge, as the approach demands significant infrastructure and resources, including experimental plots, analytical equipment and the implementation of field treatments. The limited number of long-term studies comparing SOC evolution in field experiments poses a limitation for SOC assessments. This gap in research affects the ability to evaluate SOC dynamics in response to land-use changes, climate variations and the application of different amendments, highlighting the critical need for studies that integrate both field measurements and modelling approaches to improve the accuracy and applicability of SOC predictions.
The complementarity between simulated and measured carbon monitoring approaches is an increasing requirement within the accreditation framework of the voluntary carbon market (VCM). In the context of agricultural soils, various methodologies establish procedures to quantify, model, and verify changes in SOC resulting from the adoption of sustainable land management practices (Gold Standard, 2020; Verra, 2024). These protocols require independent verification and the explicit assessment of the uncertainty associated with both biogeochemical models and field measurements (Verra, 2025). Therefore, the design and establishment of a globalised and reliable monitoring, reporting and verification (MRV) platform is a necessity (Smith et al., 2020). Recent European regulatory initiatives under development (CIR-EU, 2025) aim to address persistent challenges in quantifying soil carbon accumulation by acknowledging structural limitations in conventional approaches. In particular, these frameworks seek to avoid the establishment of SOC stock baselines derived from soil sampling, recognising that soil sampling often captures spatial variability rather than true changes in soil carbon sequestration. Moreover, these regulations explicitly acknowledge that certain EOMs, such as biochar, exhibit physicochemical characteristics that prevent their accurate quantification through field-based measurements alone (Chiaramonti et al., 2026).
This study assesses the agreement between field measurements and SOC modelling in quantifying soil carbon and examines the implications of observed discrepancies for accurate carbon accounting under current regulatory frameworks. To this end, experimental SOC data from an 11-year field experiment under organic amendment application are compared with SOC estimates generated by the RothC model. The analysis assesses the model's predictive capacity and its suitability for supporting sustainable soil management and climate change mitigation strategies, while identifying key limitations and sources of uncertainty in both field-based and modelling approaches, to inform methodological improvements for more robust agronomic and environmental decision-making.
2.1 Field experiment
The experiment was conducted from 2013 to 2024 in an organically managed olive grove located in the Murcia region, in the Southeastern part of the Iberian Peninsula, Spain (Sánchez-Garcia et al., 2021).
2.1.1 Site description
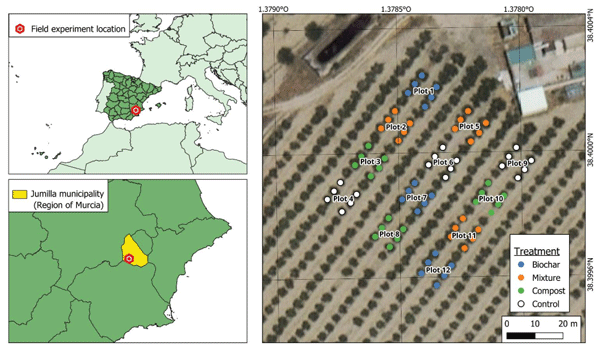
The experiment site was located in the municipality of Jumilla (1°22′ 41.9′′ W, 38°24′0.63′′ N), at an altitude of 423 m a.s.l. (Fig. 1), and with a mean slope of 1.42°. The climate is dry typically Mediterranean, classified as cold semiarid/steppe climate (BSk), according to the climatic classification Koppen-Geiger (Kottek et al., 2006), with an average annual temperature of 16.3 °C and an average annual precipitation of 263 mm per year. The orchard follows a tree density of 325 trees ha−1, with 4 m spacing between trees within the row and 7 m between rows. The soil at the experimental site is Haplic Calcisol (IUSS Working Group WRB, 2022), with a texture classified as Sandy Loam: sand content of 57 %, silt 27 % and clay 16 %. The organic C content, assumed to be the same for all plots, is 1.30 %, based on the average value measured in the control samples collected at the beginning of the experiment. The soil has an alkaline pH of 8.12.
The olive grove was established in 1997 on land previously used for low-intensity agriculture. Following plantation establishment, compost was periodically applied to promote tree growth and development before the start of the experimental trial in 2013. Based on information provided by the owner, the average annual compost input during this pre-experimental period was estimated at approximately 1.71 Mg C ha−1 yr−1, applied along the drip line to concentrate the amendment around the trees.
The olive grove has been consistently managed under certified organic practices with the application of organic amendments, primarily compost. No chemical fertilizers, herbicides or pesticides have been applied during this period. The grove is equipped with a drip irrigation system, which is only used during periods of high-water demand throughout the year. The tillage method used was minimum or reduced tillage, which involves shallow soil disturbance while avoiding soil inversion. Prior to the start of the experiment, pruning residues were chipped and partially incorporated into the soil between tree rows, while a fraction was collected and transported to the composting facility. At the beginning of the experiment, the routine application of compost was discontinued and replaced by the specific amendment treatments under evaluation (Fig. 1), while all other management practices remained unchanged throughout the study period.
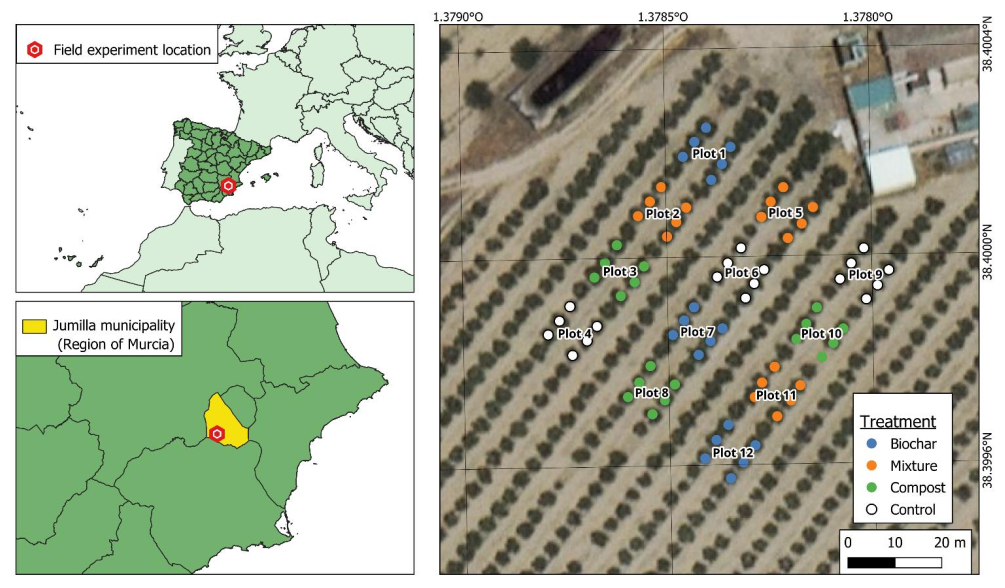
Figure 1Field experiment location, and experimental design for the treatments: Biochar, Mixture of Compost and Biochar, and Compost. Orthophoto study area: PNOA orthophoto © Instituto Geográfico Nacional (IGN-España), CC-BY 4.0.
2.1.2 Experimental design and treatment description
The field experiment follows a randomized complete block design, comprising 12 plots with four treatments replicated across three blocks to account for spatial variability across the site. The treatments included Biochar, Compost, a Mixture of 90 % compost and 10 % biochar, and a Control without addition of any amendment. Each plot contained six olive trees, with plots' perimeters separated by a single row of trees serving as a buffer (Fig. 1). The amendments were applied in the appropriate plots throughout the duration of the experiment, with a total of five applications conducted in 2013, 2015, 2017, 2021, and 2023. These applications were carried out at the end of spring in each of those years, and were applied exclusively to moist soil along the drip lines.
The amendments were applied at a rate of 20 Mg ha−1 (dry matter basis) distributed in a 1 m-wide strip along the entire tree row and manually incorporated into the soil to facilitate the homogenization of the added materials with the soil. The materials differed in their organic carbon content. Biochar had the highest organic carbon content, and two different types of biochar were used. The biochar applied during the first three amendment events was produced from oak wood feedstock and contained 67.3 % organic carbon, with an ratio of 0.32, corresponding to a carbon application rate of 13.46 Mg C ha−1. The biochar used in the fourth and fifth applications was derived from vine shoots, contained 47.5 % organic carbon, and exhibited a lower ratio of 0.21, corresponding to a carbon application rate of 9.5 Mg C ha−1. The compost was produced by on-farm windrow composting over a six-month period using two-phase olive mill waste, olive tree pruning and sheep manure; this amendment contained 35.8 % organic carbon, equivalent to a rate of 7.16 Mg C ha−1. The mixture of compost (90 %) and biochar (10 %) resulted in an application rate of 7.79 Mg C ha−1 for the first three additions and 7.39 Mg C ha−1 for the fourth and fifth additions.
2.2 Soil sampling, SOC analysis and data filtering
Soil samples were collected with a spade from the top 20 cm of soil within each experimental plot. A total of 17 sampling campaigns were conducted throughout the 11-year experimental period, except in 2018, 2019, and 2020, when no soil sampling or treatment applications took place. For each sampling date, at least four subsamples were randomly collected within the amended area along the drip lines of each plot to obtain a representative sample per plot.
Samples were air-dried, homogenized and sieved through a 2 mm mesh to remove coarse fragments. Subsequently, the fine-earth fraction was milled to a fine powder using a ball mill before SOC determination.
SOC concentration was determined by dry combustion following acid pre-treatment with 2 N HCl to remove inorganic carbon. SOC was primarily analysed using a LECO CHNS-932 elemental analyser manufactured by LECO Corporation. From 2021 onwards, a subset of samples was additionally analysed in a second laboratory using a TRUSPEC CN628 elemental analyser.
SOC data were filtered to remove outliers using the Median Absolute Deviation (MAD) method, which is a robust approach for handling extreme values and is therefore well-suited for detecting outliers in experimental datasets with limited replication (Miller and Miller, 1994). A MAD threshold of 4 was applied, such that SOC measurements showing a deviation greater than four times the MAD from the median value of the corresponding sampling date were classified as outliers and excluded from the analysis. This threshold was selected after evaluating different MAD values and their influence on data retention and the exclusion of clearly extreme observations. Given the substantial spatial variability observed under field conditions, a relatively conservative threshold was adopted to avoid excessive filtering of valid measurements. Overall, 10.58 % of the SOC observations were excluded from the analysis following the MAD filtering procedure (Table S1 in the Supplement).
Bulk density (BD) was measured at the beginning and at the end of the experiment for each plot. Results showed that BD remained stable, showing no temporal variation and no differences among treatments. Therefore, a constant BD value was assumed for SOC stock calculations. The BD value used to convert SOC concentrations to SOC stocks was 1.20 g cm−3.
SOC concentrations were converted to SOC stocks using the following equation (Eq. 1):
where SOC (Mg ha−1) is the soil organic carbon stock; SOC (g 100 g−1) is the soil organic carbon concentration; BD (g cm−3) is the bulk density (constant value of 1.20 g cm−3); and Depth (cm) corresponds to the sampling depth of the field experiment (20 cm).
For the analysis of soil carbon sequestration, the final SOC stock was defined as the average of the last three field sampling dates, collected over a one-year period spanning late 2023 and the first half of 2024. This reference period was used to reduce short-term variability in SOC measurements. The final SOC stock was calculated after applying a median absolute deviation (MAD) filter to these three measurements, thereby minimizing the uncertainty associated with reliance on a single sampling event. The remaining EOM was estimated as the difference between the final SOC stock of each amended treatment and that of the control. The fraction of added carbon remaining in the soil was calculated as the ratio between the remaining EOM and the total carbon input. The soil carbon sequestration (SCS) rate was then derived by dividing the remaining EOM by the duration of the experiment. For the comparative analysis between measured and modelled SOC, data from the first five months following amendment application were excluded to avoid potential outliers and to minimise the influence of short-term disturbances and transient spatial heterogeneity immediately after amendment incorporation into the soil.
2.3 SOC Modelling
The Rothamsted Carbon Model (RothC) was used for SOC modelling in this study since it allows the addition of organic amendments to the soil (Coleman et al., 1997; Jenkinson and Rayner, 1977). RothC is a multi-compartmental model that divides organic carbon into five distinct pools. Four of these pools are active and decompose at rates defined by the standard model, referred to as kinetic decay, while one pool represents inert material that does not decompose.
The RothC model is one of the most widely used models simulating SOC trends because it requires relatively few parameters and input data. It has been successfully evaluated and optimized for a variety of ecosystems including croplands, grasslands and forests. Nevertheless, some limitations of the model were highlighted regarding semiarid areas (Farina et al., 2013) and for EOM amended soils (Mondini et al., 2017).
For the first limitation, it has been shown that in semiarid conditions unrealistically high C inputs have been required to obtain good simulations. For this reason, we used in all the simulations a modified version of the rate-modifying factor for moisture as proposed by Farina et al. (2013). It allows the soil to reach a high level of dryness reducing SOC decomposition rate, and it better represents the real conditions of the Mediterranean and semiarid soils.
Regarding EOM addition to the soil the RothC model allows for the inclusion of the amount of carbon added through organic amendments; however, the partitioning of added material into pools of different decomposability and their decomposition rates are fixed, therefore limiting its accuracy in representing the dynamics of added EOM. To overcome this limitation, a modified version of the RothC model developed by Mondini et al. (2017) was used, in which it is possible to specify the size and the decomposition rate of 3 additional EOM pools, namely decomposable (DEOM), resistant (REOM) and humified (HEOM) exogenous organic matter. This modified version operates similarly to the standard RothC model, but the additional pools allow for the simulation of the decomposition of extra materials.
2.3.1 Pools of Exogenous Organic Matter (EOM)
The EOMs were considered to be composed by two or three pools, depending on the physicochemical complexity and stability of the added material, according to Mondini et al. (2017). Biochar, for instance, is considered a relatively simple material in terms of stability, being highly stable over the long term, with a large fraction belonging to the most stable pool (Chiaramonti et al., 2024) and, a smaller fraction that decomposes more rapidly. Therefore, in this study, biochar was considered as a material composing by two pools: one more decomposable (DEOM) and a very stable resistant fraction (REOM). The readily degradable fraction (DEOM) is generally assumed to be comparable to the Decomposable Plant Material (DPM) pool in the standard RothC model, with a degradation rate of 10 yr−1 (Keel et al., 2023).
The compost was modelled as an EOM with three pools: DEOM, REOM, and HEOM. The mixture of compost and biochar was assumed to decompose independently, without interactive effects between them. The two amendments were modelled separately, and the amount of decomposed mixture at each time was obtained from the sum of decomposed biochar and compost at the same time.
2.3.2 EOM pools parameters estimation
Differently to the standard RothC, in the modified RothC for amended soil, there is the necessity to define the size and the decomposition rate of the EOM pools. This was obtained by model inversion (Mondini et al., 2017). This approach estimates the EOM pool parameters by minimizing the differences between the outputs from the RothC model simulations and experimental data on compost mineralization. The experimental data consisted in CO2 fluxes measured in incubation experiments with composts of similar composition to those applied in the field experiment (Serramiá et al., 2012). These measurements were used to estimate the partitioning factors (f) and the decomposition rates (k) of each pool via inverse modelling based on SoilR package (Sierra et al., 2012) to simulate C turnover. The details of the model inversion are explained in the Supplementary Information Text.
The compost (Co) utilized to estimate EOM pool parameters was prepared from raw materials derived from the olive and agricultural sectors, such as Two-Phase Olive Mill Waste (TPOMW), Sheep Manure, and Olive Tree Pruning (Serramiá et al., 2012), following a procedure similar to that used for the compost applied as a soil amendment in the field experiment. The compost was incubated in three contrasting soils to ensure robust estimation of partitioning and decomposition rates parameters, allowing the behaviour of the compost to be evaluated across soils with differing physicochemical properties. All soils were Mediterranean calcareous soils, with clay contents ranging from 6.5 % to 14.4 %, organic carbon contents between 0.6 % and 1.0 %, and overall low soil organic matter levels. The description of the compost and soils used for the RothC model inversion is specified in Table S2. The EOM pools parameters obtained from each soil were averaged and used in the RothC simulations.
A different parameterisation approach was adopted for the biochar treatment. Model inversion was not considered suitable for biochar because the CO2 emissions associated with biochar mineralisation were too low to achieve a reliable fit between simulated and measured decomposition curves. Therefore, for the biochar treatment, we used the methodology proposed by Leifeld et al. (2024), which estimates pool sizes and decomposition rates based on biochar thermal stability and the molar ratio. Depending on the molar ratio of each biochar, different parameter sets were applied. For biochar with = 0.21, the parameters used were: fDEOM = 0.009; fREOM = 0.991; kDEOM = 10 yr−1; kREOM = 0.0008 yr−1, whereas for biochar with = 0.32, the parameters were: fDEOM = 0.011; fREOM = 0.989; kDEOM = 10 yr−1; kREOM = 0.0008 yr−1.
2.3.3 RothC simulations
The basic inputs required by the model are climate, soil parameters and data on soil properties and soil management practices data (Peralta et al., 2022). In addition, RothC requires the specification of the initial carbon contents for each pool; therefore, to determine these initial values, RothC was run at long-term equilibrium. Model initialization is a critical step in the simulation process and a known source of uncertainty, as the size of the SOC pools cannot be directly measured (Dimassi et al., 2018). This initialization phase allows the estimation of both the steady-state (at equilibrium) pool sizes and the annual carbon inputs from plant residues. In the standard RothC, the model is run under long-term equilibrium conditions in order to estimate both the steady-state pool sizes and the annual carbon inputs from plant residues. However, in this study, a historical spin-up approach was adopted, assuming that the soil had not yet reached equilibrium under the current land use due to the land-use change (Emde et al., 2024) to the olive orchard in 1997. For the land use preceding this transition, the model was first run under equilibrium conditions for 1000 years up to 1997 to ensure stabilization of the carbon pools and inputs (Mondini et al., 2018; Peralta et al., 2022). Subsequently, the olive orchard phase was simulated using the carbon pool sizes obtained at the end of the previous phase as the starting point. In this way, the model was initialized through successive historical phases, each representing a different land-use period, and the carbon pools obtained at the end of one phase were used as the initial conditions for the next (Wiltshire et al., 2023). This procedure allowed annual carbon inputs and pool sizes to be adjusted sequentially according to the known land-use history, rather than assuming a single equilibrium state. The Fig. S1 shows the C dynamics of a historic equilibrium run with data of final pool size at equilibrium after this procedure. In addition, Table S3 shows the phases simulated in the historic equilibrium run with land management data and EOM-C additions. Subsequently, “forward” simulations were carried out to simulate the real field experiment conditions.
The climate data were obtained by the weather station located at 3.9 km from the experimental site, the weather station is “Cañada del Judío” (JU12) and extracted by the SIAM platform (Sistema de Información Agrario de Murcia, 2025). The climate parameters extracted were: average temperature, monthly accumulated precipitation, and monthly evapotranspiration (Allen et al., 1998; Peralta et al., 2022). The amount of irrigated water was 250 mm yr−1 and it was applied in the most water demanding months, then, in RothC simulations it was added to the precipitations data from May to October. The RothC parameter “ ratio”, which describes the quality of plant-derived inputs, was set to 0.25, a value representative of inputs from woody vegetation. A constant plant cover was assumed for the corresponding “Plant Cover” parameter.
RothC “forward” simulations were performed using the modified RothC model for amended soils. As the modified model requires carbon inputs from EOM material, the actual carbon content added with each type of amendment was included for every application and treatment, to bring the modelling closer to real-world conditions. Figure 2 shows the date of the treatment application events and SOC measurement events.
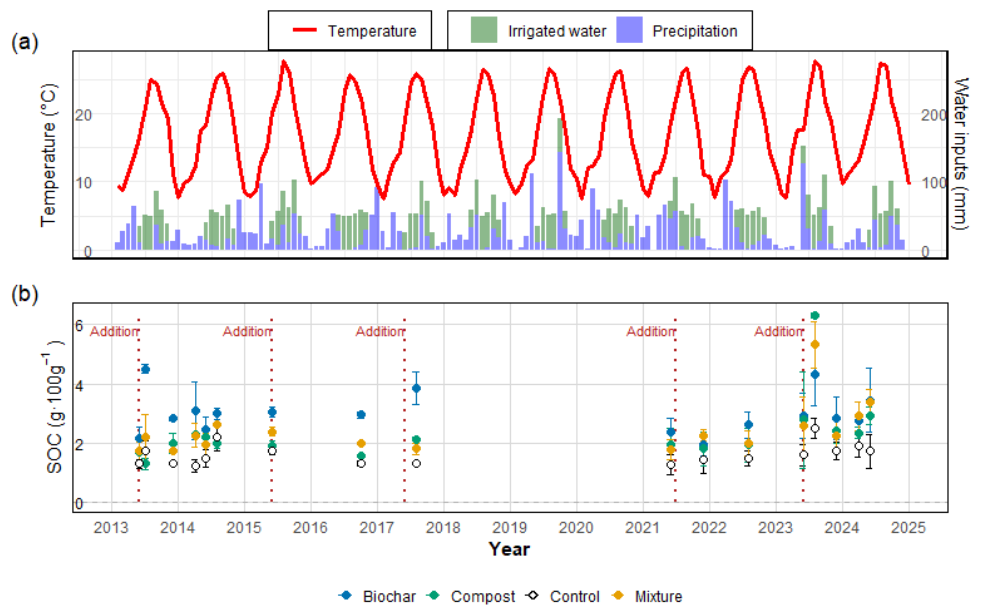
Figure 2The upper panel (a) shows the average monthly temperature, the monthly accumulated precipitation and the amount of water added through irrigation during the experiment period. The lower panel (b) shows the experimental events chronology. The term Addition refers to the date when the amendment (compost, biochar or mixture) was applied to soil. Dots represent averaged SOC concentrations for each treatment after applying median absolute deviation (MAD) filter < 4. Dot colors are used to differentiate between the treatments. Bars represent standard deviation.
To better represent the monthly C input of plant residues in relation to the increase in olive tree age and the associated biomass production over time, we estimated Plant Inputs during the experimental period based on an Above Ground Biomass Density (AGBD) model specifically developed for olive orchards, trained using a three-dimensional representation of canopy structure and multi-source remote sensing data (Contreras et al., 2025). It allows varying the Plant Inputs according to the biomass production derived from the remote sensing estimations, resulting in a better approximation and reproduction of the real conditions through the field experiment. The Plant Input at the first year of the experiment (year 2013) was set as the Plant Inputs derived from the historical Spin up phase, and after this, Plant Inputs were varied depending on the biomass availability (Table S4). The procedure for Plant Input estimation has taken into account the different treatments to capture differences in biomass productivity due to the type of applied amendment.
Model performance in comparison to measured data was evaluated using R2, Root Mean Square Error (RMSE), Bias and the level of significance (p-value). These metrics were calculated (Eqs. 2–4) as:
where Oi is the measured value of SOC, Si is the simulated value by RothC, n is the number of paired observations, is the value fitted by the linear regression between measured and simulated SOC values, and is the mean measured SOC value. RMSE measures the average magnitude of the differences between measured and simulated values. Bias indicates the average tendency of the model to overestimate or underestimate measured SOC values. The R2 indicates the proportion of variance in measured SOC explained by the simulated SOC values. Finally, the p-value was obtained from the linear regression between measured and RothC-simulated SOC values and indicates the statistical significance of this relationship.
3.1 Field-measured SOC concentration and temporal trends
The dynamics of climate and SOC are expressed in Fig. 2, which also indicates the timing of the organic amendment applications. The average monthly air temperature exhibited relatively stable seasonal patterns, whereas precipitation showed strong variability, with intense rainfall events concentrated in specific months, contrasting with periods of very low rainfall. Figure 2 also indicates the amount of irrigation water applied during the experimental period, corresponding to 250 mm yr−1 supplied during the months with the highest water demand. Irrigation was applied from May to October at 15 d intervals.
The SOC measurements collected over the 11-year field experiment showed an increase across all treatments, including the Control without amendments. SOC contents ranged from 1.24 to 6.32 g 100 g−1 throughout the study (Fig. 2), with final values after 11 years of 1.80, 2.56, 2.84, and 3.01 g 100 g−1, for the Control, Compost, Mixture and Biochar treatments, respectively (Table S5). The control treatment displayed a slight SOC increase over time, with an upward trend corresponding to an annual increase rate of 0.04 g 100 g−1 yr−1 (Table S5) when comparing baseline SOC with measurements from 2024. In contrast, all amendment treatments showed a higher and fairly consistent SOC accumulation rate, ranging from 0.11 to 0.16 g 100 g−1 yr−1as shown in Table S5.
Plot-level (replicates) variability within the same treatment groups was also found to be considerable. Table S5 summarizes the mean standard deviation for each treatment. The Control treatment exhibited consistent variability, with a mean standard deviation of approximately 0.27 g 100 g−1. In contrast, treatments such as Biochar demonstrated notably higher variability, with a mean standard deviation of 0.46 g 100 g−1. Compost and the compost-biochar Mixture displayed intermediate variability, with standard deviations of 0.34 and 0.37 g 100 g−1, respectively. Regarding the coefficients of variation (CV), replicates showed a regular pattern, with values ranging from 15.5 % to 16.9 %.
3.2 Modelling of SOC dynamics
3.2.1 Estimation of pool parameters for exogenous organic matter (EOM)
The estimation of the pools size (f) and the decomposition rate (k) for compost was achieved through the adjustment of the model to cumulative CO2-C measured during compost (Co) incubations in three different soil types (Co-S1, Co-S2, and Co-S3; Fig. 3) and averaging the results from the three incubations.
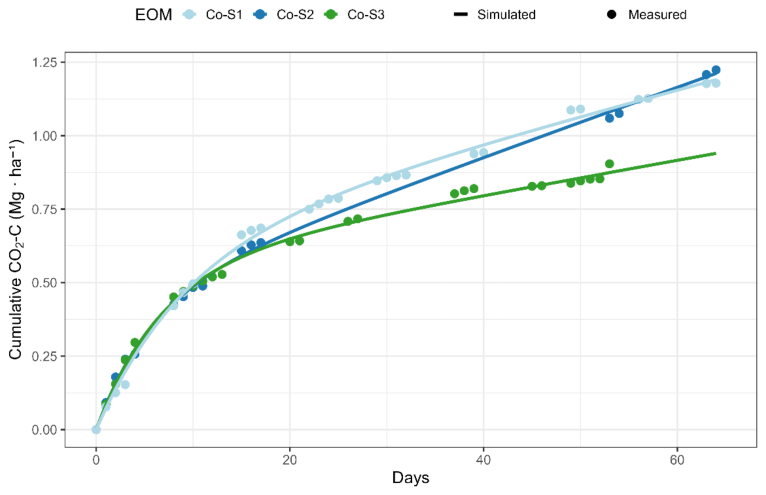
Figure 3CO2 emissions by compost amendment for different soils: measured (dots) and RothC-simulated (lines) cumulative CO2–C (Mg ha−1).
Cumulative CO2–C data were obtained from three different soils to achieve a more robust parameterization, as RothC allows model inversion while explicitly accounting for soil texture differences through clay content. The smallest pool corresponds to the labile fraction (fDEOM = 0.04) that corresponds to 4 % of the total organic carbon added with the EOM. This pool exhibited the highest decay rate, kDEOM = 14.12 yr−1, contributing to the sharp increase in CO2-C release observed at the beginning of the incubation. The more stable pools (fREOM and fHEOM) represent carbon fractions that are more resistant to decomposition. The fREOM pool was predominant in Co-S1 (Jaén soil) and Co-S2 (Jumilla soil), while in Co-S3 (Santomera soil), fHEOM became the dominant fraction. This variation is attributable to the Santomera soil, which displayed a distinct CO2-C flux pattern with lower overall C release compared to Co-S1 and Co-S2 (Fig. 3). The average values for the fREOM and fHEOM pools of the compost were estimated at 0.51 and 0.45 with decay rate kREOM of 0.09 yr−1 (Table 1). For the humified EOM pool, kHEOM of 0.02 yr−1 is assumed according to the standard RothC for the humified pool of the soil organic carbon.
Table 1Kinetic parameters obtained by the RothC inversion using accumulated respiration flux (CO2-C flux).
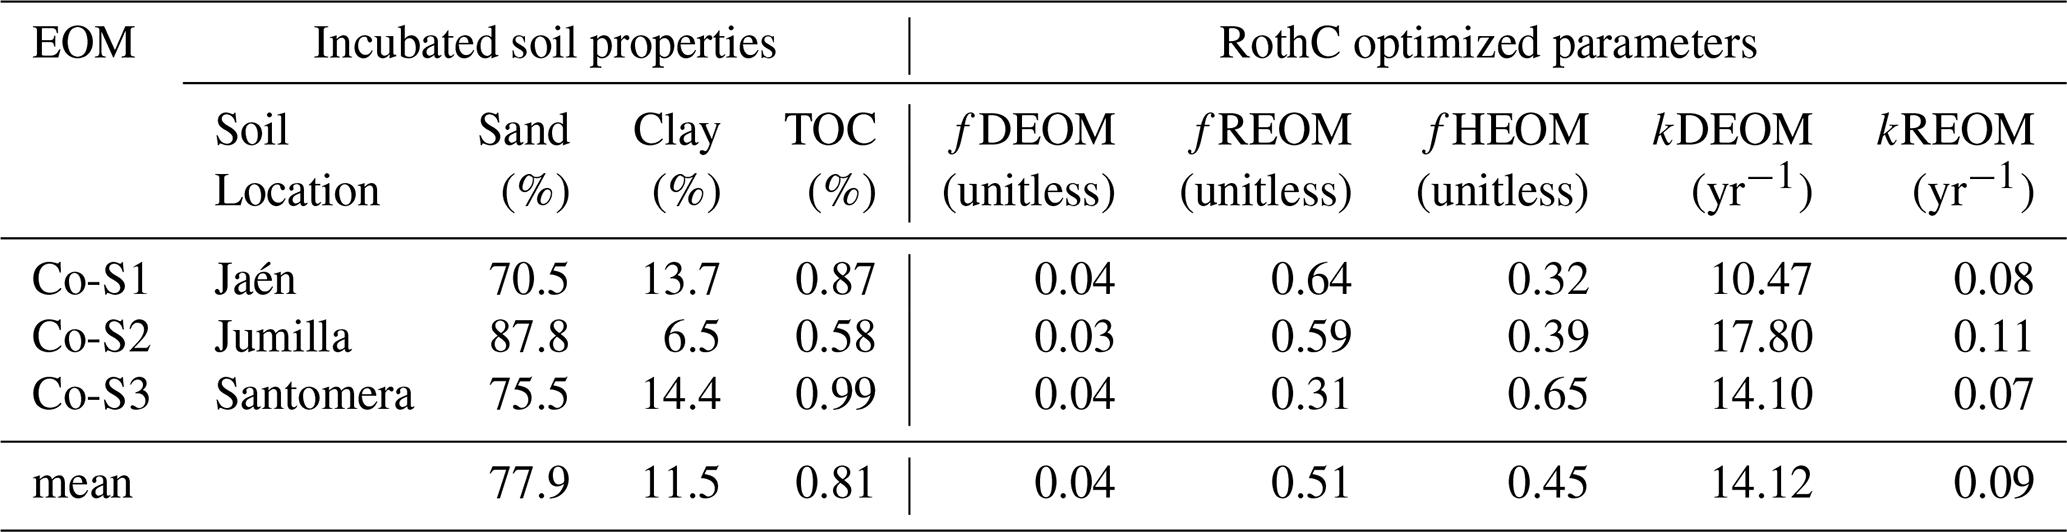
TOC: Total Organic Carbon; EOM: exogenous organic matter; DEOM: decomposable EOM; REOM: resistant EOM; HEOM: humified EOM; f: partitioning factor (unitless); k: decomposition rate (yr−1).
3.2.2 RothC model simulations vs. field data
The model was run for each treatment with the optimized pool parameters (Table 1) to evaluate its performance by comparing simulated SOC with field measurements. Because no SOC measurements were available prior to the establishment of the experiment, the initial SOC (baseline) was set as the mean value of the control plots measured at the first sampling date of the trial.
Figure 4 presents the comparison between field measurements and RothC simulations across all treatments, showing the R2 coefficients, RMSE, Bias, p-value and the 95 % confidence interval. Additionally, regression analyses illustrate the SOC dynamics for measured SOC values. RothC simulations showed an increase in SOC dynamics over time across all amended treatments, with the increment being more pronounced for Biochar than for Compost and the compost-biochar Mixture. This pattern is consistent with the field observations of annual SOC increases; however, the model did not reproduce the increase in SOC dynamics observed for the control treatment. Figure 4 includes shaded areas representing the 95 % confidence interval, within which most data points are contained.
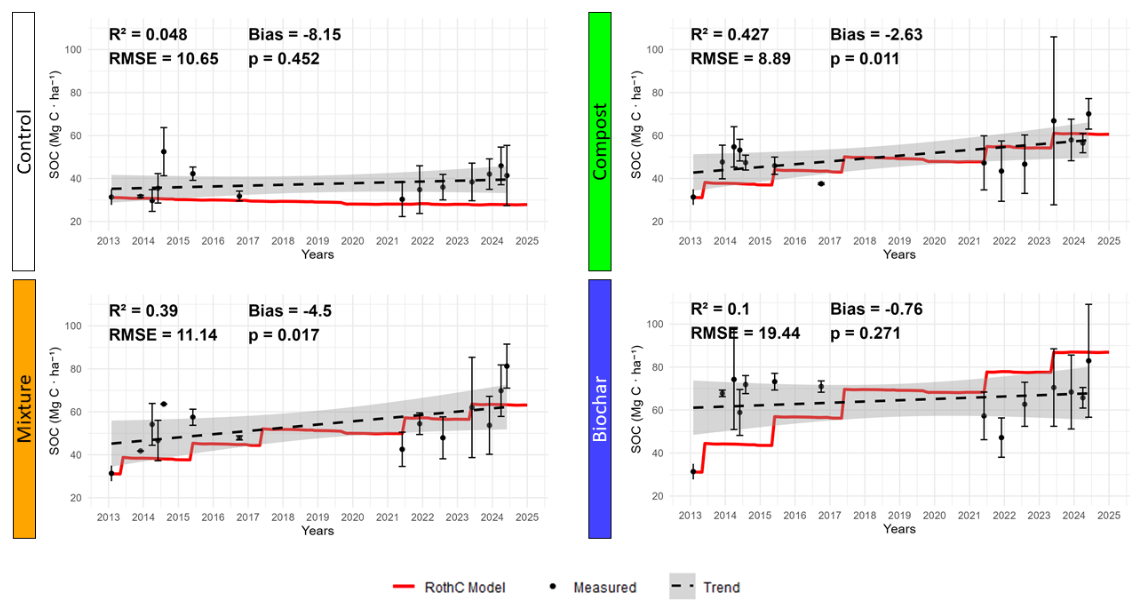
Figure 4Comparative analysis of RothC model simulations (red line) against measured SOC data (black dots) for each treatment. Error bars represent the standard deviation. The black dashed line represents the regression line calculated from the measured values, with the shaded area showing 95 % confidence interval. Model performance statistics (R2, RMSE, Bias, and p-value) are reported. The RMSE and Bias metrics are expressed in Mg C ha−1.
Overall, the comparison reveals a high degree of variability between the two approaches. The RMSE is generally high, with a mean RMSE across all treatments, including the control, of approximately 12.53 Mg ha−1. As observed in Fig. 4, several parts of the line of modelled data lie outside the confidence interval, highlighting the discrepancies between the modelled and the experimental data.
In the case of the control treatment, discrepancies were observed between the RothC-simulated SOC and the field measurements. While the agreement between simulated and measured values was good during the initial years of the experiment, deviations became apparent toward the end of the study period, with simulated values falling below the observed SOC levels. The RMSE for the Control treatment was 10.65 Mg C ha−1. Notably, field measurements tended to be consistently higher than the model outputs, a trend reflected in the positive slope of the regression line. This suggests a potential increase in SOC even in the absence of organic amendments.
Among all treatments, Compost and the Mixture demonstrated the best agreement between simulated and observed SOC values. The coefficient of determination (R2) for the average of all plots was 0.43, and 0.39 for compost and the mixture, respectively. These relatively higher R2 values indicate a better agreement compared to the biochar treatment, which exhibited a substantially lower R2 of 0.10.
The Biochar treatment exhibited the highest level of divergence between the two approaches, as clearly seen in the model fitting results. The mean RMSE for this treatment reached 19.44 Mg C ha−1, the highest among all tested treatments, accompanied by the lowest R2 values.
Overall, the bias analysis indicated negative values for all treatments, suggesting that RothC generally underestimated the SOC measurements in the field. The level of significance between two approaches was assessed using the p-value associated with the linear regression of measured data; significant relationships were observed for the Compost (p = 0.011) and Mixture (p = 0.017).
RothC simulations were used to estimate net annual SOC sequestration rates over the experimental period, enabling a quantitative comparison among organic amendment treatments and with field-derived SOC data. Modelled sequestration rates, calculated subtracting the SOC trend observed in the control treatment, were 3.0, 3.2, and 5.3 Mg C ha−1 yr−1 for the Compost, Mixture, and Biochar treatments, respectively (Table 2). Field measurements produced substantially lower sequestration rates of 1.7, 2.3, and 2.7 Mg C ha−1 yr−1 for the corresponding treatments.
Table 2Summary of comparison of measured and RothC-simulated Total SOC increase, annual accumulation rate, final SOC stock, Remaining EOM and SCS rate for each treatment. Measured uncertainties (±), shown in italics, represent the standard error (SE) estimated through a non-parametric bootstrap (n=5000), obtained by independently resampling the initial and final SOC datasets to incorporate both within-plot and between-plot variability.
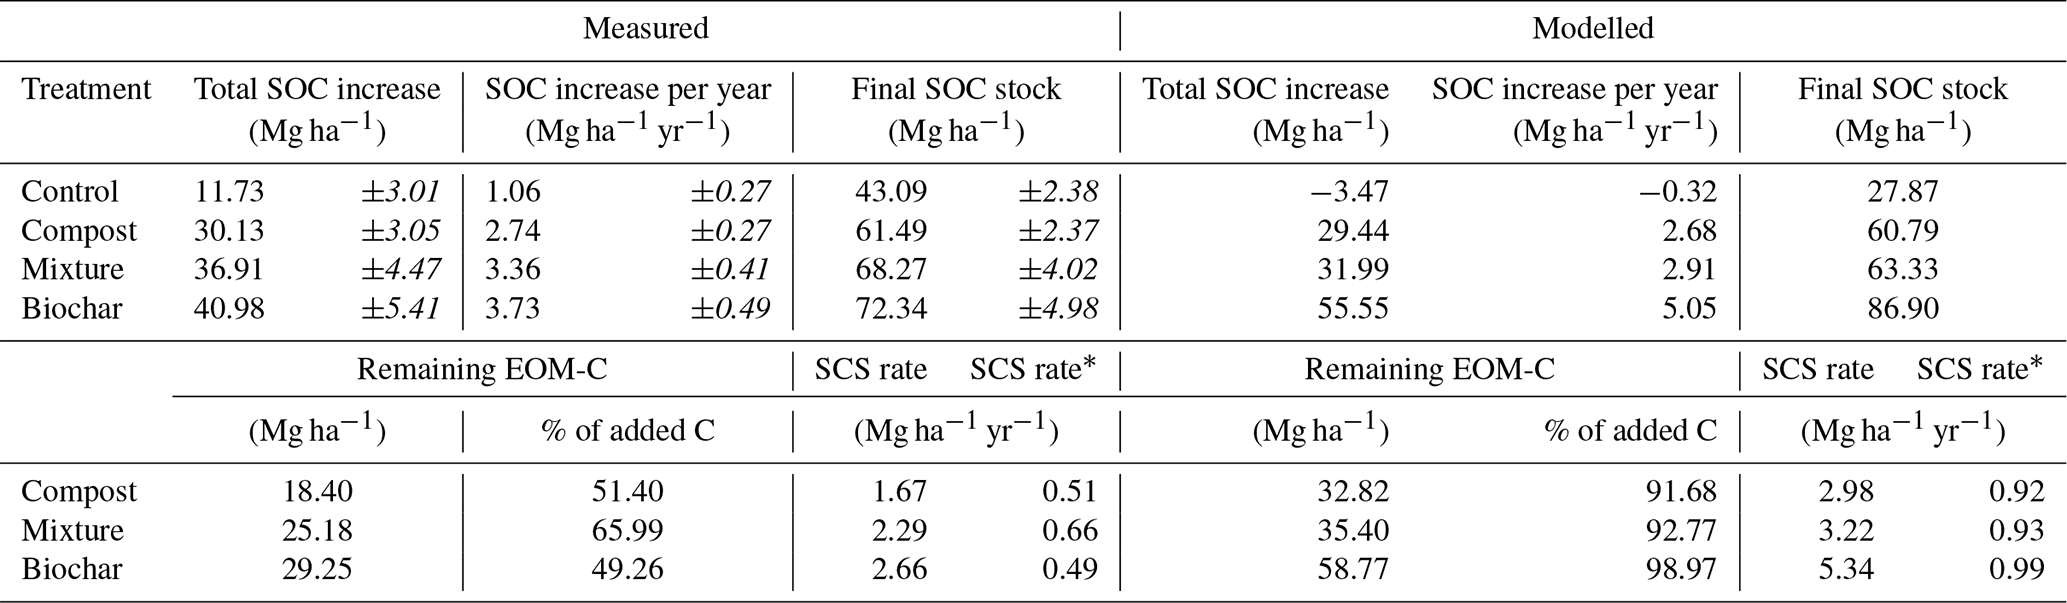
Total SOC increase: SOC increment at the end of the experiment with respect to the initial baseline; Final SOC stock: mean SOC after a minimum of 5 months with respect to the last amendment application; Remaining EOM-C: C added with EOM that remains in the soil at the end of the experiment with respect to the control; SCS rate: Soil Carbon Sequestration rate with respect to the control; SCS rate*: Soil Carbon Sequestration rate with respect to the control normalized for addition of 1 Mg C ha−1 yr−1.
According to the measured data, the proportion of added carbon remaining in the soil at the end of the experimental period was 51.4 %, 66.0 %, and 49.3 % for the Compost, Mixture, and Biochar treatments, respectively. The corresponding values estimated by the model were markedly higher, reaching 91.7 %, 92.8 %, and 98.1 %. When simulations were extended to a 100-year time horizon, the percentage of added carbon remaining in the soil decreased to 66.61 % and 71.5 % for the Compost and Mixture treatments, respectively, while remaining high for Biochar (98.5 %). Accordingly, Fperm, defined as the fraction of added carbon remaining in the soil after 100 years (Rodrigues et al., 2023), was estimated at 45.2 %, 54.3 % and 97.9 % for Compost, Mixture and Biochar, respectively.
4.1 Comparison of field-measured and RothC modelled SOC dynamics
Field measurements and RothC simulations showed comparable temporal trends in SOC dynamics across the different organic amendment treatments over the 11-year experimental period. Both approaches consistently ranked the amendments according to their relative carbon sequestration potential. However, RothC systematically overestimated SOC stocks compared to field measurements, with the magnitude of the discrepancy varying among amendment types and over time.
Monitoring the SOC for long-term is a complex task prone to errors, particularly in sampling procedures that involve extracting solid samples from a vertical soil profile (Poeplau et al., 2022). The inherent variability in field measurements often introduces significant uncertainties in both soil sampling and analysis that are challenging to control and manage. In calcareous soils with low organic carbon contents, such as the studied here, this uncertainty is further increased because small absolute changes in SOC can lead to relatively large analytical variability. The variability among plot replicates clearly dominated the overall uncertainty, reflecting pronounced variability even at short horizontal distances, a phenomenon referred to as fine-scale horizontal variability (Hoffmann et al., 2014).
Modelling offers notable advantages over field-based carbon measurements in terms of speed, resource efficiency, and time requirements (Peralta et al., 2022). Several studies have shown successfully that field-measured SOC can be well aligned with model-derived SOC estimates (Romanenkov et al., 2019; Thiagarajan et al., 2022), and, particularly in the case of soil respiration simulations, which successfully reproduced the overall dynamics (Pulcher et al., 2022). However, field data often exhibit considerable uncertainties, particularly in cases where EOM was added to the soil, such as those examined in this study. Overall, studies applying both empirical measurements and SOC modelling consistently show that carbon-turnover models are generally able to capture the direction of SOC changes over time (Kröbel et al., 2011). However, substantial differences have also been reported among modelling frameworks and measurement approaches (Campbell et al., 2007; Congreves et al., 2015; He et al., 2021; Smith et al., 2012). These discrepancies are typically attributed to differences in calibration procedures and model input data, both of which must be carefully tailored to the specific conditions of each study site. Model performance can therefore vary considerably depending on how well these parameters reflect local environmental and management conditions. In semi-arid environments, calibration becomes particularly critical, as SOC dynamics are strongly governed by carbon inputs (Campbell et al., 2007). In this study, the model was adapted to site-specific semi-arid conditions through the implementation of the modified soil moisture function proposed by Farina et al. (2013), with particular attention to the parameterization of organic amendment decomposition, to reduce uncertainty in SOC simulations. Consequently, the results obtained should be interpreted within the context of the specific environmental, climatic and management conditions of the study site, as differences in site characteristics and model parameterization may limit direct comparisons with other studies.
The different EOM parametrisation strategies adopted for compost and biochar are an additional source of uncertainty. Compost kinetic parameters were calibrated through model inversion using CO2 emissions in incubated soils, whereas biochar parameters were obtained from the methodology proposed by Leifeld et al. (2024). Although this approach may affect the comparability between treatments, it also highlights the methodological challenges associated with representing highly recalcitrant organic amendments within current SOC modelling frameworks.
In the Control treatment, field measurements showed an increasing SOC trend during the experimental period, whereas the simulations indicated a slight decline. This divergence reflects both the intrinsic variability of field-based SOC measurements and differences between the processes represented in the model and those occurring under management conditions. The simulated decline is consistent with the previous management history of the site, where compost had been applied before the start of the field experiment. Once these external inputs ceased in the Control treatment, plant-derived inputs alone may have been insufficient to maintain the SOC level reached during the pre-experimental period (Fig. S2). This effect is reinforced by the use of the modified RothC moisture function proposed by Farina et al. (2013), which reduces decomposition through changes in the rate-modifying factor and consequently leads to lower estimated equilibrium plant inputs compared with the standard RothC formulation. Given the strong sensitivity of RothC to carbon inputs, uncertainty in plant input estimation can substantially influence simulated SOC dynamics. This challenge is particularly relevant in managed agricultural systems, where carbon inputs are not only determined by vegetation growth but also by human management decisions. The land management practices can significantly alter the amount of carbon that enter into the soil, making carbon inputs inherently more difficult to quantify than in natural ecosystems. In contrast, the positive SOC trend observed in the field may be partly explained by sustainable management practices applied in the orchard, particularly the shredding and incorporation of olive pruning residues. These inputs are difficult to quantify accurately because their magnitude and spatial distribution depend on management operations and are therefore difficult to represent explicitly in the model. Nevertheless, the increase in AGBD observed over time (Table S4) supports the expectation of greater pruning biomass production as the olive grove matured. This additional biomass may have increased organic matter inputs to the soil and partially explain the SOC accumulation observed in the control treatment.
Some studies determined carbon inputs, also referred to as plant inputs, either by using traps to capture organic matter from the aboveground portion of vegetation (Pulcher et al., 2022) or by supplying external organic matter in a controlled manner (Jiang et al., 2013). Such approaches are particularly effective for model calibration, as they enable more accurate simulations by constraining carbon inputs. In this study, monthly plant carbon inputs were derived from the equilibrium carbon inputs obtained during the model equilibrium run (Mondini et al., 2018; Peralta et al., 2022) and recalibrated annually using the AGBD data as an indicator to account for the variability in the annual plant inputs. However, in agroecosystems subject to human management, a more realistic model calibration would therefore benefit from approximating actual vegetation-derived carbon inputs as closely as possible. Based on the outcomes of this study, future verification-oriented applications would be strengthened by incorporating field-based measurements of plant carbon inputs, thereby improving the representation of in-field processes within biogeochemical models.
Compost exhibited the best alignment between field measurement and RothC simulations, whereas treatments with biochar alone exhibited large discrepancies. The Compost–Biochar mixture performed slightly worse than pure compost, likely due to the relatively low biochar content (10 %) in the mixture. This suggests that amendments dominated by compost are more predictable and, therefore, easier to quantify and validate under field conditions compared with biochar-based treatments.
4.2 Impact of EOM type and quality on Soil Carbon Sequestration (SCS)
Both field measurements and model simulations were able to distinguish the effects of amendment quality and consistently revealed substantial differences in their impact on soil carbon dynamics and stocks. Although modelled values were generally lower than field measurements, the relative differences among amendment types were consistently preserved. Biochar emerged as the most effective treatment for C sequestration, whereas the compost used in this experiment also showed a strong potential to enhance soil carbon stocks.
The C sequestration rate measured in the compost-amended plots (1.7 Mg C ha−1 yr−1) was calculated relative to the Control treatment, in order to isolate the effect of compost application on SOC dynamics. Using the Control as a reference accounts for background SOC changes occurring during the experimental period, including those associated with tree growth, pruning-derived inputs and management practices that affect all treatments equally. This approach reduces the influence of background SOC changes unrelated to amendment application and provides a more consistent method to compare the effects of amendments. Previous studies have estimated compost-induced SOC sequestration rates ranging from 0.13 to 0.55 Mg C ha−1 yr−1 under different soil and management conditions (Arrouays et al., 2002; Mondini et al., 2012, 2017; Peltre et al., 2012b; Smith et al., 2005), while the Carbo Pro tool (Peltre et al., 2012a) predicts a maximum rate of approximately 0.27 Mg C ha−1 yr−1 for highly stabilized composts. However, SOC sequestration rates are strongly influenced by compost application rates, which vary widely among studies. In the present experiment, the total compost-C input corresponded to an annual application rate of 3.3 Mg C ha−1 yr−1. When normalized to a standard input of 1 Mg C ha−1 yr−1, the resulting sequestration rate (0.51 Mg C ha−1 yr−1) falls within the range reported in the literature. In addition, the compost used in this study was produced from TPOMW-based feedstocks, resulting in a highly stabilized, lignocellulosic-rich material that is known to degrade slowly in soil (Sánchez-Monedero et al., 2008), further contributing to the observed sequestration rates.
The rate of C sequestration for Biochar (0.49 Mg C ha−1 yr−1), calculated on the basis of an addition rate of 1 Mg C ha−1 yr−1, was comparable to that of compost (0.51 Mg C ha−1 yr−1). However, this apparent similarity contrasts with the well-established role of biochar as one of the most effective organic amendments for long-term carbon sequestration (Chiaramonti et al., 2024; Keel et al., 2023; Leng et al., 2019). One explanation is that field-based SOC measurements may underestimate the contribution of biochar-derived carbon due to the highly heterogeneous and particulate nature of biochar in soil. Unlike compost-derived carbon, which tends to become more homogeneously distributed within the soil matrix, biochar remains concentrated in discrete particles, making its quantification highly dependent on the specific location of soil sampling (Chiaramonti et al., 2026). This source of uncertainty is further illustrated by the outlier filtering procedure (Table S1), where the Biochar treatment contained some of the highest SOC values recorded during the experiment. The exclusion of these values may have influenced the final estimate of SOC accumulation. This behaviour is consistent with the concept of random sampling effects associated with particulate carbon forms in soil, as described by Chiaramonti et al. (2026). Conversely, RothC simulations may overestimate biochar persistence because decomposition parameters are derived from the thermal stability and molar ratio (Leifeld et al., 2024), which provides a useful proxy for biochar stability but may not fully capture the complexity of biochar ageing, physical particulates fragmentation and interactions with the soil environment under field conditions (Keel et al., 2023). Nevertheless, the results clearly identify biochar as the amendment presenting the greatest challenges for both field quantification and model representation. This finding highlights the need for further research aimed at improving sampling designs and verification protocols for highly heterogeneous carbon amendments. At the same time, the widespread use of efficient models such as RothC, including their adoption in global initiatives such as the FAO GSOCseq framework (Peralta et al., 2022), reflects the practical importance of modelling approaches when large-scale SOC assessments are required. In this context, combining robust field sampling strategies with appropriately calibrated modelling approaches may provide the most reliable pathway for reducing uncertainty in SOC quantification using biochar as amendment.
Modelled results confirmed the observed trends in the influence of EOM quality on soil carbon stocks, although simulated sequestration rates were consistently higher than those derived from field measurements. In the case of modelled values, the SCS rate calculated for an EOM addition rate of 1 Mg C ha−1 yr−1 were 0.92 and 0.99 Mg C ha−1 yr−1 for Compost and Biochar, respectively. The values of biochar are consistent with those of Keel et al. (2023), while the SCS potential of compost is significantly higher with respect to the previous estimation. This could be explained by the specific compost utilized in the trials as TPOMW compost is known to be particularly resistant to degradation, and by a bias in parameter optimization, considering that in the optimization procedure, soils and composts similar to those of the field experiment were used, but not exactly the same.
Fperm for Compost estimated by the model was 45.2 %, which is consistent with the reported values in the literature for compost of a wide range of feedstocks and the process condition: Ronchin et al. (2024): 44.16 %; Mondini et al. (2017): 34.50 %; Leifeld et al. (2024): 8.8 %. Furthermore, Boldrin et al. (2009) calculated that only 2 %–14 % of added carbon remains after 100 years. In this context, the compost used in this trial lies toward the upper end of the reported range, likely due to the use of TPOMW, which confers high stability to the compost.
Fperm for Biochar is high (97.9 %), a value consistent with findings from previous studies. Fperm for biochar have been estimated to range from 70 % to 98 % (Hammond et al., 2011; Ibarrola et al., 2012; Shackley et al., 2012; Woolf et al., 2021). A similar range was proposed by IPCC (2019). Woolf et al. (2021), considering several field and lab studies (87 data points) on biochar amended soil with a minimum of 1 year of decomposition data, showed a mean Fperm of about 0.70 (±0.20 standard deviations). The maximum Fperm reported in their article was 0.98, similar to that found in the present work.
Results from our field measurements highlight the difficulty of achieving fully reliable SOC estimates due to inherent soil spatial variability and inconsistencies in trial management, as repeated applications were not always performed with materials of identical characteristics, thereby increasing uncertainty in the experimental data. In contrast, modelled estimates consistently preserved the relative ranking of EOM stability, in agreement with the literature and with laboratory incubation studies of amended soils. However, the results also indicate the need to further improve model optimization procedures. Consequently, while modelling approaches provide valuable insight into long-term trends and relative treatment performance, absolute SOC values should be interpreted with caution and complemented by empirical observations and more comprehensive modelling frameworks (Maslouski et al., 2025).
4.3 Biochar as amendment: challenges for field and modelled based C assessment and certification
Based on model simulations, biochar appears to be the most effective amendment for C sequestration and a unique case in terms of stability. The high persistence of biochar estimated by the model is confirmed by other approaches. Keel et al. (2023) suggested to use pyrolysis temperature as a proxy to estimate the decay rate of the recalcitrant carbon pool. This method assumes that higher pyrolysis temperatures result in a lower ratio, thereby enhancing biochar's stability (Zhang et al., 2024). A common assumption in the biochar's assessment is that higher biochar aromaticity results in greater carbon sequestration potential due to the increased stability of the material. A clear example is provided by Chiaramonti et al. (2024), who unearthed a biochar that had been applied to soil for 15 years and analysed its physicochemical properties. They found that its recalcitrant fraction (fREOM) had lost only 7 % of its carbon over this period, corresponding to a field-derived decay rate of kREOM = 0.0048 yr−1. This value is consistent with the decomposition rates proposed by Keel et al. (2023) and Leifeld et al. (2024), indicating that highly aromatic biochars can indeed exhibit substantial persistence under real field conditions. The high biochar persistence is further supported by Kuzyakov et al. (2014) who compared biochar mineralization determined via CO2 efflux and derived from 14C in an 8.5 years incubation experiment.
Despite the promising results of the modelling approach for biochar amended soil, its reliable applicability remains a challenging and unresolved issue mainly due to the lack of long term field experiments for model parameterization and validation.
Biochar is often modelled using simple exponential decay functions to represent the decomposition rate of C pools. This approach has been incorporated into carbon turnover models such as RothC and Century, but its representation remains underdeveloped (Lefebvre et al., 2020; Mondini et al., 2017; Woolf and Lehmann, 2012). Sanei et al. (2025) evaluated a two-pool decay model and found that the labile fraction was typically very small, causing the model to behave similarly to a single-pool system. As a result, biochar persistence may be inaccurately represented. The results of field experiment suggests that biochar also demonstrated the lowest predictability among treatments in the field experiment, as it showed a stability comparable to compost, in disagreement with the generally acknowledged high resistance of biochar to decomposition. As a matter of fact, there was a low agreement between measured and modelled data (R2= 0.10) for the biochar treatment. This highlights the high degree of uncertainty associated with the practical challenges of biochar application and its measurement under field conditions. Among the most distinguishing physical characteristics of biochar are its granular texture and its high carbon concentration (Chiaramonti et al., 2026), which complicates its integration into the soil matrix and may increase susceptibility to losses through wind or water transport compared with compost (Rumpel et al., 2009). In contrast, compost shows a more homogeneous distribution and has demonstrated an intimate association with the soil environment.
The limitations outlined above about the assessment of C stocks dynamics in biochar amended soil are particularly relevant, as biochar is increasingly recognised as a promising carbon dioxide removal (CDR) technology. Despite its high SCS potential, biochar presents specific challenges for both field-based quantification and biogeochemical modelling. Its heterogeneous spatial distribution and highly concentrated carbon content introduce substantial uncertainty in soil sampling approaches (Chiaramonti et al., 2026), while current SOC models, such as RothC, remain limited in their ability to fully represent its long-term stability and decomposition dynamics. For carbon credit certification schemes, this dual source of uncertainty complicates the robust quantification of long-term climate benefits and increases uncertainty in permanence estimates. Consequently, a cautious approach is required when allocating carbon credits to biochar-based interventions, emphasising the need to integrate field measurements, adapted modelling strategies (Verra, 2025), and upstream biochar characterisation to ensure reliable long-term carbon accounting.
The comparison between field measurements and model simulations revealed differences in the representation of SOC dynamics across approaches over the 11-year experimental period. The application of EOM accentuated these differences, with contrasting responses depending on the type of amendment. Compost showed the strongest agreement between measured and simulated SOC dynamics, indicating a consistent representation of its decomposition and its homogenization in the soil. In contrast, biochar proved more challenging to represent, reflecting its distinctive physicochemical properties and the resulting difficulties in both field quantification and model parameterization.
Soil sampling was identified as a major source of uncertainty, mainly due to the high variability observed among replicate plots, an issue that becomes particularly critical for heterogeneous amendments such as biochar. At the same time, modelling proved effective in capturing long-term SOC trends for amended soils, but its performance for biochar was constrained by the need to adequately represent amendment-specific decomposition behaviour. In this regard, biochar stability appears highly sensitive to the parameterization of decomposition processes based on its intrinsic properties.
The results also highlighted the importance of model initialization, particularly in agricultural soils that are not at equilibrium. Historical management and previous organic matter inputs strongly influence the distribution of carbon among SOC pools, which in turn affects simulated SOC dynamics and carbon sequestration estimates. A further source of uncertainty is assumptions related to plant carbon inputs, which are inherently variable under field conditions and difficult to constrain accurately.
Overall, this work does not aim to favour or invalidate either field-based measurements or modelling approaches for carbon accounting, but rather to clarify their respective strengths and limitations. From a practical perspective, modelling performs as a powerful and efficient tool for assessing SOC dynamics at larger spatial and temporal scales, while field sampling remains essential for validating observed trends. However, our results indicate that these approaches are not equally suitable for all types of organic amendments. In particular, biochar presents specific challenges for field-based verification of carbon sequestration, largely due to its heterogeneous spatial distribution and highly particulate nature, which amplify sampling-related uncertainty. In contrast, compost showed more consistent and reproducible behaviour across both approaches. Recognising these amendment-specific constraints is therefore critical to improving the robustness of SOC assessments and advancing reliable carbon accounting methodologies.
The data and R code supporting the RothC simulations and incubation-based parameter inversion are available in the associated repository: https://doi.org/10.20350/digitalCSIC/20835 (Contreras et al., 2026). The repository contains the input datasets, model scripts, configuration files, and selected outputs required to reproduce the workflow described in this study.
The supplement related to this article is available online at https://doi.org/10.5194/soil-12-773-2026-supplement.
FC: Writing – review & editing, Supervision, Investigation, Conceptualization. MLC: Writing – review & editing, Visualization, Validation, Supervision, Methodology, Conceptualization, Resources. MSG: Writing – review & editing, Visualization, Validation, Supervision, Methodology, Conceptualization, Resources. ER: Writing – review & editing, Visualization, Validation, Supervision, Methodology, Conceptualization, Resources, Software. CM: Writing – review & editing, Visualization, Validation, Supervision, Methodology, Conceptualization, Resources, Software. MASM: Writing – review & editing, Visualization, Validation, Supervision, Methodology, Conceptualization, Resources.
The contact author has declared that none of the authors has any competing interests.
Publisher's note: Copernicus Publications remains neutral with regard to jurisdictional claims made in the text, published maps, institutional affiliations, or any other geographical representation in this paper. The authors bear the ultimate responsibility for providing appropriate place names. Views expressed in the text are those of the authors and do not necessarily reflect the views of the publisher.
The authors gratefully acknowledge the organic olive mill “Casa Pareja” for providing access to their olive grove and supporting the establishment and maintenance of the long-term experiment. F. Contreras acknowledges the use of AI tools to assist in manuscript revision and in improving the scripts developed for data analysis in this study.
This work was supported by project PID2021-128896OB-I00, funded by the Spanish Ministry of Science, Innovation and Universities and co-funded by the EU FEDER, and by the Fundación Séneca–Agency for Science and Technology of the Region of Murcia (Spain) under project 22701/PI/24. The publication fee was supported by the CSIC Open Access Publication Support Initiative through its Unit of Information Resources for Research (URICI).
This paper was edited by Moritz Laub and reviewed by three anonymous referees.
Allen, R. G., Pereira, L. S., Raes, D., and Smith, M.: Crop evapotranspiration-Guidelines for computing crop water requirements-FAO Irrigation and drainage paper 56, FAO, Rome, https://www.fao.org/4/x0490e/x0490e00.htm (last access: 12 July 2025), 1998.
Antil, R. S., Bar-Tal, A., Fine, P., and Hadas, A.: Predicting Nitrogen and Carbon Mineralization of Composted Manure and Sewage Sludge in Soil, Compost Sci. Util., 19, 33–43, https://doi.org/10.1080/1065657X.2011.10736974, 2011.
Arrouays, D., Balesdent, J., Germon, J. C., Jayet, P. A., Soussana, J. F., and Stengel, P. (Eds.): Contribution à la lutte contre l'effet de serre: stocker du carbone dans les sols agricoles de France? Expertise scientifique collective – Synthèse du rapport, INRA, France, 32 pp., https://www.inrae.fr/sites/default/files/pdf/cbb40e809bbb5356d5fcc6a1f48e3121.pdf (last access: 25 October 2025), 2002.
Badewa, E. A., Yeung, C. C., Whalen, J. K., and Oelbermann, M.: Compost and biosolids increase long-term soil organic carbon stocks, Can. J. Soil Sci., 103, 483–492, https://doi.org/10.1139/cjss-2022-0104, 2023.
Boldrin, A., Andersen, J. K., Møller, J., Christensen, T. H., and Favoino, E.: Composting and compost utilization: accounting of greenhouse gases and global warming contributions, Waste Manage. Res., 27, 800–812, https://doi.org/10.1177/0734242X09345275, 2009.
Campbell, C. A., VandenBygaart, A. J., Zentner, R. P., McConkey, B. G., Smith, W., Lemke, R., Grant, B., and Jefferson, P. G.: Quantifying carbon sequestration in a minimum tillage crop rotation study in semiarid southwestern Saskatchewan, Can. J. Soil Sci., 87, 235–250, https://doi.org/10.4141/S06-018, 2007.
Chiaramonti, D., Lotti, G., Vaccari, F. P., and Sanei, H.: Assessment of long-lived Carbon permanence in agricultural soil: Unearthing 15 years-old biochar from long-term field experiment in vineyard, Biomass Bioenergy, 191, 107484, https://doi.org/10.1016/j.biombioe.2024.107484, 2024.
Chiaramonti, D., Lotti, G., Tozzi, F., Casini, D., Vaccari, F. P., Sanei, H., Luconi, M., and Buffi, M.: Is soil sampling appropriate for quantitative carbon accounting for biochar? An experimental investigation to assess soil carbon accumulation, Biomass Bioenergy, 205, 108537, https://doi.org/10.1016/j.biombioe.2025.108537, 2026.
CIR-EU: Commission Implementing Regulation (EU) 2025/2358 of 20 November 2025 laying down rules on certification schemes, certification bodies, and audits under Regulation (EU) 2024/3012 of the European Parliament and of the Council, http://data.europa.eu/eli/reg_impl/2025/2358/oj (last access: 11 November 2025), 2025.
Coleman, K., Jenkinson, D. S., Crocker, G. J., Grace, P. R., Klír, J., Körschens, M., Poulton, P. R., and Richter, D. D.: Simulating trends in soil organic carbon in long-term experiments using RothC-26.3, Geoderma, 81, 29–44, https://doi.org/10.1016/S0016-7061(97)00079-7, 1997.
Congreves, K. A., Grant, B. B., Campbell, C. A., Smith, W. N., VandenBygaart, A. J., Kröbel, R., Lemke, R. L., and Desjardins, R. L.: Measuring and Modeling the Long-Term Impact of Crop Management on Soil Carbon Sequestration in the Semiarid Canadian Prairies, Agron. J., 107, 1141–1154, https://doi.org/10.2134/agronj15.0009, 2015.
Contreras, F., Cayuela, M. L., Sánchez-Monedero, M. A., and Pérez-Cutillas, P.: Multi-source remote sensing for large-scale biomass estimation in Mediterranean olive orchards using GEDI LiDAR and machine learning, Biogeosciences, 22, 7625–7646, https://doi.org/10.5194/bg-22-7625-2025, 2025.
Contreras, F., Cayuela, M., Sánchez García, M., Ronchin, E., Mondini, C., and Sánchez-Monedero, M.: Data and code for “Challenges in Soil Carbon Modelling and Measurement: A Decade of Experimental Data vs. RothC Simulations in an Organic Olive Grove”, CSIC – Centro de Edafología y Biología Aplicada del Segura (CEBAS) [code, data set], https://doi.org/10.20350/digitalCSIC/20835, 2026.
Dai, W., Gao, H., Sha, Z., Penttinen, P., Fang, K., Wang, J., and Cao, L.: Changes in soil organic carbon fractions in response to wheat straw incorporation in a subtropical paddy field in China, J. Plant Nutr. Soil Sc., 184, 198–207, https://doi.org/10.1002/jpln.202000200, 2021.
Delhez, L., Dumont, B., and Longdoz, B.: Leveraging temporal variability in global sensitivity analysis of the Daisy soil-plant-atmosphere model, Eur. J. Agron., 165, 127533, https://doi.org/10.1016/j.eja.2025.127533, 2025.
Dimassi, B., Guenet, B., Saby, N. P. A., Munoz, F., Bardy, M., Millet, F., and Martin, M. P.: The impacts of CENTURY model initialization scenarios on soil organic carbon dynamics simulation in French long-term experiments, Geoderma, 311, 25–36, https://doi.org/10.1016/j.geoderma.2017.09.038, 2018.
Don, A., Seidel, F., Leifeld, J., Kätterer, T., Martin, M., Pellerin, S., Emde, D., Seitz, D., and Chenu, C.: Carbon sequestration in soils and climate change mitigation – Definitions and pitfalls, Glob. Change Biol., 30, https://doi.org/10.1111/gcb.16983, 2024.
Emde, D., Poeplau, C., Don, A., Heilek, S., and Schneider, F.: The centennial legacy of land-use change on organic carbon stocks of German agricultural soils, Glob. Change Biol., 30, https://doi.org/10.1111/gcb.17444, 2024.
FAO: Measuring and modelling soil carbon stocks and stock changes in livestock production systems: Guidelines for assessment (Version 1), Livestock Environmental Assessment and Performance (LEAP) Partnership, FAO, Rome, Italy, 170 pp., https://openknowledge.fao.org/handle/20.500.14283/ca2934en (last access: 11 January 2026), 2019.
Farina, R., Coleman, K., and Whitmore, A. P.: Modification of the RothC model for simulations of soil organic C dynamics in dryland regions, Geoderma, 200–201, 18–30, https://doi.org/10.1016/j.geoderma.2013.01.021, 2013.
Gold Standard: Soil Organic Carbon Framework Methodology, Gold Standard for the Global Goals v.1.0, https://globalgoals.goldstandard.org/402-luf-agr-fm-soil-organic-carbon-framework-methodolgy/ (last access: 21 October 2025), 2020.
Hammond, J., Shackley, S., Sohi, S., and Brownsort, P.: Prospective life cycle carbon abatement for pyrolysis biochar systems in the UK, Energ. Policy, 39, 2646–2655, https://doi.org/10.1016/j.enpol.2011.02.033, 2011.
Han, M., Zhao, Q., Wang, X., Wang, Y.-P., Ciais, P., Zhang, H., Goll, D. S., Zhu, L., Zhao, Z., Guo, Z., Wang, C., Zhuang, W., Wu, F., and Li, W.: Modeling biochar effects on soil organic carbon on croplands in a microbial decomposition model (MIMICS-BC_v1.0), Geosci. Model Dev., 17, 4871–4890, https://doi.org/10.5194/gmd-17-4871-2024, 2024.
He, W., Grant, B. B., Jing, Q., Lemke, R., St. Luce, M., Jiang, R., Qian, B., Campbell, C. A., VanderZaag, A., Zou, G., and Smith, W. N.: Measuring and modeling soil carbon sequestration under diverse cropping systems in the semiarid prairies of western Canada, J. Clean. Prod., 328, 129614, https://doi.org/10.1016/j.jclepro.2021.129614, 2021.
Hoffmann, U., Hoffmann, T., Johnson, E. A., and Kuhn, N. J.: Assessment of variability and uncertainty of soil organic carbon in a mountainous boreal forest (Canadian Rocky Mountains, Alberta), Catena, 113, 107–121, https://doi.org/10.1016/j.catena.2013.09.009, 2014.
Ibarrola, R., Shackley, S., and Hammond, J.: Pyrolysis biochar systems for recovering biodegradable materials: A life cycle carbon assessment, Waste Manage., 32, 859–868, https://doi.org/10.1016/j.wasman.2011.10.005, 2012.
IPCC: 2019 Refinement to the 2006 IPCC Guidelines for National Greenhouse Gas Inventories, edited by: Calvo Buendia, E., Tanabe, K., Kranjc, A., Baasansuren, J., Fukuda, M., Ngarize, S., Osako, A., Pyrozhenko, Y., Shermanau, P., and Federici, S., Volume 4: Agriculture, Forestry and Other Land Use, Appendix 4: Method for Estimating the Change in Mineral Soil Organic Carbon Stocks from Biochar Amendments: Basis for Future Methodological Development, IPCC, Switzerland, https://www.ipcc-nggip.iges.or.jp/public/2019rf/pdf/4_Volume4/19R_V4_Ch02_Ap4_Biochar.pdf (last access: 21 December 2025), 2019.
IUSS Working Group WRB: World Reference Base for Soil Resources: International soil classification system for naming soils and creating legends for soil maps, 4th edn., International Union of Soil Sciences (IUSS), Vienna, Austria, https://wrb.isric.org/files/WRB_fourth_edition_2022-12-18.pdf (last access: 16 November 2025), 2022.
Jenkinson, D. S. and Rayner, J. H.: The turnover of soil organic matter in some of the Rothamsted classical experiments, Soil Sci., 123, 298–305, https://doi.org/10.1097/00010694-197705000-00005, 1977.
Jiang, G., Shirato, Y., Xu, M., Yagasaki, Y., Huang, Q., Li, Z., Nie, J., and Shi, X.: Testing the modified Rothamsted Carbon Model for paddy soils against the results from long-term experiments in southern China, Soil Sci. Plant Nutr., 59, 16–26, https://doi.org/10.1080/00380768.2012.733923, 2013.
Keel, S. G., Bretscher, D., Leifeld, J., von Ow, A., and Wüst-Galley, C.: Soil carbon sequestration potential bounded by population growth, land availability, food production, and climate change, Carbon Manag., 14, https://doi.org/10.1080/17583004.2023.2244456, 2023.
Kottek, M., Grieser, J., Beck, C., Rudolf, B., and Rubel, F.: World Map of the Köppen-Geiger climate classification updated, Meteorol. Z., 15, 259–263, https://doi.org/10.1127/0941-2948/2006/0130, 2006.
Kröbel, R., Smith, W., Grant, B., Desjardins, R., Campbell, C., Tremblay, N., Li, C., Zentner, R., and McConkey, B.: Development and evaluation of a new Canadian spring wheat sub-model for DNDC, Can. J. Soil Sci., 91, 503–520, https://doi.org/10.4141/cjss2010-059, 2011.
Kuzyakov, Y., Bogomolova, I., and Glaser, B.: Biochar stability in soil: Decomposition during eight years and transformation as assessed by compound-specific 14C analysis, Soil Biol. Biochem., 70, 229–236, https://doi.org/10.1016/j.soilbio.2013.12.021, 2014.
Lal, R., Smith, P., Jungkunst, H. F., Mitsch, W. J., Lehmann, J., Nair, P. K. R., McBratney, A. B., de Moraes Sá, J. C., Schneider, J., Zinn, Y. L., Skorupa, A. L. A., Zhang, H.-L., Minasny, B., Srinivasrao, C., and Ravindranath, N. H.: The carbon sequestration potential of terrestrial ecosystems, J. Soil Water Conserv., 73, 145A–152A, https://doi.org/10.2489/jswc.73.6.145A, 2018.
Lefebvre, D., Williams, A., Meersmans, J., Kirk, G. J. D., Sohi, S., Goglio, P., and Smith, P.: Modelling the potential for soil carbon sequestration using biochar from sugarcane residues in Brazil, Sci. Rep., 10, 19479, https://doi.org/10.1038/s41598-020-76470-y, 2020.
Leifeld, J., Hardy, B., Budai, A., Elsgaard, L., Keel, S., Levavasseur, F., Liang, Z., Mondini, C., Plaza, C., and Rodrigues, L.: New parameter estimates for exogenous organic materials including biochar for the Rothamsted carbon model, Zenodo [data set], https://doi.org/10.5281/zenodo.12582998, 2024.
Leng, L., Xu, X., Wei, L., Fan, L., Huang, H., Li, J., Lu, Q., Li, J., and Zhou, W.: Biochar stability assessment by incubation and modelling: Methods, drawbacks and recommendations, Sci. Total Environ., 664, 11–23, https://doi.org/10.1016/j.scitotenv.2019.01.298, 2019.
Maslouski, M., Ansari, M., Hamburger, S. E., Meyer zu Drewer, J., Hagemann, N., Eschenbach, A., Beer, C., Becker, J. N., Kammann, C. I., Vorrath, M.-E., and Porada, P.: Long-term carbon dioxide removal potential from the application of wood biochar and basanite rock powder in sandy soil using the LiDELSv2 process-based modeling approach, Environ. Res. Lett., 20, 124032, https://doi.org/10.1088/1748-9326/ae21f6, 2025.
Miller, J. C. and Miller, J. N.: Statistics for analytical chemistry, Ellis Horwood and Halsted Press, Chichester, UK, and New York, USA, 2nd Edn., 227 pp., 1988.
Mondini, C., Coleman, K., and Whitmore, A. P.: Spatially explicit modelling of changes in soil organic C in agricultural soils in Italy, 2001–2100: Potential for compost amendment, Agr. Ecosyst. Environ., 153, 24–32, https://doi.org/10.1016/j.agee.2012.02.020, 2012.
Mondini, C., Cayuela, M. L., Sinicco, T., Fornasier, F., Galvez, A., and Sánchez-Monedero, M. A.: Modification of the RothC model to simulate soil C mineralization of exogenous organic matter, Biogeosciences, 14, 3253–3274, https://doi.org/10.5194/bg-14-3253-2017, 2017.
Mondini, C., Cayuela, M. L., Sinicco, T., Fornasier, F., Galvez, A., and Sánchez-Monedero, M. A.: Soil C storage potential of exogenous organic matter at regional level (Italy) under climate change simulated by RothC model modified for amended soils, Front. Environ. Sci., 6, https://doi.org/10.3389/fenvs.2018.00144, 2018.
Nemo, Klumpp, K., Coleman, K., Dondini, M., Goulding, K., Hastings, A., Jones, M. B., Leifeld, J., Osborne, B., Saunders, M., Scott, T., Teh, Y. A., and Smith, P.: Soil Organic Carbon (SOC) Equilibrium and Model Initialisation Methods: an Application to the Rothamsted Carbon (RothC) Model, Environ. Model. Assess., 22, 215–229, https://doi.org/10.1007/s10666-016-9536-0, 2017.
Noirot-Cosson, P. E., Vaudour, E., Gilliot, J. M., Gabrielle, B., and Houot, S.: Modelling the long-term effect of urban waste compost applications on carbon and nitrogen dynamics in temperate cropland, Soil Biol. Biochem., 94, 138–153, https://doi.org/10.1016/j.soilbio.2015.11.014, 2016.
Paustian, K., Parton, W. J., and Persson, J.: Modeling Soil Organic Matter in Organic-Amended and Nitrogen-Fertilized Long-Term Plots, Soil Sci. Soc. Am. J., 56, 476–488, https://doi.org/10.2136/sssaj1992.03615995005600020023x, 1992.
Peltre, C., Doublet, J., Biquillon, R., Pereira, A., Lhoutellier, C., Agenis-Nevers, M., and Houot, S.: Carbo-Pro: a simulation model to manage soil organic matter through compost applications, in: Proceedings of 8th International Conference Orbit 2012, 12–15 June 2012, Rennes, France, European Compost Network ECN, Bochum, Germany, 9 pp., https://www.researchgate.net/publication/281405639_Carbo-pro_A_simulation_model_to_manage_soil_organic_matter_through_compost_applications (last access: 16 November 2025), 2012a.
Peltre, C., Christensen, B. T., Dragon, S., Icard, C., Kätterer, T., and Houot, S.: RothC simulation of carbon accumulation in soil after repeated application of widely different organic amendments, Soil Biol. Biochem., 52, 49–60, https://doi.org/10.1016/j.soilbio.2012.03.023, 2012b.
Peltre, C., Nielsen, M., Christensen, B. T., Hansen, E. M., Thomsen, I. K., and Bruun, S.: Straw export in continuous winter wheat and the ability of oil radish catch crops and early sowing of wheat to offset soil C and N losses: A simulation study, Agr. Syst., 143, 195–202, https://doi.org/10.1016/j.agsy.2016.01.002, 2016.
Peralta, G., Di Paolo L., Luotto, I., Omuto, C., Mainka M., Viatkin, K., and Yigini, Y.: Global soil organic carbon sequestration potential map (GSOCseq v1.1) – Technical manual, Rome, FAO, https://doi.org/10.4060/cb2642en, 2022.
Poeplau, C., Prietz, R., and Don, A.: Plot-scale variability of organic carbon in temperate agricultural soils – Implications for soil monitoring, J. Plant Nutr. Soil Sc., 185, 403–416, https://doi.org/10.1002/jpln.202100393, 2022.
Pulcher, R., Balugani, E., Ventura, M., Greggio, N., and Marazza, D.: Inclusion of biochar in a C dynamics model based on observations from an 8-year field experiment, SOIL, 8, 199–211, https://doi.org/10.5194/soil-8-199-2022, 2022.
Rasmussen, P. E. and Parton, W. J.: Long-Term Effects of Residue Management in Wheat-Fallow: I. Inputs, Yield, and Soil Organic Matter, Soil Sci. Soc. Am. J., 58, 523–530, https://doi.org/10.2136/sssaj1994.03615995005800020039x, 1994.
Rodrigues, L., Budai, A., Elsgaard, L., Hardy, B., Keel, S. G., Mondini, C., Plaza, C., and Leifeld, J.: The importance of biochar quality and pyrolysis yield for soil carbon sequestration in practice, Eur. J. Soil Sci., 74, https://doi.org/10.1111/ejss.13396, 2023.
Romanenkov, V., Belichenko, M., Petrova, A., Raskatova, T., Jahn, G., and Krasilnikov, P.: Soil organic carbon dynamics in long-term experiments with mineral and organic fertilizers in Russia, Geoderma Regional, 17, e00221, https://doi.org/10.1016/j.geodrs.2019.e00221, 2019.
Ronchin, E., Sinicco, T., and Mondini, C.: Evaluating the impact of novel biobased fertilisers on soil carbon sequestration integrating laboratory short-term mineralization and modeling, poster presented at the First AnaEE Science Conference “Ecosystems under pressure – the role of experimentation”, 8–10 October 2024, Paris, France, p. 1, https://rusticaproject.eu/wp-content/uploads/2024/10/Rustica-News_AnaEE-Science-Conference-2024_poster.pdf (last access: 8 January 2026), 2024.
Rumpel, C., Ba, A., Darboux, F., Chaplot, V., and Planchon, O.: Erosion budget and process selectivity of black carbon at meter scale, Geoderma, 154, 131–137, https://doi.org/10.1016/j.geoderma.2009.10.006, 2009.
Rydgård, M., Jensen, L. S., Schwartzkopff, M. V., Pinna, S., Sørensen, P., and Bruun, S.: A life cycle assessment of cover crop ensiling and co-digestion with cattle manure, Nutr. Cycl. Agroecosys., https://doi.org/10.1007/s10705-024-10386-1, 2024.
Sánchez-Garcia, M., Sánchez-Monedero, M. Á., and Cayuela, M. L.: Recarbonizing global soils – A technical manual of recommended management practices, in: Recarbonizing global soils – A technical manual of recommended management practices, vol. 4, FAO, 232–238, https://doi.org/10.4060/cb6598en, 2021.
Sánchez-Monedero, M. A., Cayuela, M. L., Mondini, C., Serramiá, N., and Roig, A.: Potential of olive mill wastes for soil C sequestration, Waste Manage., 28, 767–773, https://doi.org/10.1016/j.wasman.2007.09.029, 2008.
Sanei, H., Petersen, H. I., Chiaramonti, D., and Masek, O.: Evaluating the two-pool decay model for biochar carbon permanence, Biochar, 7, https://doi.org/10.1007/s42773-024-00408-0, 2025.
Senapati, N., Hulugalle, N. R., Smith, P., Wilson, B. R., Yeluripati, J. B., Daniel, H., Ghosh, S., and Lockwood, P.: Modelling soil organic carbon storage with RothC in irrigated Vertisols under cotton cropping systems in the sub-tropics, Soil Till. Res., 143, 38–49, https://doi.org/10.1016/j.still.2014.05.009, 2014.
Serramiá, N., Roig, A., and Sánchez-Monedero, M. A.: Soil mineralization of two-phase olive mill wastes: Effect of the lignocellulosic composition on soil C dynamics, J. Environ. Monitor., 14, 499–509, https://doi.org/10.1039/c1em10490j, 2012.
Shackley, S., Sohi, S., Ibarrola, R., Hammond, J., Mašek, O., Brownsort, P., Cross, A., Prendergast-Miller, M., and Haszeldine, S.: Biochar, Tool for Climate Change Mitigation and Soil Management, in: Encyclopedia of Sustainability Science and Technology, Springer New York, New York, NY, 845–893, https://doi.org/10.1007/978-1-4419-0851-3_386, 2012.
Shirato, Y., Paisancharoen, K., Sangtong, P., Nakviro, C., Yokozawa, M., and Matsumoto, N.: Testing the Rothamsted Carbon Model against data from long-term experiments on upland soils in Thailand, Eur. J. Soil Sci., 56, 179–188, https://doi.org/10.1111/j.1365-2389.2004.00659.x, 2005.
Shirato, Y., Yagasaki, Y., and Nishida, M.: Using different versions of the Rothamsted Carbon model to simulate soil carbon in long-term experimental plots subjected to paddy–upland rotation in Japan, Soil Sci. Plant Nutr., 57, 597–606, https://doi.org/10.1080/00380768.2011.591284, 2011.
Sistema de Información Agrario de Murcia: http://siam.imida.es/, last access: 25 February 2025.
Sierra, C. A., Müller, M., and Trumbore, S. E.: Models of soil organic matter decomposition: the SoilR package, version 1.0, Geosci. Model Dev., 5, 1045–1060, https://doi.org/10.5194/gmd-5-1045-2012, 2012.
Smith, J., Smith, P., Wattenbach, M., Zaehle, S., Hiederer, R., Jones, R. J. A., Montanarella, L., Rounsevell, M. D. A., Reginster, I., and Ewert, F.: Projected changes in mineral soil carbon of European croplands and grasslands, 1990–2080, Glob. Change Biol., 11, 2141–2152, https://doi.org/10.1111/j.1365-2486.2005.001075.x, 2005.
Smith, P., Soussana, J., Angers, D., Schipper, L., Chenu, C., Rasse, D. P., Batjes, N. H., van Egmond, F., McNeill, S., Kuhnert, M., Arias-Navarro, C., Olesen, J. E., Chirinda, N., Fornara, D., Wollenberg, E., Álvaro-Fuentes, J., Sanz-Cobena, A., and Klumpp, K.: How to measure, report and verify soil carbon change to realize the potential of soil carbon sequestration for atmospheric greenhouse gas removal, Glob. Change Biol., 26, 219–241, https://doi.org/10.1111/gcb.14815, 2020.
Smith, W. N., Grant, B. B., Campbell, C. A., McConkey, B. G., Desjardins, R. L., Kröbel, R., and Malhi, S. S.: Crop residue removal effects on soil carbon: Measured and inter-model comparisons, Agr. Ecosyst. Environ., 161, 27–38, https://doi.org/10.1016/j.agee.2012.07.024, 2012.
Stockmann, U., Adams, M. A., Crawford, J. W., Field, D. J., Henakaarchchi, N., Jenkins, M., Minasny, B., McBratney, A. B., Courcelles, V. de R. de, Singh, K., Wheeler, I., Abbott, L., Angers, D. A., Baldock, J., Bird, M., Brookes, P. C., Chenu, C., Jastrow, J. D., Lal, R., Lehmann, J., O'Donnell, A. G., Parton, W. J., Whitehead, D., and Zimmermann, M.: The knowns, known unknowns and unknowns of sequestration of soil organic carbon, Agr. Ecosyst. Environ., 164, 80–99, https://doi.org/10.1016/j.agee.2012.10.001, 2013.
Thiagarajan, A., Liang, C., MacDonald, J. D., Smith, W., VandenBygaart, A. J., Grant, B., Krobel, R., Janzen, H., Zhang, T., McConkey, B., Ma, B., Bremer, E., Yang, X., Cerkowniak, D., and Fan, J.: Prospects and challenges in the use of models to estimate the influence of crop residue input on soil organic carbon in long-term experiments in Canada, Geoderma Regional, 30, e00534, https://doi.org/10.1016/j.geodrs.2022.e00534, 2022.
Van-Camp, L., Bujarrabal, B., Gentile, A. R., Jones, R. J. A., Montanarella, L., Olazabal, C., and Selvaradjou, S.-K. (Eds.): Reports of the Technical Working Groups Established under the Thematic Strategy for Soil Protection, Vol. 3: Organic Matter, EUR 21319 EN/3, Office for Official Publications of the European Communities, Luxembourg, 872 pp., https://publications.jrc.ec.europa.eu/repository/bitstream/JRC28868/EUR%2021319%20EN-3.pdf (last access: 28 January 2026), 2004.
Verra: VM0042 Improved Agricultural Land Management, v2.1, https://verra.org/methodologies/vm0042-improved-agricultural-land-management-v2-1/ (last access: 21 October 2025), 2024.
Verra: VMD0053 Model Calibration, Validation and Uncertainty Guidance for Biogeochemical Modeling for Agricultural Land Management Projects, v2.1, https://verra.org/methodologies/vmd0053-model-calibration-validation-and-uncertainty-guidance-for-the-methodology-for-improved-agricultural-land-management-v2-1/ (last access: 21 October 2025), 2025.
Wiltshire, S., Grobe, S., and Beckage, B.: A Historically Driven Spinup Procedure for Soil Carbon Modeling, Soil Syst., 7, 35, https://doi.org/10.3390/soilsystems7020035, 2023.
Witzgall, K., Vidal, A., Schubert, D. I., Höschen, C., Schweizer, S. A., Buegger, F., Pouteau, V., Chenu, C., and Mueller, C. W.: Particulate organic matter as a functional soil component for persistent soil organic carbon, Nat. Commun., 12, 4115, https://doi.org/10.1038/s41467-021-24192-8, 2021.
Woolf, D. and Lehmann, J.: Modelling the long-term response to positive and negative priming of soil organic carbon by black carbon, Biogeochemistry, 111, 83–95, https://doi.org/10.1007/s10533-012-9764-6, 2012.
Woolf, D., Lehmann, J., Ogle, S., Kishimoto-Mo, A. W., McConkey, B., and Baldock, J.: Greenhouse Gas Inventory Model for Biochar Additions to Soil, Environ. Sci. Technol., 55, 14795–14805, https://doi.org/10.1021/acs.est.1c02425, 2021.
Zhang, F., Lu, W., and Jin, F.: Chemical Recalcitrance Rather Than Soil Microbial Community Determined Short-Term Biochar Stability in a Poplar Plantation Soil, Forests, 15, 622, https://doi.org/10.3390/f15040622, 2024.