
the Creative Commons Attribution 4.0 License.
the Creative Commons Attribution 4.0 License.
 | 10 Nov 2026
Plant-soil interactions drive GHG dynamics in organic soil under variable water tables: a case study with poplar
Austra Zuševica

Andis Lazdiņš
Dagnija Lazdiņa
Viktorija Vendiņa
Organic soils provide a substantial capacity for carbon storage both in below- and above-ground biomass, but they are also a significant contributor to natural terrestrial greenhouse gas (GHG) emissions. Management of soils with high organic matter content, particularly through drainage and productivity enhancement, often leads to increased CO2 emissions. By monitoring in a controlled environment, it is possible to determine how groundwater level and environmental conditions influence the carbon cycle, including plant vitality and productivity, and consequently shape future carbon sequestration potential.
The aim of this study was to develop a system under semi-controlled conditions to assess the impact of different groundwater levels on GHG emissions, accumulated biomass, and tree vitality. We determined the effects of different groundwater levels: −2; −15; −25; and −35 cm. We monitored CH4 and CO2 autotrophic and heterotrophic emission, soil chemical analyses, and plant morphological (biomass, root and leaf area, shoot length) and physiological (leaf chlorophyll a and b content indices) parameters. Temporal variation strongly impacted GHG fluxes, while diurnal variation in CO2 emissions depended on groundwater level, with a distinct day–night response at −35 cm, whereas no groundwater-dependent diurnal response was detected for CH4. During soil temperature extremes, extremely high CH4 emissions occurred at a −2 cm groundwater level. Higher plant productivity had a greater influence on GHG fluxes: it decreased both CH4 and CO2 emissions during the day compared to bare soil. Therefore, the autotrophic respiration rate increased with increased productivity, but the primary determinant was heterotrophic respiration. The study demonstrates that groundwater level, together with plant productivity and environmental conditions, jointly regulates GHG emissions in organic soil.
- Article
(3072 KB) - Full-text XML
- BibTeX
- EndNote


Organic soils in the hemi-boreal zone have a notable capacity for carbon and nitrogen storage, holding the largest amount of carbon in terrestrial ecosystems (Gorham, 1991; Byrne et al., 2004). However, they are also among the main natural sources of greenhouse gas (GHG) emissions (Gorham, 1991; Fischlin et al., 2007; Jauhiainen et al., 2019). Historically, anaerobic conditions from high water tables and low temperatures in Northern Hemisphere peatlands have allowed thermodynamically unstable peat to persist for thousands of years, primarily regulated by environmental and biological factors rather than its chemical composition or structure (Schmidt et al., 2011; Straková et al., 2012; Buschmann et al., 2020). The course of the development of land management and new drainage techniques in the early 20th century led to an increase in land use change from peatland to agricultural land, peat extraction, and active peatland forest management, thereby also altering the role of organic soil in climate regulation and socio-economical aspects (Bragg et al., 2003; König and Varma, 2006; Joosten, 2010; Kløve et al., 2017). In general, the drainage of peat soils alters peat microbiology promoting soil mineralization, increasing CO2 and N2O emissions, decreasing CH4 emissions, reducing carbon content, and potentially causing leaching of minerals (N, P, Dissolved Organic Carbon (DOC)), all of which can lead to soil compaction and a decrease in primary productivity in the long term (Kasimir-Klemedtsson et al., 2007; Kløve et al., 2017). These changes are primarily driven by alterations in groundwater level, which regulate oxygen availability and microbial activity in soil. Although these are the main threats after peat drainage, studies show that whether the ecosystem on organic soil acts as a carbon source or sink is significantly determined by local environmental conditions, vegetation, hydrological condition, chemical and physical properties of peat, and thickness of different peat layers, density and humification level, bedrock composition, and the history of peat accumulation (Mustamo et al., 2016).
Global warming potential (GWP) on drained peat soils can be reduced through reclamation or recultivation, with the choice depending on various factors such as geology, chemical composition, as well as local socio-economic aspects (Hytönen et al., 2020). Poplars are fast-growing, early-successional alluvial species whose growth is highly dependent on water availability and precipitation, and they have previously shown good performance on peat soil if the pH level is optimal (Rytter et al., 2016; Adler et al., 2021). Populus maximowiczii Henry × P. trichocarpa Torr. & Gray hybrid “OP42” is one of the most widely used poplar clones in Europe, and it has good biomass accumulation performance as well as being easy to reproduce with stem cuttings (Rytter et al., 2016; Adler et al., 2021; Ranjan et al., 2022). Poplar has been a significant source of renewable raw materials, and its importance and interest as an alternative energy source to fossil fuels have grown along with the resolution of the energy crisis in many European countries (Kożuch et al., 2023). Due to clonal rank stability, individual response variation to environmental factors in OP42 grown from stem cuttings is limited, while still being phenotypically plastic to biotic and abiotic factors, which makes it a valuable object of study to investigate the external effects on plant growth and physiology (Adler et al., 2021; Nelson et al., 2018; Vanden Broeck et al., 2018).
To understand the carbon cycle and determine an ecosystem's carbon sink, it is essential to evaluate the accuracy of methods used to estimate GHG emissions. CO2 soil emissions, or total soil respiration (TR), consist of two components: heterotrophic respiration (HR), resulting from microbial decomposition and mineralization of soil organic matter, and autotrophic respiration (AR), from roots, mycorrhizae, and rhizosphere-associated microorganisms (Hanson et al., 2000). Although the accuracy of detecting CO2 emissions is high nowadays, the division of emissions into AR and HR faces several challenges. A key issue is the difficulty in accurately determining HR under field conditions, as the widely used methodology may introduce errors. For instance, the contribution of roots from adjacent vegetation, such as vascular and woody plants extending into the plot, may lead to an overestimation of HR emissions (Jauhiainen et al., 2019). Trimming the root system at the perimeter of the plot can improve this methodology but does not fully resolve the issue and may also have an indirect effect on soil emissions (Jauhiainen et al., 2019). The determination of AR also faces challenges, as microorganisms involved in AR processes can also participate in HR processes. Given the close relationship between the two components of soil respiration, and considering that AR is largely governed by plant physiological activity, carbon allocation, and root–soil nutrient exchange, vegetation structure and vitality play a significant – yet often underestimated – role in regulating overall soil respiration (Haydon et al., 2013; Oertel et al., 2016; Tang et al., 2020). In addition, plants also indirectly affect CH4 emissions through their participation in production and transport (Bastviken et al., 2023), while the diurnal and monthly regulation of each system component – such as plant, microbial, and fungal activity – should also be considered (Harmer et al., 2000; Sander and Wassmann, 2014; Zhao et al., 2021).
The effect of both the above- and belowground plant parts on carbon cycling is critical for evaluating the overall carbon cycle in an ecosystem (Ojanen et al., 2014). Determining HR and AR separately under natural conditions may encounter various parallel influencing factors; controlled conditions would help avoid errors, such as the presence of living roots in HR measurement plots. We conducted research under semi-controlled conditions to investigate the differences between undrained shallow-drained and deep-drained conditions in organic soil, focusing on water table level effect on vegetation physiological performance and GHG exchange. This study addresses the following research questions: (1) Do plant-productivity parameters, such as chlorophyll concentration indices and plant morphological and biomass parameters, explain changes in soil respiration rate trends under different groundwater levels; (2) How do autotrophic and heterotrophic respiration vary temporally and diurnally?
2.1 Study site and experimental design
The experiment was conducted under semi-controlled condition in greenhouse in the Latvian State Forestry Research Institute “Silava” (N 56°87008100 E 24°34746500) from mid-April to early July 2023 (Table 1). Daylight length was not controlled and were consistent with natural conditions in the region. The average air temperature in the greenhouse was 7.6 °C higher during the day and 5.7 °C higher at night than outside ambient. An automatic greenhouse ventilation system was used to limit the risk of plant overheating during hot weather conditions. No irrigation system or fertilization of any kind was applied during the study period.
Table 1Monthly and diurnal environmental conditions in study site.

D – day N – night (Daylength: in April from 06:15 AM till 20:30 p.m. total 14 h 15 min; in May from 05:00 a.m. till 21:30 total 16 h 30 min; in June from 04:30 a.m. till 22:20 total 17 h 50 min).
Water regulation system was installed inside each of the five hydroisolated boxes at four different levels depending on the depth from the soil surface and representing different drainage levels: no drainage (−2 cm), shallow drainage (−15 cm, −25 cm), and deep drainage (−35 cm). All levels, except no drainage (−2 cm), was installed in one repetition. No drainage group (−2 cm) was installed in two repetitions, because it also included one box with two sections for mineral soil and peat soil control. Soil boxes was designed to fit inside water boxes () (Fig. 1). In the middle of the box there was separation wall to create two sections – with and without vegetation under the same groundwater level (one section size: ) creating 10 sections in total. In eight section four bare substrate sections and four sections with vegetation were installed. Additional two control sections were installed: one section with peat and one section with mineral soil. In the lower part of the box nine round holes (R=2.5 cm) through the outer walls for water circulation was made. To prevent soil entering the water box geotextile fabric was placed over the holes inside the soil box.

Figure 1Experimental design. (A) Water level box with two sections for bare soil and vegetation plot; (B) gas measurement chambers on soil installed in soil boxes.
Organic soil substrate was placed inside each section of the boxes. Soil was collected from the study site in Skrīveri Municipality, on a plantation forest located on former agricultural land with mineral soil (Luvic Stagnic Phaeozem Hypoalbic and Mollic Stagnosol). The soil was collected separately from two depths: 0–30 cm and 30–50 cm, in March 2023. Mineral soil was supplemented with organic substrate (neutralized fine peat fraction, 0–7 mm, pH/KCl 5.1–6.1) to achieve the organic matter content (at least 20 %) required for organic soil (Nikodemus, 2008). The substrate was mixed in a 1:1 volume ratio and 1.3:6.5 mass ratio for peat and mineral soil. Soil from each depth was mixed separately and installed in the boxes at their respective source depths (Table 2). Same mineral soil and peat ratio was used for all section, except the fifth box with control. To determine this systems effectivity to detect GHG from different soils, one control section for each mineral soil and peat was installed in the box with highest water level (Figs. A1 and A2).
Table 2Soil chemical analyses for substrate used in experiment.

K, C, Mg values are HNO3 extractable.
For planting material, perennial grassland species Festuca ovina and vegetative stem cuttings of the poplar clone OP42 (Hybrid 275 NE 42, P. maximowiczii × trichocarpa) were chosen to create plant composition similar to a poplar plantation. For F. ovina, optimal seedling rate is 200–400 kg ha−1, we selected the minimum optimal rate of 200 kg ha−1 and calculated the required mass (Sm) for one soil box section () which was 5 g.
OP42 Stem cuttings were prepared from approximately 1 cm (±0.2 mm) thin stem sections with leaf buds. Stems were cut into 20 cm long sections and placed in water for at least 24 h. Before planting, all other buds were removed, leaving only the upper one. Cuttings were planted in the soil up to the upper leaf bud line, with five cuttings per soil box. Both F. ovina seeds and poplar cuttings were seeded and planted in one section of each soil box, creating one section with bare soil and one with developing vegetation cover. Seeding and planting were carried out on 14 April, two weeks before the first gas measurement.
For gas measurement, ten hermetic gas sample chambers were constructed (), one for each soil box section. The chamber closing system was automated, with pneumatic hinges connected to an air compressor (Oil-free Air, LZ 7–10, Atlas Copco) and regulated by custom made Syntpot application (v9.2.1001.19, https://www.4industry.lv/en/projects/control-of-gas-analyzer-and-10-chambers-with-flushing/, last access: 24 March 2021 – 09:52:05 LT). A sealing ribbon was applied to the closure edges to prevent airflow during measurements. The spectrometer was connected to each chamber through inlet and outlet gas sample pipes located 10 cm above the soil surface, with the pipe ends secured by air filters (Minisart, 0.45 µm, Sartorius AG, Göttingen, Germany) to prevent soil particles from entering the system.
2.2 Measurements and data collection
A near-infrared spectrometer (NIRS) OMEGA 5 (Bruker, Billerica, Massachusetts, United States) was used to measure GHG emissions, including methane (CH4), carbon dioxide (CO2), and water vapor (H2O). Measurements were operated via the OPUS GA software program. Gas concentrations (CO2, CH4, and H2O) were quantified using OPUS GA and the B-GAS-LIBRARY. Gas temperature and pressure were continuously recorded and accounted for during quantification. The OMEGA 5 was equipped with DryPath™, which maintained a low H2O background (<10 ppm H2O), while interference from H2O and other gas compounds was accounted for during spectral analysis. OPUS GA provides calibration-free quantification based on universal reference spectra, and the DryPath™ configuration provides H2O and CO2 quantification limits in the single-digit ppm range. The spectrometer analysed one chamber at a time, completing a full measurement cycle across all ten chambers. Before measurements, chambers, tubing, and connections were checked for leakage and proper sealing. To enable continuous measurements, an automated repeating programme mode (total duration: 5 h 3 min) was created:
-
Pause (90 s),
-
Background measurement (48 s),
-
Pause (42 s),
-
Time series (19 620 s),
- 4.1.
Analyzer ventilation (180 s),
- 4.2.
Chamber analysis (1800 s).
- 4.1.
Each chamber measurement (1800 s) sampled gas every 6 s, totalling 300 measurements. GHG samples were collected in six measurement periods (Table 3).

GHG fluxes were calculated using FluxCalR (Zhao, 2019) according to , where vol is chamber volume, R is the universal gas constant, Ta is ambient room temperature, area is chamber base area, and is the rate of change in gas concentration over time determined using linear regression (Zhao, 2019). Atmospheric pressure was set to the FluxCalR default of 1 atm. A 15 min fitting window was used, with FluxCalR selecting the optimal linear regression based on the highest R2, retained flux estimates had R2≥0.76. CH4 and CO2 fluxes were expressed in . The bare-soil plots represented heterotrophic respiration, whereas the difference between the vegetation and bare-soil plots was calculated as autotrophic respiration. GHG emission data were categorized into day and night measurements based on diurnal time (Sunrise and Sunset Times API, 2023).
Soil temperature was monitored for each soil box section with temperature sensor plugs (±0.5 °C) at 10 cm depth (Plug&Truck by Progres Plus Willems France). The temperature sample rate was 5 min for multiple periods during the study time: (1) 28–30 April; (2) 8–18 May; (3) 22–29 May; (4) 8–15 June; (5) 21–26 June; (6) 28 June–1 July. The chlorophyll a (Chl a) and chlorophyll b (Chl b) content indices of the leaves was measured by a non-invasive method using a near-infrared “The SpectraVue” leaf spectrometer (CID Bio-Science Camas WA USA). Measurement of Chlorophyll Content Index (CCI) started when first fully developed leaves were observed. In total, nine weekly measurement campaigns were conducted (28 April; 11 May; 23 May; 31 May; 8 June; 16 June; 22 June; 26 June; 28 June). During each campaign, 10 measurements were taken from newly developed leaves (first 5–10 leaves from visual observation) for each group, resulting in a total of 40 chlorophyll measurements per week. Measurements with a near-infrared leaf spectrometer was carried out in the morning hours (09:00–11:00), to avoid heat stress hours.
At the end of the experiment (3 July) plant morphologic data were collected. Fresh and dry biomass (dried at 70 °C for four days, 96 h) was measured for different poplar plant parts (roots, stem, leaves) and F. ovina aboveground parts (Tables A1 and A2). Additionally, the number of leaves per poplar and shoot stem length were recorded. Total leaf area for each OP42 individual was determined by scanning all leaves using the “WinFolia2019” software (Regent Instruments Inc., Québec City, QC, Canada). Specific Leaf Area (SLA) was calculated as the ratio of leaf area to dry mass. Root area (mm2) and volume (mm3) were measured in three root diameter classes (0.5–1.5, 1.5–3, >3 mm) using the “WinRhizo2019” software (Regent Instruments Inc., Québec City, QC, Canada).
After the experiment, soil analyses were conducted for each soil box section at three depths (0, 20, and 40 cm) using the “Soil Sampling Ring Kit-Model C53” (Royal Eijkelkamp, Giesbeek, Netherlands) (Table A3). Sample preparation followed the standard LVS ISO 11464:2006 requirements. Moisture, pH, N, P, K, Ca, Mg, and total C content were determined. Soil moisture analysis was performed using analytical scales (“Sartorius AX224”) and a laboratory dryer (“BMT Ecocell 55”) (LVS ISO 11465:2002). Total C and N content in the substrate and leaves were determined using the elemental analyser “Elementar El Cube” (Elementar, Langenselbold, Germany), while total P content was measured with the spectrometer “Shimadzu UV-1900” (Shimadzu, Kyoto, Japan) (LVS ISO 10694:2006 L; LVS ISO 13878:1998; LVS 398:2002 L). Substrate pH was determined using the pH meter “Adrona AM 1605” (Adrona, Riga, Latvia) (ISO 10390:2021). K, Ca, and Mg concentrations were analyzed using an Inductively Coupled Plasma Optical Emission Spectroscopy (ICP-OES) spectrometer (“Thermo Fisher Scientific iCAP 7200 Duo”, Thermo Fisher Scientific, Waltham, US) (LVS EN ISO 11885:2009).
2.3 Data analyses
We used the R-Studio software package for data analysis and visualization (R Core Team, 2026). Before all analyses, we examined potential outliers and performed the Shapiro–Wilk test for normality and the Breusch–Pagan test for homoscedasticity. For plots with error bars, we used the standard error (SE), as most visualizations depict mean value differences within groups. To determine the effect of groundwater level on plant parameters, we applied one-way ANOVA for parametric data (total biomass, above-ground biomass, stem length, and SLA) and the Kruskal–Wallis test for non-parametric data (below-ground biomass). Tukey's HSD and Dunn's was followed as post-hoc tests to assess differences between groundwater level groups. Root volume as a function of groundwater level and root diameter class were analysed using two-way ANOVA with Tukeys HSD post hoc test. Although both Chl a and Chl b data were homoscedastic, they were not normally distributed; therefore, we used the Kruskal–Wallis test to assess concentration differences between groundwater levels and to compare linear regression models. Groundwater level and week of the year were incorporating as factors. We further performed linear regression with the week of the year as an indicator variable for each groundwater level to evaluate the significance of weekly measurements, as no clear non-linear pattern was observed.
For GHG emission analyses, we built a linear mixed-effect model to determine which factors had the most significant impact on emissions. The model included the date as a random factor, and the soil and vegetation boxes, groundwater level, month, daytime and night time soil temperature, room temperature, moisture, and CO2 concentration as fixed factors Eq. (2):
After the results of the model, we created additional models to examine the interaction of significantly influencing factors with groundwater level Eq. (3):
We performed further analysis on categorical factors that significantly impacted vegetation parameters (vegetation groups, and day and night time). We also performed regression analysis with continuous factors, soil temperature, because it had a significant effect on emissions. To further assess diurnal variability, CH4 and CO2 emissions were analysed by grouping daytime observations into temperature-defined intervals (<20, 20–25, >25 °C) across experimental periods, and differences between vegetation treatments were evaluated using the Wilcoxon rank-sum test (Figs. 7 and 8). For data analysis, calculation, and visualization, we used several RStudio packages: “dplyr”, “ggplot2”, “gridExtra”, “dunn.test”, “tidyverse”, “ggpmisc”, “lme4”, “MuMIn”, “car”, and “ggpubr” (Aphalo, 2026; Auguie, 2017; Bartoń, 2026; Bates et al., 2015; Dinno, 2017; Fox et al., 2026; Kassambara, 2026; Wickham, 2016; Wickham et al., 2019, 2026).
3.1 Poplar trait responses to water table depth
Total above-ground dry biomass and stem length were larger starting from −15 cm and lower groundwater levels but did not show significant differences between shallower groundwater depths (Fig. 2) (Table A4). The exception was root biomass, which was higher at a groundwater level of −25 cm but decreased at −35 cm. However, as this was the very early stage of plant development, root mass differences did not influence total biomass trends. On average, root wet and dry biomass accounted for only one-seventh of the total accumulated biomass in new poplar plant parts (stem and leaves vs. root ratio – fresh biomass 6.1, dry biomass 6.2) (Table A4). Groundwater levels from −15 to −35 cm did not show significant differences. However, with an increased sample size, −35 cm groundwater could demonstrate better performance in biomass accumulation, as the plots exhibited a trend of biomass gradually increasing with decreasing groundwater level.

Figure 2Plant dry biomass and length parameters: (a) total accumulated biomass, (b) above-ground biomass, (c) below-ground biomass, (d) stem length, and (e) plants at the end of the experiment (12 weeks after planting). The y-axis scale is not uniform across all biomass plots; the continuous line in subplots (a) and (b) indicates the y-axis limits for subplot (c). Letters represent significant differences (p<0.05, Tukey HSD for a, b, c, d). Error bars indicate SE.
Lateral roots with a diameter above 3 mm occupied the largest root volume starting from −25 cm groundwater level and higher in groups with −25 and −15 cm occupying a significantly larger volume than smaller roots (Fig. 3) (Table A5). The volume of lateral roots was significantly lower in the −35 cm variant although the volume of fine roots was not significantly different from the −25 cm and was higher than in the −15 and −2 cm levels (Table A5). Total leaf area was greatest at the lowest groundwater level, but differed significantly only from the highest groundwater level (Table A6). SLA was higher at the highest water level but not different at the other levels (Table A6).

Figure 3(a) Root volume depending on root diameter size, (b) total leaf area, (c) specific leaf area (SLA). Letters represent significant differences (p<0.05, Tukey HSD). Error bars indicate SE.
Chl a and Chl b concentrations indices varied substantially between weeks and, although significantly different from a normal distribution, the data were homogenous (Fig. 4). The non-normal distribution could be related to relatively long intervals between measurement times and a small number of measurements (average 7 d intervals, 10 measurements for each group). The average results for Chl a and Chl b concentrations did not differ significantly depending on the groundwater level, but when the time factor was included in the analysis, the relationship became significant (Table A7). Across all groundwater level groups, peak Chl a concentration index were observed in weeks 18, 25, and 26, while peak Chl b concentration index occurred in weeks 18, 23, 25. This highlights the importance of seasonal variation and plant development phases on chlorophyll concentration in the leaves. At the lowest groundwater level, the most pronounced decreases in Chl a (R2=69) and Chl b (R2=64) concentration indices in the leaves were observed. These regression trends indicate general temporal patterns rather than strict linear relationships.

Figure 4Chlorophyll A (a) and Chlorophyll B (b) content indices across sampling weeks. Error bars indicate SE.
3.2 Water table depth influence on respiration
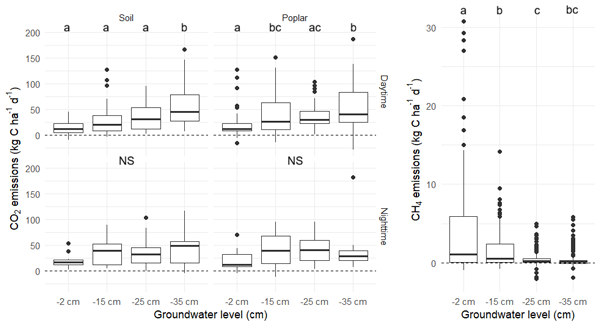
Linear mixed effect model showed that CO2 emissions were impacted by groundwater level: significantly lower at the −2 cm groundwater level and higher at the −35 cm groundwater level (Fig. 5). At the lowest groundwater level, CO2 emissions also differed between day and night time (p=0.009) and between the poplar and bare soil groups (p=0.015) being higher during the day and lower during the night. The difference was more notable in the plots with vegetation. Although the lowest groundwater level had significantly higher emissions during the daytime, there were no significant differences compared to the other levels during the night time. CH4 emissions were not impacted by vegetation or time but were significantly higher at higher groundwater levels (Table A8). Low room air moisture and high soil temperature increased CH4 emission (Table A8). Nevertheless, the regression analyses indicated that the highest groundwater level was the most sensitive to changed soil temperature. Extremely high CH4 emissions (<10 000 ) occurred together with extremely high soil temperatures (<23 °C) (Fig. 6). However, the coefficient of determination (R2) indicates that soil temperature explains only a moderate proportion of the variability in CH4 emissions, suggesting that additional environmental and biological factors also contribute to the observed patterns.

Figure 5CO2 emissions depending on daytime in groups with bare soil or with vegetation cover (poplar and Festuca) and CH4 emissions depending on water table depth.

Figure 6Regression analyses of CH4 emissions in relation soil temperature at different groundwater levels.
Temporal variation in CH4 emissions, as indicated by the linear model, showed a near-significant effect (p=0.054). A rapid increase in mean CH4 emission values was observed between 28 April–16 May and 12 June–1 July, with notably higher emissions in the latter period due to increased temperatures during the peak of the growing season (28 April–16 May , SE 0.001 (); 12 June–1 July , SE 0.024 ()) (Fig. 7). In the last period, differences between bare soil and vegetation were most pronounced in the −35 and −25 cm groups, where higher plant productivity coincided with lower CH4 emissions (Table A4). CO2 emissions increased between 28 April–16 May and 12 June–1 July across all bare soil treatments (28 April–16 May , SE 0.397 (); 12 June–1 July , SE 0.383 ()). However, in vegetation-covered treatments, this increase was observed only at −15 and −2 cm groundwater levels or in groups with lower productivity (Fig. 8).
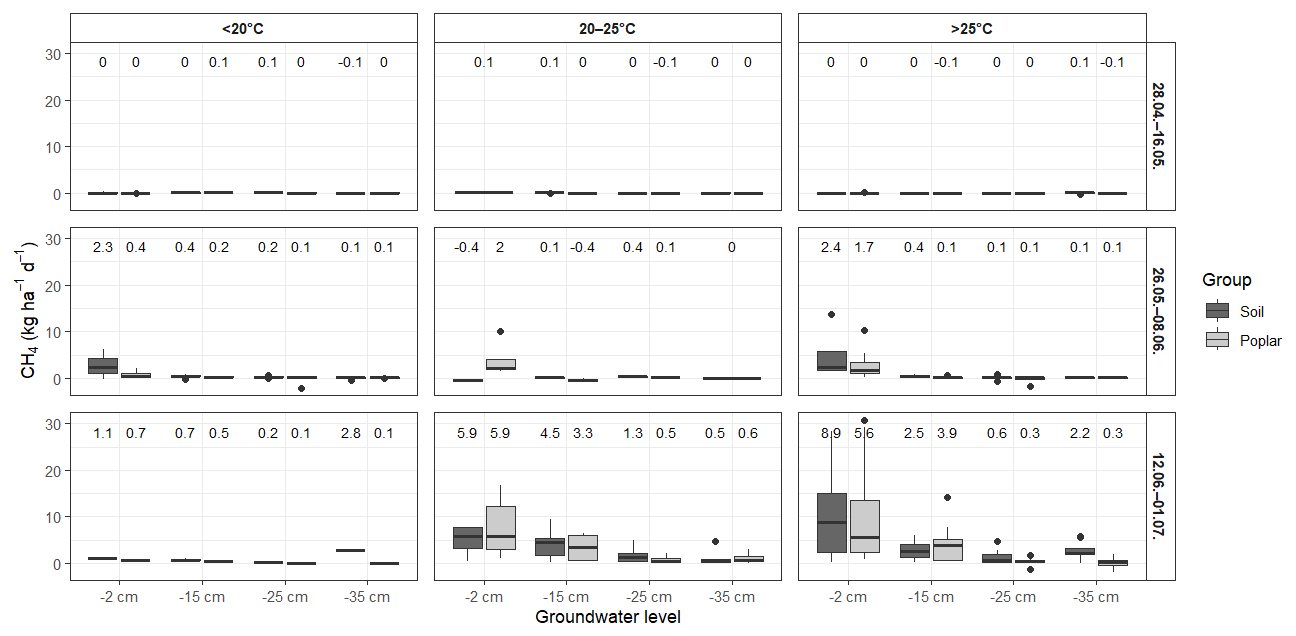
Figure 7Diurnal variability of CH4 emissions across temperature ranges, groundwater levels, and experimental periods.

Figure 8Diurnal variability of CO2 emissions across temperature ranges, groundwater levels, and experimental periods.
Temperature-defined intervals (<20, 20–25, >25 °C) during daytime influenced emission rates in both bare soil and poplar sections. CH4 emissions remained low and relatively stable during the first period, regardless of temperature range, but increased substantially in later periods, particularly under higher temperatures (>25 °C) and at higher groundwater levels (−2 cm) (Fig. A3). In contrast, CO2 emissions exhibited greater variability across all temperature ranges and periods, with no consistent pattern attributable solely to temperature (Fig. A4). Differences between vegetation and bare soil treatments were inconsistent across temperature classes, and median values frequently overlapped, indicating that short-term temperature fluctuations during daytime did not produce a clear or systematic effect on GHG fluxes. Instead, the observed variability suggests that diurnal temperature conditions interact with seasonal progression and groundwater level rather than acting as an independent controlling factor.
The heterotrophic and total respiration ratio increased with decreasing groundwater level, indicating that the rise in respiration at lower groundwater levels was primarily driven by heterotrophic respiration, as supported by the data showing no significant differences in accumulated biomass and chlorophyll concentration indices between −15 and −35 cm groundwater depths (Table 4).
Table 4Ratio of average heterotrophic and total soil respiration under different groundwater level.

Factors positively correlated with CH4 emissions showed a negative correlation with CO2 emissions (Fig. 7). CO2 emissions were positively correlated with most plant parameters, particularly total accumulated biomass in both above- (r=0.857) and below-ground plant parts (r=0.649). CH4 emissions were positively correlated with SLA (r=860) and Chl a (r=0.711) and Chl b (r=0.797) content indices in leaves.
4.1 Poplar trait responses to water table depth
Results showed that using this study design with deep drained conditions (−35 cm), accumulated dry biomass in both above- and below-ground parts, total leaf area, and shoot length were higher. Poplars are a species highly dependent on water availability in the soil and drought conditions can limit growth, but the results of this study suggest that overly moist soil, as observed in shallow-drained conditions (−15 cm), can decrease productivity at the young seedling growth stages. Although the optimal and stress threshold water table levels differ depending on the stage of maturation, similar patterns of decreasing growth under excessively high moisture are also observed in adult trees (Semerci et al., 2017). The most active water and dissolved nutrient uptake by the roots takes place in the region of maturation after the meristematic and elongation zone where both root hair and vascular tissue have formed, but no accumulation of suberin and lignin has occurred in the cell walls of the vascular tissue (Calvo-Polanco et al., 2021). However, under conditions of intense transpiration water uptake can also occur in the root zone with fully differentiating cells (Frensch et al., 1996). Although root water uptake is a passive process it is negatively affected by low O2 and high CO2 and transpiration inhibitors while transpiration is negatively correlated with high humidity (Else et al., 2001). It is important to emphasize that although with increasing transpiration rate from poplar leaves, increases stomatal conductivity and photosynthetic rate, the first growth limiting factor is root absorption capacity therefore the volume and area of the active root region (Zhang et al., 2005). But nutrient absorption through roots is also partly regulated by light and diurnal rhythms (Zhao et al., 2021). Lateral root biomass in the deep-drained group was smaller than in shallow drained group. However, the higher total biomass and leaf area supports previous findings that roots smaller than 3 mm are primary responsible for water and nutrient uptake. This indicates that total plant belowground volume may not have strong correlation with tree transpiration rate or overall productivity.
Another productivity indicator is plant greenness or photosynthetic pigment content. The higher chlorophyll content per unit area the higher the light absorption. As a result, the rate of photosynthesis can increase if the other limiting factors are optimal – water and nutrient availability temperature. Poplars with higher chlorophyll content in leaves have later senescence higher productivity and longer growth period (Adler et al., 2021). On the other side the total plant photosynthetic capacity is dependent on both: chlorophyll content and photosynthetic (mostly leaves) area therefore the higher pigment content does not always indicate higher plant vitality and needs to be analysed in the context of other plant traits. As the groundwater level decreases the amount of photopigment content increases in poplar leaves. But after reaching the optimum water level the content decreases. Therefore chlorophyll content does not correlate with soil moisture, but with plant capacity to absorb the nutrients (Zhang et al., 2022). This suggests that the optimal water level of OP42 could be even lower as the amount of photosynthetic pigments continues to increase as the considered groundwater levels decrease. The highest Chl a and Chl b content indices at the beginning of the measurement was in the −2 cm group, but this group also had the most rapid decrease. Chlorophyll content for healthy vegetative cutting propagated poplars increases after leaf initiation until maturation and decreases towards the end of the growing season, starting from the middle or end of August (Castro and Sanchez-Azofeifa, 2008; Marron et al., 2008). A faster decrease of leaf photosynthetic pigment content can indicate stress factors for plant growth. In this case – poplar grown at a high groundwater level did not form a functional root system which could result in small leaf formation at the beginning of plant growth, resulting in higher photosynthetic pigment density per area. The rapid decrease in photosynthetic pigment content later can indicate that saved nutrient in cutting had been used and due to the lack of root system no new uptake occurs. In field conditions, the differences between chlorophyll content depending on groundwater level could be higher. Chlorophyll content in plant leaves grown in a greenhouse tends to be smaller compared to the field conditions as greenhouse transmit only 30 %–80 % of light depending on cloudiness which has negative effect on photosynthetic pigment synthesis (Farré and Weise, 2012; Cabrera-Bosquet et al., 2016; Poorter et al., 2016; von Elsner et al., 2000).
4.2 Water table depth influence on respiration
Both CH4and CO2were primarily influenced by groundwater level, CO2 had increased emissions with decreasing groundwater level, but significant CH4 emissions occurred only in shallow drained or undrained conditions (above −15 cm water level), but not in deep drained (below −25 cm). Similar results described in field studies for CH4, where its seasonal variation is 78 % explained by groundwater level (Klemisch and Pfadenhauer, 2002). It is well known that high groundwater level has a positive correlation with CH4 emission due to the need for an anaerobic environment for methanogen microorganisms, but flooded organic soils can be significant for both CO2 (967 ) and CH4 (435 ) emission sources (Butlers and Lazdiņš, 2022). In this study, the −2 cm groundwater groups CO2 emission during the beginning of May was approximately 350 , but in June increased by about 970 . For CH4 during the beginning of May emissions were only 16 , but in June increased up to 5838 , showing the very high variation only in two month period due to the high-temperature variation.
The high CO2 and CH4 temporal variation during the year also can be seen in other studies, where CH4 emissions are reported to be minor during the winter frost period, but during the first part of the growing season peaks of emission can occur (Chapman and Thurlow, 1996; Maljanen et al., 2004; Viru et al., 2020). Vegetation influence was negligible with high groundwater level and low productivity, but with lower groundwater level and higher productivity CH4 emissions were lower (up to 460 ) compared to the bare soil (up to 1366 ). This indicates the vegetation negative influence on solar radiance and resulting temperature impact on soil due to the higher albedo than bare peat soil (Tuittila, 2000). Similar results with higher CH4 uptake in soils with vegetation are also documented in field studies (Maljanen et al., 2004). On a temporal scale plant cover also helped to decrease CO2 emissions, as emission from bare organic soil increased both in day and night comparing May and June emissions. However, CO2 emissions decreased with vegetation in June during daytime, when, due to the higher temperature, photosynthetic rate and carbon assimilation was higher than in May (Domingo and Gordon, 1974). This, however, is strongly regulated by the composition of vegetation and plant species-specific photosynthetic regulation. Poplar has a tendency to reduce photosynthetic rate during extremely high air temperatures (Song et al., 2014). This is regulated by local clone adaptation – clones selected in southern regions have a higher temperature tolerance threshold than those selected in northern regions (Benomar et al., 2018). Whilst in this study we gain insight that decreased photosynthetic rate due to temperature extremes may play an additional role in peak emission events, more studies with improved design are needed to decrease the risk of overinterpretation of these results. Although we could observe plant productivity influence on total ecosystem respiration, especially with lower groundwater levels, the proportion of heterotrophic respiration increased with decreasing groundwater levels, indicating, that ecosystem respiration is primarily controlled by microorganism activity regulated by groundwater level and temperature. The initial substrate, and therefore the microbial communities, were identical in both the poplar and bare soil sections. However, shifts in microbial composition may have developed over time and were not controlled for in this study. Such changes, although reflected in heterotrophic respiration and not directly attributable to autotrophic processes, are likely influenced by plant presence and would not occur in the absence of vegetation. Therefore, part of the observed emission increase can still be considered an indirect effect of plant cover, potentially leading to an overestimation of autotrophic respiration.
The temperature influence on heterotrophic respiration can also be seen in the results, that for lower groundwater level, the CO2 emission rate was significantly higher with lower groundwater levels during daytime, but no statistical differences were observed during nighttime. This indicates that measuring emission only at certain times during the day can lead to overestimation of the total emissions (Brændholt et al., 2017). The temperature had a positive effect, but air moisture negative effect on CH4 emissions, in addition, extreme CH4 emissions only occurred with extremely high soil temperatures. This should be considered for future management practices, that increasing summer temperature extreme events every year in the hemiboreal zone generates the threat of increased emission extremes and that plant cover can limit these events.
4.3 Experimental design, greenhouse conditions, and implications for future climate scenarios
Although the greenhouse environment creates limitations for the experiment since it is not possible to directly explain the natural processes with the obtained results, it can be used as a useful tool to accurately understand the trends and interactions of the factors under consideration to improve the fundamental knowledge base about the carbon cycle in nature. Either in greenhouse or in field conditions, light quantity, CO2 concentration, air humidity, and air and soil temperatures have medium to high diurnal variability, although air temperature and humidity have higher variability in field conditions than soil temperature in greenhouse conditions (Poorter et al., 2016). The high diurnal variability of soil temperature in greenhouse experiments usually occurs due to the small container size as well as the material used, typically dark-coloured plastic. In this experiment with a relatively large vegetation vessel volume constructed from wood products, we succeeded in not overcoming the average diurnal variation of the soil temperature at a 10 cm depth by more than 1 °C (Table 1) which is close to the average variation in field conditions – 1.2 °C (Bell et al., 2013; Poorter et al., 2016). Greenhouse conditions also provide higher air temperature and moisture which significantly affect plant-soil interactions. In the context of tree growth in temperate climate zone higher air temperature can increase the photothermal ratio and extend the growth period for tree species in which dormancy is regulated by both photoperiod and temperature including poplar (Domingo and Gordon, 1974; Kalcsits et al., 2009). Nevertheless, temperature and moisture are also some of the main influencing abiotic factors of soil emissions and will influence both levels individually as well as their interaction. The future forecast in this region predicts higher air and soil temperature as well as higher air humidity therefore it could be beneficial to carry trails in this direction modified environmental conditions.
A limitation of this study is the relatively short observation period, which does not capture full seasonal variability in greenhouse gas emissions. The absence of measurements across different seasons limits the direct representation of annual emission dynamics, and that observations restricted to the active growing period are likely to overestimate annual emissions due to the exclusion of low-emission periods such as winter (Jentzsch et al., 2024). Therefore, the greenhouse setup provides a suitable framework to isolate key drivers and test hypotheses at a smaller scale, which can subsequently be evaluated under field conditions to assess their applicability in natural ecosystems.
With this experiment design we partly decreased the limitations of greenhouse experiments: variation of soil temperature (with large volume vegetation vessels and material choice) and no inter-species competition (with OP42 an F. ovina combination (Thomas and Lang, 2020)). However, higher air temperature and humidity compared to field conditions were not controlled, thereby creating conditions that resemble future climate scenarios. The experimental design included only one vegetation vessel per groundwater level, subdivided into vegetated and bare soil sections, resulting in limited replication. This constraint was due to technical limitations and reflects the pilot nature of the study, which aimed to identify initial differences between treatment groups. Consequently, the results should be interpreted with caution, and future studies should incorporate increased replication to strengthen statistical robustness.
Poplar is an alluvial species, but soggy soil conditions inhibit root system formation, which leads to inefficient nutrient absorption and decreases photopigment synthesis and overall plant productivity. Plant vitality indicators need to be analyzed in groups because specific environmental conditions can have different effects on these parameters. The relationships are not always linear, which can lead to false conclusions when looking at a parameter outside the overall context. For example, physiological parameters, such as leaf chlorophyll content indices alone, do not indicate the overall vitality of the tree. The root absorption capacity is critically limiting factor for plant growth, which is determined not by root mass but by root active region volume and area, as well as soil conditions. Temporal and diurnal variation impacts GHG fluxes due to the changes in temperature, moisture, and plant growth activity. Higher temperatures increase both CO2 and CH4 emissions; the most notable impact was for extremely high soil temperatures on CH4 emissions at a −2 cm groundwater level. Air moisture had a negative relationship with CH4 emissions. Higher plant productivity had a higher influence on GHG fluxes: it decreased CH4 emissions as well as CO2 emissions during the day compared to the bare soil. Therefore, the autotrophic respiration rate increased with increased productivity, but the primary determinant was heterotrophic respiration, as its proportion of total respiration increased with decreasing groundwater level. Although the greenhouse environment and limited vessel-level replication constrain the interpretation of the experiment, this semi-controlled system can provide a useful tool for investigating plant–soil–GHG interactions when these limitations are addressed in future experimental designs.

Figure A1CO2 emissions depending on daytime in control groups of peat and mineral soil, and groups with mixed bare soil and vegetation cover (poplar and Festuca) during different time periods. The numbers indicate median value.

Figure A2CH4 emissions depending on daytime in control groups of peat and mineral soil, and groups with mixed bare soil and vegetation cover (poplar and Festuca) during different time periods. The numbers indicate median value.

Figure A3CH4 emissions depending on daytime in groups with bare soil or with vegetation cover (poplar and Festuca) during different time periods. D – day N – night (Daylength; in May form 05:00 a.m. till 21:30 total 16 h 30 min; in June form 04:30 a.m. till 22:20 total 17 h 50 min). The numbers indicate median value.
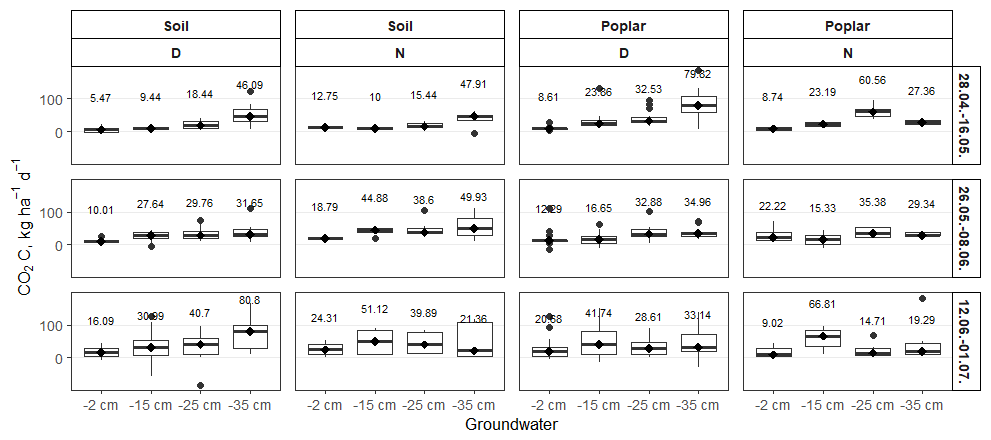
Figure A4CO2 emissions depending on daytime in groups with bare soil or with vegetation cover (poplar and Festuca) during different time periods. D – day N – night (Daylength; in May form 05:00 a.m. till 21:30 total 16 h 30 min; in June form 04:30 a.m. till 22:20 total 17 h 50 min). The numbers indicate median value.
Table A1Fresh and dry biomass of Festica ovina and its impact on total accumulated plant biomass.

Table A2Water content depending on plant part (g of water per g of dry mass).

Table A3Soil chemical composition after experiment.
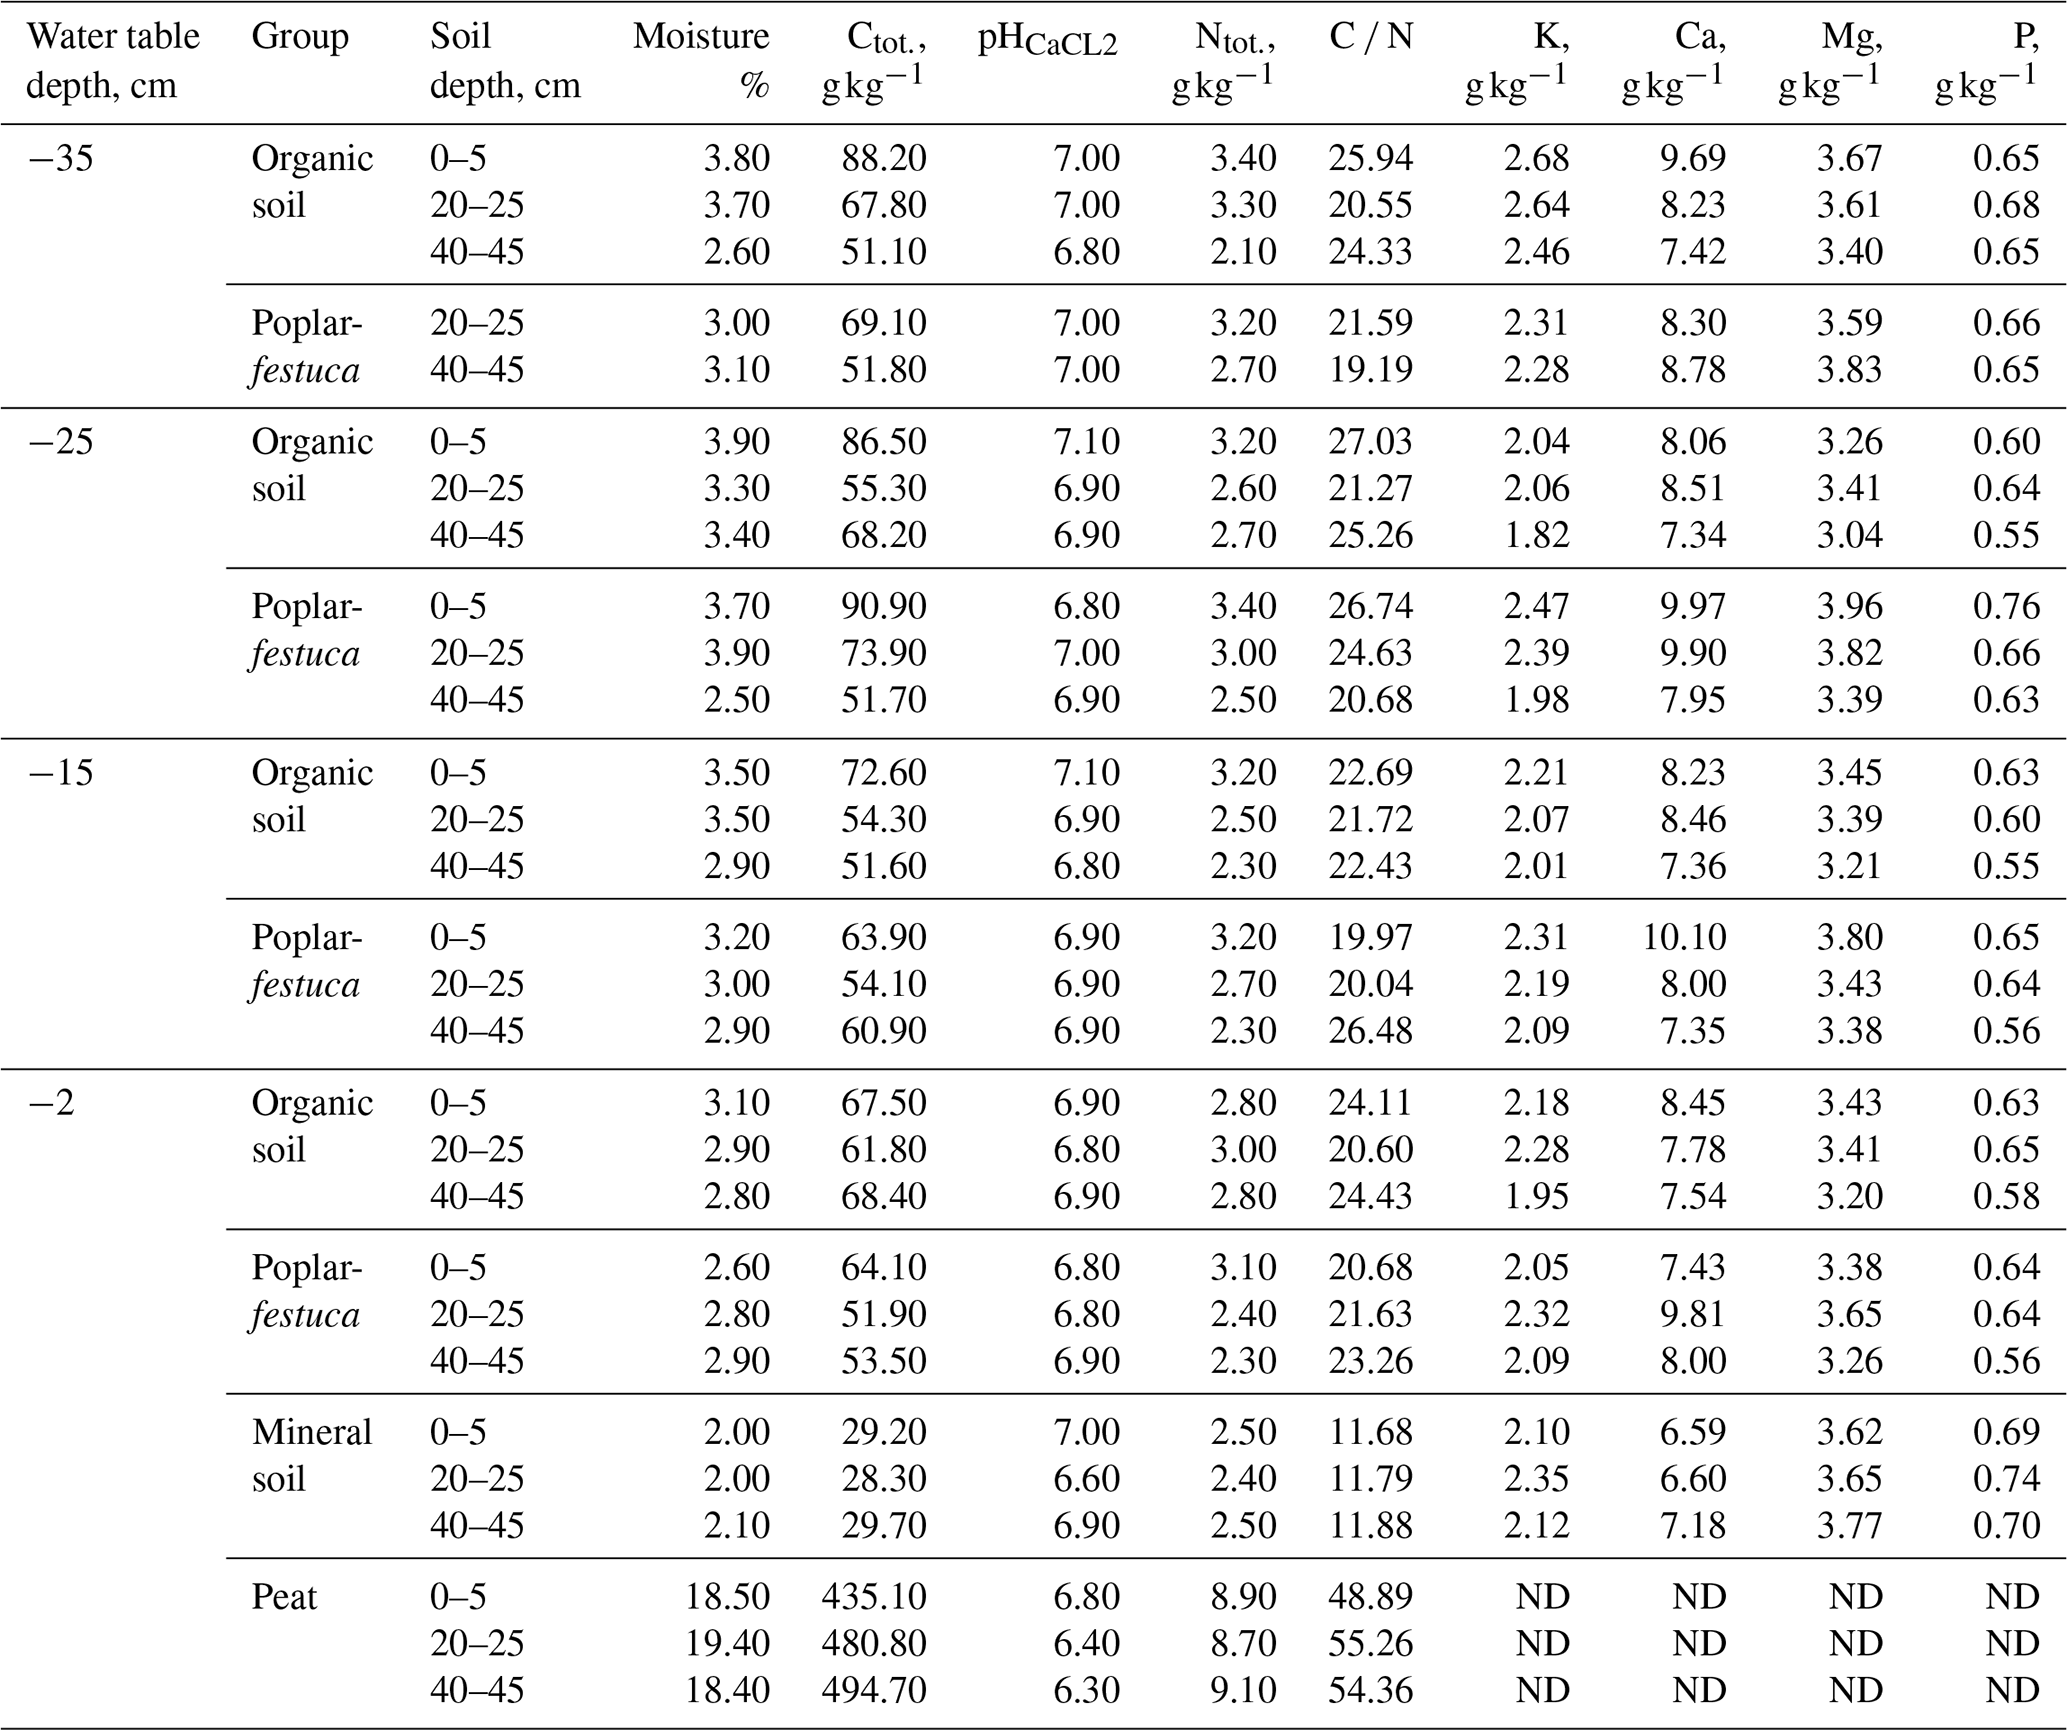
ND: not determined
Table A4Statistical significant post-hoc test results for the effects of groundwater level on plant structural traits.
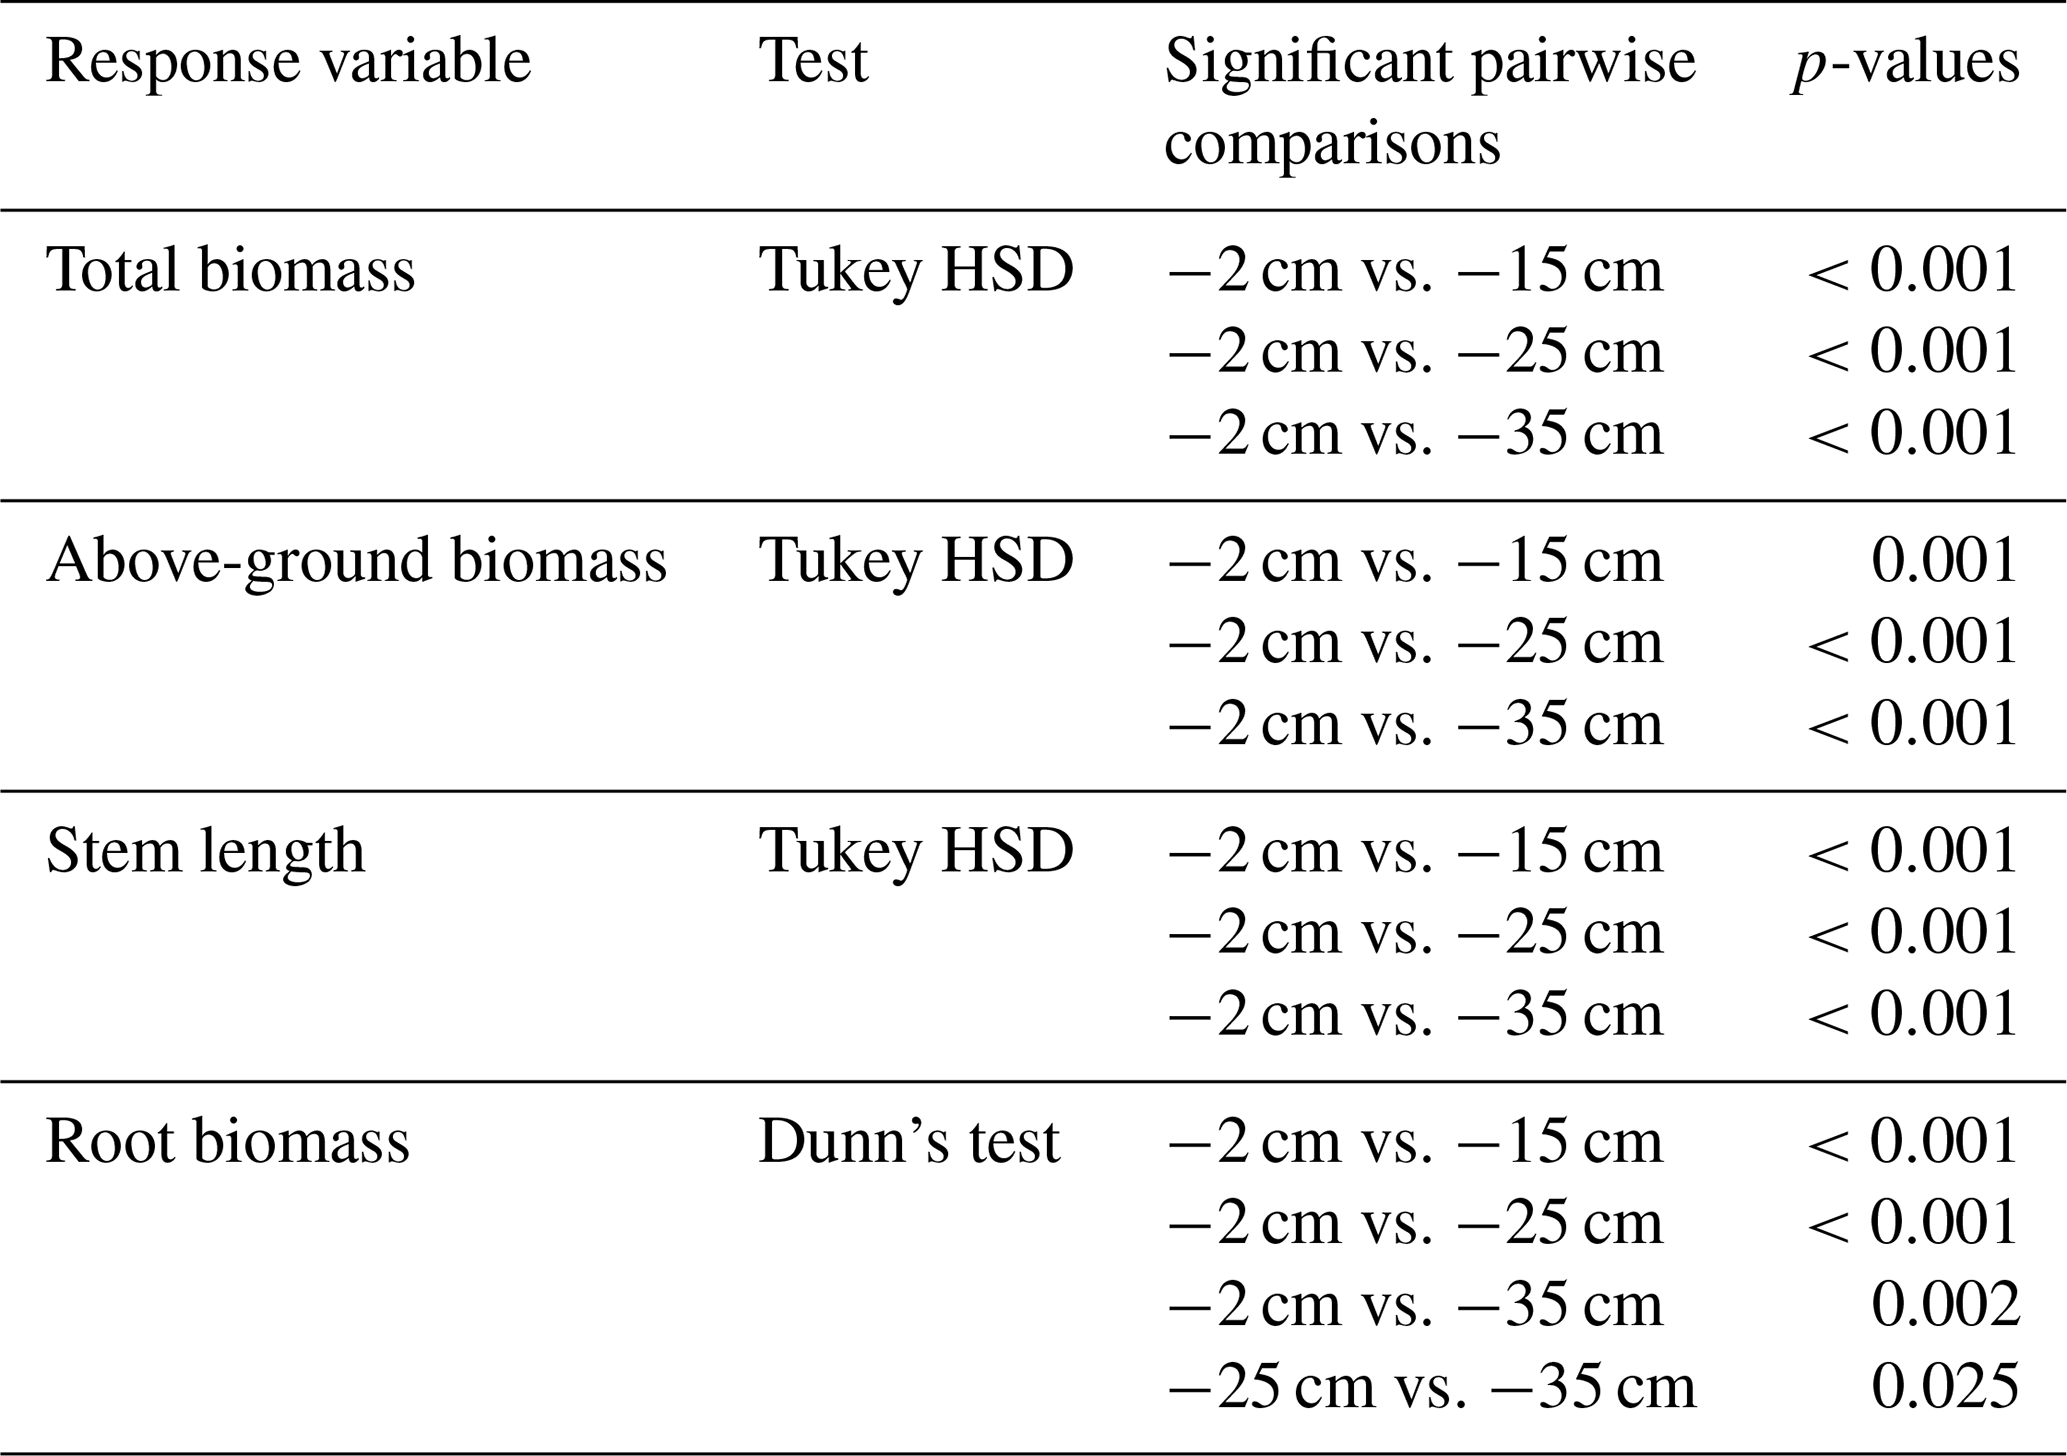
Table A5Statistical significant post-hoc test results for the effects of groundwater level on root volume.

Table A6Statistical significant post-hoc test results for the effects of groundwater level on leaf traits.

Table A7Statistical significant post-hoc test results for the effects of groundwater level and time on chlorophyll content indices dynamics.

Table A8Statistically significant linear mixed-effects model results for the effects of environmental factors on CO2 and CH4 emissions.

The source code used in this study is openly available in the Zenodo repository at https://doi.org/10.5281/zenodo.23501771 (Zuševica et al., 2026).
The data supporting the findings of this study are openly available in the Zenodo repository at https://doi.org/10.5281/zenodo.23501771 (Zuševica et al., 2026).
All the authors contributed to the study conception and design. Data collection was performed by V.V. and A.Z. Material preparation was performed by A.Z., and V.V. Data visualization and analyses were performed by A.Z. and V.V. The first draft of the manuscript was written by A.Z., and A.L., V.V., and D.L. commented on, reviewed, and edited previous versions of the manuscript. Supervision, project coordination, and funding acquisition were performed by A.L. and D.L. All the authors read and approved the final manuscript.
The contact author has declared that none of the authors has any competing interests.
Publisher's note: Copernicus Publications remains neutral with regard to jurisdictional claims made in the text, published maps, institutional affiliations, or any other geographical representation in this paper. The authors bear the ultimate responsibility for providing appropriate place names. Views expressed in the text are those of the authors and do not necessarily reflect the views of the publisher.
This research was supported by the European Regional Development Fund the Specific Support Measure 1.1.1.1 “Support for applied research” project Agreements no. 1.1.1.1/21/A/030; no. 1.1.1.1/21/A/031; no. 1.1.1.1/19/A/112 and continued by the study funded by the European Union Cohesion Policy Programme 2021–2027 project Peat Transform no. 6.1.1.2/1/25/A/001.
This research has been supported by the Latvijas Zinātnes Padome (grant no. VPP-ZM-VRIIILA-2024/2-0002).
This paper was edited by Ngonidzashe Chirinda and reviewed by two anonymous referees.
Adler, A., Karacic, A., Rönnberg Wästljung, A.-C., Johansson, U., Liepins, K., Gradeckas, A., and Christersson, L.: Variation of growth and phenology traits in poplars planted in clonal trials in Northern Europe – Implications for breeding, Bioenerg. Res., 14, 426–444, https://doi.org/10.1007/s12155-021-10262-8, 2021.
Aphalo, P.: ggpmisc: Miscellaneous Extensions to “ggplot2”, R package version 1.0.0, https://CRAN.R-project.org/package=ggpmisc (last access: 12 September 2026), 2026.
Auguie, B.: gridExtra: Miscellaneous Functions for “Grid” Graphics, R package version 2.3, https://CRAN.R-project.org/package=gridExtra (last access: 12 September 2025), 2017.
Bartoń, K.: MuMIn: Multi-Model Inference, R package version 1.48.19, https://CRAN.R-project.org/package=MuMIn (last access: 12 September 2026), 2026.
Bastviken, D., Treat, C. C., Pangala, S. R., Gauci, V., Enrich-Prast, A., Karlson, M., Gålfalk, M., Romano, M. B., and Sawakuchi, H. O.: The importance of plants for methane emission at the ecosystem scale, Aquat. Bot., 184, 103596, https://doi.org/10.1016/j.aquabot.2022.103596, 2023.
Bates, D., Maechler, M., Bolker, B., and Walker, S.: Fitting linear mixed-effects models using lme4, J. Stat. Softw., 67, 1–48, https://doi.org/10.18637/jss.v067.i01, 2015.
Bell, J. E., Palecki, M. A., Baker, C. B., Collins, W. G., Lawrimore, J. H., Leeper, R. D., Hall, M. E., Kochendorfer, J., Meyers, T. P., Wilson, T., and Diamond, H. J.: U. S. Climate Reference Network soil moisture and temperature observations, J. Hydrometeorol., 14, 977–988, https://doi.org/10.1175/JHM-D-12-0146.1, 2013.
Benomar, L., Moutaoufik, M. T., Elferjani, R., Isabel, N., Lamhamedi, M. S., Rainville, A., Beaulieu, J., and Bousquet, J.: Thermal acclimation of photosynthetic activity and Rubisco content in two hybrid poplar clones, bioRxiv [preprint], https://doi.org/10.1101/438069, 2018.
Brændholt, A., Steenberg Larsen, K., Ibrom, A., and Pilegaard, K.: Overestimation of closed-chamber soil CO2 effluxes at low atmospheric turbulence, Biogeosciences, 14, 1603–1616, https://doi.org/10.5194/bg-14-1603-2017, 2017.
Bragg, O., Lindsay, R., Risager, M., Silvius, M., and Zingstra, H.: Strategy and action plan for mire and peatland conservation in central Europe, Wetlands International Publication, 18, 1–95, ISBN 90 5882 018 1, 2003.
Buschmann, C., Röder, N., Berglund, K., Berglund, Ö., Lærke, P. E., Maddison, M., Mander, Ü., Myllys, M., Osterburg, B., and van den Akker, J. J. H.: Perspectives on agriculturally used drained peat soils: Comparison of the socioeconomic and ecological business environments of six European regions, Land Use Policy, 90, 104181, https://doi.org/10.1016/j.landusepol.2019.104181, 2020.
Butlers, A. and Lazdiņš, A.: Case study on greenhouse gas (GHG) fluxes from flooded former peat extraction fields in central part of Latvia, Res. Rural Dev., 28, 44–49, https://doi.org/10.22616/rrd.28.2022.006, 2022.
Byrne, K., Chojnicki, B., Christensen, T. R., Drösler, M., Freibauer, A., Friborg, T., Frolking, S., Lindroth, A., Mailhammer, J., Malmer, N., Selin, P., and Turunen, J.: EU peatlands: Current carbon stocks and trace gas fluxes, European Union Report, 1–40, 2004.
Cabrera-Bosquet, L., Fournier, C., Brichet, N., Welcker, C., Suard, B., and Tardieu, F.: High-throughput estimation of incident light, light interception and radiation-use efficiency of thousands of plants in a phenotyping platform, New Phytol., 212, 269–281, https://doi.org/10.1111/nph.14027, 2016.
Calvo-Polanco, M., Ribeyre, Z., Dauzat, M., Reyt, G., Hidalgo-Shrestha, C., Diehl, P., Frenger, M., Simonneau, T., Muller, B., Salt, D. E., Franke, R. B., Maurel, C., and Boursiac, Y.: Physiological roles of Casparian strips and suberin in the transport of water and solutes, New Phytol., 232, 2295–2307, https://doi.org/10.1111/nph.17765, 2021.
Castro, K. L. and Sanchez-Azofeifa, G. A.: Changes in spectral properties, chlorophyll content and internal mesophyll structure of senescing Populus balsamifera and Populus tremuloides leaves, Sensors-Basel, 8, 51–69, https://doi.org/10.3390/s8010051, 2008.
Chapman, S. J. and Thurlow, M.: The influence of climate on CO2 and CH4 emissions from organic soils, Agr. Forest Meteorol., 79, 205–217, https://doi.org/10.1016/0168-1923(95)02283-X, 1996.
Dinno, A.: dunn.test: Dunn's Test of Multiple Comparisons Using Rank Sums, R package version 1.3.5, https://CRAN.R-project.org/package=dunn.test (last access: 12 September 2025), 2017.
Domingo, I. L. and Gordon, J. C.: Physiological responses of an aspen-poplar hybrid to air temperature and soil moisture, Bot. Gaz., 135, 1–14, https://doi.org/10.1086/336750, 1974.
Else, M. A., Coupland, D., and Dutto, L.: Decreased root hydraulic conductivity reduces leaf water potential, initiates stomatal closure and slows leaf expansion in flooded plants of castor oil (Ricinus communis) despite diminished delivery of ABA from the roots to shoots in xylem sap, Physiol. Plantarum, 111, 46–54, https://doi.org/10.1034/j.1399-3054.2001.1110107.x, 2001.
Farré, E. and Weise, S.: The interaction between the circadian clock and primary metabolism, Curr. Opin. Plant Biol., 15, 293–300, https://doi.org/10.1016/j.pbi.2012.01.013, 2012.
Fischlin, A., Midgley, G., Price, J., Leemans, R., Gopal, B., Turley, C., Rounsevell, M., Dube, O., Tarazona, J., Velichko, A. A., Atlhopheng, J., Beniston, M., Bond, W., Brander, K., Bugmann, H., Callaghan, T., Chazal, J., Dikinya, O., Guisan, A., and Warren, R.: Ecosystems, their properties, goods, and services, in: Climate Change 2007: Impacts, Adaptation and Vulnerability, Contribution of Working Group II to the Fourth Assessment Report of the Intergovernmental Panel on Climate Change, Cambridge University Press, Cambridge, UK, 211–272, ISBN 9780521880107, 2007.
Fox, J., Weisberg, S., and Price, B.: car: Companion to Applied Regression, R package version 3.1-5, https://CRAN.R-project.org/package=car (last access: 12 September 2026), 2026.
Frensch, J., Hsiao, T. C., and Steudle, E.: Water and solute transport along developing maize roots, Planta, 198, 348–355, https://doi.org/10.1007/BF00620050, 1996.
Gorham, E.: Northern peatlands: Role in the carbon cycle and probable responses to climatic warming, Ecol. Appl., 1, 182–195, https://doi.org/10.2307/1941811, 1991.
Hanson, P., Edwards, N., Garten, C., and Andrews, J. A.: Separating root and soil microbial contributions to soil respiration: A review of methods and observations, Biogeochemistry, 48, 115–146, https://doi.org/10.1023/A:1006244819642, 2000.
Harmer, S. L., Hogenesch, J. B., Straume, M., Chang, H.-S., Han, B., Zhu, T., Wang, X., Kreps, J. A., and Kay, S. A.: Orchestrated transcription of key pathways in Arabidopsis by the circadian clock, Science, 290, 2110–2113, https://doi.org/10.1126/science.290.5499.2110, 2000.
Haydon, M. J., Mielczarek, O., Robertson, F. C., Hubbard, K. E., and Webb, A. A. R.: Photosynthetic entrainment of the Arabidopsis thaliana circadian clock, Nature, 502, 689–692, https://doi.org/10.1038/nature12603, 2013.
Hytönen, J., Beuker, E., and Viherä-Aarnio, A.: Biomass allocation and nutrient content of hybrid aspen clones grown on former agricultural land in Finland, Scand. J. Forest Res., 35, 205–214, https://doi.org/10.1080/02827581.2020.1751269, 2020.
Jauhiainen, J., Alm, J., Bjarnadottir, B., Callesen, I., Christiansen, J. R., Clarke, N., Dalsgaard, L., He, H., Jordan, S., Kazanavičiūtė, V., Klemedtsson, L., Lauren, A., Lazdins, A., Lehtonen, A., Lohila, A., Lupikis, A., Mander, Ü., Minkkinen, K., Kasimir, Å., Olsson, M., Ojanen, P., Óskarsson, H., Sigurdsson, B. D., Søgaard, G., Soosaar, K., Vesterdal, L., and Laiho, R.: Reviews and syntheses: Greenhouse gas exchange data from drained organic forest soils – a review of current approaches and recommendations for future research, Biogeosciences, 16, 4687–4703, https://doi.org/10.5194/bg-16-4687-2019, 2019.
Jentzsch, K., Männistö, E., Marushchak, M. E., Korrensalo, A., van Delden, L., Tuittila, E.-S., Knoblauch, C., and Treat, C. C.: Shoulder season controls on methane emissions from a boreal peatland, Biogeosciences, 21, 3761–3788, https://doi.org/10.5194/bg-21-3761-2024, 2024.
Joosten, H.: The global peatland CO2 picture, Wetlands International, Ede, the Netherlands, https://www.wetlands.org/publications/the-global-peatland-CO2-picture (last access: 12 September 2025), 2010.
Kalcsits, L. A., Silim, S., and Tanino, K.: Warm temperature accelerates short photoperiod-induced growth cessation and dormancy induction in hybrid poplar (Populus × spp.), Trees, 23, 971–979, https://doi.org/10.1007/s00468-009-0339-7, 2009.
Kasimir-Klemedtsson, Å., Klemedtsson, L., Berglund, K., Martikainen, P., Silvola, J., and Oenema, O.: Greenhouse gas emissions from farmed organic soils: A review, Soil Use Manage., 13, 245–250, https://doi.org/10.1111/j.1475-2743.1997.tb00595.x, 2007.
Kassambara, A.: ggpubr: “ggplot2” Based Publication Ready Plots, R package version 1.0.0, https://CRAN.R-project.org/package=ggpubr (last access: 12 September 2026), 2026.
Klemisch, W. and Pfadenhauer, J.: Nitrous oxide and methane fluxes from organic soils under agriculture, Eur. J. Soil Sci., 49, 327–335, https://doi.org/10.1046/j.1365-2389.1998.00156.x, 2002.
Kløve, B., Berglund, K., Berglund, Ö., Weldon, S., and Maljanen, M.: Future options for cultivated Nordic peat soils: Can land management and rewetting control greenhouse gas emissions?, Environ. Sci. Policy, 69, 85–93, https://doi.org/10.1016/j.envsci.2016.12.017, 2017.
König, H. and Varma, A.: Intestinal microorganisms of termites and other invertebrates, Springer, Berlin, Germany, https://doi.org/10.1007/3-540-28185-1, 2006.
Kożuch, A., Cywicka, D., Adamowicz, K., Wieruszewski, M., Wysocka-Fijorek, E., and Kiełbasa, P.: The use of forest biomass for energy purposes in selected European countries, Energies, 16, 5776, https://doi.org/10.3390/en16155776, 2023.
Maljanen, M., Komulainen, V.-M., Hytönen, J., Martikainen, P. J., and Laine, J.: Carbon dioxide, nitrous oxide and methane dynamics in boreal organic agricultural soils with different soil characteristics, Soil Biol. Biochem., 36, 1801–1808, https://doi.org/10.1016/j.soilbio.2004.05.003, 2004.
Marron, N., Brignolas, F., Delmotte, F., and Dreyer, E.: Modulation of leaf physiology by age and in response to abiotic constraints in young cuttings of two Populus deltoides × P. nigra genotypes, Ann. For. Sci., 65, 404, https://doi.org/10.1051/forest:2008016, 2008.
Mustamo, P., Hyvärinen, M., Ronkanen, A.-K., and Kløve, B.: Physical properties of peat soils under different land use options, Soil Use Manage., 32, 627–639, https://doi.org/10.1111/sum.12272, 2016.
Nelson, N. D., Berguson, W. E., McMahon, B. G., Cai, M., and Buchman, D. J.: Growth performance and stability of hybrid poplar clones in simultaneous tests on six sites, Biomass Bioenerg., 118, 115–125, https://doi.org/10.1016/j.biombioe.2018.08.007, 2018.
Nikodemus, O., Kārkliņš, A., Kļaviņš, M., and Melecis, V.: Augsnes ilgtspējīga izmantošana un aizsardzība [Sustainable Soil Use and Protection], Rīga, LU Akadēmiskais apgāds, 256 pp., ISBN 978-9984-45-087-2, 2008.
Oertel, C., Matschullat, J., Zurba, K., Zimmermann, F., and Erasmi, S.: Greenhouse gas emissions from soils – A review, Geochemistry, 76, 327–352, https://doi.org/10.1016/j.chemer.2016.04.002, 2016.
Ojanen, P., Lehtonen, A., Heikkinen, J., Penttilä, T., and Minkkinen, K.: Soil CO2 balance and its uncertainty in forestry-drained peatlands in Finland, Forest Ecol. Manag., 325, 60–73, https://doi.org/10.1016/j.foreco.2014.03.049, 2014.
Poorter, H., Fiorani, F., Pieruschka, R., Wojciechowski, T., Putten, W., Kleyer, M., Schurr, U., and Postma, J.: Pampered inside, pestered outside? Differences and similarities between plants growing in controlled conditions and in the field, New Phytol., 212, 838–855, https://doi.org/10.1111/nph.14243, 2016.
R Core Team: R: A Language and Environment for Statistical Computing, Vienna, Austria, R Foundation for Statistical Computing, https://doi.org/10.32614/R.manuals, 2026.
Ranjan, A., Perrone, I., Alallaq, S., Singh, R., Rigal, A., Brunoni, F., Chitarra, W., Guinet, F., Kohler, A., Martin, F., Street, N., Bhalerao, R., Legue, V., and Bellini, C.: Molecular basis of differential adventitious rooting competence in poplar genotypes, J. Exp. Bot., 73, 1–16, https://doi.org/10.1093/jxb/erac126, 2022.
Rytter, L., Ingerslev, M., Kilpeläinen, A., Torssonen, P., Lazdina, D., Löf, M., Madsen, P., Muiste, P., and Stener, L.-G.: Increased forest biomass production in the Nordic and Baltic countries – A review on current and future opportunities, Silva Fenn., 50, 1660, https://doi.org/10.14214/sf.1660, 2016.
Sander, B. O. and Wassmann, R.: Common practices for manual greenhouse gas sampling in rice production: A literature study on sampling modalities of the closed chamber method, Greenh. Gas Meas. Manage., 4, 1–13, https://doi.org/10.1080/20430779.2014.892807, 2014.
Schmidt, M., Torn, M., Abiven, S., Dittmar, T., Guggenberger, G., Janssens, I., Kleber, M., Kögel-Knabner, I., Lehmann, J., Manning, D., Nannipieri, P., Rasse, D., Weiner, S., and Trumbore, S.: Persistence of soil organic matter as an ecosystem property, Nature, 478, 49–56, https://doi.org/10.1038/nature10386, 2011.
Semerci, A., Çiçek, N., Karahan, F., Özyürek, E., Kasko Arici, Y., and Ekmekci, Y.: Some growth and chlorophyll fluorescence parameters of black and hybrid poplar clones under water stress, Turk. J. Agric. For., 41, 348–356, https://doi.org/10.3906/tar-1703-60, 2017.
Song, Y., Chen, Q., Ci, D., Shao, X., and Zhang, D.: Effects of high temperature on photosynthesis and related gene expression in poplar, BMC Plant Biol., 14, 111, https://doi.org/10.1186/1471-2229-14-111, 2014.
Straková, P., Penttilä, T., Laine, J., and Laiho, R.: Disentangling direct and indirect effects of water table drawdown on above- and belowground plant litter decomposition: Consequences for accumulation of organic matter in boreal peatlands, Glob. Change Biol., 18, 322–335, https://doi.org/10.1111/j.1365-2486.2011.02503.x, 2012.
Sunrise and Sunset Times API: https://sunrise-sunset.org, last access: 10 November 2023.
Tang, X., Pei, X., Lei, N., Luo, X., Liu, L., Shi, L., Chen, G., and Liang, J.: Global patterns of soil autotrophic respiration and its relation to climate, soil and vegetation characteristics, Geoderma, 369, 114339, https://doi.org/10.1016/j.geoderma.2020.114339, 2020.
Thomas, F. and Lang, P.: Growth and water relations of riparian poplar forests under pressure in Central Asia's Tarim River Basin, River Res. Appl., 37, https://doi.org/10.1002/rra.3605, 2020.
Tuittila, E.-S.: Restoring vegetation and carbon dynamics in a cut-away peatland, Doctoral thesis, University of Helsinki, Helsinki, Finland, ISBN 951-45-9608-0, 2000.
Vanden Broeck, A., Cox, K., Brys, R., Castiglione, S., Cicatelli, A., Guarino, F., Heinze, B., Steenackers, M., and Vander Mijnsbrugge, K.: Variability in DNA methylation and generational plasticity in the Lombardy poplar, a single genotype worldwide distributed since the eighteenth century, Front. Plant Sci., 9, 1635, https://doi.org/10.3389/fpls.2018.01635, 2018.
Viru, B., Veber, G., Jaagus, J., Kull, A., Maddison, M., Muhel, M., Espenberg, M., Teemusk, A., and Mander, Ü.: Wintertime greenhouse gas fluxes in hemiboreal drained peatlands, Atmosphere-Basel, 11, 731, https://doi.org/10.3390/atmos11070731, 2020.
von Elsner, B., Briassoulis, D., Waaijenberg, D., Mistriotis, A., von Zabeltitz, C., Gratraud, J., Russo, G., and Suay-Cortes, R.: Review of structural and functional characteristics of greenhouses in European Union countries, Part II: Typical designs, J. Agr. Eng. Res., 75, 111–126, https://doi.org/10.1006/jaer.1999.0512, 2000.
Wickham, H.: ggplot2: Elegant Graphics for Data Analysis, Springer-Verlag, New York, USA, https://doi.org/10.1007/978-3-319-24277-4, 2016.
Wickham, H., Averick, M., Bryan, J., Chang, W., McGowan, L. D., François, R., Grolemund, G., Hayes, A., Henry, L., Hester, J., Kuhn, M., Pedersen, T. L., Miller, E., Bache, S. M., Müller, K., Ooms, J., Robinson, D., Seidel, D. P., Spinu, V., Takahashi, K., Vaughan, D., Wilke, C., Woo, K., and Yutani, H.: Welcome to the tidyverse, J. Open Source Softw., 4, 1686, https://doi.org/10.21105/joss.01686, 2019.
Wickham, H., François, R., Henry, L., Müller, K., and Vaughan, D.: dplyr: A Grammar of Data Manipulation, R package version 1.2.1, https://CRAN.R-project.org/package=dplyr (last access: 12 September 2026), 2026.
Zhang, D., We, Y., Wang, J., Li, F., Cai, H., and Liu, W.: Analyze of spectral characterization and physiological parameters in Populus euphratica leaves under different groundwater burial depths, Forest Resour. Manage., 24–34, https://doi.org/10.13466/j.cnki.lyzygl.2022.01.004, 2022.
Zhang, X., Wu, N., and Li, C.: Physiological and growth responses of Populus davidiana ecotypes to different soil water contents, J. Arid Environ., 60, 567–579, https://doi.org/10.1016/j.jaridenv.2004.07.008, 2005.
Zhao, J.: FluxCalR: An R package for calculating CO2 and CH4 fluxes from static chambers, J. Open Source Softw., 4, 1751, https://doi.org/10.21105/joss.01751, 2019.
Zhao, K., Ma, B., Xu, Y., Stirling, E., and Xu, J.: Light exposure mediates circadian rhythms of rhizosphere microbial communities, ISME J., 15, 1–10, https://doi.org/10.1038/s41396-021-00957-3, 2021.
Zuševica, A., Vendina, V., Lazdiņš, A., and Lazdina, D.: Plant-soil interactions drive GHG dynamics in organic soil under variable water tables: a case study with poplar, Zenodo [code and data set], https://doi.org/10.5281/zenodo.23501771, 2026.