the Creative Commons Attribution 4.0 License.
the Creative Commons Attribution 4.0 License.
 | 14 May 2025
Gradual drying of permafrost peat decreases carbon dioxide production in drier peat plateaus but not in wetter fens and bogs
Aelis Spiller
Cynthia M. Kallenbach
Melanie S. Burnett
David Olefeldt
Christopher Schulze
Roxane Maranger
Peter M. J. Douglas
Permafrost thawing of northern peatlands can cause the local collapse of peat plateaus into much wetter thermokarst bogs and fens, dominated by Sphagnum mosses and graminoids, respectively. However, permafrost thaw can also improve landscape drainage and, thus, lead to the regional drying of peatlands. How gradual drying of these thawing permafrost peatlands affects the subsequent microbial production of carbon dioxide (CO2) and nitrous oxide (N2O) is uncertain because of landscape heterogeneity in moisture, peat quality, and vegetation. Here, we collected near-surface peat samples (5–20 cm) from Alberta, Canada, across transects representing a thaw gradient from peat plateaus to a fen or bog. We incubated the samples for 2 weeks under either field moisture or under gradual drying to reduce moisture by ∼ 80 %. Only the fen sites, which had high moisture and a high percentage of total N, produced N2O (0.06–6.7 µg N2O-N per gram of dry peat), but N2O production was unaffected by the drying treatments. Peat CO2 production was greatest from the fen and the youngest stage of the thermokarst bog, despite them having the most water-saturated field conditions, likely reflecting their more labile plant inputs and, thus, more decomposable peat. We found that CO2 respiration was enhanced by drying at relatively wet sites like the fens and young bog but was suppressed by drying in relatively drier peat plateaus. Further, gradual drying increased 13C-CO2 respiration, suggesting a possible shift to more decomposed, older C being lost with peat drying. Thus, our study suggests that future peat CO2 and N2O production from peatlands will depend on whether peat plateaus thaw into fens or bogs and on their diverging responses of peat respiration to more moisture-limited conditions.
- Article
(1928 KB) - Full-text XML
-
Supplement
(768 KB) - BibTeX
- EndNote


Permafrost peatlands are a crucial reservoir of carbon (C), storing around 185 Pg of C (Hugelius et al., 2020). In Canada, 37 % of peatlands remain perennially frozen, below a seasonal thawing active layer (Tarnocai et al., 2011) but are increasingly vulnerable to thaw due to climate change. Following the thaw of permafrost-affected peatlands, the hydrology of the landscape changes, potentially shifting the peat C balance and perturbing the climate system (Varner et al., 2022). As northern permafrost thaws, degradation features develop, including thaw lakes and increased active-layer thickness (Swindles et al., 2015). In response, some areas of the landscape can become water-saturated with ice melt and higher seasonal water tables (Rydin and Jeglum, 2013). However, drier conditions may also occur with thaw depending on the season or position in the landscape (Boike et al., 2016; Lawrence et al., 2015). For example, temperature-driven increases in evapotranspiration are expected to impart drier conditions on the surface layer of bogs and fens, especially in the summer, and faster drainage may occur with higher hydraulic conductivity following the thaw of underlying ground ice (Lee et al., 2014).
The degree to which permafrost thaw amplifies the release of microbially produced greenhouse gases (GHGs) into the atmosphere, exacerbating the global greenhouse effect, will partly depend on whether peat becomes wetter or drier (Kane et al., 2013). Carbon dioxide (CO2) is the dominant respired gas under drier, aerobic conditions, whereas methane, with a comparatively shorter residence time but higher global warming potential, is more prevalent under wetter, anaerobic conditions (Schädel et al., 2016). If a water-saturated ecosystem experiences drying, an increase in more efficient, aerobic microbial metabolism with subsequently higher CO2 production is expected, but this assumes that the microbial community will not become C- or moisture-limited. Recent studies have also demonstrated hot spots of permafrost nitrous oxide (N2O) production with fluctuations between aerobic and anaerobic moisture conditions, challenging past assumptions that permafrost soils lose a negligible amount of nitrogen (N) to N2O (Ramm et al., 2022; Voigt et al., 2020). Under wetter conditions, N2O is primarily produced during the incomplete denitrification of nitrate. However, anoxic, water-saturated conditions can also inhibit nitrification (and thus nitrate availability), and the reduction of N2O to N2 can be favored. With drier or more intermediate moisture conditions, N2O can be produced via nitrification; therefore, it is possible that a drier permafrost environment can induce N2O production through enhanced nitrification (Gil et al., 2017).
In heterogenous permafrost environments, where limitations to microbial metabolism can be site-specific, GHG responses to warming or the availability of C, nutrients, or O2 are not necessarily similar across the landscape, as previously demonstrated in numerous laboratory incubation experiments (Laurent et al., 2023; Schädel et al., 2014; Treat et al., 2014). However, to our knowledge, no study has isolated the effect of gradual drying, an often overlooked result of permafrost thaw, on GHG production across landscape features that vary with respect to their moisture and C and N availability. We conducted an incubation experiment to determine the relationship between experimental short-term gradual drying and the magnitude of CO2 and N2O gas production across a northern peatland thaw gradient and how drying affects the respired CO2 isotopic composition. We interpreted this isotopic composition as a signal of the C source respired under drier conditions. Methane was not measured, as the experimental conditions were not anoxic, which is required for methanogenesis. However, we note that modeling and field experiments suggest that well-drained northern peatland soils uptake atmospheric methane, adding to the complexity and heterogeneity of the C budget across a discontinuous permafrost peatland (Voigt et al., 2019; Voigt et al., 2023). We expected that (1) gradual drying will increase CO2 and N2O production in wetter fens and bogs compared to drier peat plateaus that could become C-limited more rapidly and (2) a decrease in moisture conditions will lead to the production of more 13C-enriched CO2, possibly reflecting the metabolism of more decomposed peat.
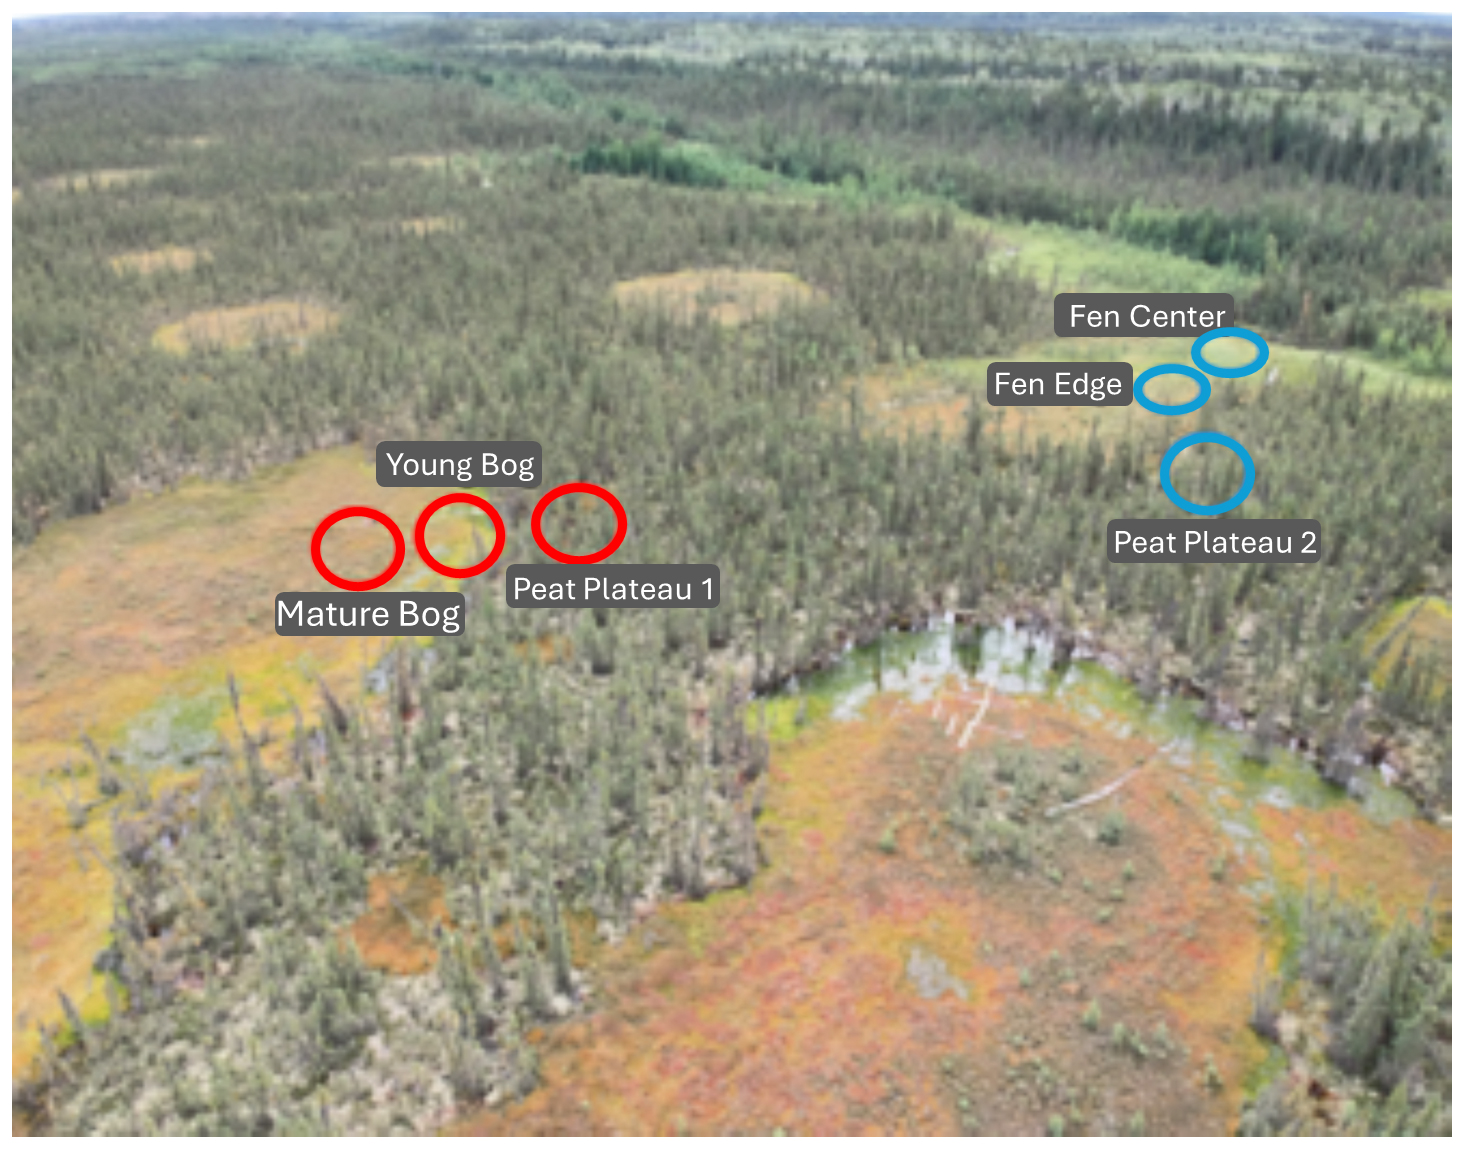
Figure 1The Lutose peatland study site (Alberta, Canada) and the studied bog and fen transects; sample locations are indicated using red and blue circles, respectively.
2.1 Study Site
The Lutose peatland study site (59.5° N, 117.2° W) is in Alberta, Canada, within the discontinuous permafrost zone (Heffernan et al., 2020). In this region, permafrost peatlands, with 2–6 m deep peat deposits, cover ∼ 40 % of the landscape (Vitt et al., 2000). We studied two transects, from a peat plateau to a bog and from a peat plateau to a fen (Fig. 1). These transects represent a space-for-time permafrost thaw gradient with distinct landscape features developing across thaw stages (Heffernan et al., 2020). For the bog transect, these features include a permafrost peat plateau, a young bog (∼ 30 years since thaw), and a mature bog (∼ 200 years since thaw). The peat plateau has an active-layer thickness of ∼ 70 cm, its surface is raised 1–2 m above the adjacent thermokarst bogs and fens, and it has relatively dry surface conditions that deepen with seasonal thaw (Table S1 in the Supplement). The young bog (< 5–10 m wide) is adjacent to the actively thawing area of the peat plateau and has a high growing season water table just below the peat surface. The mature bog, located > 10–20 m from the thawing plateau edge, is drier with a lower growing season water table than the young bog (Table S1).
Similarly, in the fen transect, three thaw stages are represented: a permafrost peat plateau, a fen center, and a fen edge. Like the young bog, the fen edge is located where the plateau surface has collapsed. The water table is level with the surface, and the peat surface is likely under anaerobic conditions (Heffernan et al., 2024). The fen center also has a high water table but has accumulated new peat material. The fen's relatively wetter conditions and higher pH (Table S1) result from its additional upstream water sources. In October 2019, we collected 4 separate peat core samples from 5 to 20 cm at each transect point for a total of 24 cores. Cores were immediately stored on ice, shipped to McGill University (Quebec), and kept at −20 °C until incubation.
2.2 Incubation design for the gradual drying experiment
We incubated the thawed (at 4 °C) peat samples from the four replicate cores collected within each transect site: mature bog (MB), young bog (YB), and peat plateau 1 (PP1) and fen center (FC), fen edge (FE), and peat plateau 2 (PP2). For each sample, the sample core was homogenized. A total of 0.52–4.84 g of dry peat was then weighed into a sterile specimen cup and placed in 1 L sealed mason jars with a septum gas sampling port. To create gradual drying conditions for our drying treatment, half of the incubations contained 150 g of calcium sulfate Drierite (> 98 % CaSO4, < 2 % CoCl2; 10–20 mesh) outside of the specimen cup that held the peat sample. This approach allowed us to slowly reduce the peat moisture content without opening the incubation jars to maintain experimental headspace concentrations. Control incubations held under field moisture conditions were maintained similarly but without the Drierite. In addition, we applied the same incubation treatments to a subset of samples to monitor changes in peat moisture during the incubation. We incubated the samples in the dark at 20 °C for 2 weeks, maintaining the incubation jars' seal throughout the 2 weeks. Frequent CO2 measurements ensured that the jars were maintained below a 3 % CO2 threshold of high headspace gas concentrations.
2.3 Gas sampling and peat moisture
We sampled headspace CO2 and N2O at the following hourly time points during the 2-week incubation: 0, 6, 24, 48, 96, 168, 240, and 336 h. At each time, 12 mL of gas was sampled with a syringe and stored in evacuated 9 mL vials. The second subset of incubating samples was massed for gravimetric water content at those same time points to produce a peat moisture curve over the incubation period. In addition, at times 0 and 336 h (i.e., the beginning and end of the incubation), we collected 20 mL of gas for isotope analysis, which was stored in evacuated 12 mL vials.
2.4 Total and isotopic emission quantification
We analyzed total CO2 and N2O by gas chromatography (Shimadzu GC-2014, Shimadzu Scientific Instruments, Columbia, USA). For δ13C-CO2, we analyzed three analytical replicates of 20 mL gas on a Picarro G2201-i carbon isotope analyzer connected to a sample introduction module. We calibrated the instrument using three internal CO2 gas standards (−15.6 ‰, −28.5 ‰, and −43.2 ‰) (Stix et al., 2017).
The δ13C of the input C source in the headspace gas was calculated with the following mixing model:
The fraction of laboratory air (Fraction lab air) was calculated by dividing the CO2 concentration at time 0 by that at the time of sampling.
To ensure that the δ13C-CO2 of the headspace gas was not an artifact of the Drierite, we ran (1) another 2-week incubation with Drierite and without peat and (2) a control with no Drierite or peat. To simulate the high CO2 concentrations experienced in the original incubations due to peat respiration, we added 60 mL of 5 % CO2 gas to the unevacuated Drierite and control jars. Samples from the start and end of the 336 h were analyzed on the Picarro carbon isotope analyzer. We found that the Drierite had no significant effect on the 13C isotope composition (mean δ −16.8) compared to the control (mean δ −17.14) (p = 0.07) or on the Drierite test CO2 concentrations (mean 1589 ppm) compared to the mean 1523 ppm for the control (p = 0.31). Thus, we ruled out the possibility that changes in incubation δ13C or CO2 parts-per-million values were an artifact of the drying agent.
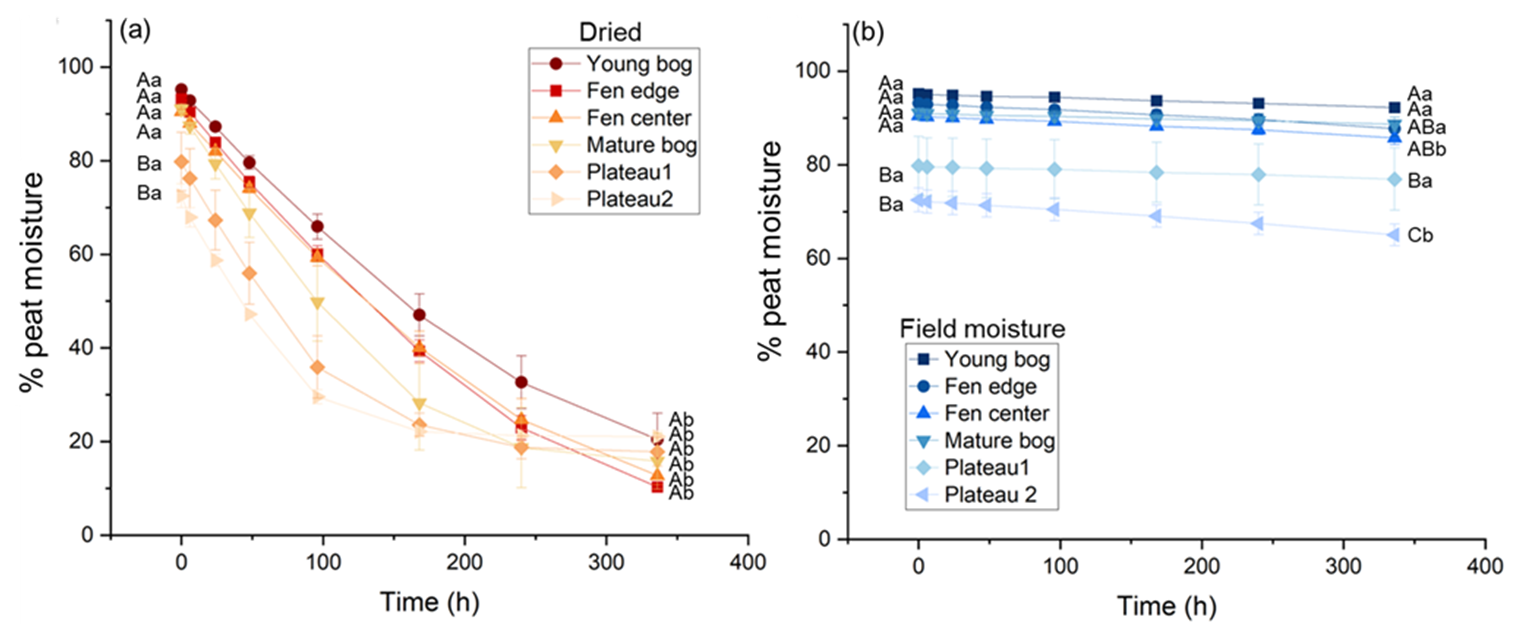
Figure 2Mean percentage of peat moisture over incubation time for each landscape feature under gradual drying (a) or in situ field moisture (b) conditions. More color saturation indicates higher in situ moisture. Uppercase letters that are different within each panel indicate a significant difference across landscape features for initial and final moisture. Lowercase letters that are different within each panel indicate a significant difference between initial and final moisture conditions of the incubation within a landscape feature. Error bars are the standard error around the mean, n = 4.
2.5 Peat chemistry and isotopic composition
We measured 1 M KCl-extractable nitrate and ammonium on all peat samples immediately before and after the incubations. Ammonium and nitrate concentrations in KCl extracts were determined colorimetrically on a 96-well spectrometer (BioTek Synergy microplate reader, Santa Clara, CA, USA) with the wavelength set at 650 and 540 nm, respectively. We measured peat δ13C and δ15N, total carbon (TC), and total nitrogen (TN) on ground, oven-dried peat at the Geotop Stable Isotope Laboratory at the Université du Québec à Montréal using an Elementar vario MICRO cube elemental analyzer and, for δ13C and δ15N, coupled with a Micromass model isoprime 100 isotope ratio mass spectrometer. Results are expressed as δ13C values (in ‰) vs. VPDB (Vienna Pee Dee Belemnite) and as δ15N (in ‰) vs. AIR (atmospheric N2) (Coplen, 2011).
2.6 Statistical analyses
Means and standard errors were calculated in MATLAB, and field cores within each transect point were treated as replicates (n = 4). Data were checked to ensure homogeneity and normalcy. To test the influence of landscape feature and drying on cumulative gas concentrations, δ13C-CO2, peat C:N, and moisture content, we performed two-way ANOVA tests, using landscape position and moisture treatment as fixed effects in RStudio (v4.3.2). To compare changes in peat moisture and CO2 and N2O production over time and between moisture treatments, a two-way repeated-measures ANOVA was performed within each landscape feature, using the Greenhouse–Geisser test for significant effect. Moisture and time were treated as factors, while peat core or incubation jar was the subject of repeated measures. We determined mean differences with Tukey's tests. Lastly, we examined the relationships between changes in peat moisture with drying and CO2 production based on the r2 and linear fit ANOVA p value from linear regressions. Significance is reported at α = 0.05.
3.1 Initial and final peat moisture
At the beginning of the incubation, initial peat moisture ranged from 73 % to 95 %. Initial field moisture was lowest in the peat plateaus compared to the fen and bogs (p < 0.001) (Fig. 2), consistent with other studies from this field site (Heffernan et al., 2024, 2024). In the treatments maintained under in situ field moisture conditions, changes in peat moisture during the 2-week period were minimal (Fig. 2b). In the gradual drying treatment, the percentage of peat moisture declined consistently over time across all the landscape features, except for the peat plateaus which stopped losing moisture at the end of the first week (168 h). Following 2 weeks of drying, peat moisture was between 10 % and 21 %, representing a 71 %–89 % moisture reduction, and was similar across landscape features (p = 0.301).
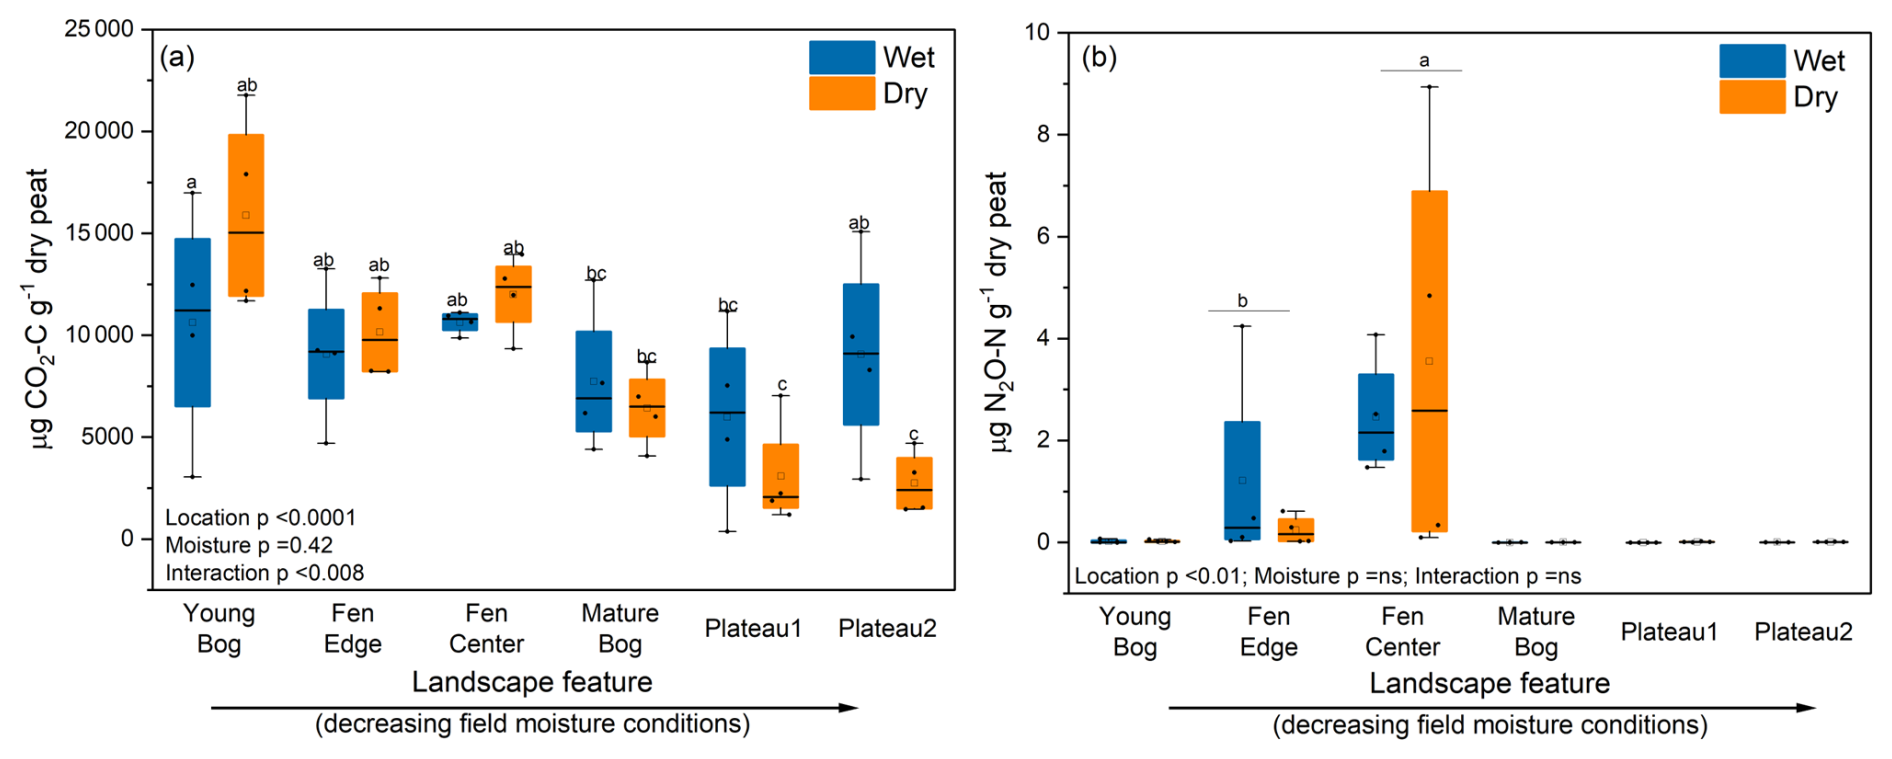
Figure 3Cumulative CO2 (a) and N2O (b) production by moisture treatment and landscape feature after 2 weeks of incubation, in order from high to low in situ peat moisture. Wet treatments were incubated under in situ field moisture conditions, whereas dry treatments were incubated under gradual drying conditions. ANOVA p values are shown for each factor and their interaction. Horizontal lines show the median (n = 4), and boxes show the 25th and 75th percentiles. Means that do not share a same letter are significantly different.
3.2 Landscape feature effects on CO2 and N2O
We observed that the YB, followed by the FC and FE, produced the most total CO2-C over the 2-week incubation (9.06–14.4 mg per gram of dry peat) across moisture treatments (Fig. 3a and Fig. S1 in the Supplement). We suspect that this higher CO2 production reflects the more labile plant inputs in the fen and young bog and, thus, more decomposable peat (Table S1) that can support elevated microbial respiration, despite the potential for lower oxygen availability under field moisture conditions.
We only detected N2O emissions from the fen center and fen edge, and these were highly variable (0.03–8.3 µg (cumulative) of N2O-N per gram of dry peat), with no effect of drying (Figs. 3b and S2). Changes in cumulative N2O production from the fen center generally increased linearly, whereas N2O production from the fen edge occurred exclusively during the last two sampling times from the wet control samples (Fig. S2). This is in contrast to a recent review showing lower N2O production in wetland permafrost compared to upland permafrost sites (e.g., peat plateaus), which the authors of that publication attributed to either inhibited nitrification that would reduce nitrate availability or more complete denitrification to N2 (Voigt et al., 2020). However, at our sites, initial fen nitrate concentrations (4.4–5.7 µg per gram of dry peat) indicate that nitrification is not inhibited, and we do not expect that our incubations were either water-saturated or N-limited enough to cause complete denitrification during the incubation.
The absence of N2O production from the drier peat plateau sites was expected, as they also had the lowest nitrate and ammonium (Table S1) of all of the sites. However, the bog sites had higher or similar inorganic-N concentrations to the fens but did not produce N2O. Thus, it does not appear that there is a relationship between N2O production and inorganic-N concentrations. However, the sedge-dominated fens, which produced N2O, had the lowest C:N (< 25) and the highest percentage of TN (Table S1). This may contribute to rapid N cycling and, thus, higher N2O production during the incubation, whereas the Sphagnum-dominated bogs are potentially more N-limited based on the observed higher C:N and more depleted 15N (Klemedtsson et al., 2005; Liao et al., 2021). The peat plateaus and bogs at the same study site were previously found to be N2O sinks (e.g., consumption of N2O to N2) in situ where anaerobic conditions occur (Schulze et al., 2023). Our observed N2O emissions from the fen center are considerably elevated for this region (and within the range of many temperate fertilized ecosystems) (Elberling et al., 2010). However, we note that we cannot account for potential plant N uptake which could otherwise reduce available N for microbial N2O production, especially in highly productive fens. Nonetheless, during the cold or shoulder season or where plant growth is low or disturbed, these results support the emerging evidence that permafrost ecosystems have N2O hot spots that should be accounted for when estimating the global warming potential of GHG production.
3.3 Effects of drying on CO2 production
We observed an effect of gradual drying on cumulative CO2 production within each site, although it did not consistently impart a negative or positive forcing on CO2 production. Rather, drying reduced CO2 in the peat plateaus but marginally increased total CO2 production for the YB, FC, and FE sites (Figs. 3a and S3) (interaction p < 0.008).
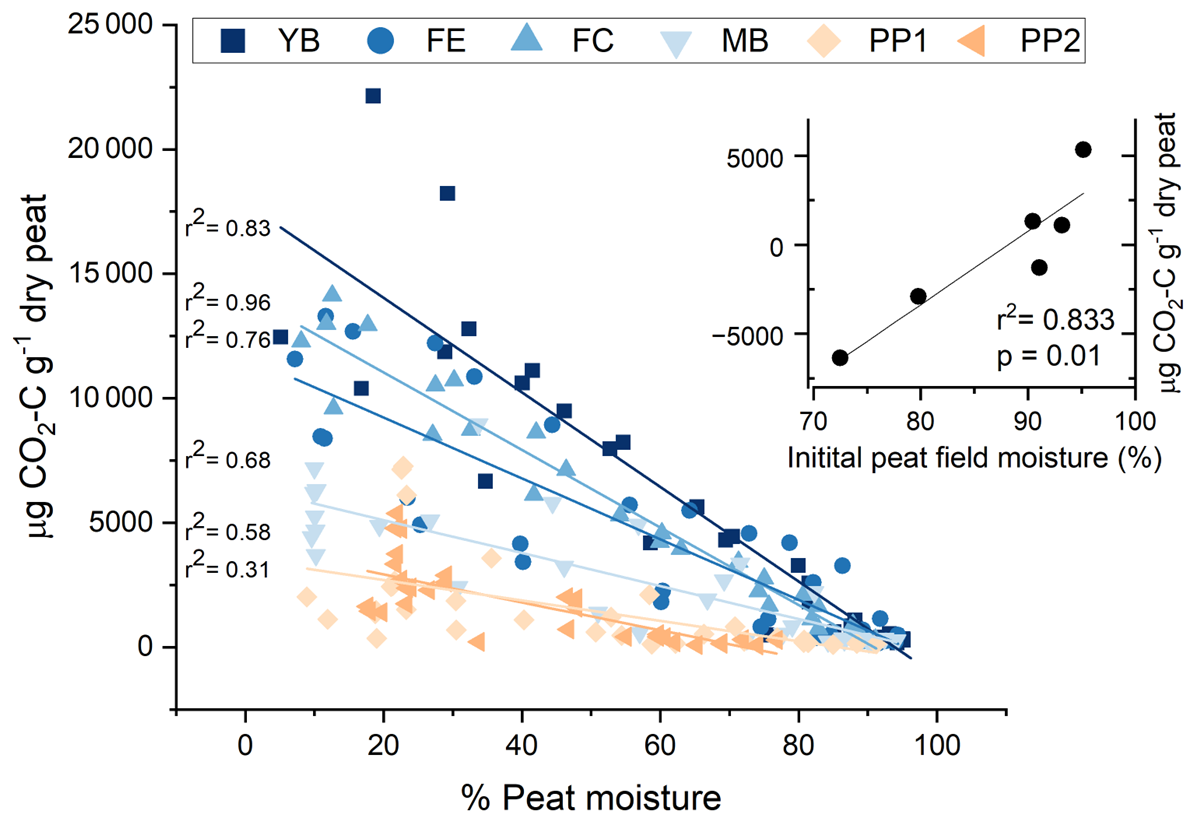
Figure 4Linear regression of CO2 production and the percentage peat moisture of peat exposed to the drying treatment. Points are individual peat samples measured during eight time periods while exposed to drying for 2 weeks. Landscape features are indicated using different colors and symbols in order of sites with the wettest to driest in situ field moisture conditions: young bog (YB), fen edge (FE), fen center (FC), mature bog (MB), peat plateau 1 (PP1), and peat plateau 2 (PP2). The inset is a regression of the mean initial peat field moisture and the absolute change in total CO2-C after 2 weeks of gradual drying.
Further supporting this site-dependent effect of drying on total CO2 production, the percentage of peat moisture from samples exposed to drying throughout the incubation was associated with increasing CO2 production. The strength of this relationship was strongest for the sites with the highest in situ moisture (YB and FE) (r2 > 0.8) and weakest for the sites with lower in situ moisture (Fig. 4). We also found a strong, positive correlation between initial field moisture and the change in cumulative CO2 emissions between the wet and dry treatments at the same site (Figs. 4 and S3). At initial peat moisture values above 90 %, gradual drying generally increased cumulative CO2 emissions; conversely, at values below 90 %, drying decreased cumulative CO2. This suggests that a threshold exists for optimum peat moisture that affects the trajectory of microbial respiration responses to short-term gradual drying.
The site differences with respect to total CO2 production reflect what was observed in the CO2 production rate: the peat plateaus with drier in situ peat moisture show a negative impact of drying on CO2 production (Fig. S4), occurring relatively early (within the first week) (p < 0.005). Generally, cumulative CO2 production increased linearly over time, regardless of the moisture treatment (Fig. S4). In other words, the rate of CO2 production was consistent over the 2-week incubation period. The PP2 (fen transect) was the exception, as we no longer observed increases in net CO2 production after 1.5 weeks.
The increased aerobic respiration in response to our short-term experimental drying that we observed for the in situ inundated or near-saturated landscape features, like YB and FE (Figs. 3 and 4), may not have necessarily been a direct effect of lower moisture, as all landscape features had similar moisture levels after drying (Fig. 2). Rather, the wetter features that responded positively to drying were likely influenced by other microbial metabolic drivers that coincide with in situ moisture. For example, more microbially available C is more likely to accumulate at wetter sites compared with the drier peat plateaus where aerobic metabolism would be less constrained, reducing the readily available C supply (Treat et al., 2014). Therefore, drying the peat plateaus may have suppressed CO2 production because C became limited during the incubation faster than at the wetter sites. This might also explain why we observed earlier decreases in CO2 production over time for the peat plateau sites (Fig. S4). Thus, it was not necessarily moisture conditions during the incubation driving our opposing responses but, rather, the initial moisture conditions and covarying factors, such as C availability and reactivity, specific to each landscape feature.
Some studies suggest that drier, more oxic permafrost peatlands contribute more to the positive carbon–climate feedback effect than anoxic soils because of the higher rates of CO2 production (Schädel et al., 2016; Schuur et al., 2015; see also Knoblauch et al., 2018). Our data suggest that it is more nuanced than this where, all else being equal, lower moisture may inherently reduce CO2 in less degraded peat plateaus. At the same time, due to enhanced evapotranspiration, the edges of bogs and fens, which form with thaw and the collapse of peat plateaus, are expected to experience drying first, which our results imply may increase CO2 emissions from those sites. While we cannot account for the influence of vegetation or anoxic conditions that could promote methane production, our results suggest that hydrological changes may initially amplify surface peat C emissions primarily from permafrost collapse features, rather than from more stable permafrost plateaus.
3.4 Respired peat δ13C-CO2
We observed a consistent and significant drying-induced trend in δ13C-CO2 (Fig. 5). Within each landscape feature, gradual drying produced cumulative CO2 with relatively higher δ13C than the field-moist peat, although differences in δ13C for the peat plateaus were insignificant. There was no temporal effect on the δ13C-CO2 produced by the field-moist (control) samples.
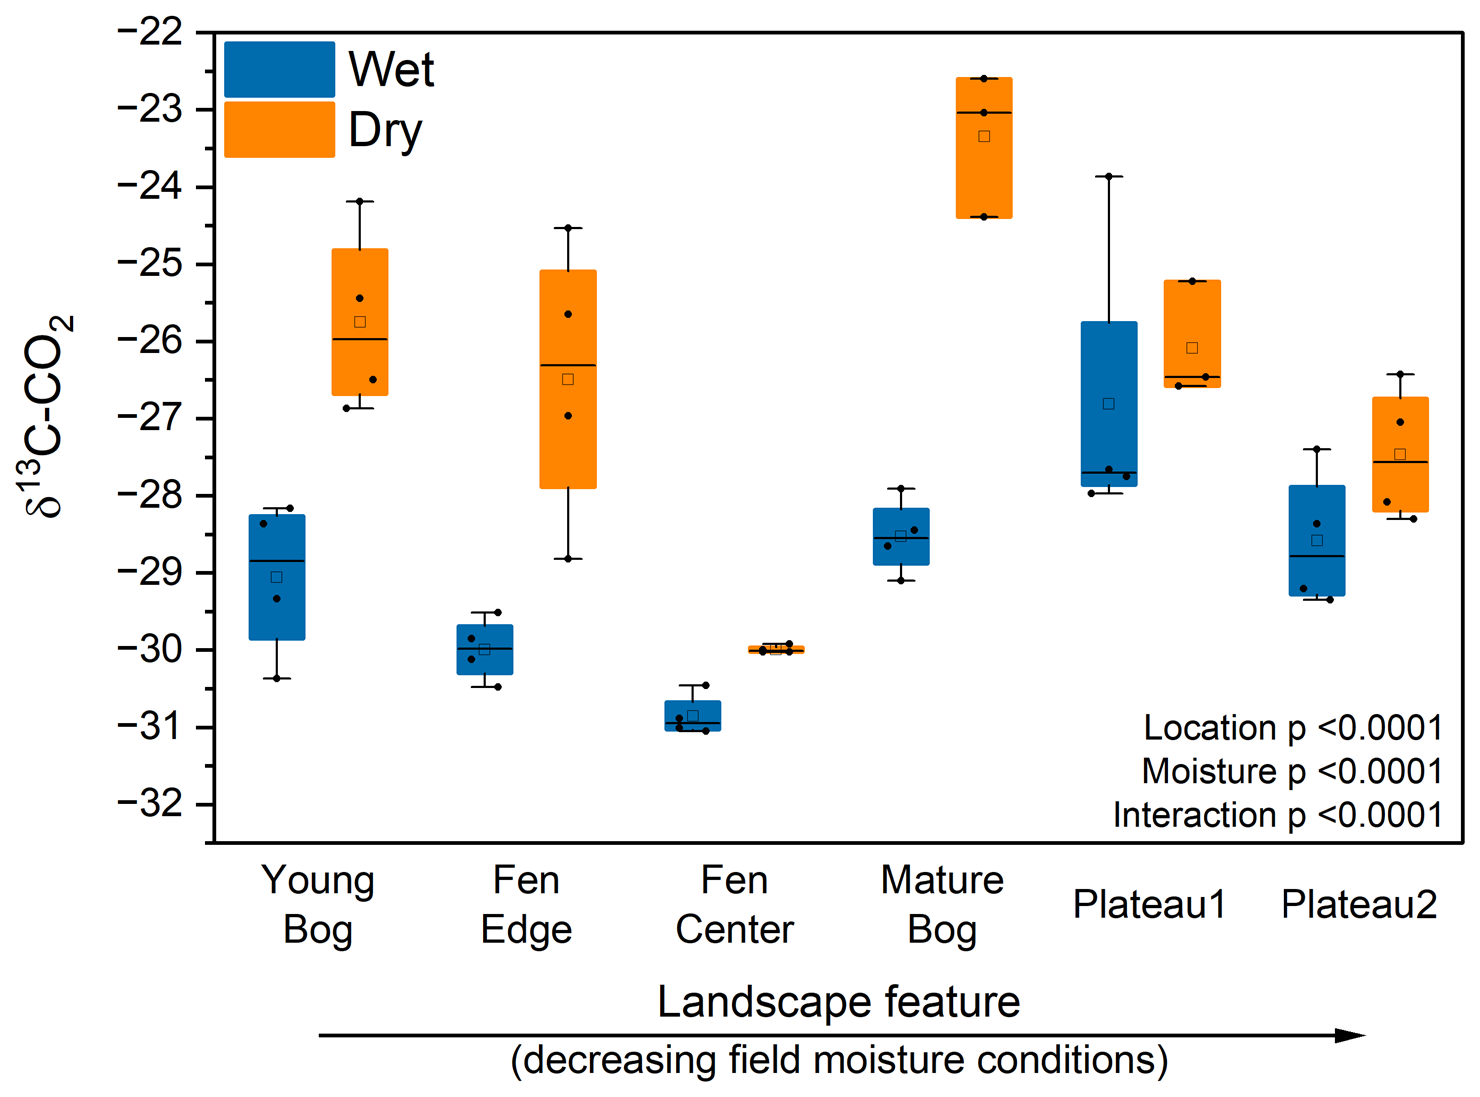
Figure 5Cumulative δ13C-CO2 by landscape feature and moisture treatment after 2 weeks of incubation. Landscape features are ordered from high to low average in situ peat moisture. Wet treatments were incubated under field moisture conditions, whereas dry treatments were incubated under gradual drying conditions. Horizontal lines show the median (n = 4), and boxes show the 25th and 75th percentiles. Means that do not share a same letter are significantly different.
The substantially higher δ13C-CO2 with drying implies that the C sources being respired change systematically in response to drying. One potential explanation is that, under drier conditions, decomposition shifts away from Sphagnum-derived peat that can be relatively δ13C-depleted due to its symbiosis with methanotrophs (Kip et al., 2010). However, the mechanism leading to a possible shift away from Sphagnum decomposition towards other more enriched-13C sources is unclear.
More generally, δ13C-CO2 enrichment could signal a shift towards the respiration of more decomposed peat under drying conditions. Typically, more decomposed C is expected to be enriched in 13C (Ågren et al., 1996) due to selective microbial respiration of 12C. Under high moisture conditions, especially near saturation, the metabolism of highly decomposed peat may be energetically unfavorable. Improved aeration of the dried peat would lead to more oxidizing conditions, allowing for the mineralization of more decomposed C with greater δ13C enrichment (Alewell et al., 2011). This might explain why we see less isotopic differentiation in the peat plateaus where initial moisture was less limiting to aerobic decomposition. Previous studies have also shown that older, more degraded peat experienced greater degradation under reduced peat moisture conditions (Hardie et al., 2011). Overall, the isotopic data imply that changes in CO2 production with drying are likely associated with a shift from the decomposition of fresh plant-derived substrates, including Sphagnum, to more degraded peat. Future incubations involving 14C measurements could indicate whether this also entails a shift to the decomposition of older peat C pools.
As permafrost thaws, changes in hydrologic conditions and atmospheric temperatures lead to moisture loss from peat in some circumstances, influencing microbial CO2 and N2O production. We establish the importance of initial peat moisture with respect to the effect that short-term gradual drying imparts on cumulative CO2 emissions. Respiration is enhanced by drying at relatively wet sites like fens and bogs and depressed by drying at relatively dry sites. Thus, as some permafrost systems undergo drying following thaw, the CO2 response and subsequent loss of peat C may depend on antecedent moisture conditions, whereas N2O emissions may be largely controlled by total N availability. Furthermore, gradual drying increased 13C respiration, suggesting a shift to more decomposed, potentially older C being mineralized with peat drying, implying the loss of previously stable peat C reservoirs.
All data relevant to this study can be accessed at https://doi.org/10.5683/SP3/J6YIEJ (Kallenbach, 2024).
The supplement related to this article is available online at https://doi.org/10.5194/soil-11-371-2025-supplement.
AS helped conceived the experimental approach, was primarily responsible for conducting the experiment, carried out laboratory and data analyses, wrote the first draft of the manuscript, and contributed to subsequent drafts. CMK helped conceive the experimental approach and contributed to funding acquisition, data interpretations, and writing of all subsequent drafts of the manuscript. MSB helped design the experimental approach, conducted some of the experiment, and contributed to the writing process. DO and CS collected the samples and data from the field sites and contributed to the development of the experiment and manuscript. RM contributed to the development of the ideas for the experiment and carried out laboratory analyses and writing. PMJD contributed to funding acquisition, conceiving the experimental approach, carrying out data interpretations, and the writing of all subsequent manuscript drafts.
The contact author has declared that none of the authors has any competing interests.
Publisher's note: Copernicus Publications remains neutral with regard to jurisdictional claims made in the text, published maps, institutional affiliations, or any other geographical representation in this paper. While Copernicus Publications makes every effort to include appropriate place names, the final responsibility lies with the authors.
We are grateful for the financial support for this research provided by the McGill Sustainability Systems Initiative Ideas Fund. We thank Lisa Galantini for help with gas analyses and Thi Hao Bui for help with stable isotope measurements.
This research has been supported by the McGill University (Sustainability Systems Initiative Ideas Fund).
This paper was edited by Claudio Zaccone and reviewed by Maija E. Marushchak and Angela Gallego-Sala.
Ågren, G. I., Bosatta, E., and Balesdent, J.: Isotope discrimination during decomposition of organic matter: a theoretical analysis, Soil Sci. Soc. Am. J., 60, 1121–1126, https://doi.org/10.2136/sssaj1996.03615995006000040023x, 1996.
Alewell, C., Giesler, R., Klaminder, J., Leifeld, J., and Rollog, M.: Stable carbon isotopes as indicators for environmental change in palsa peats, Biogeosciences, 8, 1769–1778, https://doi.org/10.5194/bg-8-1769-2011, 2011.
Boike, J., Grau, T., Heim, B., Günther, F., Langer, M., Muster, S., Gouttevin, I., and Lange, S.: Satellite-derived changes in the permafrost landscape of central Yakutia, 2000–2011: Wetting, drying, and fires, Global Planet. Change, 139, 116–127, https://doi.org/10.1016/j.gloplacha.2016.01.001, 2016.
Coplen, T. B.: Guidelines and recommended terms for expression of stable-isotope-ratio and gas-ratio measurement results, Rapid Commun. Mass Sp., 25, 2538–2560, https://doi.org/10.1002/rcm.5129, 2011.
Elberling, B., Christiansen, H. H., and Hansen, B. U.: High nitrous oxide production from thawing permafrost, Nat. Geosci., 3, 332–335, https://doi.org/10.1038/ngeo803, 2010.
Gil, J., Pérez, T., Boering, K., Martikainen, P. J., and Biasi, C.: Mechanisms responsible for high N2O emissions from subarctic permafrost peatlands studied via stable isotope techniques, Glob. Biogeoch. Cy., 31, 172–189, https://doi.org/10.1002/2015GB005370, 2017.
Hardie, S. M. L., Garnett, M. H., Fallick, A. E., Rowland, A. P., Ostle, N. J., and Flowers, T. H.: Abiotic drivers and their interactive effect on the flux and carbon isotope (14C and δ13C) composition of peat-respired CO2, Soil Biol. Biochem., 43, 2432–2440, https://doi.org/10.1016/j.soilbio.2011.08.010, 2011.
Heffernan, L., Estop-Aragonés, C., Knorr, K. H., Talbot, J., and Olefeldt, D.: Long-term impacts of permafrost thaw on carbon storage in peatlands: Deep losses offset by surficial accumulation, J. Geophys. Res.-Biogeo., 125, e2019JG005501, https://doi.org/10.1029/2019JG005501, 2020.
Heffernan, L., Estop-Aragonés, C., Kuhn, M. A., Holger-Knorr, K., and Olefeldt, D.: Changing climatic controls on the greenhouse gas balance of thermokarst bogs during succession after permafrost thaw, Glob. Change Biol., 30, e17388, https://doi.org/10.1111/gcb.17388, 2024.
Hugelius, G., Loisel, J., Chadburn, S., Jackson, R. B., Jones, M., MacDonald, G., Marushchak, M., Olefeldt, D., Packalen, M., Siewert, M. B., and Treat, C.: Large stocks of peatland carbon and nitrogen are vulnerable to permafrost thaw, P. Natil. Acad. Sci. USA, 117, 20438–20446, https://doi.org/10.1073/pnas.1916387117, 2020.
Kallenbach, C.: Data collected from Lutose, Alberta surface peat permafrost samples, Version 2.0, Borealis [data set], https://doi.org/10.5683/SP3/J6YIEJ, 2024.
Kane, E. S., Chivers, M. R., Turetsky, M. R., Treat, C. C., Petersen, D. G., Waldrop, M., Harden, J. W., and McGuire, A. D.: Response of anaerobic carbon cycling to water table manipulation in an Alaskan rich fen, Soil Biol. Biochem., 58, 50–60, https://doi.org/10.1016/j.soilbio.2012.10.032, 2013.
Kip, N., Van Winden, J. F., Pan, Y., Bodrossy, L., Reichart, G. J., Smolders, A. J., Jetten, M. S., Damsté, J. S. S., and Op den Camp, H. J.: Global prevalence of methane oxidation by symbiotic bacteria in peat-moss ecosystems, Nat. Geosci., 3, 617–621, https://doi.org/10.1038/ngeo939, 2010.
Klemedtsson, L., von Arnold, K., Weslien, P., Gundersen, P.: Soil CN ratio as a scalar parameter to predict nitrous oxide emissions, Glob. Change Biol., 11, 1142–1147, https://doi.org/10.1111/j.1365-2486.2005.00973.x, 2005.
Knoblauch, C., Beer, C., Liebner, S., Grigoriev, M. N., and Pfeiffer, E. M.: Methane production as key to the greenhouse gas budget of thawing permafrost, Nat. Clim. Change, 8, 309–312, https://doi.org/10.1038/s41558-018-0095-z, 2018.
Lawrence, D. M., Koven, C. D., Swenson, S. C., Riley, W. J., and Slater, A. G.: Permafrost thaw and resulting soil moisture changes regulate projected high-latitude CO2 and CH4 emissions, Environ. Res. Lett., 10, 094011, https://doi.org/10.1088/1748-9326/10/9/094011, 2015.
Laurent, M., Fuchs, M., Herbst, T., Runge, A., Liebner, S., and Treat, C. C.: Relationships between greenhouse gas production and landscape position during short-term permafrost thaw under anaerobic conditions in the Lena Delta, Biogeosciences, 20, 2049–2064, https://doi.org/10.5194/bg-20-2049-2023, 2023.
Lee, H., Swenson, S. C., Slater, A. G., and Lawrence, D. M.: Effects of excess ground ice on projections of permafrost in a warming climate, Environ. Res. Lett., 9, 124006, https://doi.org/10.1088/1748-9326/9/12/124006, 2014.
Liao, K., Lai, X., and Zhu, Q.: Soil δ15N is a better indicator of ecosystem nitrogen cycling than plant δ15N: A global meta-analysis, SOIL, 7, 733–742, https://doi.org/10.5194/soil-7-733-2021, 2021.
Ramm, E., Liu, C., Ambus, P., Butterbach-Bahl, K., Hu, B., Martikainen, P. J., Marushchak, M. E., Mueller, C. W., Rennenberg, H., Schloter, M., and Siljanen, H. M.: A review of the importance of mineral nitrogen cycling in the plant-soil-microbe system of permafrost-affected soils – changing the paradigm, Environ. Res. Lett., 17, 013004, https://doi.org/10.1088/1748-9326/ac417e, 2022.
Rydin, H. and Jeglum J. K. (Eds.): The Biology of Peatlands, 2nd edn. (online edition), Oxford Univ. Press, ISBN 9780191810138, 2013.
Schädel, C., Schuur, E. A. G., Bracho, R., Elberling, B., Knoblauch, C., Lee, H., Luo, Y., Shaver, G. R., and Turetsky, M. R.: Circumpolar assessment of permafrost C quality and its vulnerability over time using long-term incubation data, Glob. Change Biol., 20, 641–652, https://doi.org/10.1111/gcb.12417, 2014.
Schädel, C., Bader, M. K. F., Schuur, E. A., Biasi, C., Bracho, R., Čapek, P., De Baets, S., Diáková, K., Ernakovich, J., Estop-Aragones, C., and Graham, D. E.: Potential carbon emissions dominated by carbon dioxide from thawed permafrost soils, Nat. Clim. Change, 6, 950–953, https://doi.org/10.1038/nclimate3054, 2016.
Schulze, C., Sonnentag, O., Voigt, C., Thompson, L., van Delden, L., Heffernan, L., Hernandez-Ramirez, G., Kuhn, M., Lin, S., and Olefeldt, D.: Nitrous oxide fluxes in permafrost peatlands remain negligible after wildfire and thermokarst disturbance, J. Geophys. Res.-Biogeo., 128, e2022JG007322, https://doi.org/10.1029/2022JG007322, 2023.
Schuur, E. A., McGuire, A. D., Schädel, C., Grosse, G., Harden, J. W., Hayes, D. J., Hugelius, G., Koven, C. D., Kuhry, P., Lawrence, D. M., and Natali, S. M.: Climate change and the permafrost carbon feedback, Nature, 520, 171–179, https://doi.org/10.1038/nature14338, 2015.
Stix, J., Lucic, G., and Malowany, K.: Near real-time field measurements of δ13C in CO2 from volcanoes, B. Volcanol., 79, 1–10, https://doi.org/10.1007/s00445-017-1144-6, 2017.
Swindles, G. T., Morris, P. J., Mullan, D., Watson, E. J., Turner, T. E., Roland, T. P., Amesbury, M. J., Kokfelt, U., Schoning, K., Pratte, S., and Gallego-Sala, A.: The long-term fate of permafrost peatlands under rapid climate warming, Sci. Rep.-UK, 5, 17951, https://doi.org/10.1038/srep17951, 2015.
Tarnocai, C., Kettles, I. M., and Lacelle, B.: Peatlands of Canada, Geological Survey of Canada, Open File 6561, CD-ROM, https://doi.org/10.4095/288786, 2011.
Treat, C. C., Wollheim, W. M., Varner, R. K., Grandy, A. S., Talbot, J., and Frolking, S.: Temperature and peat type control CO2 and CH4 production in Alaskan permafrost peats, Glob. Change Biol., 20, 2674–2686, https://doi.org/10.1111/gcb.12572, 2014.
Varner, R. K., Crill, P. M., Frolking, S., McCalley, C. K., Burke, S. A., Chanton, J. P., Holmes, M. E., Isogenie Project Coordinators, Saleska, S., and Palace, M. W.: Permafrost thaw driven changes in hydrology and vegetation cover increase trace gas emissions and climate forcing in Stordalen Mire from 1970 to 2014, Philos. T. R. Soc. A, 380, 20210022, https://doi.org/10.1098/rsta.2021.0022, 2022.
Vitt, D. H., Halsey, L. A., Bauer, I. E., and Campbell, C.: Spatial and temporal trends in carbon storage of peatlands of continental western Canada through the Holocene. Can. J. Earth Sci., 37, 683–693, https://doi.org/10.1139/e99-097, 2000.
Voigt, C., Marushchak, M. E., Mastepanov, M., Lamprecht, R. E., Christensen, T. R., Dorodnikov, M., Jackowicz-Korczyński, M., Lindgren, A., Lohila, A., Nykänen, H., and Oinonen, M.: Ecosystem carbon response of an Arctic peatland to simulated permafrost thaw, Glob. Change Biol., 25, 1746–1764, https://doi.org/10.1111/gcb.14574, 2019.
Voigt, C., Marushchak, M. E., Abbott, B. W., Biasi, C., Elberling, B., Siciliano, S. D., Sonnentag, O., Stewart, K. J., Yang, Y., and Martikainen, P. J.: Nitrous oxide emissions from permafrost-affected soils, Nature Reviews Earth & Environment, 1, 420–434, https://doi.org/10.1038/s43017-020-0063-9, 2020.
Voigt, C., Virkkala, A. M., Hould Gosselin, G., Bennett, K. A., Black, T. A., Detto, M., Chevrier-Dion, C., Guggenberger, G., Hashmi, W., Kohl, L., and Kou, D.: Arctic soil methane sink increases with drier conditions and higher ecosystem respiration, Nat. Clim. Change, 13, 1095–1104, https://doi.org/10.1038/s41558-023-01785-3, 2023.