the Creative Commons Attribution 4.0 License.
the Creative Commons Attribution 4.0 License.
 | 05 Feb 2025
Depth dependence of soil organic carbon additional storage capacity in different soil types by the 2050 target for carbon neutrality
Clémentine Chirol
Geoffroy Séré
Paul-Olivier Redon
Claire Chenu
Delphine Derrien
Land planning projects aiming to maximize soil organic carbon (SOC) stocks are increasing in number and scope, often in line with the objective to reach carbon neutrality by 2050. In response, a rising number of studies assesses where additional SOC could be stored over regional to global spatial scales. In order to provide realistic values transferrable beyond the scientific community, studies providing targets of SOC accrual should consider the timescales needed to reach them, taking into consideration the effects of C inputs, soil type, and depth on soil C dynamics.
This research was conducted in a 320 km2 territory in north-eastern France, where eight contrasted soil types have been identified, characterized, and mapped thanks to a high density of fully described soil profiles. Continuous profiles of SOC stocks were interpolated for each soil type and land use (cropland, grassland, or forest). We defined potential targets for SOC accrual using percentile boundary lines and used a linear model of depth-dependent C dynamics to explore the C inputs necessary to reach those targets within 25 years. We also used values from the literature to model C input scenarios and provided maps of SOC stocks, maximum SOC accrual, and realistic SOC accrual over 25 years.
SOC stocks and maximum SOC accrual are highly heterogenous over the region of study. Median SOC stocks range from 78–333 tC ha−1. Maximum SOC accrual varies from 19 tC ha−1 in forested Leptosols to 197 tC ha−1 in grassland Gleysols. The simulated realistic SOC accrual over 25 years in the whole region of study was one-fifth of the the maximum SOC accrual. Further consideration of depth-dependent SOC dynamics in different soil types is therefore needed to provide targets of SOC storage over timescales relevant to public policies aiming to approach carbon neutrality by 2050.
- Article
(10304 KB) - Full-text XML
- BibTeX
- EndNote


Soils constitute a carbon reservoir that can help us mitigate for climate change or, conversely, accelerate greenhouse gas (GHG) emissions if not managed properly. Objectives for carbon neutrality by 2050 rely on an increase in soil organic carbon (SOC) via changes in land management practices over the coming decades while preserving existing stocks (Minasny et al., 2017). There is a rising demand for the scientific community to provide quantitative targets for SOC accrual for stakeholders at regional scales and over decadal timescales. However, soils are heterogenous, and dynamic systems (soil carbon) stocks are constantly being mineralized and renewed by new inputs. The spatial heterogeneity of soil carbon stocks and fluxes presents a challenge to soil carbon sequestration strategies. Certain soils may represent large stocks that need to be preserved, while others may have a greater capacity for SOC accrual.
Estimation of SOC stocks and SOC stock accrual potential should be performed over the whole soil profile because SOC below 20 cm can account for more than 50 % of the total stock (Jobbágy and Jackson, 2000; De Vos et al., 2015). Impacts of management practices on SOC dynamics have been found to vary above and below 30 cm, so the consideration of the whole soil profile is important to provide accurate recommendations to stakeholders (Tautges et al., 2019).
Targets of SOC accrual are currently estimated using two distinct concepts. The first is the fine-fraction saturation approach, using the clay and silt content as a proxy for the maximum carbon content that a given soil is theoretically able to stabilize in association with mineral phases (Hassink, 1997; Angers et al., 2011). The other is based on the analysis of current ecosystems' functioning: this method seeks the highest observed SOC stock from a dataset taken in a given pedoclimatic context and assumes this stock to be a realistic target under the management practices captured by the dataset (Lal, 2005; Chen et al., 2019). In this study, we adapt this method to define depth-dependent targets as a continuous profile. The fine-fraction saturation approach will not be used due to our focus on the whole soil profile: at depth, SOC storage becomes limited by diminishing organic matter inputs; therefore, carbon saturation in the fine fraction is unlikely to be a pertinent constraint on maximum SOC accrual (Poeplau et al., 2024).
Targets of SOC accrual need to be evaluated over timescales relevant to stakeholders, keeping in mind, in particular, the objective of achieving carbon neutrality by 2050. Getting the kinetics of SOC accrual necessitates a model-driven approach and scenarios of C inputs to the soil (Barré et al., 2017). Mechanistic models of SOC dynamics such as Millennial (Abramoff et al., 2022) are one option to incorporate the effect of climate change and modifications in management practice but necessitate a lot of input data; therefore, simpler models remain valuable to explore (Derrien et al., 2023; Schimel, 2023). For some studies, simple linear models dependent on C inputs have proven to be sufficient to capture respiration patterns across different soils and SOC levels even though temporal fluctuation in respiration fluxes were not properly represented (Fujita et al., 2014). We use a linear model that contains a fast-cycling, a slow-cycling, and an inert pool. Pool size and turnover have been calibrated by Balesdent et al. (2018) using a global database of C concentrations and 13C isotopes measured after a change in vegetation in multiple campaigns, principally over several decades. This calibration makes the Balesdent et al. (2018) parameters singularly robust to estimate C accrual over 25 years.
In addition to land use (Guo and Gifford, 2002), the physico-chemical properties of the soil play an important role in SOC accumulation and residence time (Kögel-Knabner et al., 2021). Soil properties that affect SOC stabilization include the clay content and exchangeable cations (Rasmussen et al., 2018). High Ca2+ concentrations in soils were found to intensify SOC accumulation through either increased occlusion within aggregates or enhanced SOC association with minerals (Rowley et al., 2021). Low pH values also hinder microbial activity and organic matter degradation, leading to an increased residence time of SOC in the soil (Malik et al., 2018). The parameters from Balesdent et al. (2018) in the model are therefore modulated with functions from other models that account for these soil properties. Finally, SOC dynamics are impacted by climate change, both directly through the effects of soil temperature and moisture on C decomposition rates and indirectly through modifications in soil properties (Luo et al., 2017).
Once targets of SOC accrual have been set for a given timescale, the next step to facilitate communication with stakeholders is to map where this carbon can be stored in a given region in order to account for the spatial heterogeneity of soils. Soil maps therefore constitute an important tool to spatially assess SOC stocks and fluxes (Wiesmeier et al., 2015).
The main objective of this paper is to estimate and map realistic targets for SOC accrual within decadal timescales, accounting for soil type and depth. To that end, we explore the effect of land use and soil type on whole-profile SOC stocks and decadal dynamics. We focus on a region of study where dense data collection has taken place and where land use change has seen very little variation for 200 years. We use a combination of pre-existing methods (interpolation of continuous SOC profiles, estimation of theoretical maximum SOC stocks based on observed values, application of a simple model of C dynamics robust at decadal timescales, and mapping of the simulated SOC accrual after 25 years) as an innovative way of generating realistic results that are transferrable beyond the scientific community. We explore two scenarios of SOC accrual: one where we apply annual C inputs necessary to reach the theoretical maximum SOC stock within 25 years and one where we apply realistic C input values found in the literature. We also explore scenarios with different rates of temperature increase by 2050 following climate change scenarios RCP4.5 and RCP8.5.
2.1 Study site and data acquisition
The Perennial Observatory of the Environment (OPE in French) has been monitoring since 2007 a 320 km2 area located in the north-eastern part of France (in Meuse and Haute-Marne counties). This observatory operated by the Radioactive Waste Management Agency (ANDRA) aims to follow the environmental impacts of a planned deep underground nuclear waste storage facility. In the framework of the monitoring programme, various environmental data, including soil characterization and mapping, have been collected.
The OPE study area is dominated by agricultural and forest lands: 55 % of the region is occupied by agricultural lands managed by conventional agriculture practices, 29 % is occupied by forests dominated by deciduous trees (oak, hornbeam, and beech), 14 % is occupied by grassland, and less than 2 % by urban areas. A land occupation map from 1830 shows that limited modifications in land use have taken place over the past 200 years (Dupouey et al., 2008). The region's continental climate is softened by some oceanic influences. According to data collected by the OPE weather stations from 2009 to 2019, the mean annual temperature is 10.4 °C (±6.2 °C between summer and winter), annual cumulated rainfall is 983 mm (±113,) and potential evapotranspiration (ETP) =661 mm (±79).
This study uses a total of 198 soil profiles (932 samples) to estimate SOC stocks and maximum SOC accrual. 86 of these soil profiles were collected within the region of study between 1995 and 2019 and were used along with a 1 / 50 000 pedological map (Party et al., 2019) to classify the soils into eight dominant soil types and define the physico-chemical characteristics of each of their horizons, such as pH, CaCO3, texture, and rock fragment content (Table 1).
The eight identified soil types can be broadly divided based on the geological parent materials and the geomorphology of the region (Fig. 1). On the plateaus, preserved detritic Cretaceous layers from the Valanginian stage with high concentrations of silt and sand lead to the formation of Eutric and Dystric Cambisols, with podzols locally reaching depths of more than 2 m. On the hillslopes and in the valleys, the parent materials are Tithonian limestones and Kimmeridgian marls and limestones, leading to the formation of Calcaric to Hypereutric Cambisols with high rock fragment contents in the deeper horizons. Soils on the hillslopes, referred to as Rendzic Leptosols and Hypereutric Epileptic Cambisols, are more superficial and have higher rock fragment content. Stagnosols and Gleysols can be found at the bottom of the valleys and over the Kimmeridgian marls and limestones: they are deep, clay-rich, and hydromorphic soils; the former is waterlogged for part of the year, while the latter is waterlogged all year round. In the north-east of the study area, clay-rich and CaCO3-bearing materials from a tunnel excavation in 1841–1846 form local pockets of Technosols, which were not considered in this study due to their limited spatial extent. Land use information was derived from the 1 / 100 000 CORINE Land Cover 2018 at a resolution of 25 ha (European Environment Agency, 2020).
The data from the 86 soil profiles contain SOC content data on the different soil horizons (253 samples) but only 48 bulk density measurements using the cylinder method. In order to provide additional SOC content and bulk density data as a function of depth, 112 additional profiles corresponding to these eight soil types were collected from soil databases in the six surrounding administrative geographical units (counties). The soil profiles were collected by the RMQS (French Soil Quality Monitoring Network) and RENECOFOR (French Permanent Plot Network for the Monitoring of Forest Ecosystems). More detailed information on these datasets can be found in previous publications (Cissé et al., 2023; INRAE et al., 2021, 2024; Munera-Echeverri et al., 2024). In each collected sample, organic carbon content (g kg−1) is measured in the fine fraction (<2 mm) by dry combustion after the removal of the inorganic carbon with acid. Since this study only considers mineral soil, the litter layer was excluded from the forest profiles. Bulk density values are measured using the cylinder method in 552 out of the 932 samples and are otherwise estimated from a pedotransfer function from Beutler et al. (2017) based on clay and total organic content values as follows:
where BD is the bulk density (kg m−3), clay is the clay content (g kg−1), and SOC is the total organic carbon content (g kg−1). The pertinence of this pedotransfer function to estimate bulk density in our region of study has been validated with the 48 samples from the region of study where bulk density measurements were available with a mean square error value of 0.70. Other pedotransfer functions from the literature (Saxton and Rawls, 2006; Akpa et al., 2016; Shiri et al., 2017) were also tested but gave mean square error values of 3.13, 6.81, and 353.35 respectively.
Table 1Mean values of pH, clay content, rock fragments content and CaCO3 concentration for each soil type and horizon, calculated from 86 whole soil profiles sampled between 1995 and 2019 within the region of study. Standard deviations are given in brackets. See measurement protocols in Table A1.
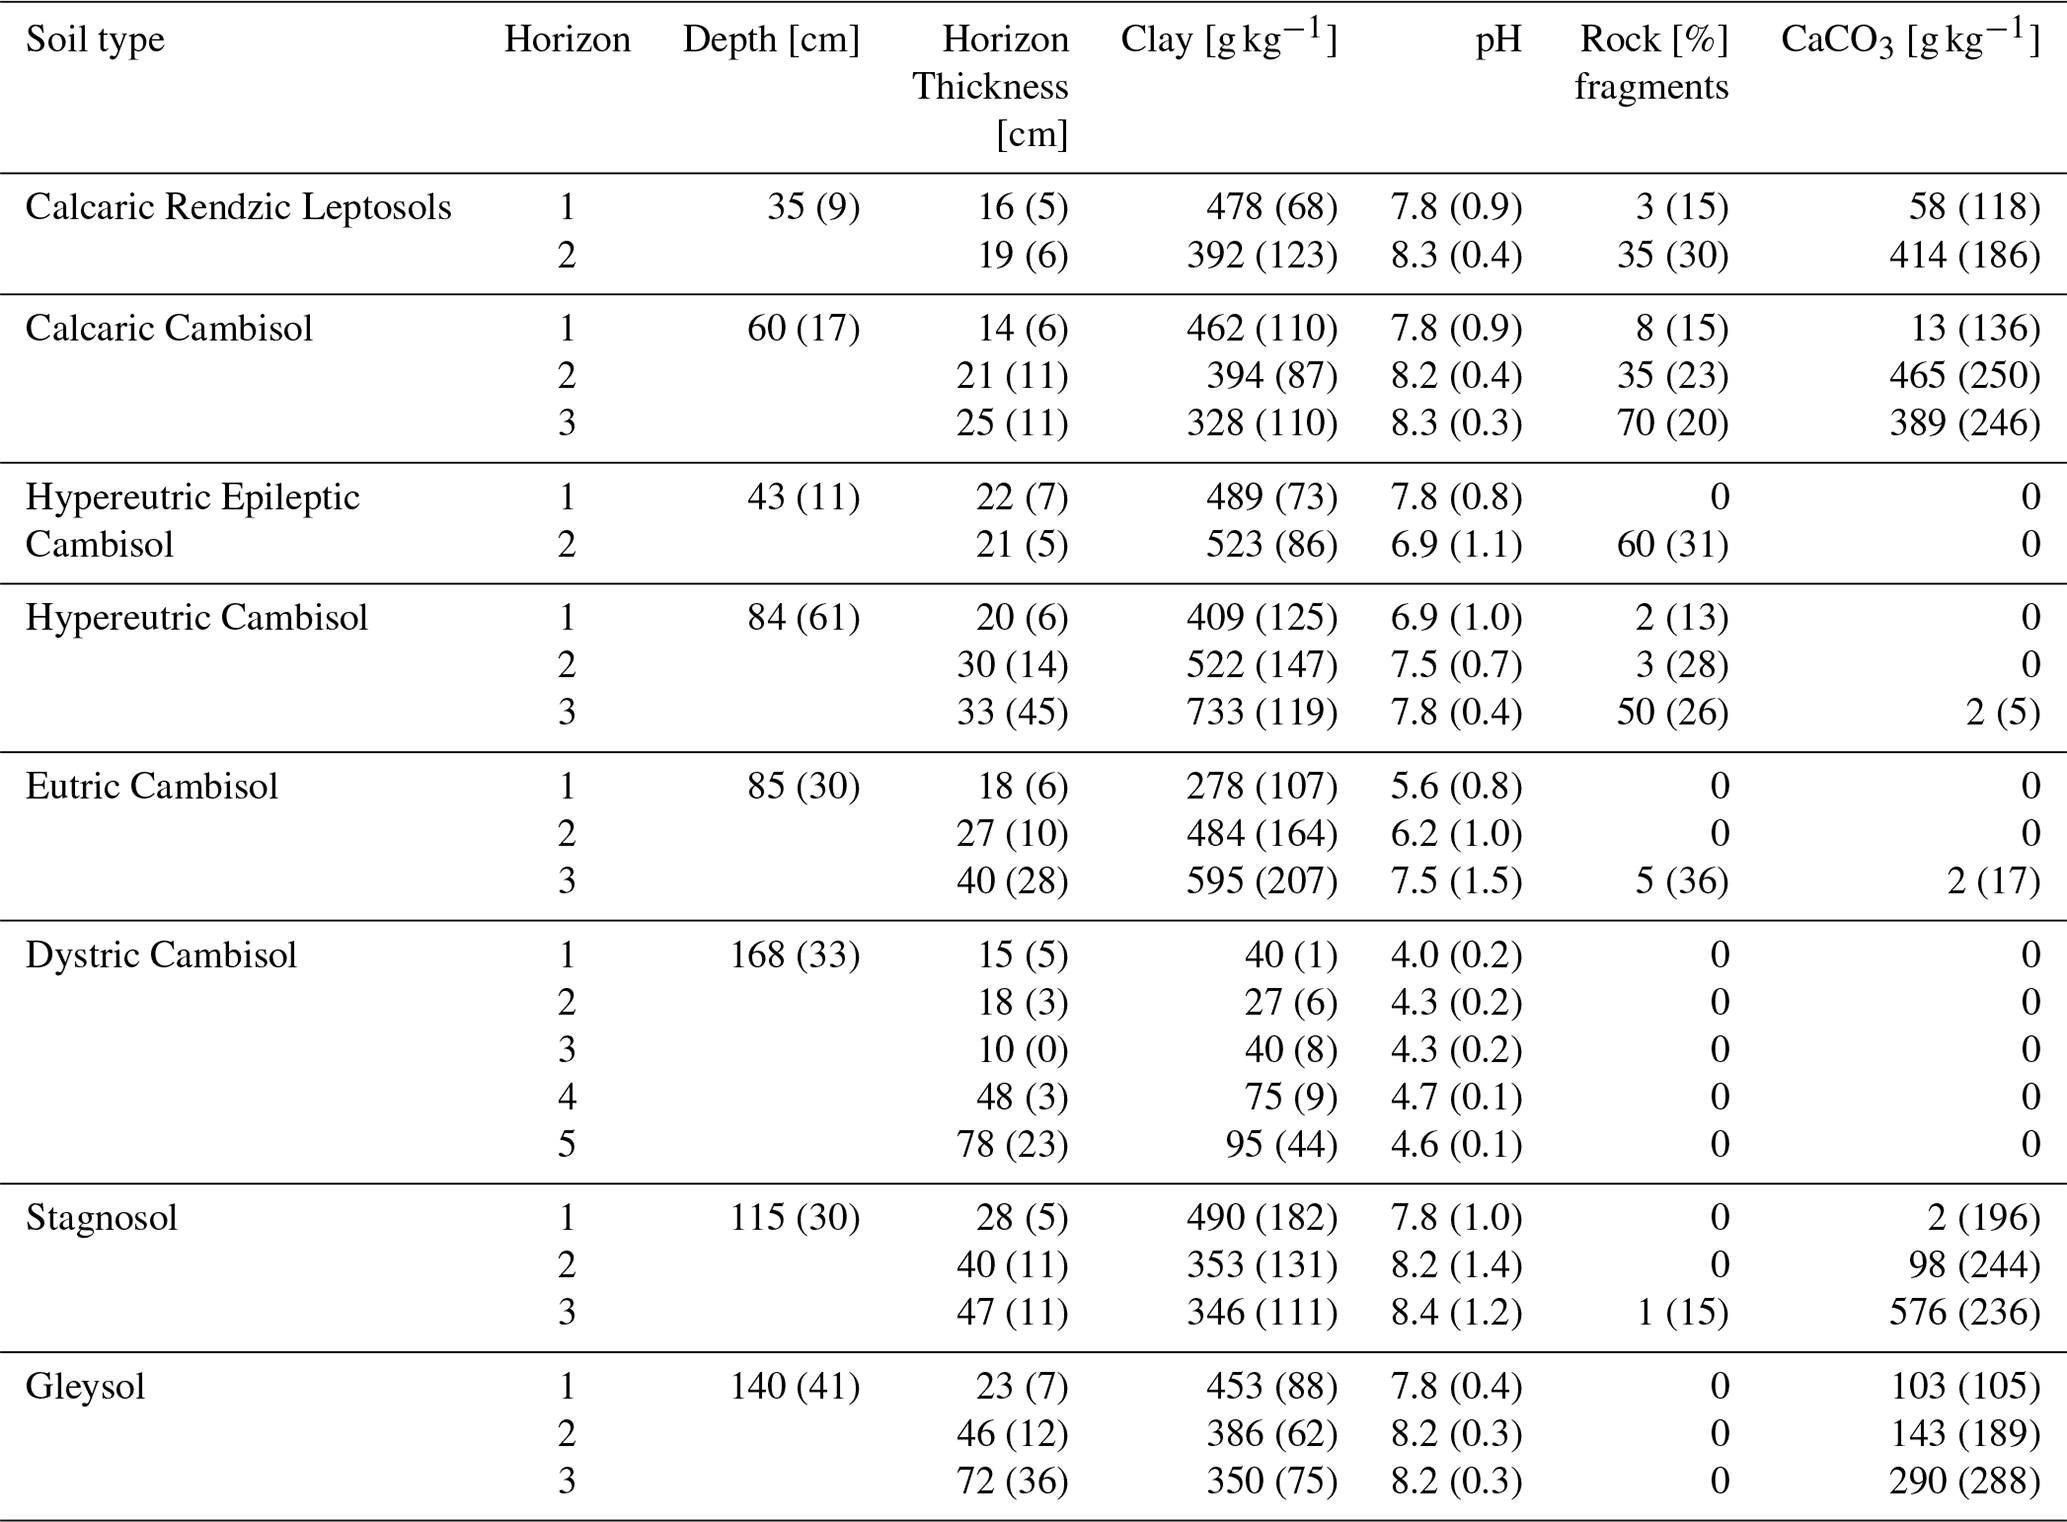
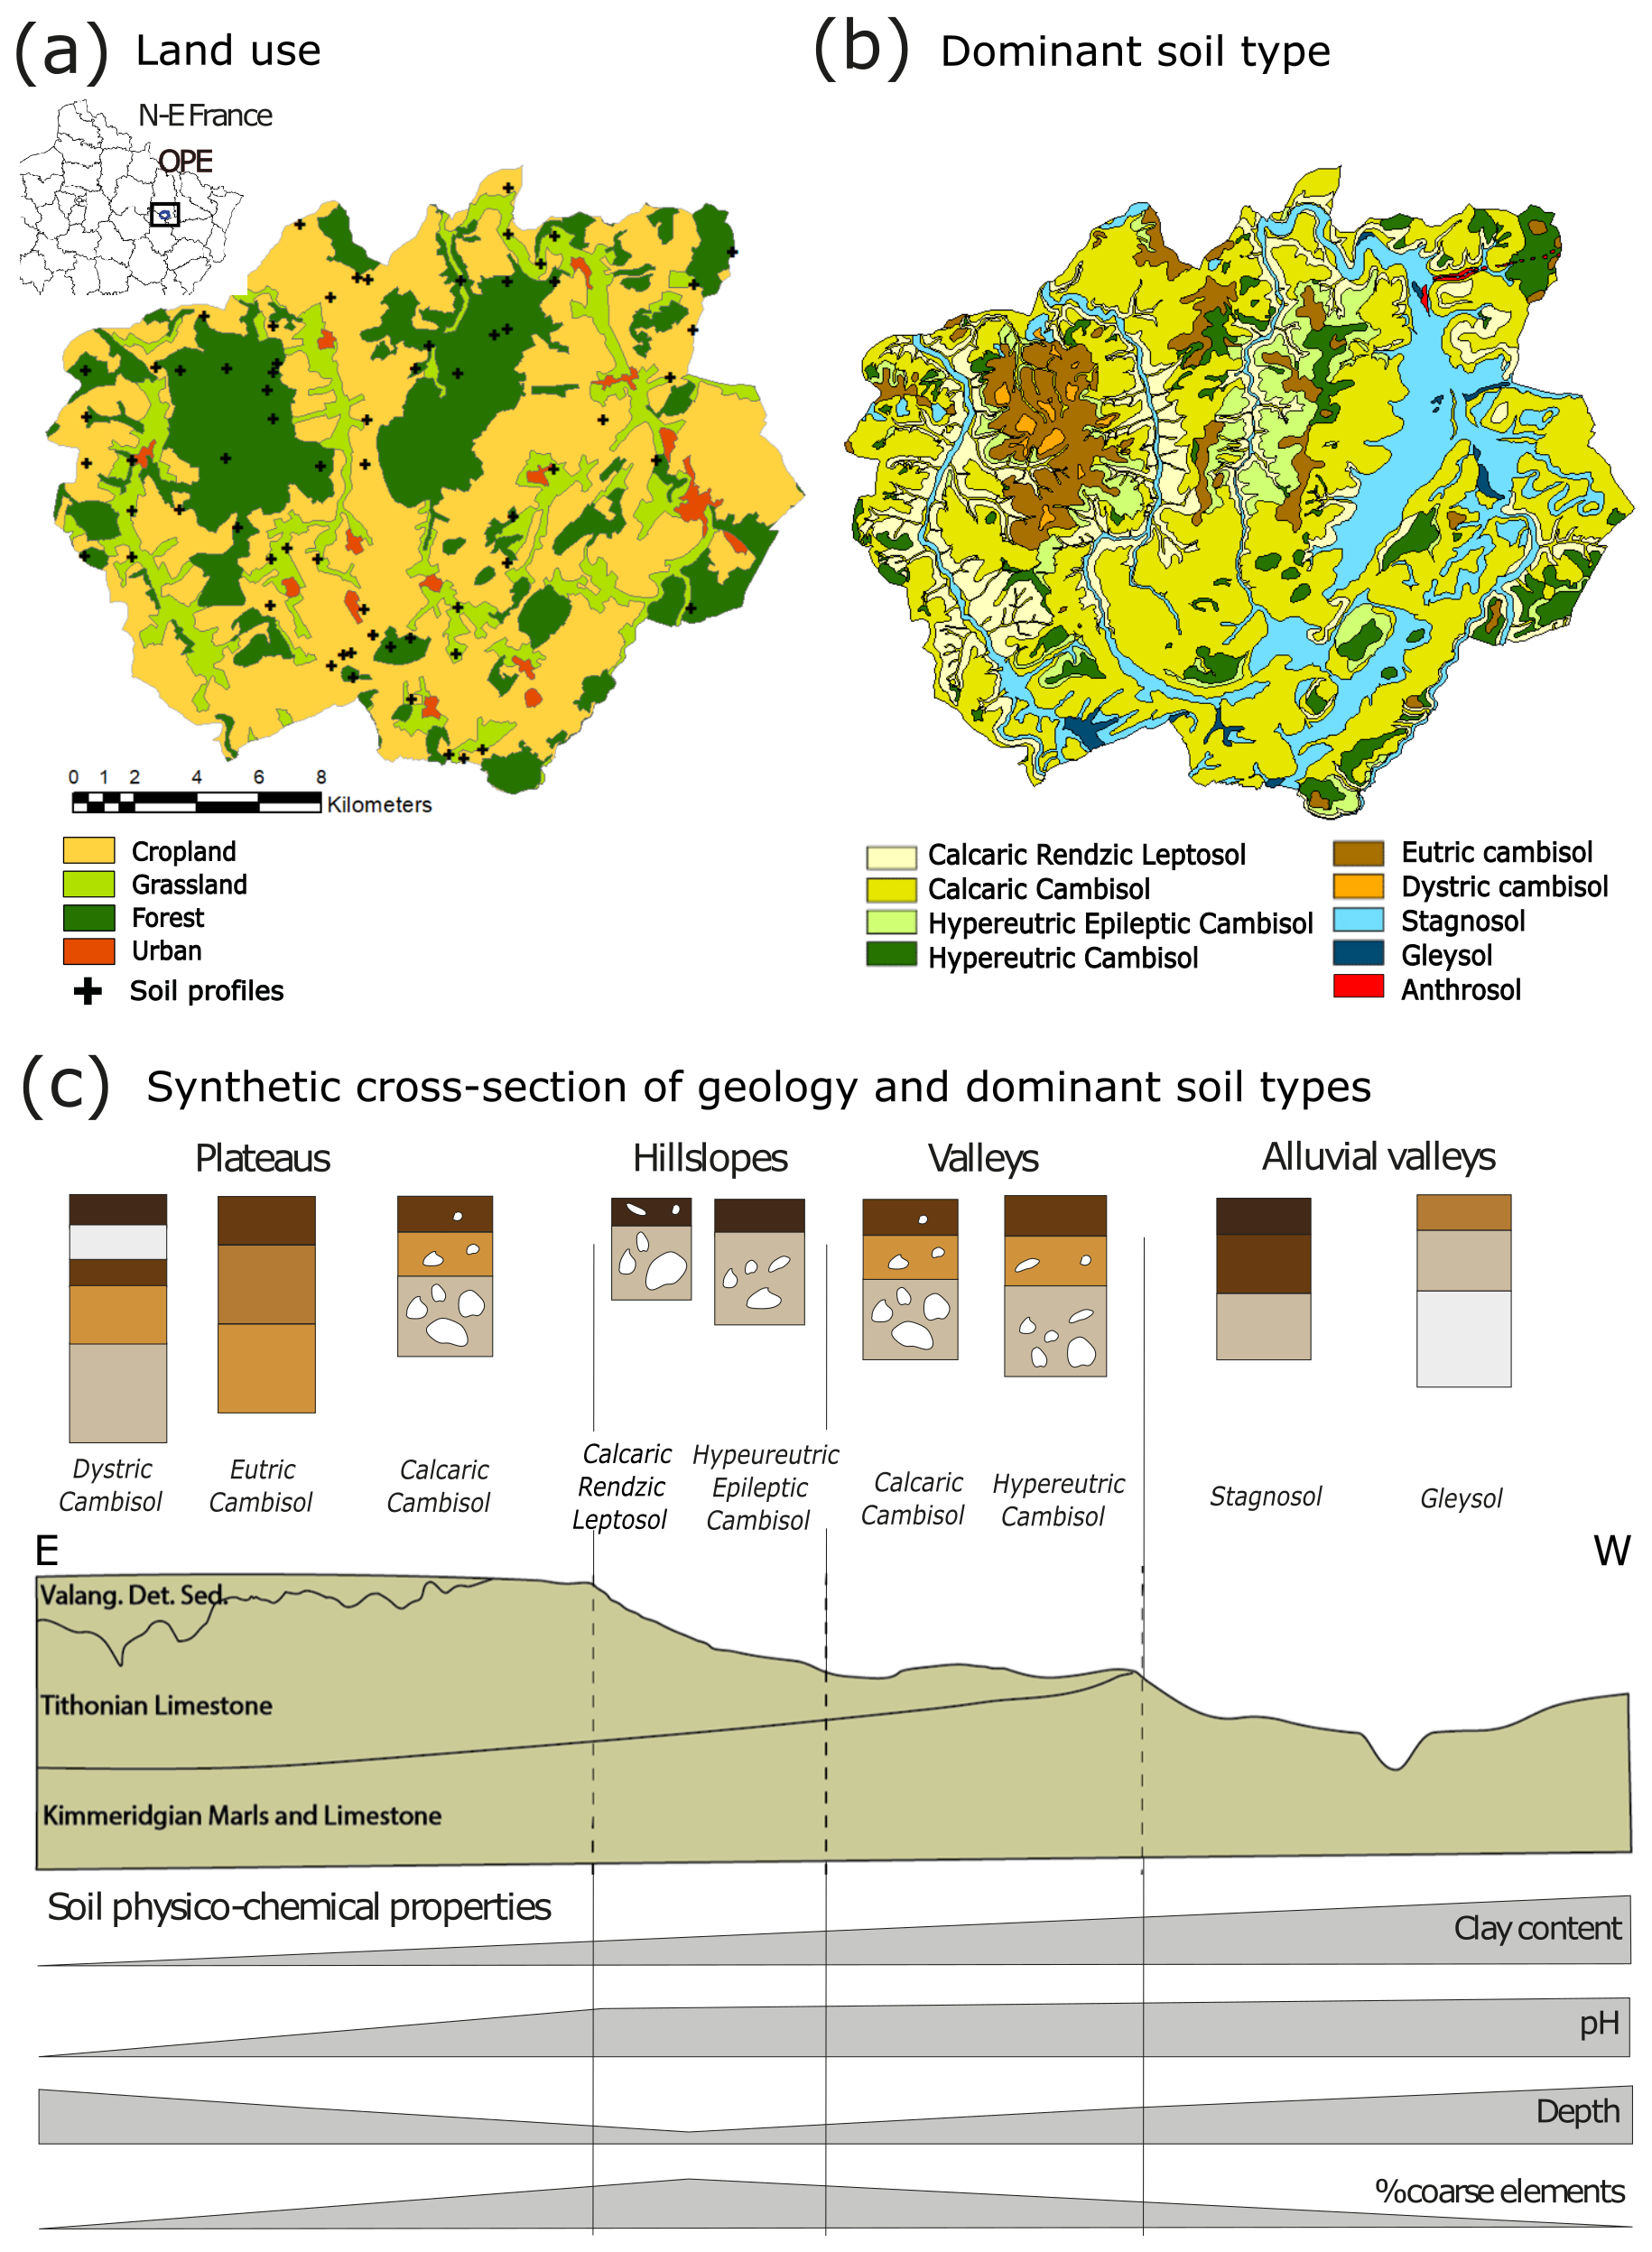
Figure 1Land uses, soil types, and geomorphological context of the study region. (a) Land use (data source is CORINE Land Cover 2018). (b) Map of dominant soil types (data source is Party et al., 2019). (c) Synthetic cross section of the geology, topography, and dominant soil types in the region of study.
2.2 Estimation of initial and maximum SOC stocks
2.2.1 Initial SOC stocks
Soil organic carbon stocks per surface unit are calculated as follows (Chen et al., 2019):
where SOCstock is the total SOC stock (kg m−2), p the soil thickness (m), SOC the soil organic carbon content (g kg−1), BD the bulk density (kg m g dm−3), and % rock fragments the percentage of elements >2 mm (%).
This methodology assumes that the fraction >2 mm does not contain organic carbon, which has been disputed by Harrison et al. (2011) in cases where the rock fragments are abundant and display signs of porosity and weathering.
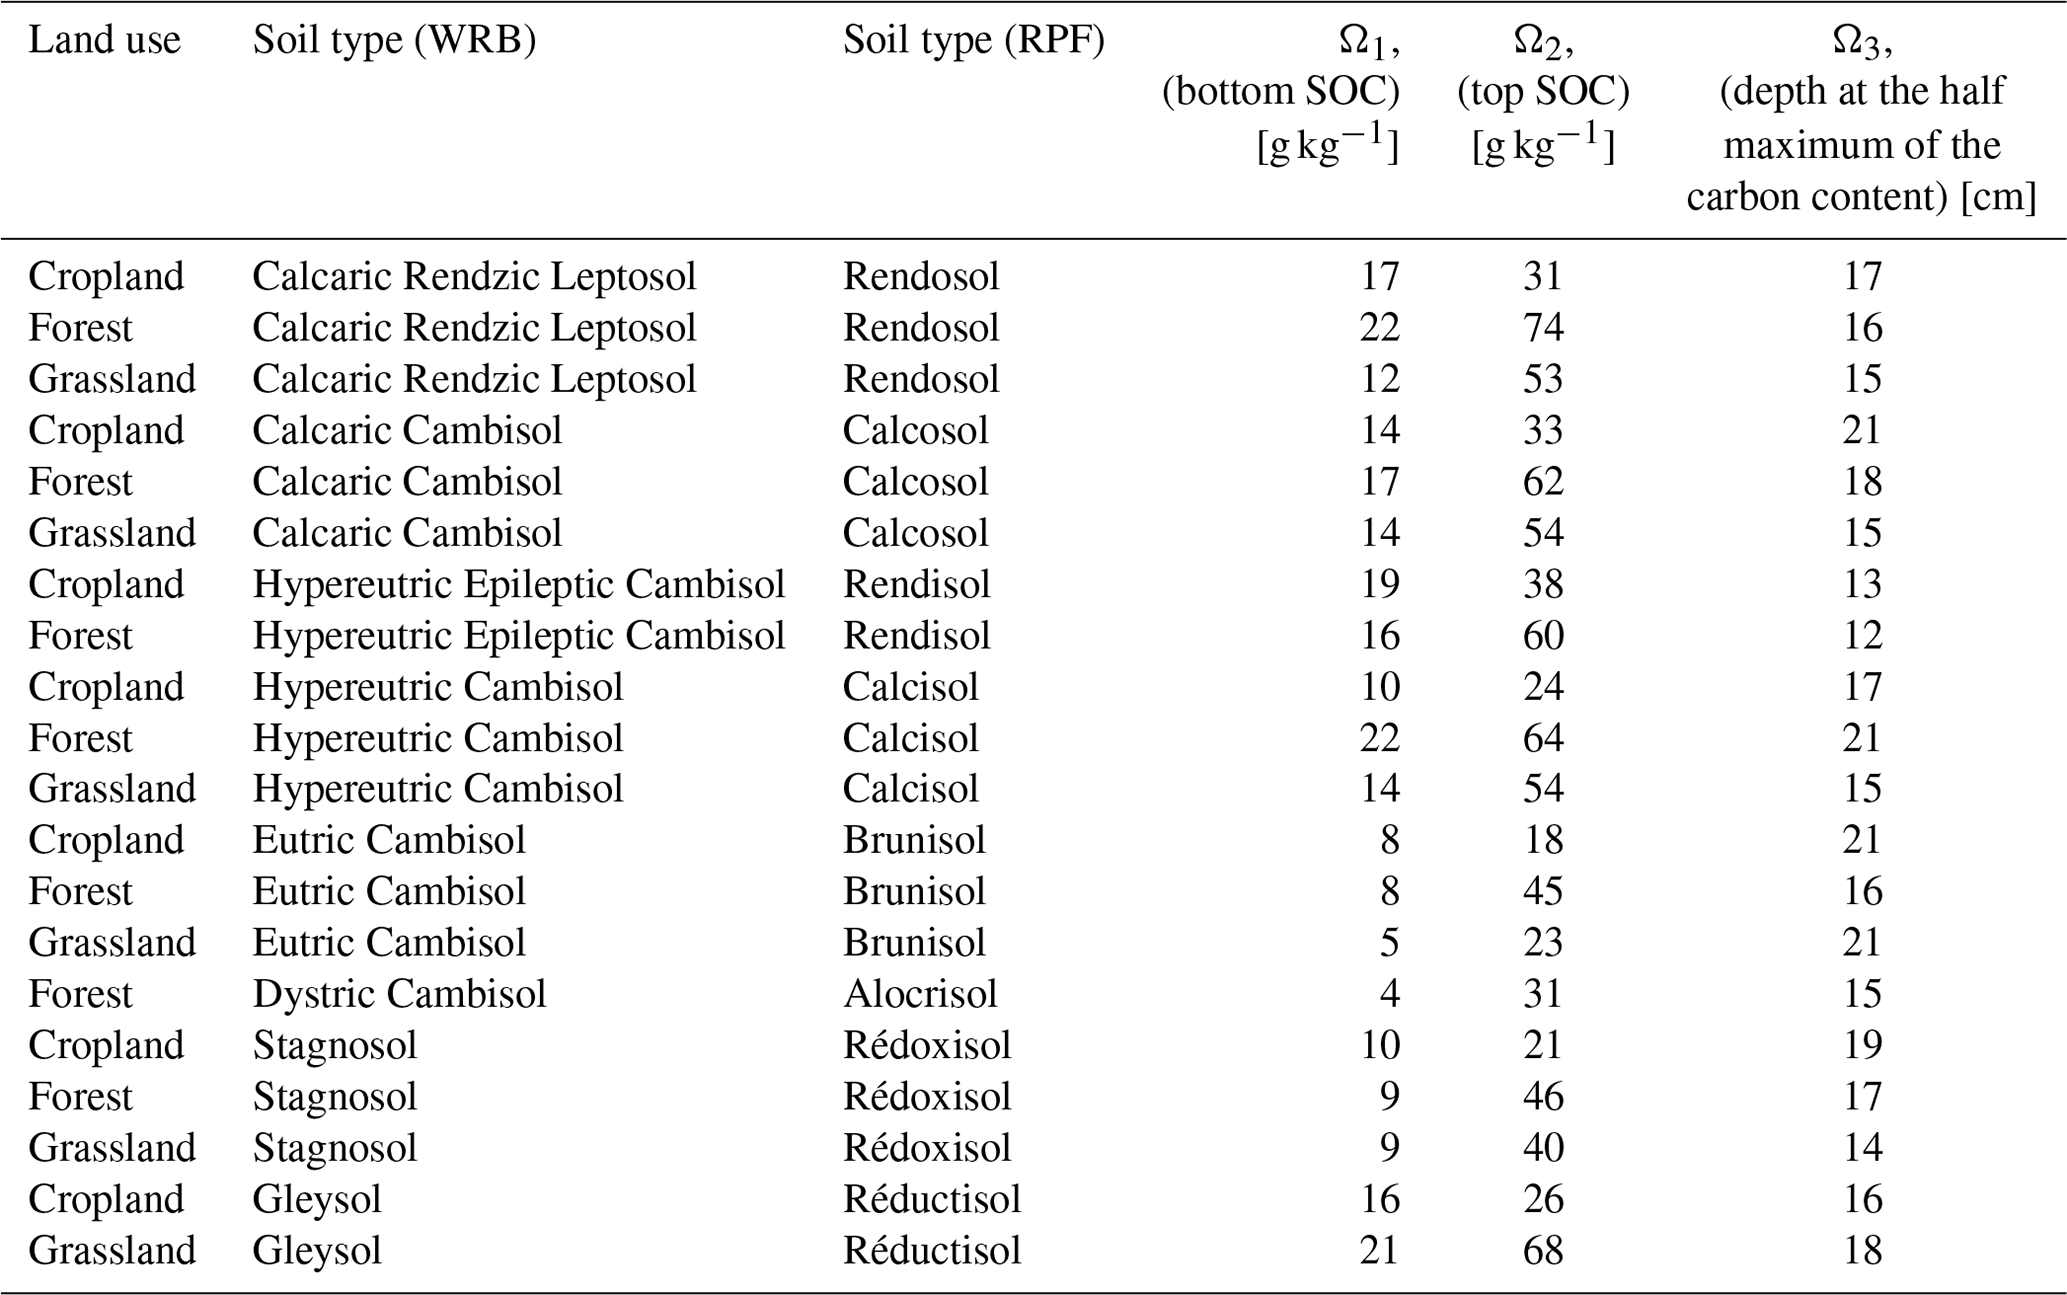
The median soil organic carbon content (SOC in g kg−1) as a function of depth for each soil type and land use was calculated using the typical SOC content profile established by Mathieu et al. (2015) and Jreich (2018) on the basis of three descriptors: Ω1, the SOC content of the soil type at maximal depth; Ω2, the SOC content at the surface; and Ω3, the depth at the half maximum of the SOC content:
where s is the soil type and z the depth.
This method was used to interpolate SOC content data from national and regional datasets acquired per horizon in order to obtain the continuous distribution of SOC stock over the whole soil profile for each soil type and land use considered. A least-squares method for non-linear curve-fitting (MATLAB function lsqcurvefit) was then applied to adjust the parameters Ω1–3 (Table A2).
Continuous vertical profiles of median bulk density were then obtained for each soil type using a logarithmic fit. The horizon thickness and percentage of rock fragments correspond to the median of the values per horizon per soil types in the 86 profiles within the OPE zone. This gave us a continuous profile of median SOC stocks as a function of depth, corresponding to the initial SOC stock profile. The dataset was collected between 1995 and 2019, but since land use has not changed since 1830, the soil profiles were assumed to be in a steady state and to represent the initial SOC stocks before the implementation of C input modelling scenarios. The median SOC stock was then calculated at each 1 cm interval along the whole profile based on the median bulk density curve, the median SOC curve, and the percentage of rock fragments.
2.2.2 Theoretical maximum SOC stocks and maximum SOC accrual
The theoretical maximum SOC stocks in this study are theoretical targets based on the upper values of the SOC data observed within the region. These targets represent the SOC stock that a given soil type can reach by implementing the land management strategies represented in the region of study. The theoretical maximum SOC stock is therefore region-dependent as it is driven by not only the intrinsic textural properties of the soil, but also the climate and the ecosystem plant productivity as they influence soil biology and chemistry along the soil profile. The maximum SOC accrual corresponds to the difference between the theoretical maximum SOC stock and the initial SOC stock.
The regression fit method applied using Eq. (3) from Jreich (2018) worked iteratively by first computing the 50th-percentile boundary line (median profile corresponding to the initial SOC stocks) and removing all data points inferior to that line. The process was then repeated for the 75th percentile, then the 88.5th, and finally the 94th. The choice in percentile value strongly affects the estimation of maximum SOC stocks (Chen et al., 2019). In our case, since the number of SOC data points per soil type ranges from 29 (Hypereutric Epileptic Cambisol) to 268 (Stagnosol), the 75th boundary line is calculated based on 14 to 134 data points, the 88.5th percentile based on 7 to 67 data points, and the 94th percentile based on 3 to 34 data points. We chose the 75th boundary line to define the theoretical maximum SOC stocks. We also calculated the 88th percentile boundary line to discuss its impact on theoretical maximum stocks and on subsequent SOC dynamic modelling.
A bootstrap method was used to determine the overall uncertainty in the initial SOC stocks and maximum SOC accrual for each soil type at the 90 % confidence interval (Chen et al., 2019). We generated random subsets of input parameters SOC, BD, percentage of rock fragments, and depth values within the standard deviation of each soil type and repeated the procedure 1000 times to obtain 1000 estimates of the mean and percentiles values of the carbon stocks.
2.3 Simulation of SOC accrual at different timescales
Our modelling approach is illustrated in Fig. 2, with further details on model functioning and equations in Appendix B. The profiles of initial SOC stocks were first discretized into 10 cm layers. In each layer, we applied a three-pool model with a fast-cycling pool, a slow-cycling pool, and an inert pool, where the dynamic pools are ruled by exponential kinetics. SOC stocks do not saturate and are linearly dependent on C inputs for a given situation. The pools' relative size and turnover were calibrated by Balesdent et al. (2018) using a global database of change in stable carbon (C3/C4) signatures measured over multiple campaigns, over decadal timescales, for 112 grassland, forest and cropland sites. The C3/C4 approach is typically efficient for following carbon dynamics over timescales ranging from 1 to 1000 years, especially compared to the 14C method, which covers timescales of several thousands of years (Verma et al., 2017). We corrected the model parameters calibrated at the global scale in Balesdent et al. (2018) to account for local conditions of temperature, humidity, pH, clay content, and CaCO3 content as recommended by Rasmussen et al. (2018). This was done using the equations from the AMG model (Andriulo et al., 1999; Saffih-Hdadi and Mary, 2008; Clivot et al., 2017; Levavasseur et al., 2020). The mean residence times as a function of depth derived from the corrected mineralization factors in the fast and slow pools can be found in Table C1.
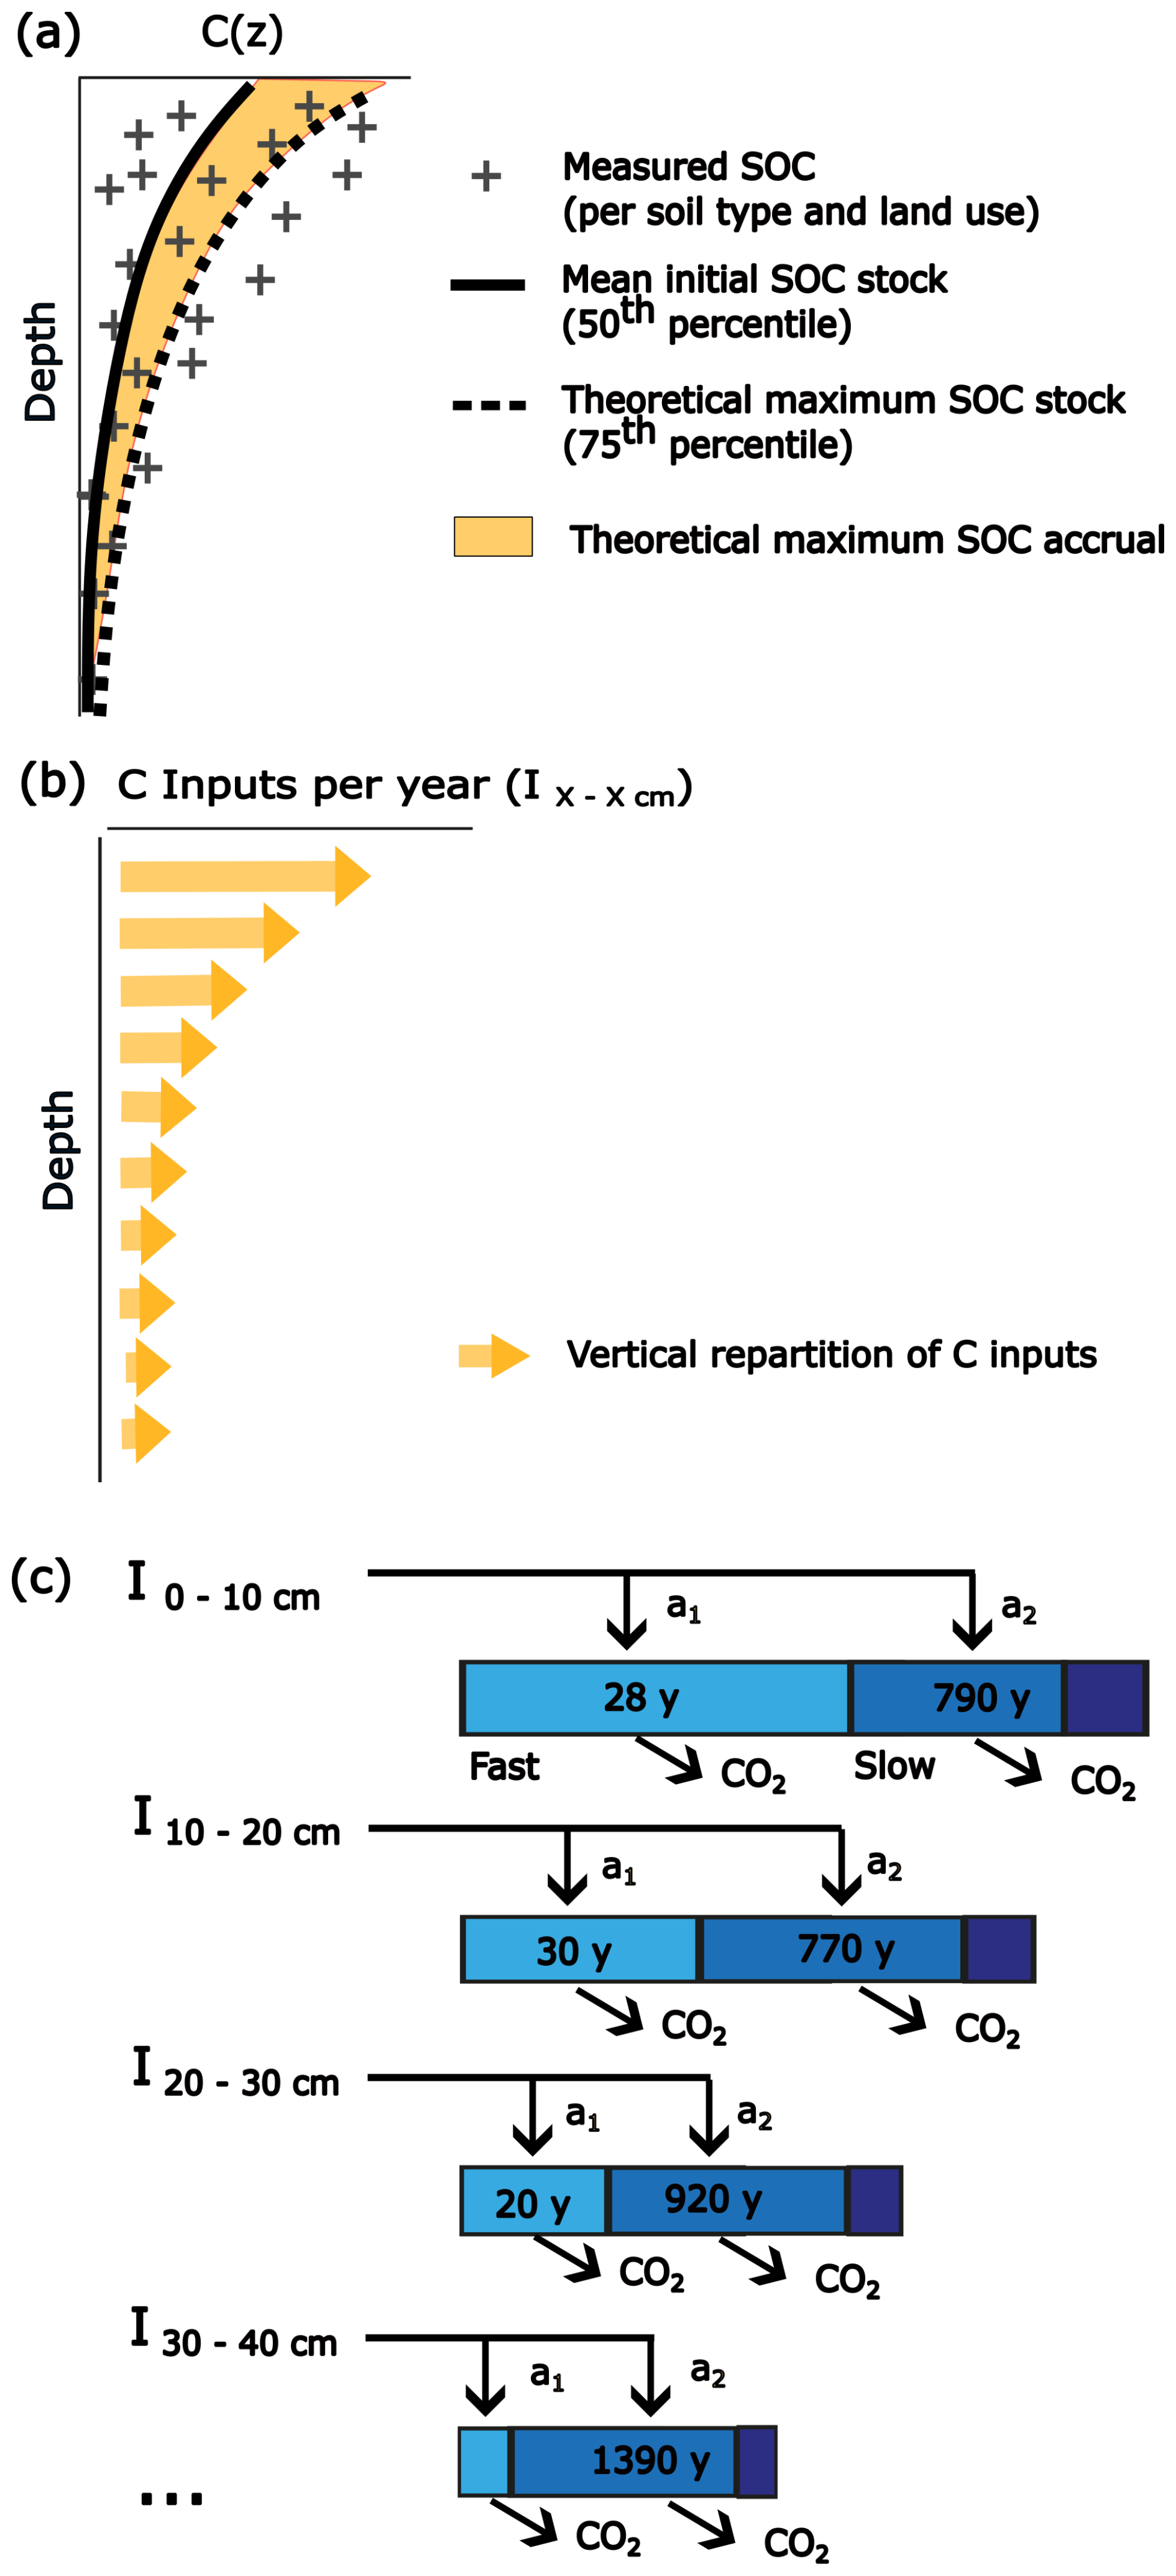
Figure 2Summary of our approach: (a) estimation of initial and theoretical maximum SOC stocks from the measured data; (b) estimation of vertical repartition of C inputs for the different scenarios considered, obtained by matrix inversion; (c) functioning of the depth-dependent three-pool model (fast-cycling pool, slow-cycling pool, and inert pool). The letter a denotes the allocation factor, MRT stands for the mean residence time (in years), and y stands for years. MRT values vary with depth as per Balesdent et al. (2018) and are corrected for temperature, humidity, pH, texture, and CaCO3; values displayed correspond to the mean MRT values per pool and depth section (see the “Materials and methods” section for details and Table C1 for MRT values for each soil type and depth). The initial C inputs and maximum C inputs are provided in Table C2.
We modelled three different scenarios of C inputs to explore how much SOC might accrue after 25 years:
-
Scenario 1 (initial input regime). This scenario corresponds to the annual C inputs necessary to maintain the initial SOC stocks in each soil type and land use, obtained by matrix inversion (Mao et al., 2019); there is no SOC accrual in this case.
-
Scenario 2 (extreme input regime). This scenario corresponds to the annual C inputs necessary to reach the theoretical maximum SOC stocks within 25 years, obtained through iterative optimization of the model.
-
Scenario 3 (realistic increased input regime). The final scenario defines C input values higher than in scenario 1 that are compatible with the ranges of gain in C inputs after implementation of practices promoting C sequestration found in the literature: +0.5 tC ha−1 yr−1 for forests, +1.0 tC ha−1 yr−1 for grasslands, and +1.5 tC ha−1 yr−1 for croplands.
For scenario 3, we sought values of typical current plant inputs and of realistic increased inputs from the literature or from existing data within the region of study. Typical current C inputs in forests range within 1.6–2.8 tC ha−1 yr−1 according to measurements carried out in the RENECOFOR network in the region of study, assuming 50 % mineralization of aboveground input in the forest floor (Mao et al., 2019). Changes in harvest practices towards the non-export of harvest residues after thinning could provide additional inputs in the range of 0.5–2 tC ha−1 yr−1 (total realistic input range: 1.6–4.8 tC ha−1 yr−1) (Mao et al., 2019). In grasslands, annual inputs to the soil range within 1.18–5.2 tC ha−1 yr−1 according to studies from Australia and western Europe (methods used are RothC inverse modelling, allometric equations using yield data, and expert opinion) (Martin et al., 2021). In croplands, annual inputs to the soil range within 1.8–6.8 tC ha−1 yr−1 according to studies conducted worldwide (methods used are direct measurements, RothC inverse modelling, allometric equations using yield data, and expert opinion) (Martin et al., 2021). Within these ranges, the specific realistic values for the region of study were chosen by matrix inversion of the theoretical maximum SOC stocks, which provide the annual inputs necessary for the model to reach but to not exceed the maximum SOC stocks in the long term.
The equations of SOC stock evolution over time were then applied for these scenarios over 5000 years to visualize the new steady state and assess the maximum potential for C storage. Particular attention was given to the SOC accrual reached after 25 years to fit with the carbon neutrality timeline.
Finally, we tested the effect of projected rises in temperature on the simulated SOC accrual by modifying the mineralization correction factor linked to temperature (see Eq. B1). The temperature was increased linearly to projected annual temperatures in the region of study according to scenarios RCP4.5 (+1.0 °C) and RCP8.5 (+1.3 °C) according to model simulations by the Météo France ALADIN63_CNRM-CM5 model within an 8 km radius area around Bure (55087), comparing the intervals of 2046–2055 and 2009–2019 (DRIAS, Météo France, CERFACS, IPSL). This corresponds to an increase in mean annual temperatures from 10.4 to 11.4 °C (RCP4.5) or 11.9 °C (RCP8.5) over 25 years at all depths. RCP8.5 amounts to an extreme scenario in terms of increased mineralization rates since, in addition to using the most pessimistic RCP scenario, our model assumes that rises in temperature propagate instantly at depth and that humidity conditions remain at the present levels. We tested the sensitivity of SOC accrual in the two temperature scenarios in the different soil types and land covers.
2.4 Spatialization
The study site was divided into zones characterized by their land use (cropland, grassland, or forest) and by their dominant soil type. Mapping zones were derived from the intersection of the CORINE Land Cover map and of the soil map. Values of SOC stocks, maximum SOC accrual, and simulated accrual after 25 years were then associated with each mapping zone.
Mapping results are by necessity a simplification of the real distribution of soils properties and SOC contents. Figure 1b shows the dominant soil type in each mapping zone, but in reality, due to the high spatial variability in soil characteristics, each mapping zone contains several soil types that cannot be explicitly delimited on the map at this spatial resolution. Therefore, each point within a given zone has a probability of belonging to one of several soil types (e.g. 70 % chance of being a Eutric Cambisol and 30 % chance of being a Stagnosol). The total SOC stock for a zone is then obtained by the weighted mean of the SOC stocks (e.g. 70 % of the SOC stock for Eutric Cambisols and 30 % of the SOC stock for Stagnosols). The standard deviation of the total SOC stock should likewise be obtained by the weighted standard deviations of the SOC stocks. The local uncertainty corresponds to expected local variations in the zone if the different soil types have contrasting SOC stocks. We visualized this local uncertainty by mapping the contrasts in SOC stocks within each zone in Fig. D1.
3.1 SOC stock and maximum SOC accrual as a function of depth, land use, and soil type
3.1.1 Vertical repartition of SOC stocks
Current SOC stocks over the whole-profile range from 78 to 333 tC ha−1 (Table 2), of which 59 to 156 tC ha−1 are in the topsoil (0–30 cm). The lowest SOC stocks are found in the shallower soil types (Calcaric Rendzic Leptosol and Hypereutric Epileptic Cambisol). Current SOC stocks are twice to 3 times higher in hydromorphic soils (Stagnosols and Gleysols) compared to non-hydromorphic soils.
SOC content and stocks decrease with depth, with sharp decreases in the SOC stock profiles corresponding to a change in the percentage of rock fragments between two horizons (Fig. 3). On average, excluding the shallower soil types (Calcaric Rendzic Leptosol and Hypereutric Epileptic Cambisol), the proportion of the SOC stock situated in the first 30 cm is 53 % for croplands, 67 % for grasslands, and 71 % for forests (Table E1). The soils in croplands are therefore depleted in SOC in the topsoil compared to forests and grasslands (Fig. 3a). The difference in SOC stocks between land uses diminishes in the deeper horizons.
Table 2Initial SOC stocks, C input regimes to the soil considered in this study, theoretical maximum SOC stocks based on the 75th percentile of our regional dataset, and SOC stock after 25 years under a realistic scenario of C inputs, for each soil type and land use. Realistic range of annual C inputs to the soil is 1.8–6.8 tC ha yr−1 for croplands (Martin et al., 2020), 1.18–5.2 ha yr−1 for grasslands (Martin et al., 2020), and 1.6–4.8 ha yr−1 for forests according to measurements made in the region of study.
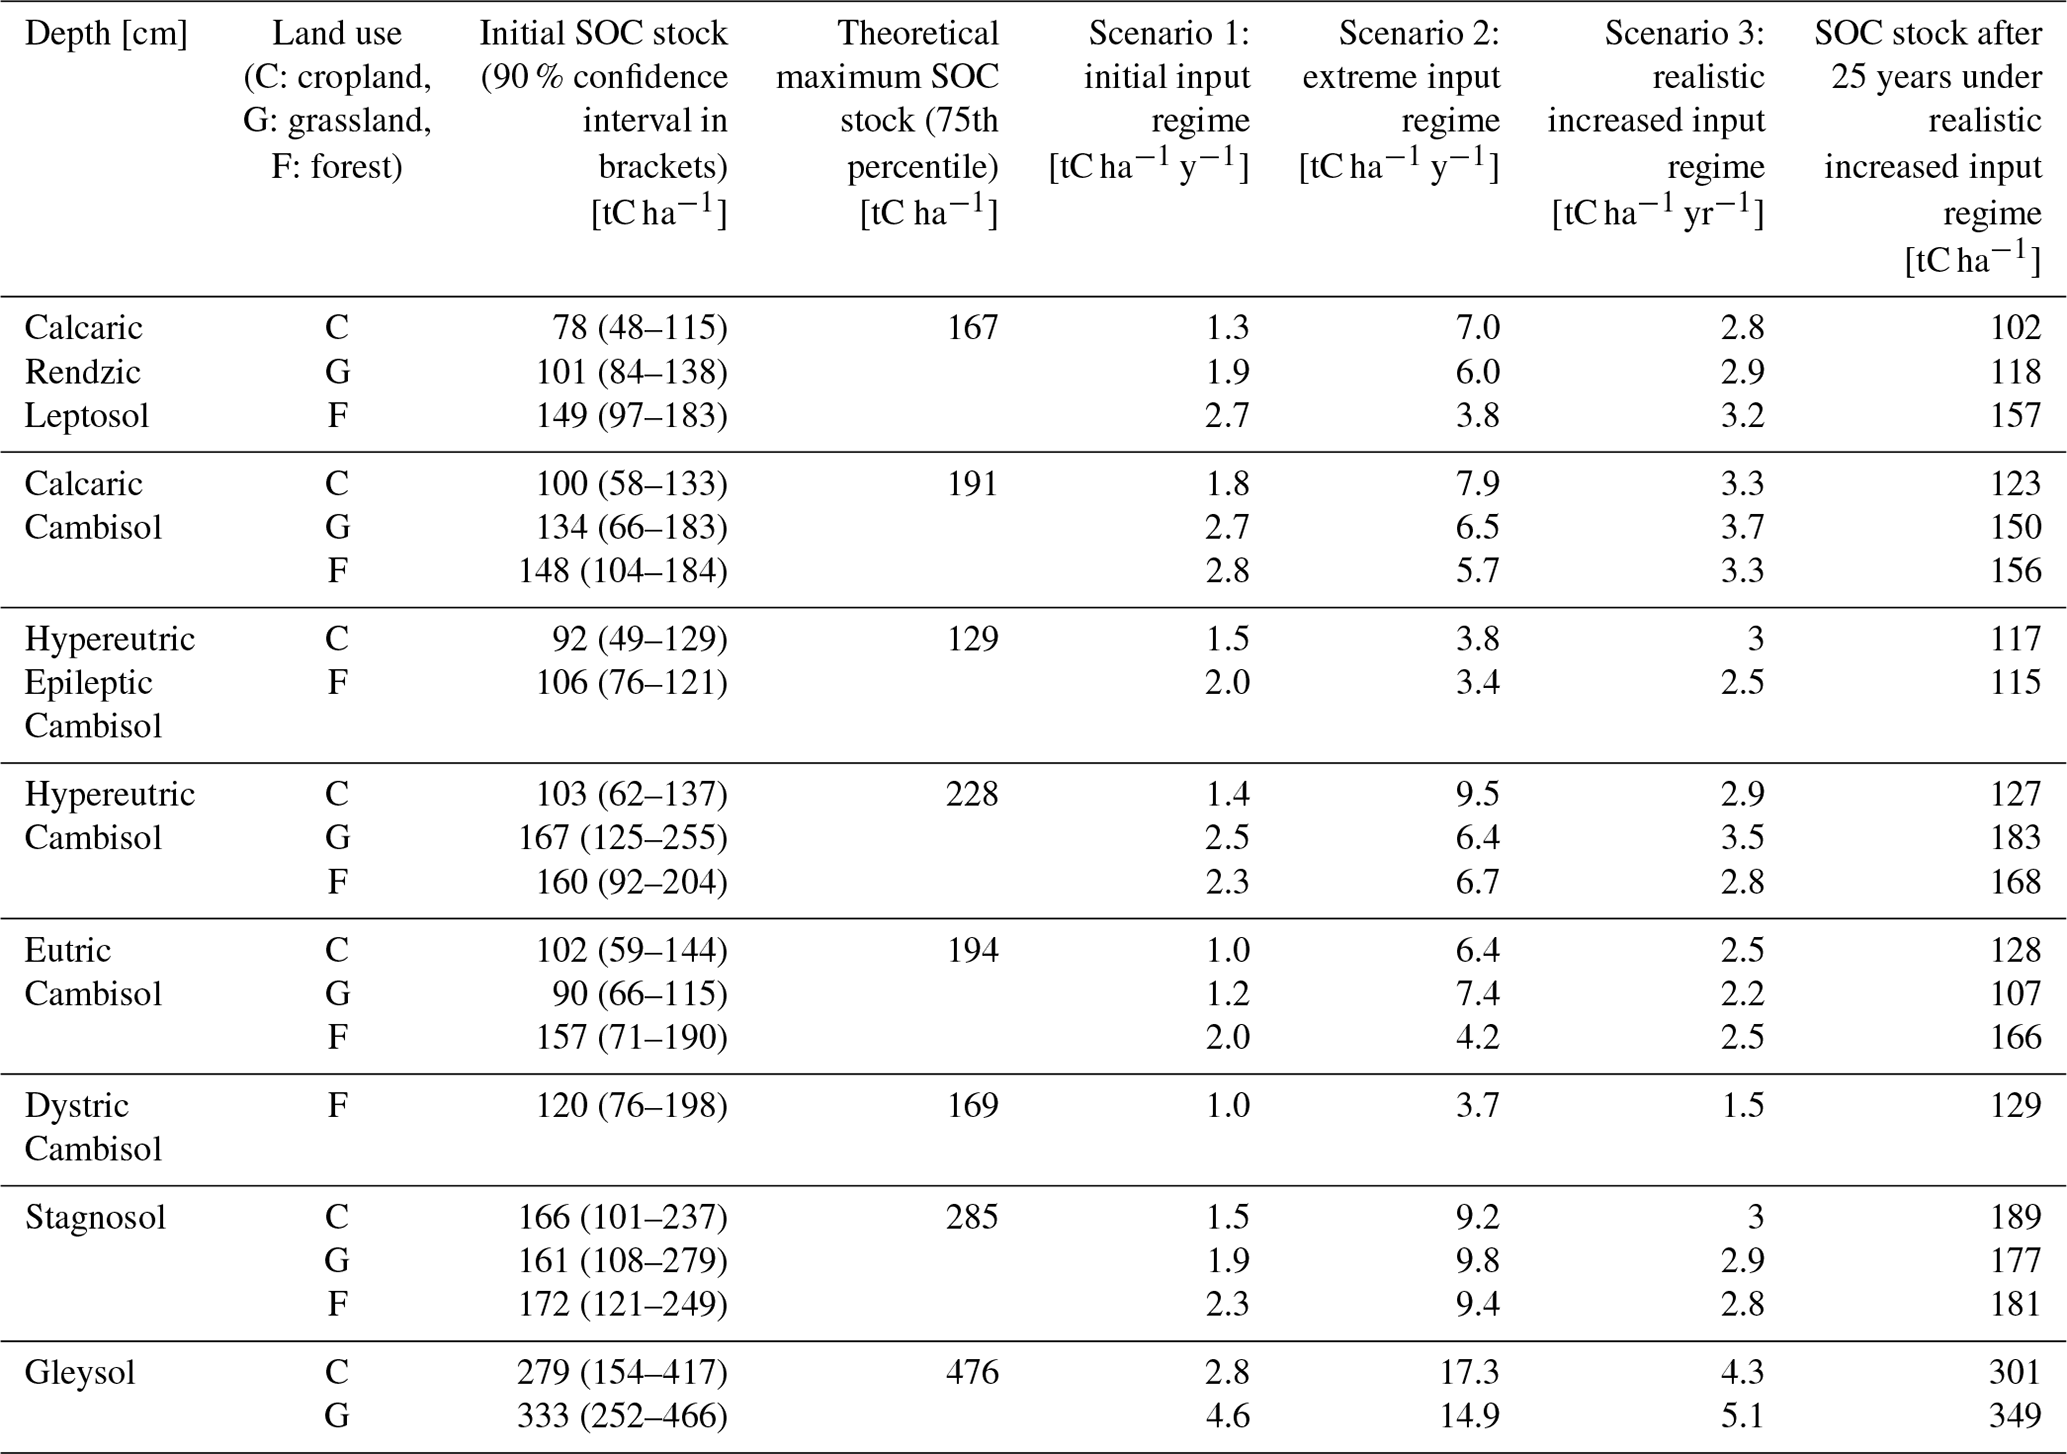
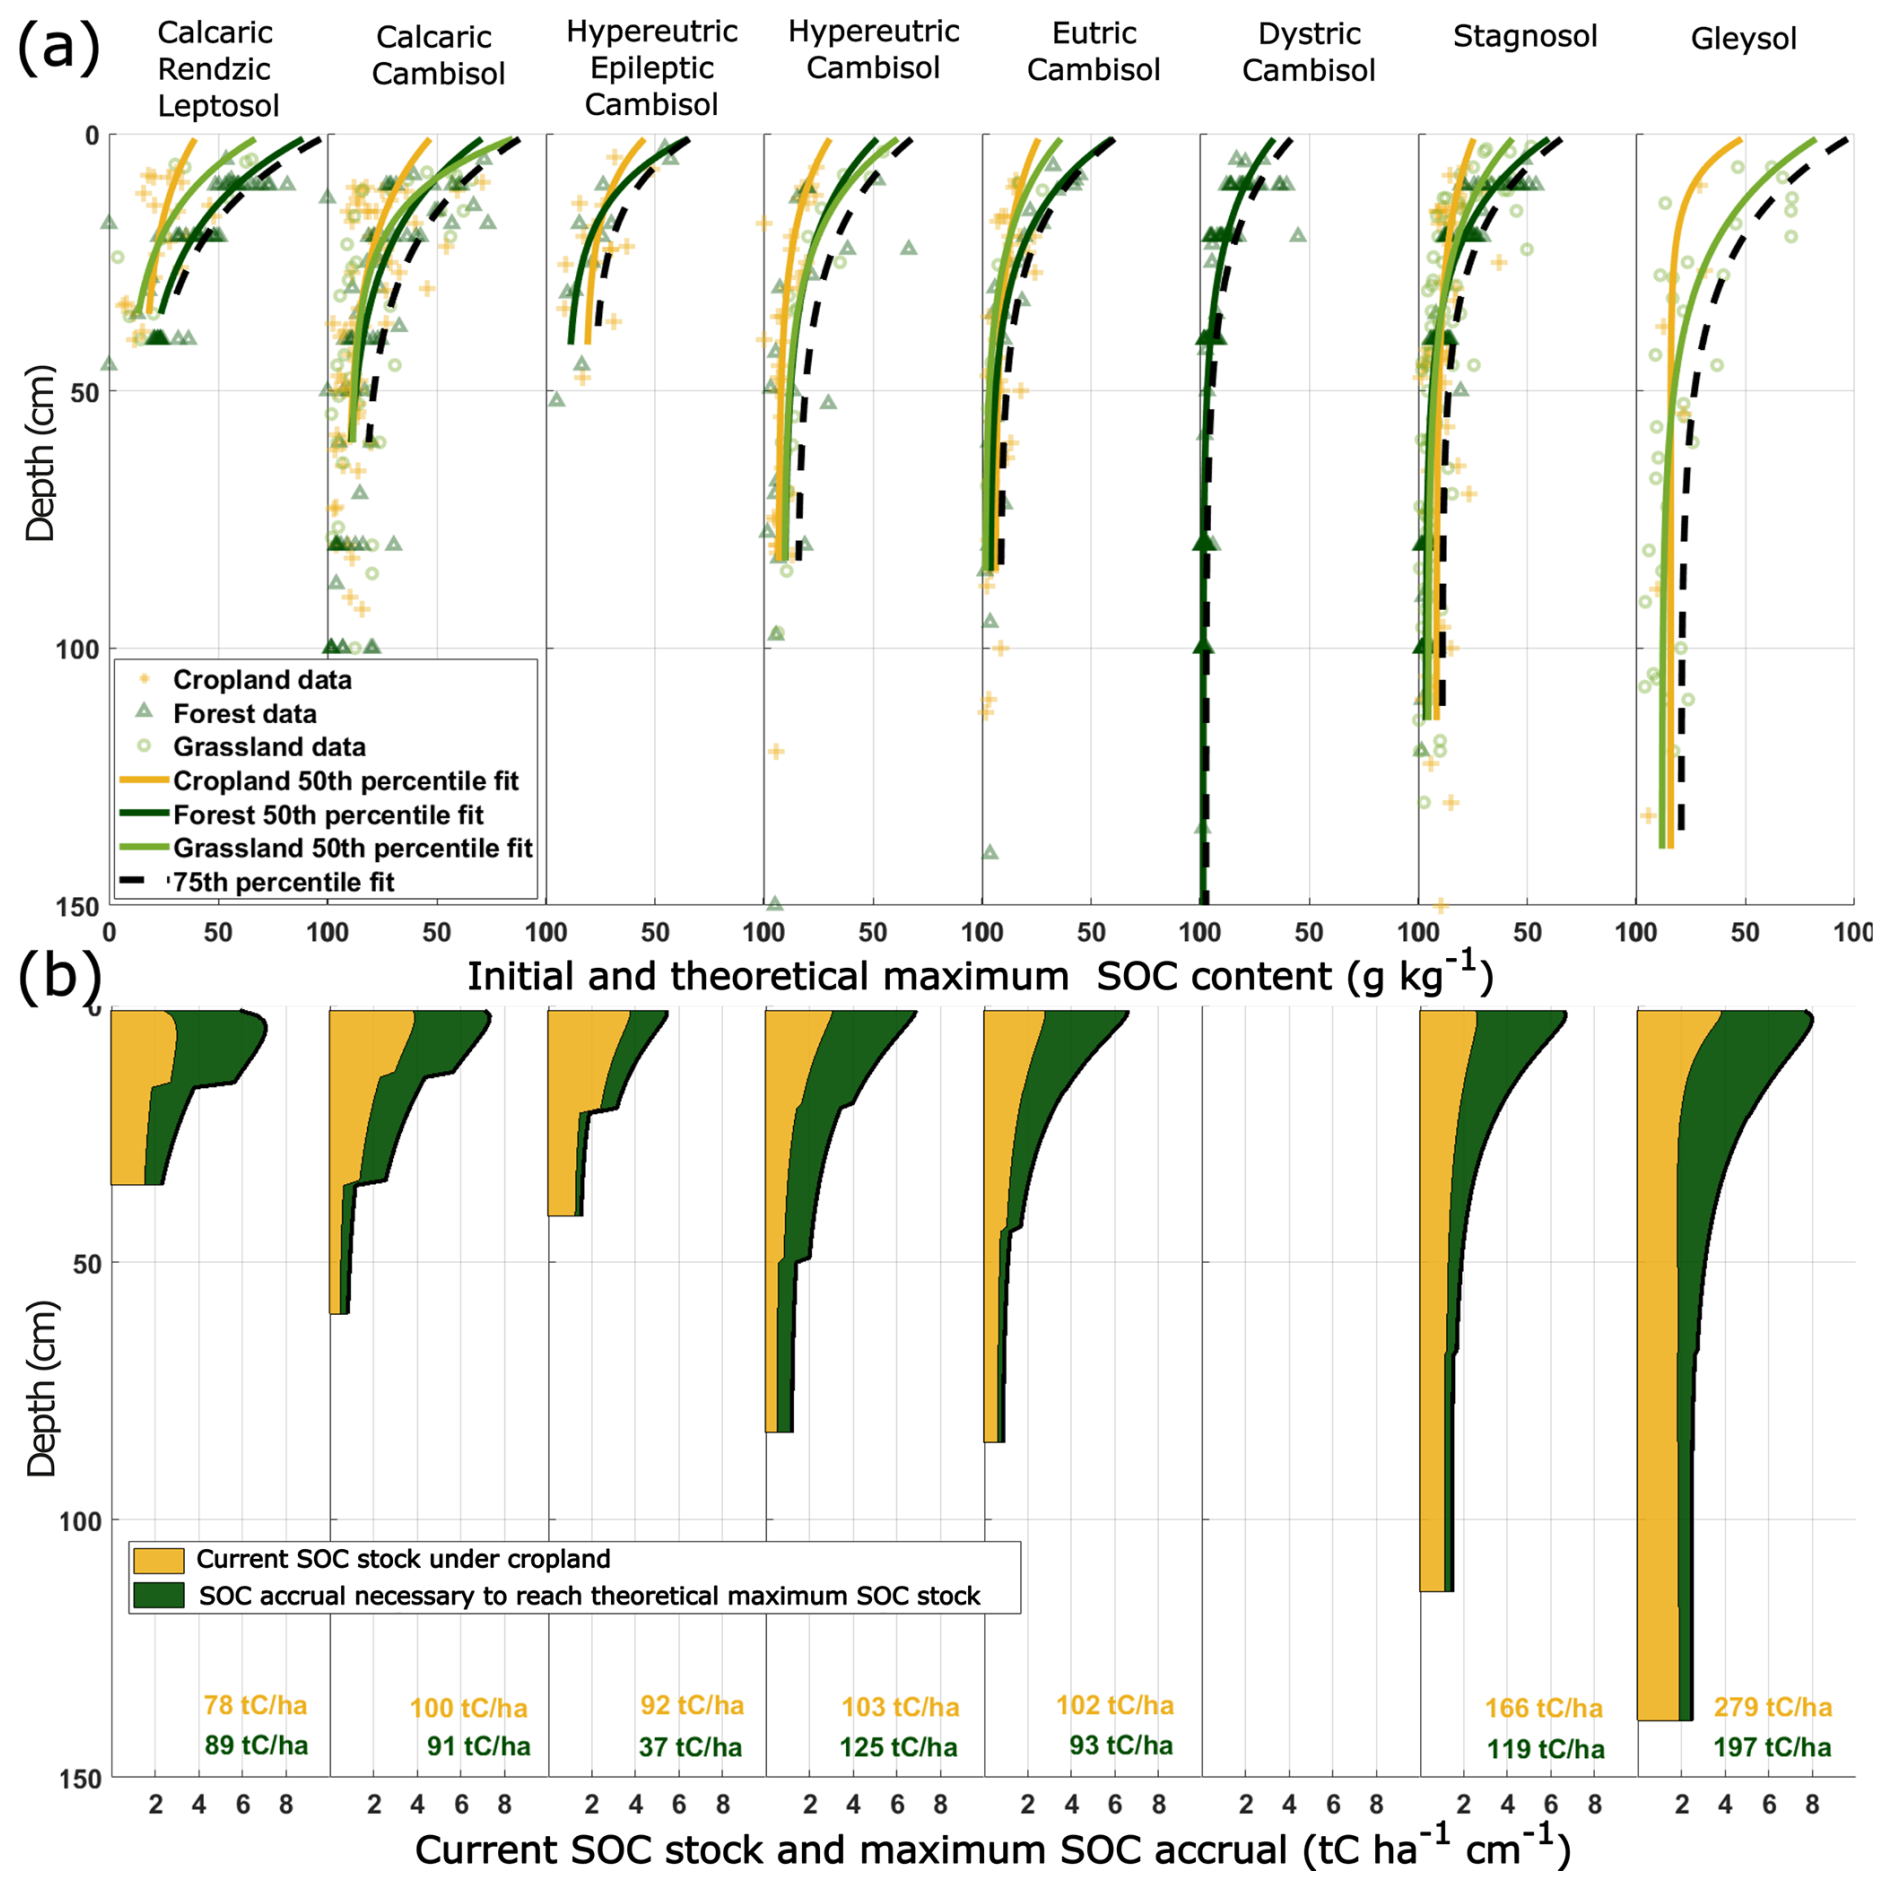
Figure 3(a) Median (50th percentile of the dataset for each land use) and theoretical maximum (75th percentile of the dataset) fitted depth profiles of SOC content in each soil type. The Jreich parameters (Jreich, 2018) used to plot the SOC content profiles are given in Table A2. (b) Current SOC stocks for croplands and maximum SOC accrual to reach the theoretical maximum SOC stocks of each soil type.
3.1.2 Theoretical maximum SOC stocks and maximum SOC accrual
The theoretical maximum SOC content decreases with depth for all soil types from 50–100 g kg−1 near the surface to under 25 g kg−1 at the bottom of the soil profiles (Fig. 3a). The theoretical maximum SOC stocks range from 129 tC ha−1 in the Hypereutric Epileptic Cambisol to 476 tC ha−1 in the Gleysols.
The maximum SOC accrual varies from 19 tC ha−1 for shallow, rocky forest soils to 197 tC ha−1 for agricultural Gleysols considering a conversion of cropland into grassland or forests. According to the 75th-percentile method, soils in the region of study are at 74 % of their theoretical maximum SOC stock on average, ranging between 16 % and 61 % for croplands, 30 % and 56 % grasslands, and 40 % and 82 % for forests. Across all land uses, the shallow rocky soils (Calcaric Rendzic Leptosol and Hypereutric Epileptic Cambisol) are closer to their theoretical maximum SOC stocks than the Stagnosols and Gleysols. Using the 88th percentile instead of the 75th increases our estimation of the theoretical maximum SOC stocks by about 16 % (9 %–27 % depending on soil type), without changing the hierarchy of maximum SOC stocks across the eight soil types (Table E1).
3.2 Exploring kinetics of simulated SOC accrual
The equations of our model calculate the SOC mean residence times per depth as a function of the physico-chemical properties of the studied soil types (see Eqs. B1–B5). In our study site, they range from 50–100 years above 30 cm and from 145–453 years below 30 cm (Table C1). The increase in mean residence time with depth is stark in the slow pool (from 477–1100 years in the first 10 cm to 1744–5817 years in the deeper soil horizons) but is hardly discernible in the fast pool (17–38 years in the first 10 cm to 11–47 years in the deeper soil horizons). Since most of the new C inputs are allocated to the fast carbon pool and in the surface horizons (Tables C1–C2), the SOC accrual is not strongly affected by soil type over 25 years.
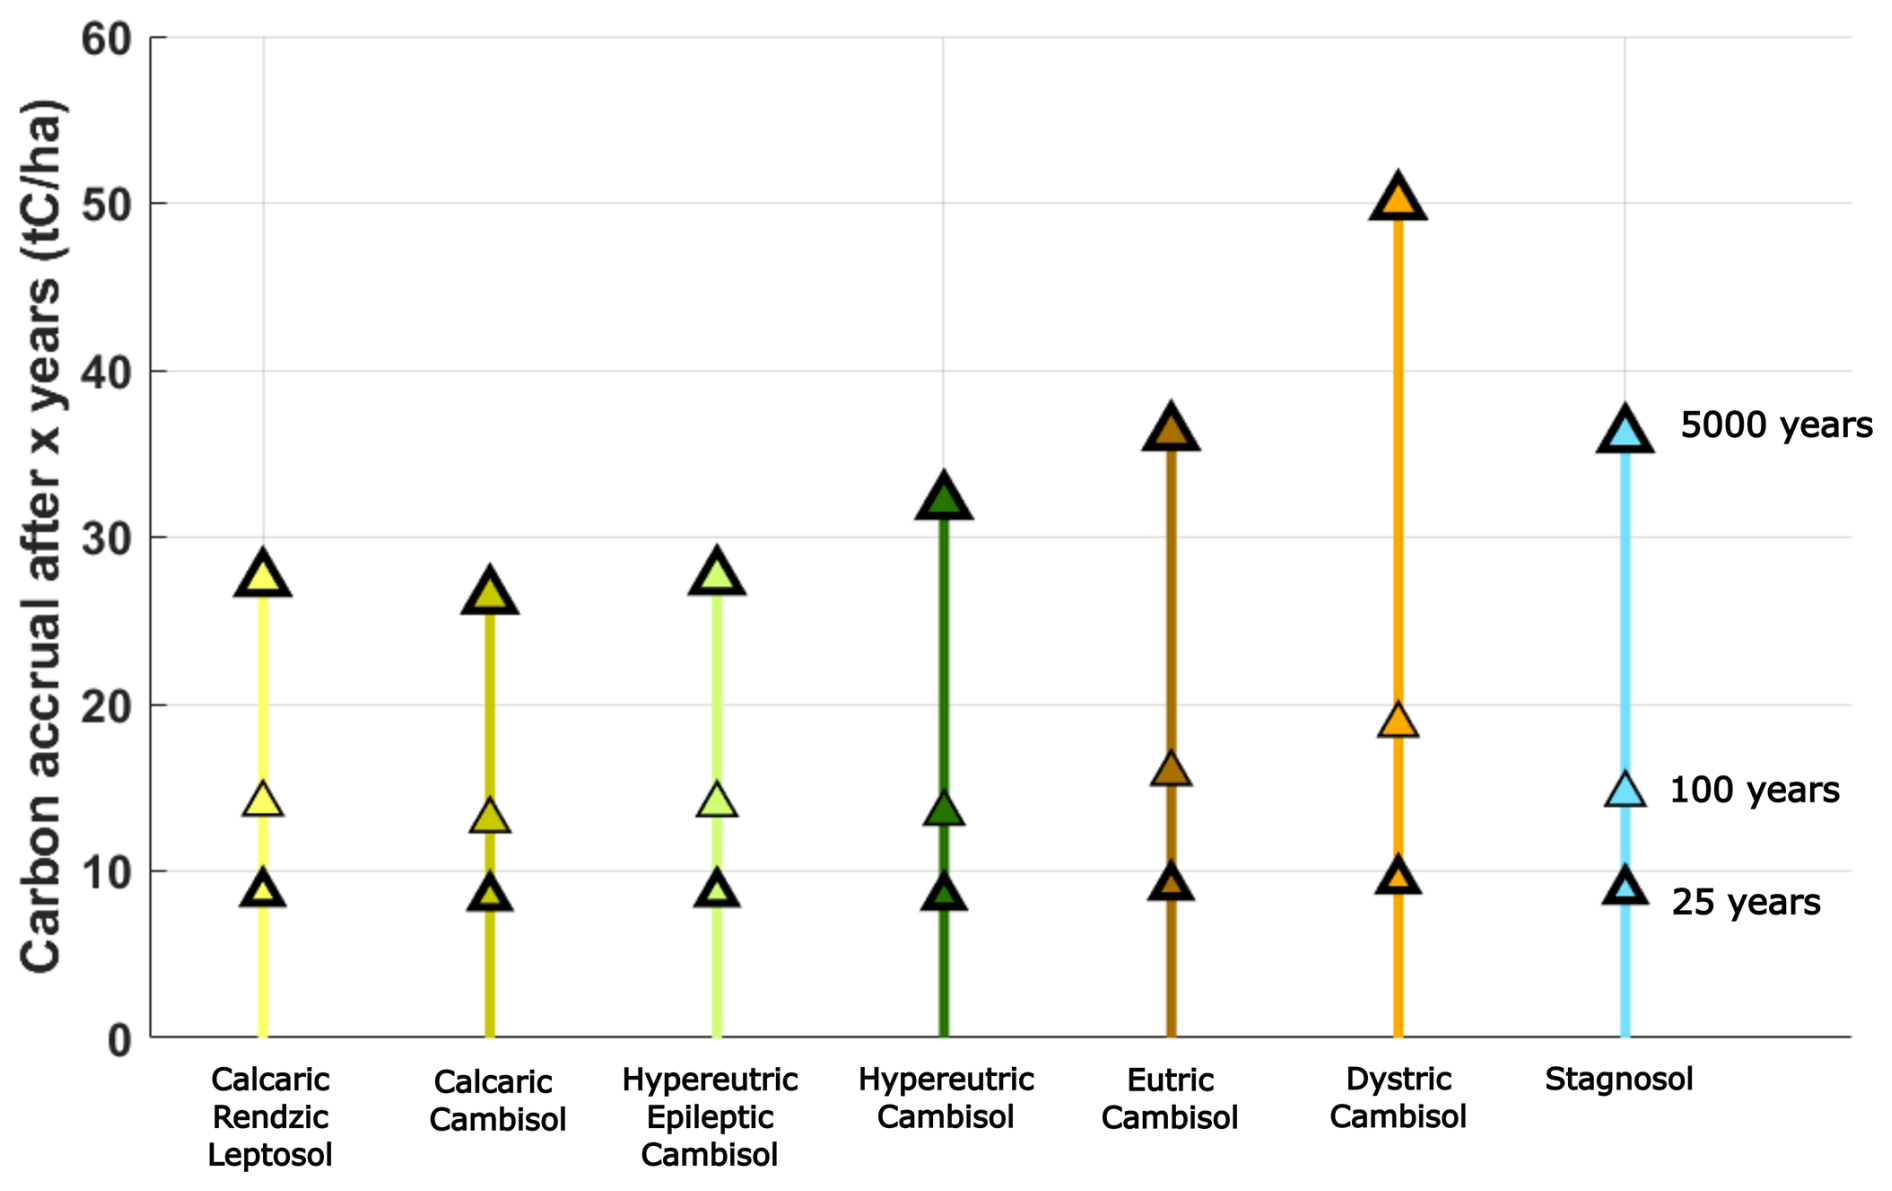
Figure 4Model results of SOC accrual after 25, 100, and 5000 years for forests for a scenario of +0.5 tC ha−1 yr−1 compared to the initial C inputs, with the temperature remaining constant.
The initial stationary C inputs obtained by model matrix inversion are, depending on soil type, between 1.0 and 2.8 tC ha−1 yr−1 for croplands, 1.2–4.6 tC ha−1 yr−1 for grasslands, and 1.0–2.8 tC ha−1 yr−1 for forests (Table 2). By contrast, the extreme input regime needed to reach the theoretical maximum SOC stocks within 25 years ranges between 3.8 and 17.3 tC ha−1 yr−1 for croplands, 6.0–14.9 tC ha−1 yr−1 for grasslands, and 3.4–9.4 tC ha−1 yr−1 for forests. The realistic increased input regime chosen based on the literature is 2.5–4.3 tC ha−1 yr−1 for croplands, 2.2–5.1 tC ha−1 y−1 for grasslands, and 1.5–3.3 tC ha−1 yr−1 for forests.
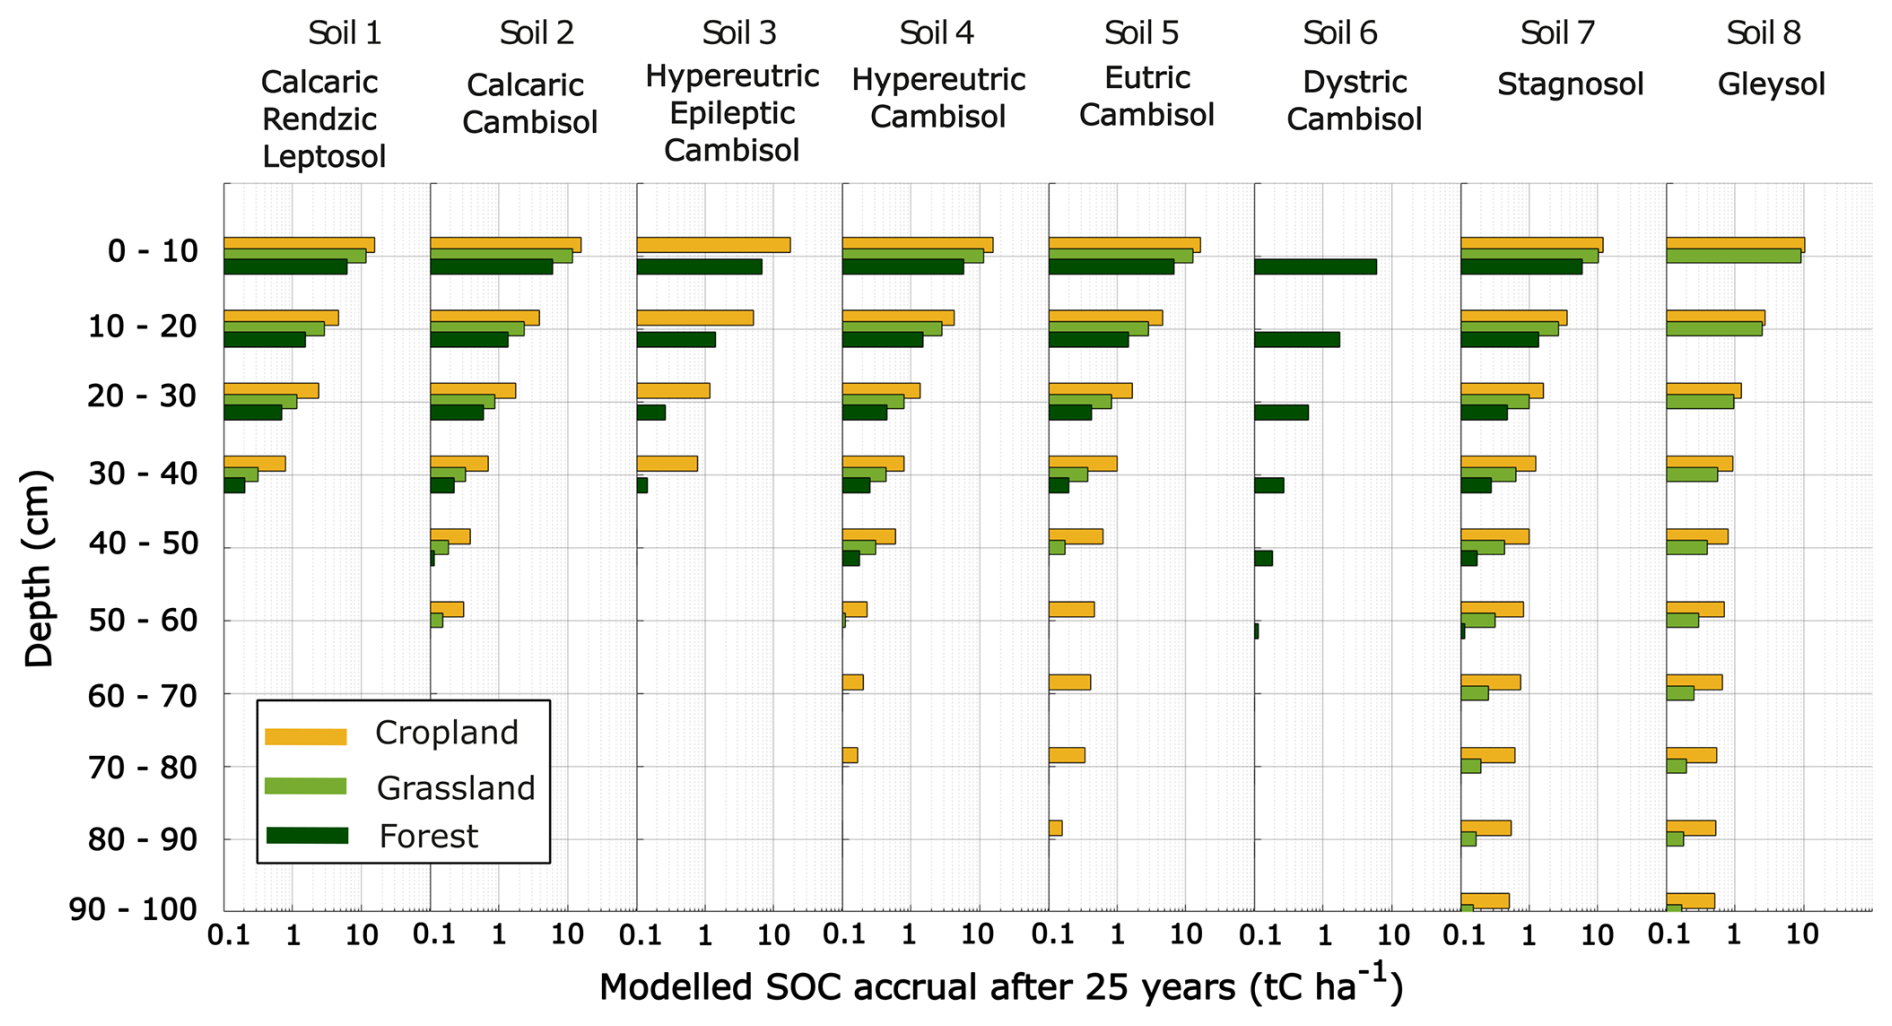
Figure 5Model results of SOC accrual after 25 years at each depth under the three considered C input scenarios (+1.5 tC ha−1 yr−1 in croplands, +1.0 tC ha−1 yr−1 in grasslands, and +0.5 tC ha−1 yr−1 in croplands compared to the initial C inputs), with the temperatures remaining constant. Model results for each soil type are only shown for the land uses represented in the dataset.
Under the realistic increased input regime and when rising temperatures are not considered, the SOC accrual after 25 years ranges from 22–26 tC ha−1 for cropland and 15–18 tC ha−1 for grassland to 8–10 tC ha−1 for forests (Fig. 4; Table E2). Kinetics of SOC accrual are dependent on the time since the implementation of the practice increasing C inputs to soil. The yearly accrual rates averaged over the first few decades range between 0.88 and 1.04 tC ha−1 yr−1 for croplands, 0.6–0.72 tC ha−1 yr−1 for grassland and 0.32–0.4 tC ha−1 yr−1 for forests. The accrual rates then decrease over decadal and centennial timescales as the SOC stocks stabilize asymptotically towards the new steady state, as per the model equations. SOC accrual at the new steady state is highest for Dystric Cambisol owing to the effect of the low pH on the mineralization rates as implemented in the model. Modelled SOC accrual after 25 years decreases with depth for all soil types and land uses (Fig. 5).
Under the RCP4.5 scenario of a 1.0 °C increase over 25 years, the SOC accrual is attenuated by 7 % to 38 % compared to the SOC accrual simulated at constant temperature (10 % for cropland, 20 % for grassland, and 30 % for forests, on average). The SOC accrual after 25 years under this scenario ranges from 16–24 tC ha−1 for cropland and 10–16 tC ha−1 for grassland to 5–8 tC ha−1 for forest (Table E2).
Incorporating the RCP8.5 scenario of a 1.3 °C increase in temperature over 25 years attenuates SOC accrual by 10 % to 50 % and shows a stronger impact of soil type and especially land cover on the mineralization rates (Table E2). SOC accrual is attenuated by 10 %–20 % in cropland soils, 10 %–40 % in grassland soils, and 40 %–50 % in most forest soils except Dystric Cambisols (20 %).
3.3 Maps of SOC stocks, maximum SOC accrual, and simulated accrual after 25 years
The repartition of SOC stocks and maximum SOC accrual in the region of study is most visibly related to land use but is also affected by the spatial distribution of Stagnosols and Gleysols (Fig. 6). The current SOC stock in the region of study amounts to a total of 3.9 MtC, with a standard deviation of 1.5 MtC according to the bootstrap method (Fig. F1). To compare these results with national-scale estimates of SOC stocks, we average 3.9 MtC over the entire region of study and obtain a mean value of 122 tC ha−1, of which 87 tC ha−1 is in the first 30 cm.
The maximum SOC stock that the region can theoretically contain is MtC, suggesting that the soils in the region of study are at 61 % of their theoretical maximum SOC stock. However, according to model results in scenario 3, this maximum SOC stock would only be reached over timescales of centuries to millennia, and the SOC accrual after 25 years only reaches 0.57 MtC. The SOC accrual in the region of study is attenuated by 14 % and reaches 0.49 MtC when a 1.0 °C increase in temperature is implemented in the mineralization rates (Fig. F2).
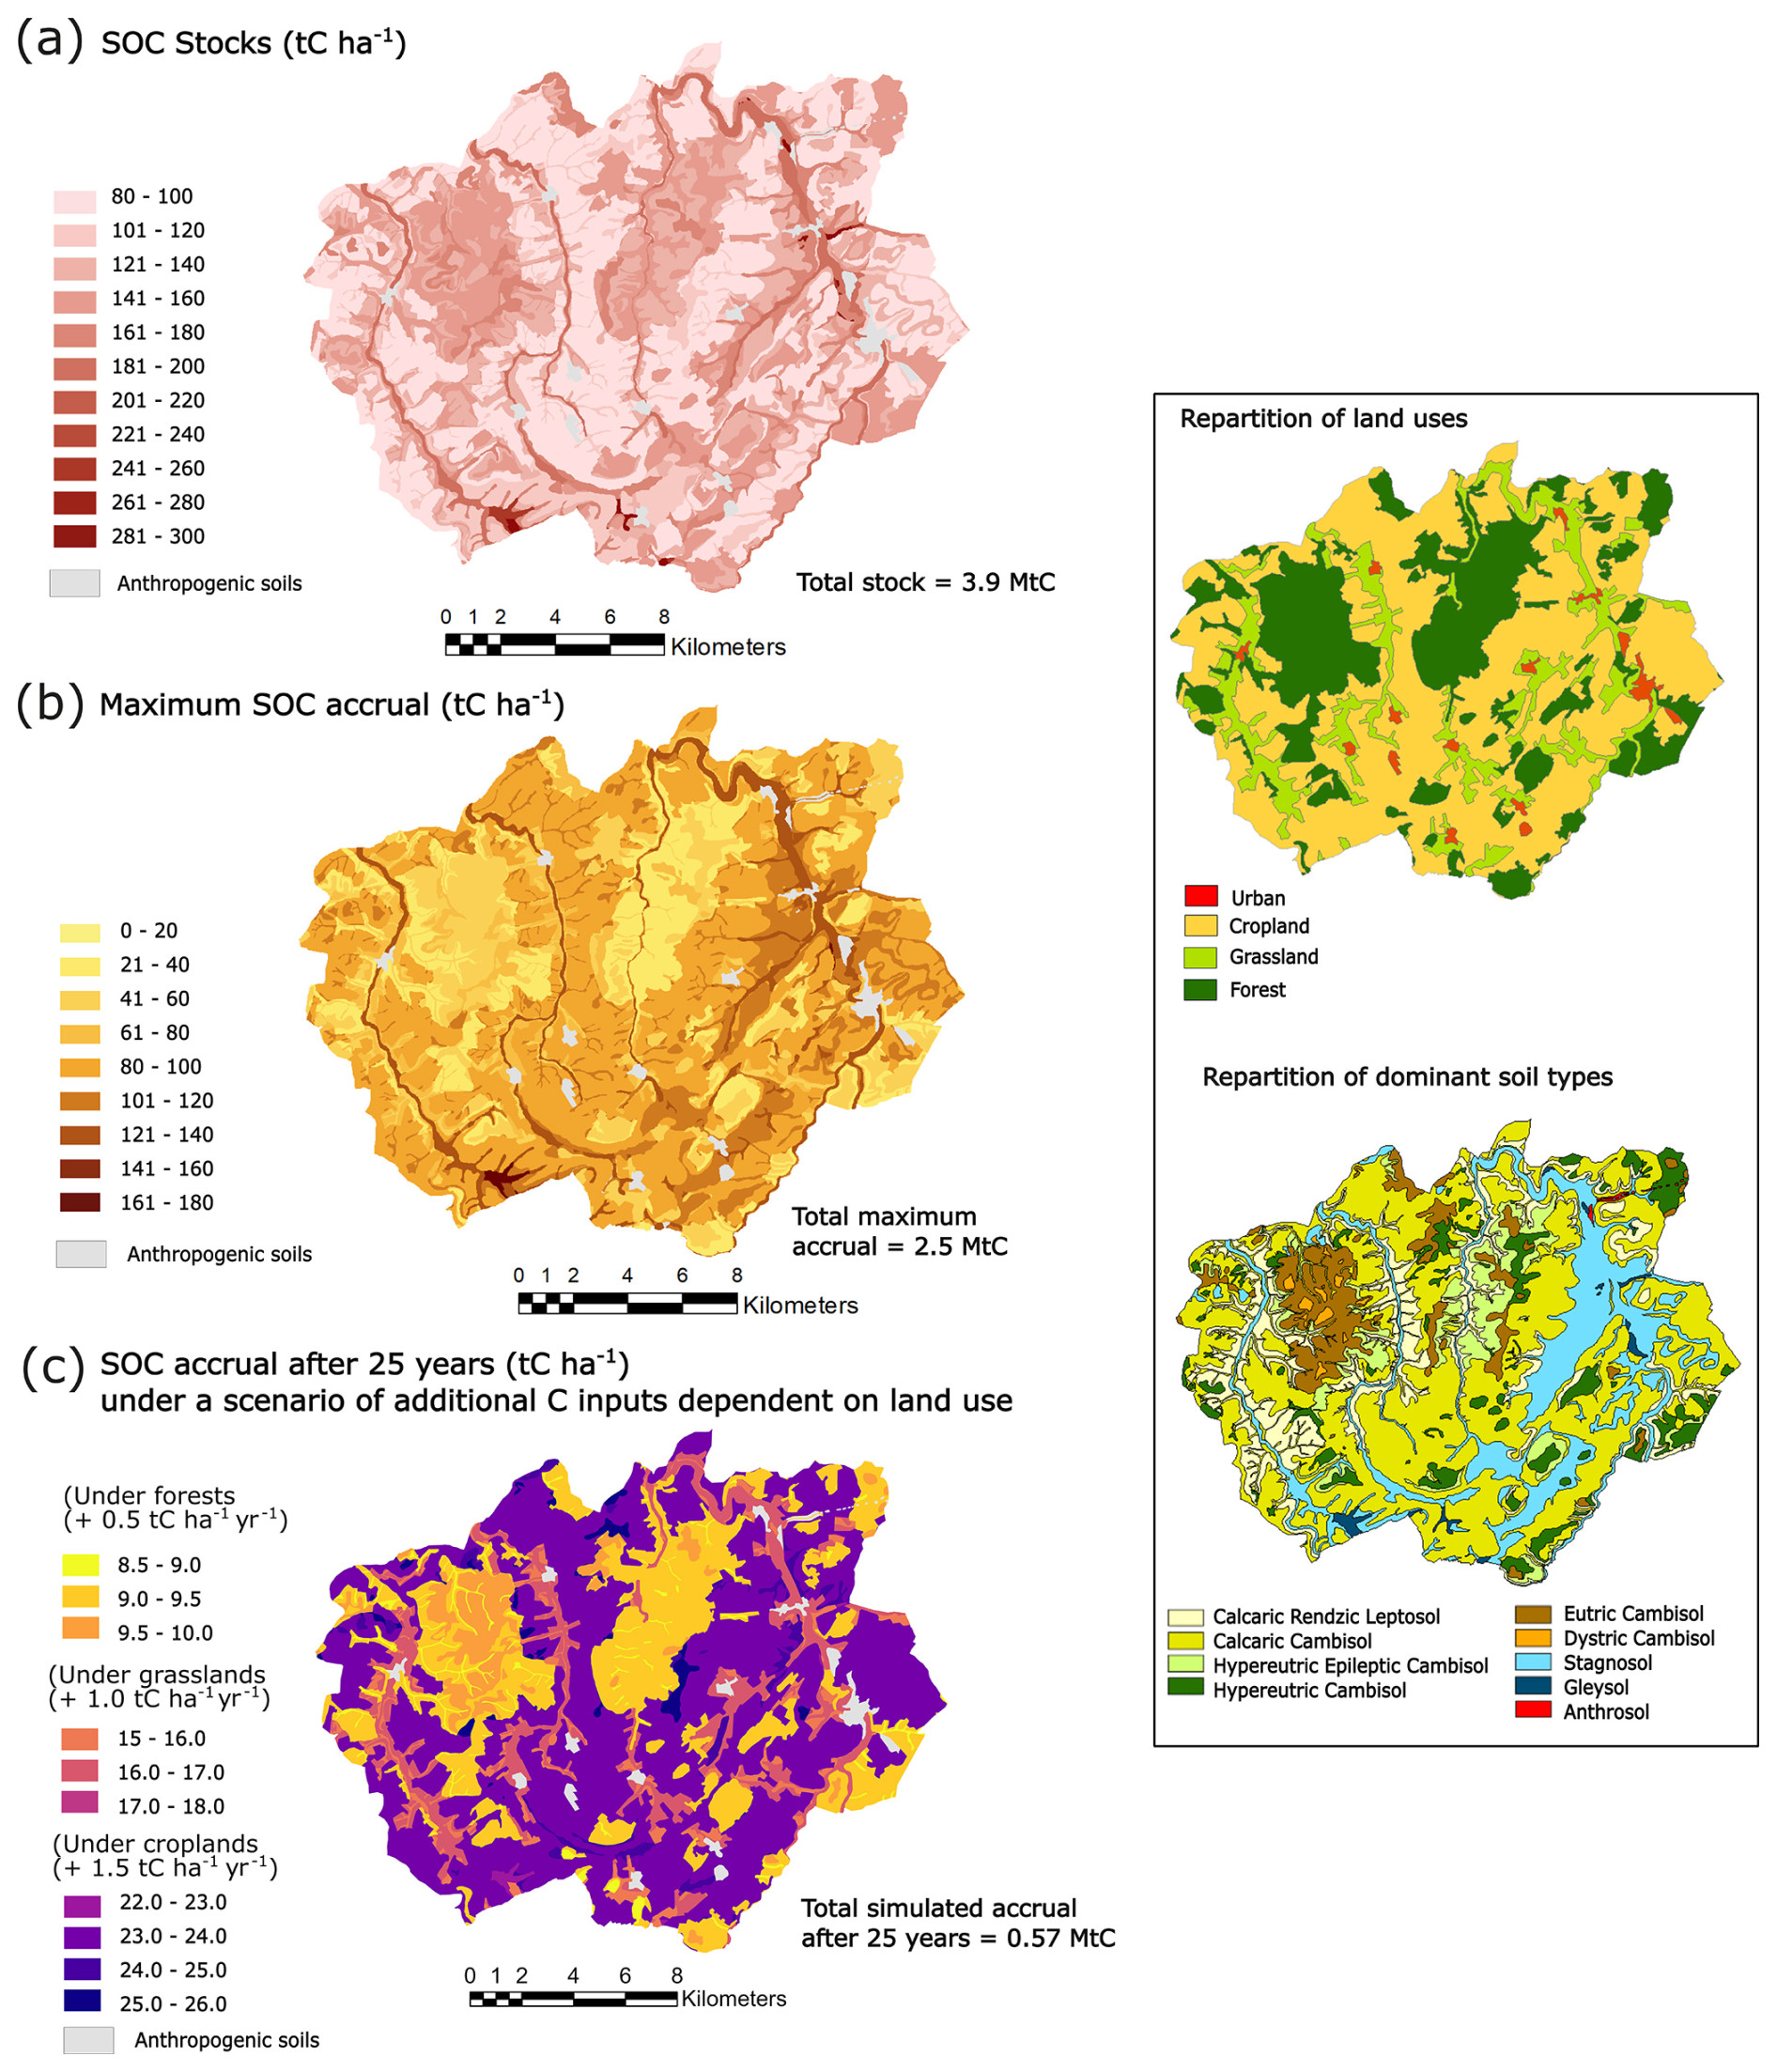
Figure 6Maps of SOC stocks (a), maximum SOC accrual (b), and simulated SOC accrual after 25 years under a realistic increased input scenario (+0.5 tC ha−1 yr−1 for forests, +1.0 tC ha−1 yr−1 for grassland, and +1.5 tC ha−1 yr−1 for cropland) (c). Upper and lower confidence intervals provided by the bootstrap method are given in Fig. F1. The standard deviation of the total SOC stocks and maximum SOC accrual based on the upper and lower confidence intervals applied to the whole region is 1.5 MtC.
4.1 Implications of our approach to estimate target SOC stocks and accrual rates
There is a rising interest in representing the contribution of soils to carbon storage, through the mapping of both current SOC stocks and the maximum SOC stocks that these soils can theoretically reach. Modelling can then be used to explore the input rates and timescales needed to reach these target SOC stocks. Our approach for estimating SOC theoretical maximum stocks was made possible by the uncommon abundance of soil profile data and by the detailed pedological map available in the region of study. This approach is most pertinent in areas where the land use and management have remained stable for many years (over 200 years in our region of study) because the high values of SOC stocks used to estimate target SOC stocks per soil type are more likely to represent a steady state than a transient stage. Such data-rich, well-documented regions can serve as references for similar pedoclimatic zones. A further step would then be to intensify profile-scale data collection in other regions to provide reference values of SOC stocks and maximum SOC accrual in as many pedoclimatic zones as possible in order to upscale this approach from the regional to the global scale (Barré et al., 2017).
Three C input scenarios were implemented to explore kinetics of SOC accrual. The first was an initial input regime obtained by matrix inversion, which corresponds to the annual C inputs necessary to maintain the initial SOC stocks in the steady state. We found a good agreement between the model-derived initial C inputs and available measurements and estimates made within the region of study: in croplands, the simulated C inputs were consistent with estimations of C inputs derived from the method of Bolinder et al. (2007) based on crop yields recorded in the region of study (Fig. G1). In forests, the model-derived initial C inputs were consistent with measurements from the RENECOFOR carried out in the region of study.
The second scenario sought the annual C inputs necessary to reach the theoretical maximum SOC stocks within 25 years. The required annual C input rates largely exceed the realistic ranges from the literature for most soil types. The only soil types for which this scenario is realistic are the shallow soils (Calcaric Rendzic Leptosol and Hypereutric Epileptic Cambisol) and the sandy Dystric Cambisol, because these soils have lower SOC stocks than the others and are already close to their theoretical maximum SOC stocks.
The third scenario used realistic annual C input values from the literature, and found SOC accrual rates ranging from 0.32–1.04 tC ha−1 yr−1 within the first 25 years. Examples can be found from previous studies of similar SOC accrual rates within decadal timescales following changes in land management strategies without changing the land use: transition from conventional to conservation agriculture in croplands (Autret et al., 2016); promoting an increase in plant diversity in grasslands (Yang et al., 2019); less frequent cutting in forests, or acting on forest productivity to increase root inputs and limiting soil disturbance during harvesting (Jandl et al., 2007; Mayer et al., 2020). The 1.5 tC ha−1 yr−1 additional C inputs modelled in croplands resemble values calculated in a long-term field experiment after transition from conventional agriculture to conservation agriculture (1.72 tC ha−1 yr−1 over 16 years, Autret et al., 2016). Those inputs also correspond to what the model requires to maintain the theoretical maximum SOC stocks in a steady state; this convergence confirms the robustness of the approach.
Using a percentile boundary line (here: 75th percentile of the SOC data) to estimate the theoretical maximum SOC stocks comes with a methodological challenge: the percentile regression necessarily depends on the size of the dataset and on its variability. A low percentile value within a large dataset underestimates the maximum SOC accrual, but an excessive percentile value within a small dataset produces an unrealistic target and increases the sensitivity to outliers. Other studies have used the following percentile values to estimate theoretical maximum SOC stocks at various spatial scales: Chen et al. (2019) compared maximum total SOC stocks following the 0.8, 0.85 and 0.9 percentile value at the national scale (1089 sites); Georgiou et al. (2022) compared the maximum mineral-associated SOC with low- and high-activity minerals at the 0.9, 0.95 and 0.975 percentiles at the global scale (1144 profiles). Standardized rules to define the choice of a percentile value for a target stock, depending on the scale of the study and the size and variability of the dataset, have yet to be established. Here, our choice of target SOC stocks at the 75th percentile is justified by the concordance between the annual C inputs necessary to maintain these stocks in a steady state and realistic ranges of annual C inputs from Martin et al. (2021) and from regional RENECOFOR datasets (Table 2). By contrast, maintaining SOC stocks at the 88th percentile boundary line would require annual C inputs between 4.4 and 21.7 tC ha−1 yr−1, far in excess of what can be realistically added to soils. We recommend, where possible, to verify the realism of SOC stock targets using carbon dynamics models and matrix inversion to estimate the annual C inputs necessary to reach these targets in the long term.
Interrogating the realism of target SOC stocks is of particular importance when deeper soil horizons are considered. Another concept used to define target SOC stocks is to focus on the mineral-associated carbon, considered to be more stable, using the clay and fine silt fraction as a proxy for the amount of carbon that can theoretically be stored in a soil in the long term (Hassink, 1997; Cotrufo et al., 2019; Georgiou et al., 2022). However, applying this concept over the whole soil profile leads to unrealistically high targets and therefore unrealistic C inputs at depth (Fig. H1).
Modelled SOC accrual in scenario 3 ranged from 8.5 to 26 tC ha−1 after 25 years, with a rapid decrease in SOC accrual rates with depth driven by decreasing C inputs. The deeper horizons of the soil provide limited opportunity for additional storage over short timescales using current land management practices. Furthermore, the proportion of new carbon inputs that is allocated to the fast carbon pool exceeds 85 % at all depths in the soil profile (Table C1): this implies that even in the deeper soil horizons, the majority of new C inputs is quickly mineralized, as also simulated by Sierra et al. (2024). The mean residence times (MRTs) in the fast pool remain similar near the surface and at depth (17–38 and 11–47 years respectively) but increase with depth in the slow pool (from 477–1100 to 1744–5817 years). The greater contrast in mean residence times between the fast and slow pools at depth challenges our understanding of SOC dynamics.
Soil type did not play a major role in SOC accrual over short timescales: the observed differences in mineralization rates across soil types are not sufficient to have a significant impact after 25 years, especially in the fast pool (Table C1). It is rather the land use that affects SOC accrual by controlling the quantity and vertical repartition of inputs (Table C2). However, the soil type has a strong influence on current SOC stocks by categorizing soils based on profile depth, rock fragment content, and other physico-chemical properties. Hydromorphic soils in particular have total SOC stocks up to 3 times higher than in other soil types, making their preservation particularly critical. These high SOC stocks are due to waterlogged conditions strongly limiting decomposer activity (Sahrawat, 2004), notably, for energetic reasons (Keiluweit et al., 2016).
Our model provides a widely applicable tool to assess the effect of different soil types and initial distributions of SOC stocks on SOC dynamics at decadal timescales. It does not account for vertical transfer, but Balesdent et al. (2018) showed that 13C incorporation in subsoil after a change in vegetation is slow and affects only long-term carbon dynamics. Sierra et al. (2024) also found that transport may only play a secondary role in the formation of soil carbon profiles according to simulation examples and measurements from carbon and radiocarbon profiles. The priming effect is not taken into consideration in our model even though it is expected to occur when C inputs to the soil increase, which could cause simulated results to overestimate SOC accrual (Guenet et al., 2018). Priming is difficult to include in predictive models because the processes involved are still poorly understood (Bernard et al., 2022). Current explorations of the priming effect use either mechanistic models centred on microbial processes (Schimel, 2023) or theoretical models fitted to laboratory experiments, which do not fit the scope of our study.
Testing for the effect of temperature increase on mineralization rates led to an attenuation of SOC accrual by 2050 of 7 % to 50 % depending on the climate scenario considered. We did not account holistically for the effects of climate change on SOC dynamics in this study: the combination of changes in temperature, CO2 concentration, and precipitation can drive a myriad of responses in net primary production, SOC input repartition, and mineralization processes (Rocci et al., 2021; Bruni et al., 2021). In forests, for instance, increased drought conditions may increase tree mortality but might also enhance deeper root prospection for water, thereby changing the vertical repartition of C inputs (Schlesinger et al., 2016). Different soil types are also expected to respond differently to climate change due to, for instance, the impact of soil texture on soil moisture regimes (Bormann, 2012; Hartley et al., 2021). Here, we have considered a simplified case where humidity conditions has not changed since the period from 2009–2019 and do not affect soil carbon dynamics. The scientific community needs to improve its understanding of the priming effect and SOC dynamics processes driven by climate change and to further explore how the soil type influences organic matter decomposition dynamics over decadal timescales.
4.2 Implications for stakeholders: what levels of C accrual are achievable after 25 years?
Increasing soil organic carbon (SOC) stocks in soils has the potential to provide global benefits, but its successful implementation requires regional-scale information on land use and soil type. An important aspect of this work is to provide relevant SOC storage targets to stakeholders. The maximum SOC accrual can be used as a theoretical, long-term target value but is not representative of how much carbon can realistically be added to soils over decadal timescales. In the region of study, total SOC accrual after 25 years under a realistic scenario of C inputs was found to be one-fifth of the the maximum theoretical SOC accrual (0.57 MgC versus 2.5 MgC). Our simulation of rising temperatures following RCP4.5 (+1.0 °C) and RCP8.5 (+1.3 °C) attenuated this SOC accrual by 7 %–38 % and 10 %–50 % respectively over 25 years through the increase in mineralization rates. This shows that increasing organic matter inputs to the soil remains worthwhile since SOC accrual remains significant even in an extreme scenario (highest projected increase in temperature but no change in humidity conditions).
Maps of SOC stocks are efficient tools for synthesizing scientific results at the regional scale for stakeholders. Crucially, they highlight areas where soil degradation would lead to the greatest release of CO2. The current SOC stocks have been built over timescales of centuries to millennia, especially in the deeper soil horizons, but can be rapidly lost due to land use change and other disturbances. Therefore, as highlighted by Sierra et al. (2024), the priority should be to preserve the existing SOC stocks even as we attempt to implement innovative land management practices to maximize these SOC stocks where possible. Despite the high uncertainties associated with regional-scale estimations of SOC stocks (Fig. F1), our mean SOC stock values of 87 tC ha−1 in the first 30 cm are in accordance with national-scale estimates that found SOC stocks of 75–100 tC ha−1 in the north-east of France (Pellerin et al., 2021).
The map of maximum SOC accrual was found to be of limited interest because it does not provide a timescale for when that maximum SOC stock might realistically be reached. Reaching the theoretical maximum SOC stocks by the 2050 horizon for carbon neutrality would require prohibitively high annual C input rates. We therefore recommend maps of prospective SOC accrual to be time-specific, with C input rates within realistic ranges.
Our time-specific SOC accrual map is an improvement from simple representation of maximum theoretical SOC stocks but remains a simplification of what can realistically be implemented. The map implies a uniform increase in C input rates for each land use in the entire region of study, but this would likely be hindered by practical and socio-economic factors. The SOC stock and time-specific SOC accrual maps should be used as part of a wider set of decision support tools for land planners. In some circumstances, adding organic carbon to soils might not even be the best solution for mitigating climate change: biomass harvest not returned to the soils can instead be used as a source of food, biosourced energy, or biomaterials (Derrien et al., 2023). These alternate uses of carbon biomass offer a means of substituting fossil carbon, which should be verified quantitatively by life cycle analysis.
Finally, soil type information provided to stakeholders should not be limited to the current or prospective SOC stocks. Soil-type-specific physico-chemical properties are an important but, as of yet, rarely considered factor for land planning. Soil type affects numerous soil functions such as water retention, resistance to erosion, and nutrient cycling (Adhikari and Hartemink, 2016). These soil functions should be considered in addition to the SOC dynamics to choose management strategies adapted to each soil type.
Informing stakeholders of soil management strategies to preserve and maximize existing soil organic carbon (SOC) stocks is a pressing concern in the scientific community. It is critical to communicate on the effects of soil type, depth, and land use on SOC accrual in soil over time periods compatible with the roadmap for C neutrality, and to explore the C inputs necessary to reach these targets.
The annual C inputs necessary to reach theoretical maximum SOC stocks within 25 years in the region of study were found to exceed realistic C input ranges from the literature for most soil types (3.4–17.3 versus 1.18–6.8 tC ha−1 yr−1). The SOC accrual after 25 years modelled under a realistic scenario of increased C inputs was one-fifth of the maximum SOC accrual estimated over the whole region of study (0.57 MgC versus 2.5 MgC).
We note a greater contrast between SOC mean residence times at depth, which invites further investigation: while a fraction of the new C inputs added to the deep-soil horizons can remain stable over millennial timescales, the majority is mineralized within 2 decades. Simulating a rise in temperature of 1.3 °C over 25 years following RCP8.5 attenuated SOC accrual by 10 % to 50 %. The effect of soil type on SOC mineralization rates was not visible over the decadal timescales considered. However, the soil type plays an important role in the spatial repartition of the current SOC stocks that need to be preserved. Studies of SOC stocks and storage capacities should be complemented by more holistic explorations of soil functioning and ecosystem services.
This study provides a set of maps to give a more complete picture of the issues related to carbon storage in soils (carbon stocks, maximum SOC accrual, and realistic SOC accrual over decadal timescales). Such maps have the potential to facilitate communication with land planners and stakeholders by highlighting areas most worthy to preserve and where carbon storage practices are likely to be the most efficient over decadal timescales. The efficacy of such maps as decision support tools should be explored via collaboration projects with stakeholders.
Table A1List of soil properties collected at each soil profile and their measurement protocol.
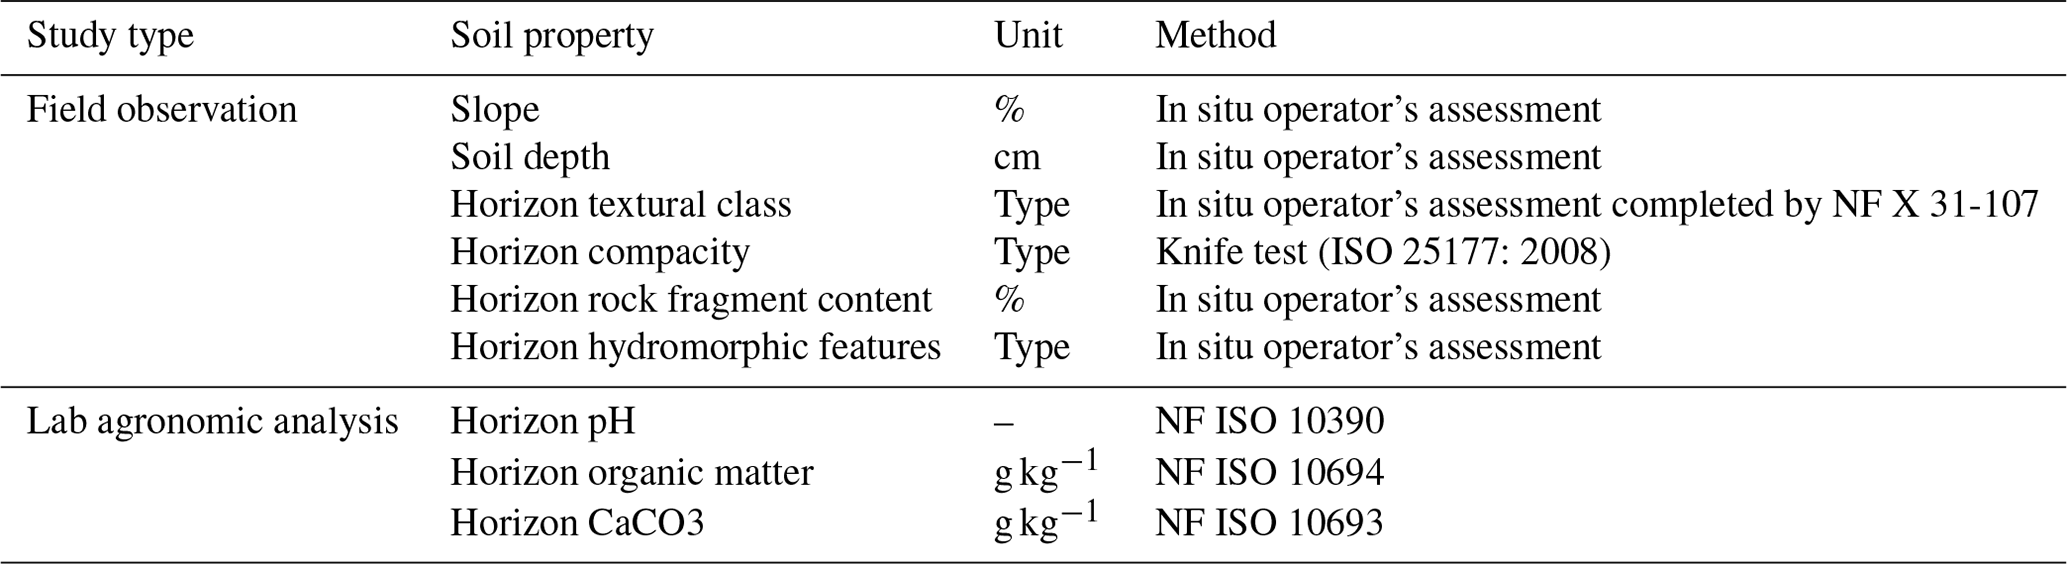
Table A2List of descriptors used to plot the SOC content curves for each soil type and land use: Ω1, the SOC content of the soil type at maximal depth; Ω2, the SOC content at the surface; and Ω3, the depth at the half maximum of the SOC content (based on Mathieu et al., 2015 and Jreich, 2018).
B1 Details of model functioning
A depth-dependent SOC dynamic model using multilayer soil modules was built to establish the time needed to reach different levels of carbon storage in the soil. SOC is allocated to three boxes (fast, slow, and stable) corresponding to different SOC mineralization rates defined by Balesdent et al. (2018) based on a meta analysis of changes in stable carbon isotope signatures at 55 grassland, forest, and cropland sites in the tropical zone.
The mineralization factors associated with each box were then corrected for temperate soils using correction factors defined for the AMG model to account for not only the difference in environmental conditions (temperature and humidity) between tropical and temperate, but also the differences in pH, clay content, and CaCO3 between soil types. The correction factors linked to temperature and humidity are based on Andriulo et al. (1999) and Saffih-Hdadi and Mary (2008). The correction factors linked to pH, clay content and CaCO3 were previously established by Clivot et al. (2017) based on the monitoring of N mineralization in 65 bare fallow soils representative of arable cropping systems in France at a depth of up to 150 cm. These corrections are in accordance with recommendations from Rasmussen et al. (2018), for whom soil organic matter (SOM) stabilization depends on not only clay content, but also pH and exchangeable calcium for alkaline soils. The correction factors for the temperature (T), humidity (H), clay content (A), pH, and CaCO3, as used in the 2019 AMG model, were as follows:
with T being the mean annual temperature, P the mean annual precipitation, and PET the potential evapotranspiration.
The total correction factor, , was calculated for the tropical sites from Balesdent et al. (2018) and for the temperate conditions in the OPE region of the study (fBAL and fOPE respectively). The corrected mineralization factors, k1corr and k2corr, were obtained with the following equations:
For each soil type and land use, the initial carbon stocks every 10 cm were again obtained by data interpolation with the Jreich method (2018); they were distributed between the three pools based on the depth-dependent allocation factors defined by Balesdent et al. (2018) as follows:
with Cinit being the initial carbon stock and a1 and a2 the proportion of carbon in pool 1 and 2 at each depth i.
The incorporated soil carbon inputs at each depth i and time step t were added as follows:
with α being the proportion of new carbon inputs that is allocated to the fast carbon pool calculated from the steady-state input equations (see Eqs. C19–C22 below).
The outputs at each time step were a function of the carbon stock at time step t and of the corrected mineralization factors at each depth i as follows:
The change in soil carbon stock at each depth i between t and t+1 was defined as follows:
The soil carbon stocks at t+1 were therefore defined as follows:
The corrected mineralization rates also led to the definition of carbon mean residence time as a function of depth for each soil type (MRT , see Table A2). SOC mean residence times in the steady state depend on the physico-chemical properties of the studied soil types: at our study site, they range from 50–100 years in the topsoil and from 145–453 years underneath.
The model was initialized under the assumption that the carbon stocks calculated at the different depths in 2018 were in a steady state. This assumption is justified on average by a land occupation map from 1830 showing limited changes in land use over the past 200 years (Dupouey et al., 2008). Inverting the model in the steady state yielded the vertical repartition of yearly C inputs necessary to keep the input and output fluxes equal across the full profile. We defined INPUTeq, the repartition of incorporated C inputs every 10 cm in the steady state, as follows:
The two previous equations are used to define α as follows:
This estimate of the yearly inputs did not distinguish between surface inputs and inputs by the root systems. The model further assumed that there was no vertical redistribution of SOC between the layers following this initial allocation (Balesdent et al., 2018). Then, the allocation and mineralization rates of these inputs were used at each depth layer to infer the mean residence time of the C inputs per land use: this second definition of the mean residence time depends on both the physico-chemical properties of the soil and the vertical repartition of inputs.
Table C1Details of the SOC average mean residence time (MRT ) in the fast pool (MRT) and in the slow pool (MRT), represented in years as a function of depth for each soil type, using parameters from Balesdent et al. (2018), with correction factors from the AMG model for the temperature, P/PET, pH, clay content and CaCO3. a1 and a2 are the proportion of initial C in a steady state distributed in the fast and slow pools – the carbon proportion in the inert pool being the complement to reach one). α represents the proportion of new carbon inputs that is allocated to the fast carbon pool (see Eq. C21), the complement is allocated to the slow pool, no carbon is allocated to the inert pool. Soil 1: calcaric Rendzic Leptosol, soil 2: calcaric Cambisol, soil 3: Hypereutric Epileptic Cambisol, soil 4: Hypereutric Cambisol, soil 5: Eutric Cambisol, soil 6: dystric Cambisol, soil 7: Stagnosol, soil 8: Gleysol.
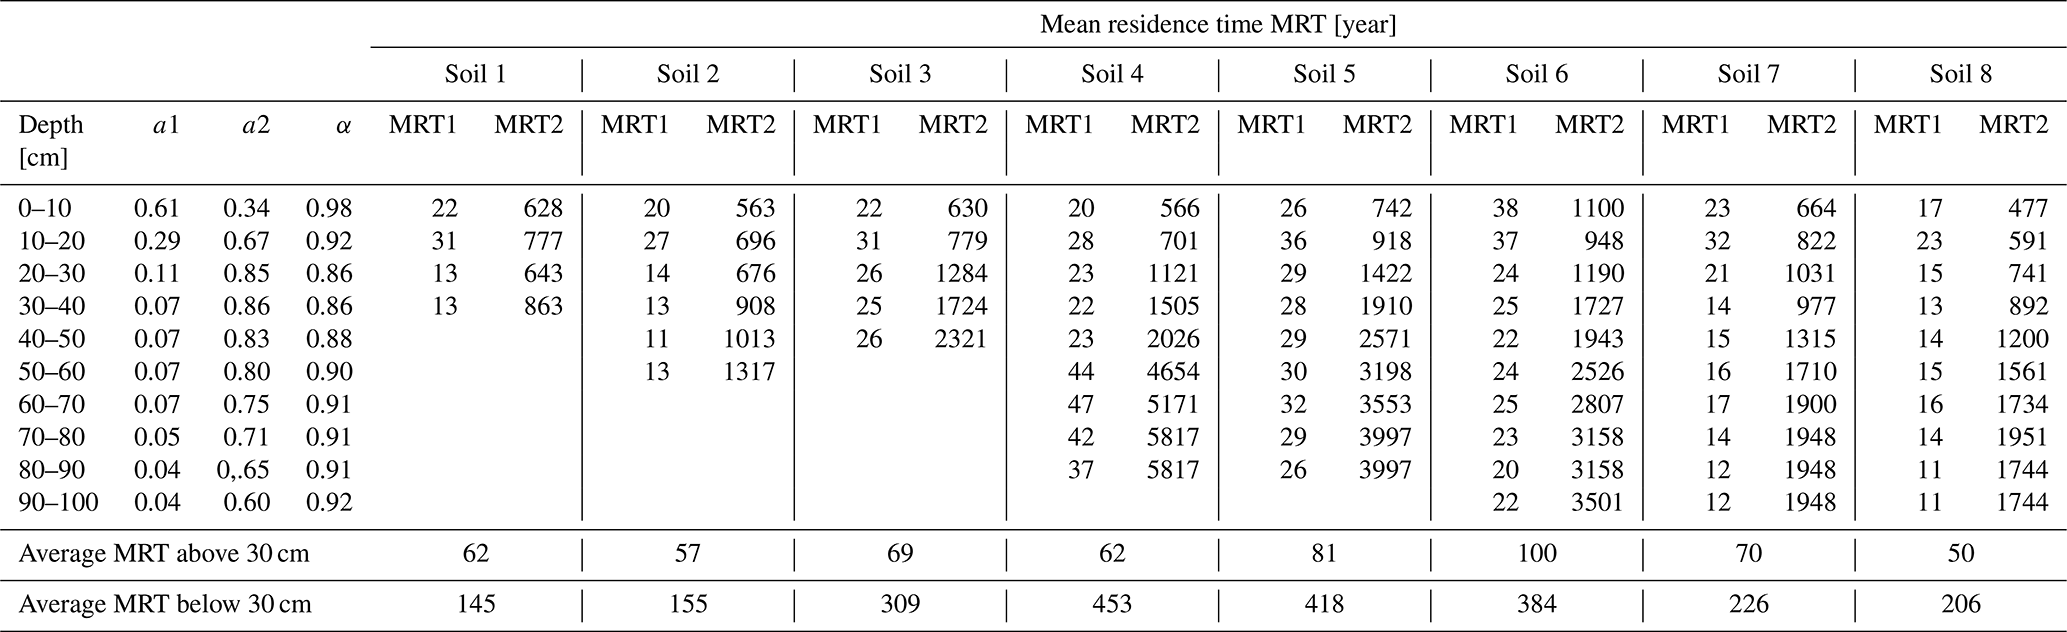
Table C2Vertical repartition in the percentage of yearly C inputs in the steady state for each soil type, land use, and depth layer every 10 cm. The bottom of the table provides the total inputs in tC ha−1 yr−1 needed to stay in the steady state or to reach the maximum SOC stocks estimated by the 75th-percentile data-driven method. C: cropland, F: forest, G: grassland.
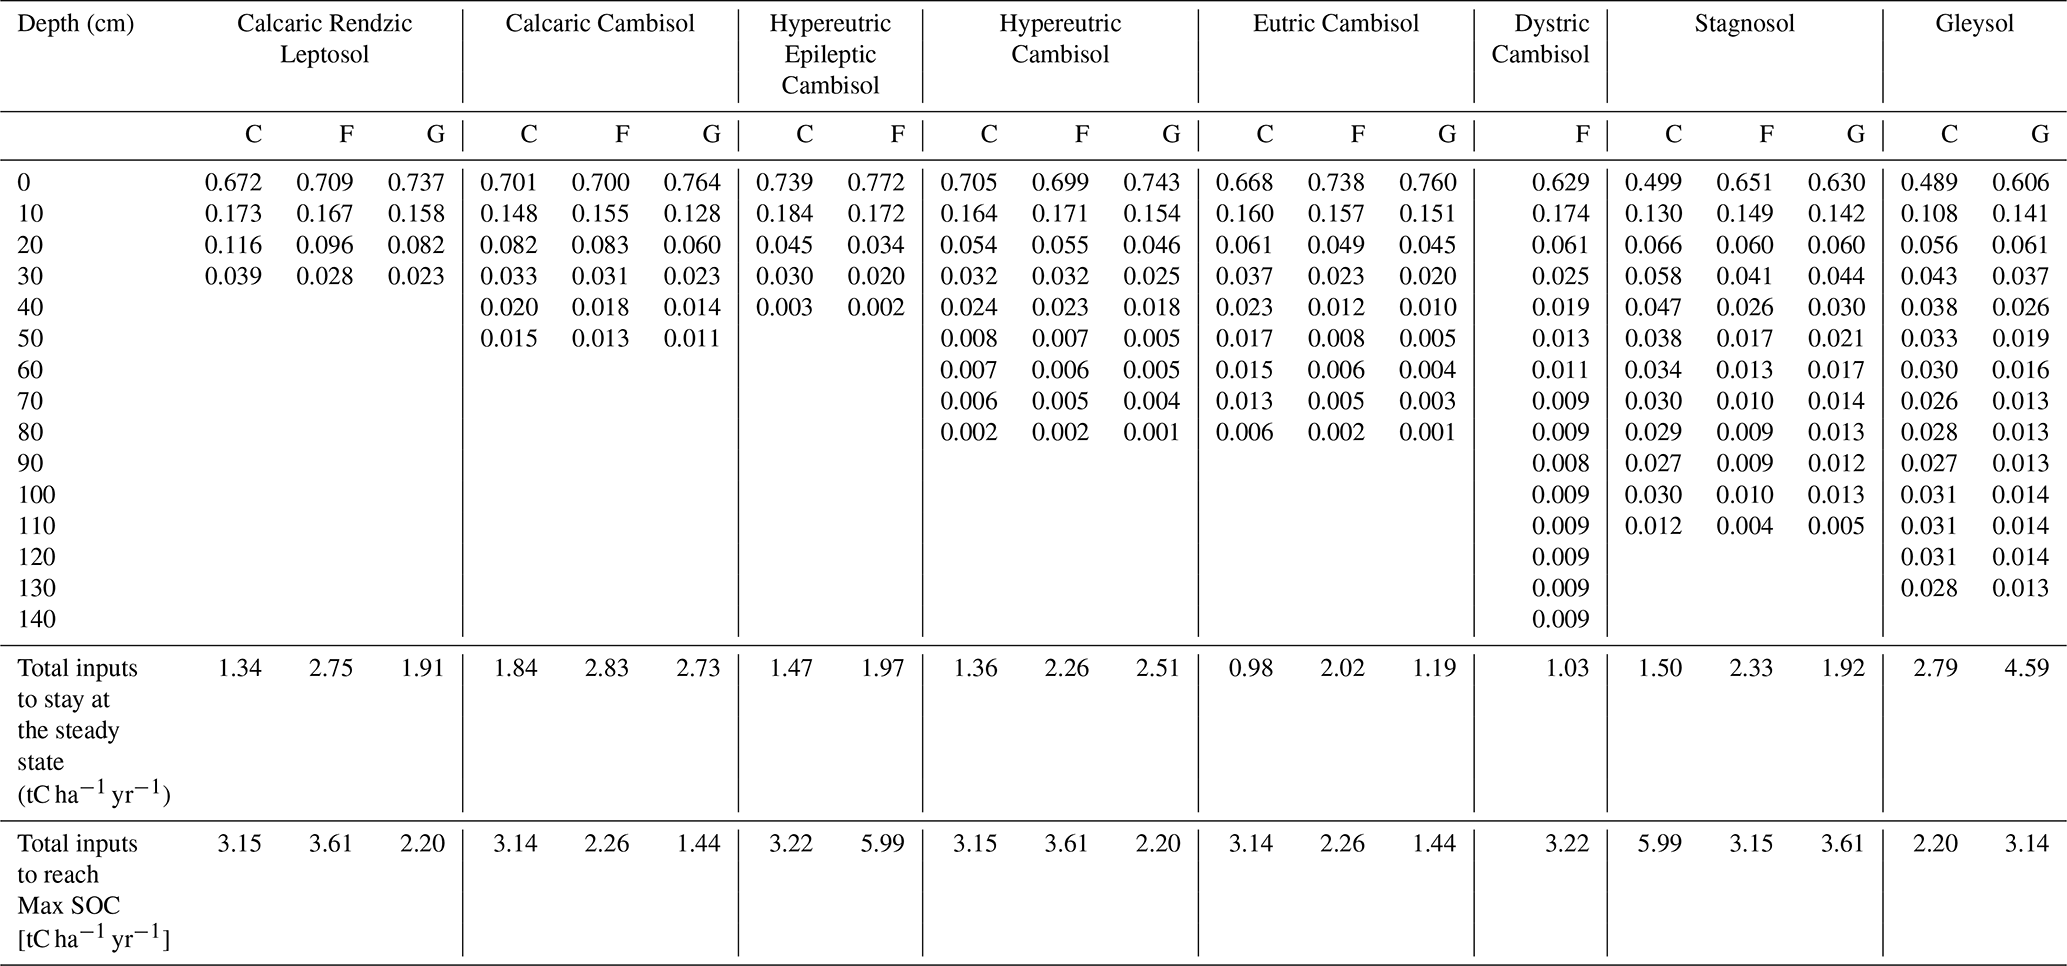
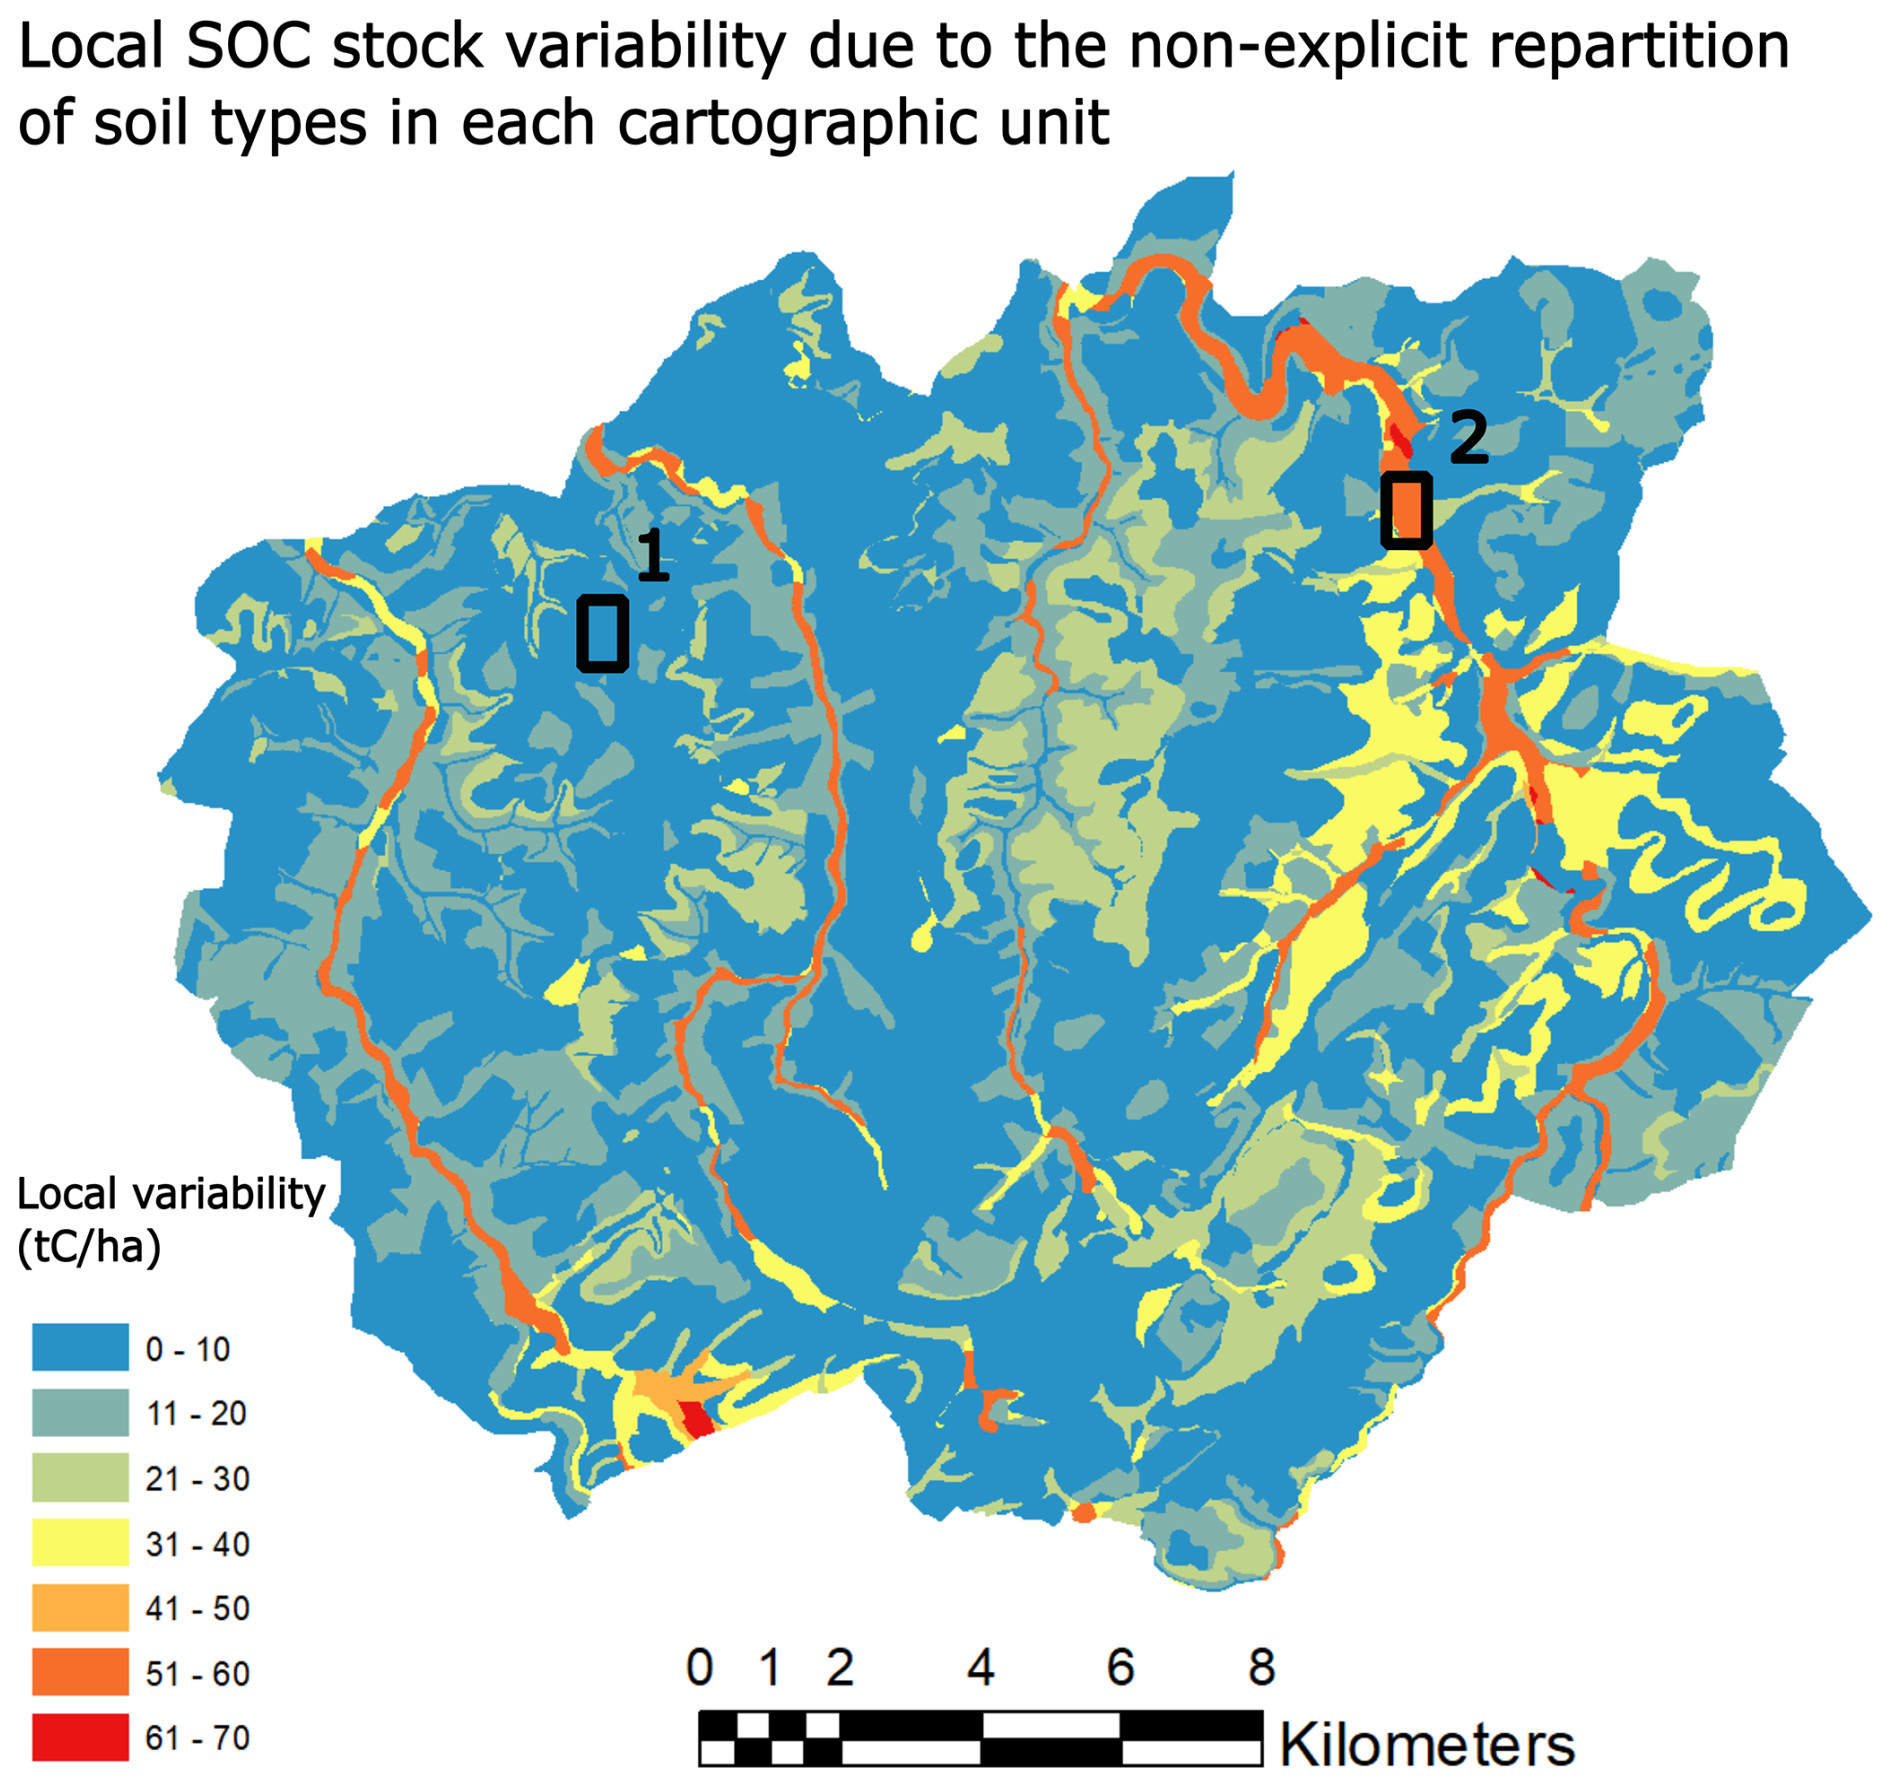
Figure D1Local uncertainty in SOC linked to the non-explicit repartition of soil types within the cartographic units. As an example, in zone 1, which is covered in forests, the represented soil types are 80 % Eutric Cambisol (157 tC ha−1) and 20 % Stagnosol (172 tC ha−1). In zone 2, which is under grassland, the represented soil types are 80 % Stagnosol (161 tC ha−1) and 20 % Gleysol (333 tC ha−1). For this reason, the local variability in SOC stocks is higher in zone 2 than zone 1.
Table E1SOC stocks and maximum storage capacity above and below 30 cm (below 30 cm is represented in bold).
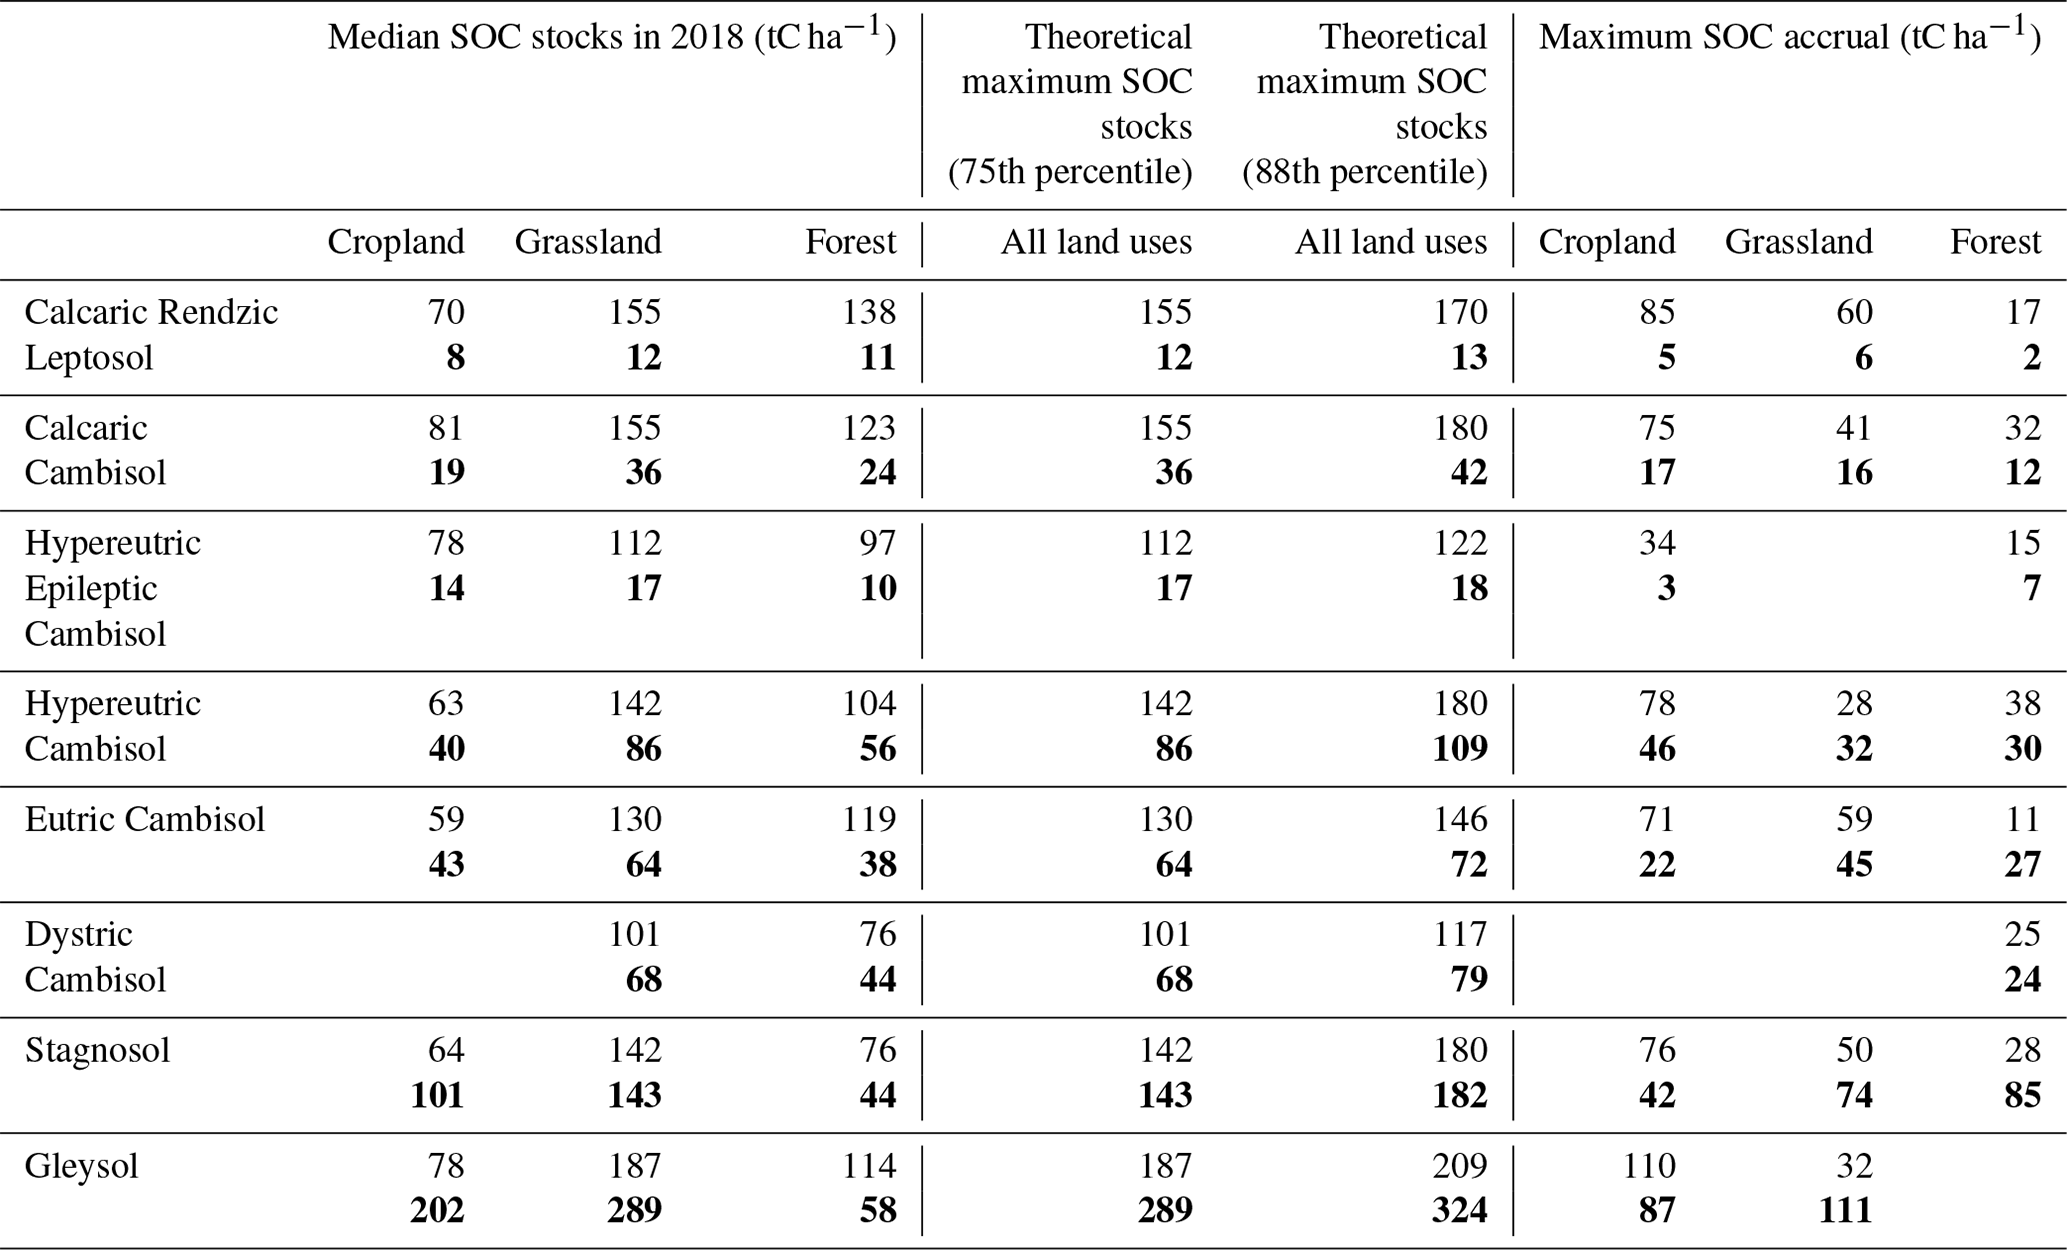
Table E2Simulated SOC accrual in tC ha−1 in the different soil types and land uses (C: cropland, F: forest, and G: grassland) after 1, 10, 25, 50, 200, 1000, and 5000 years of a model run under a scenario of additional inputs of 0.5 tC ha−1 yr−1 for forests, 1.0 tC ha−1 yr−1 for grasslands, and 1.5 tC ha−1 yr−1 for croplands. Constant temperature is given in the top part of the table.
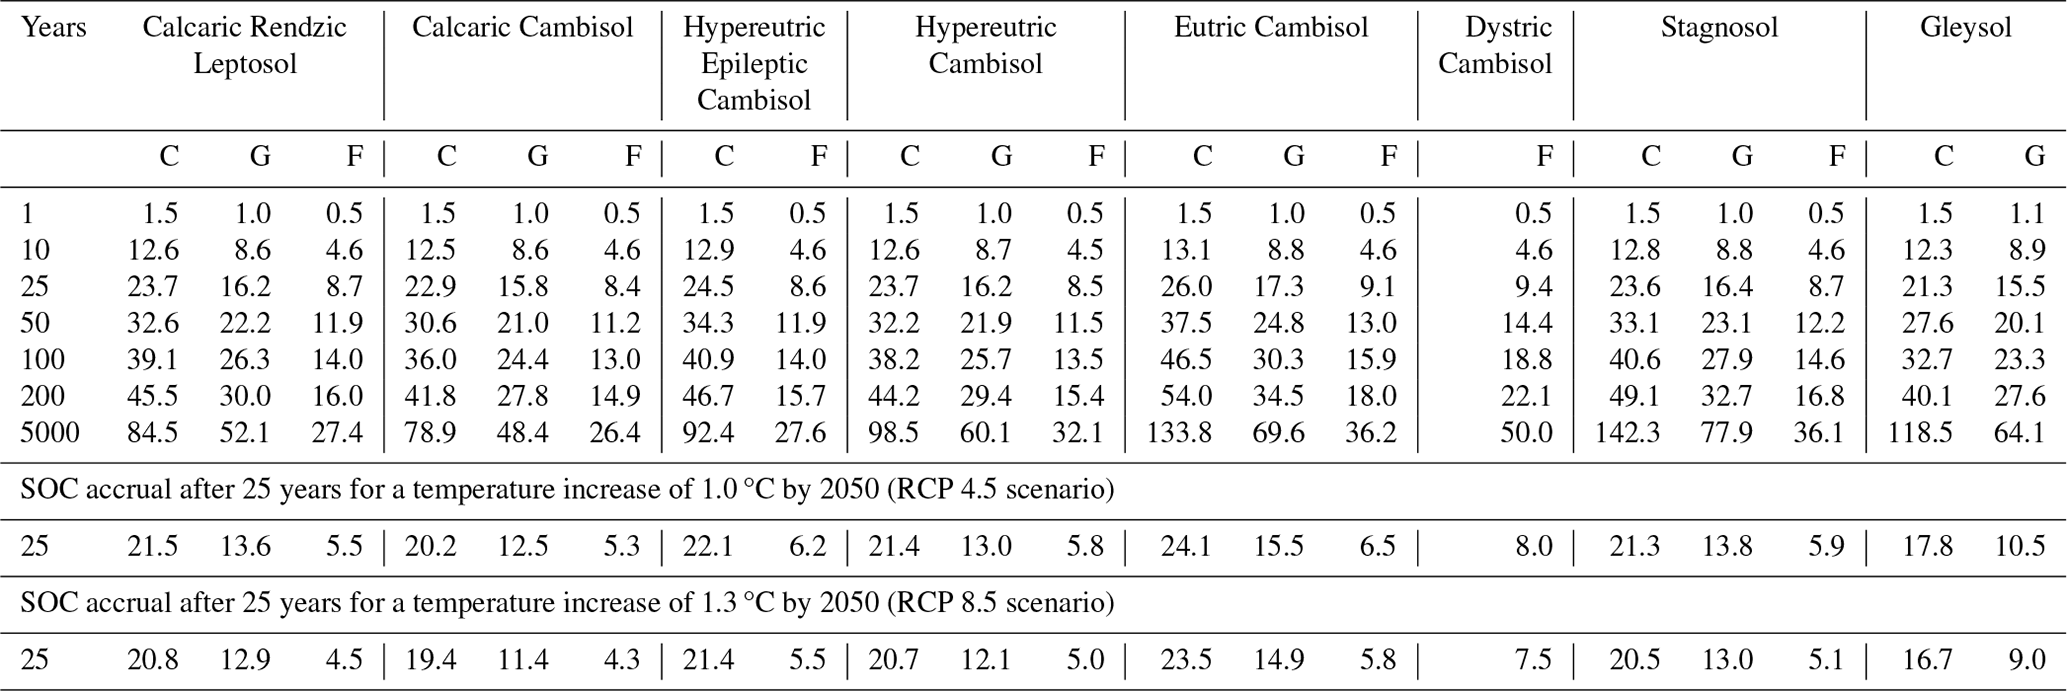
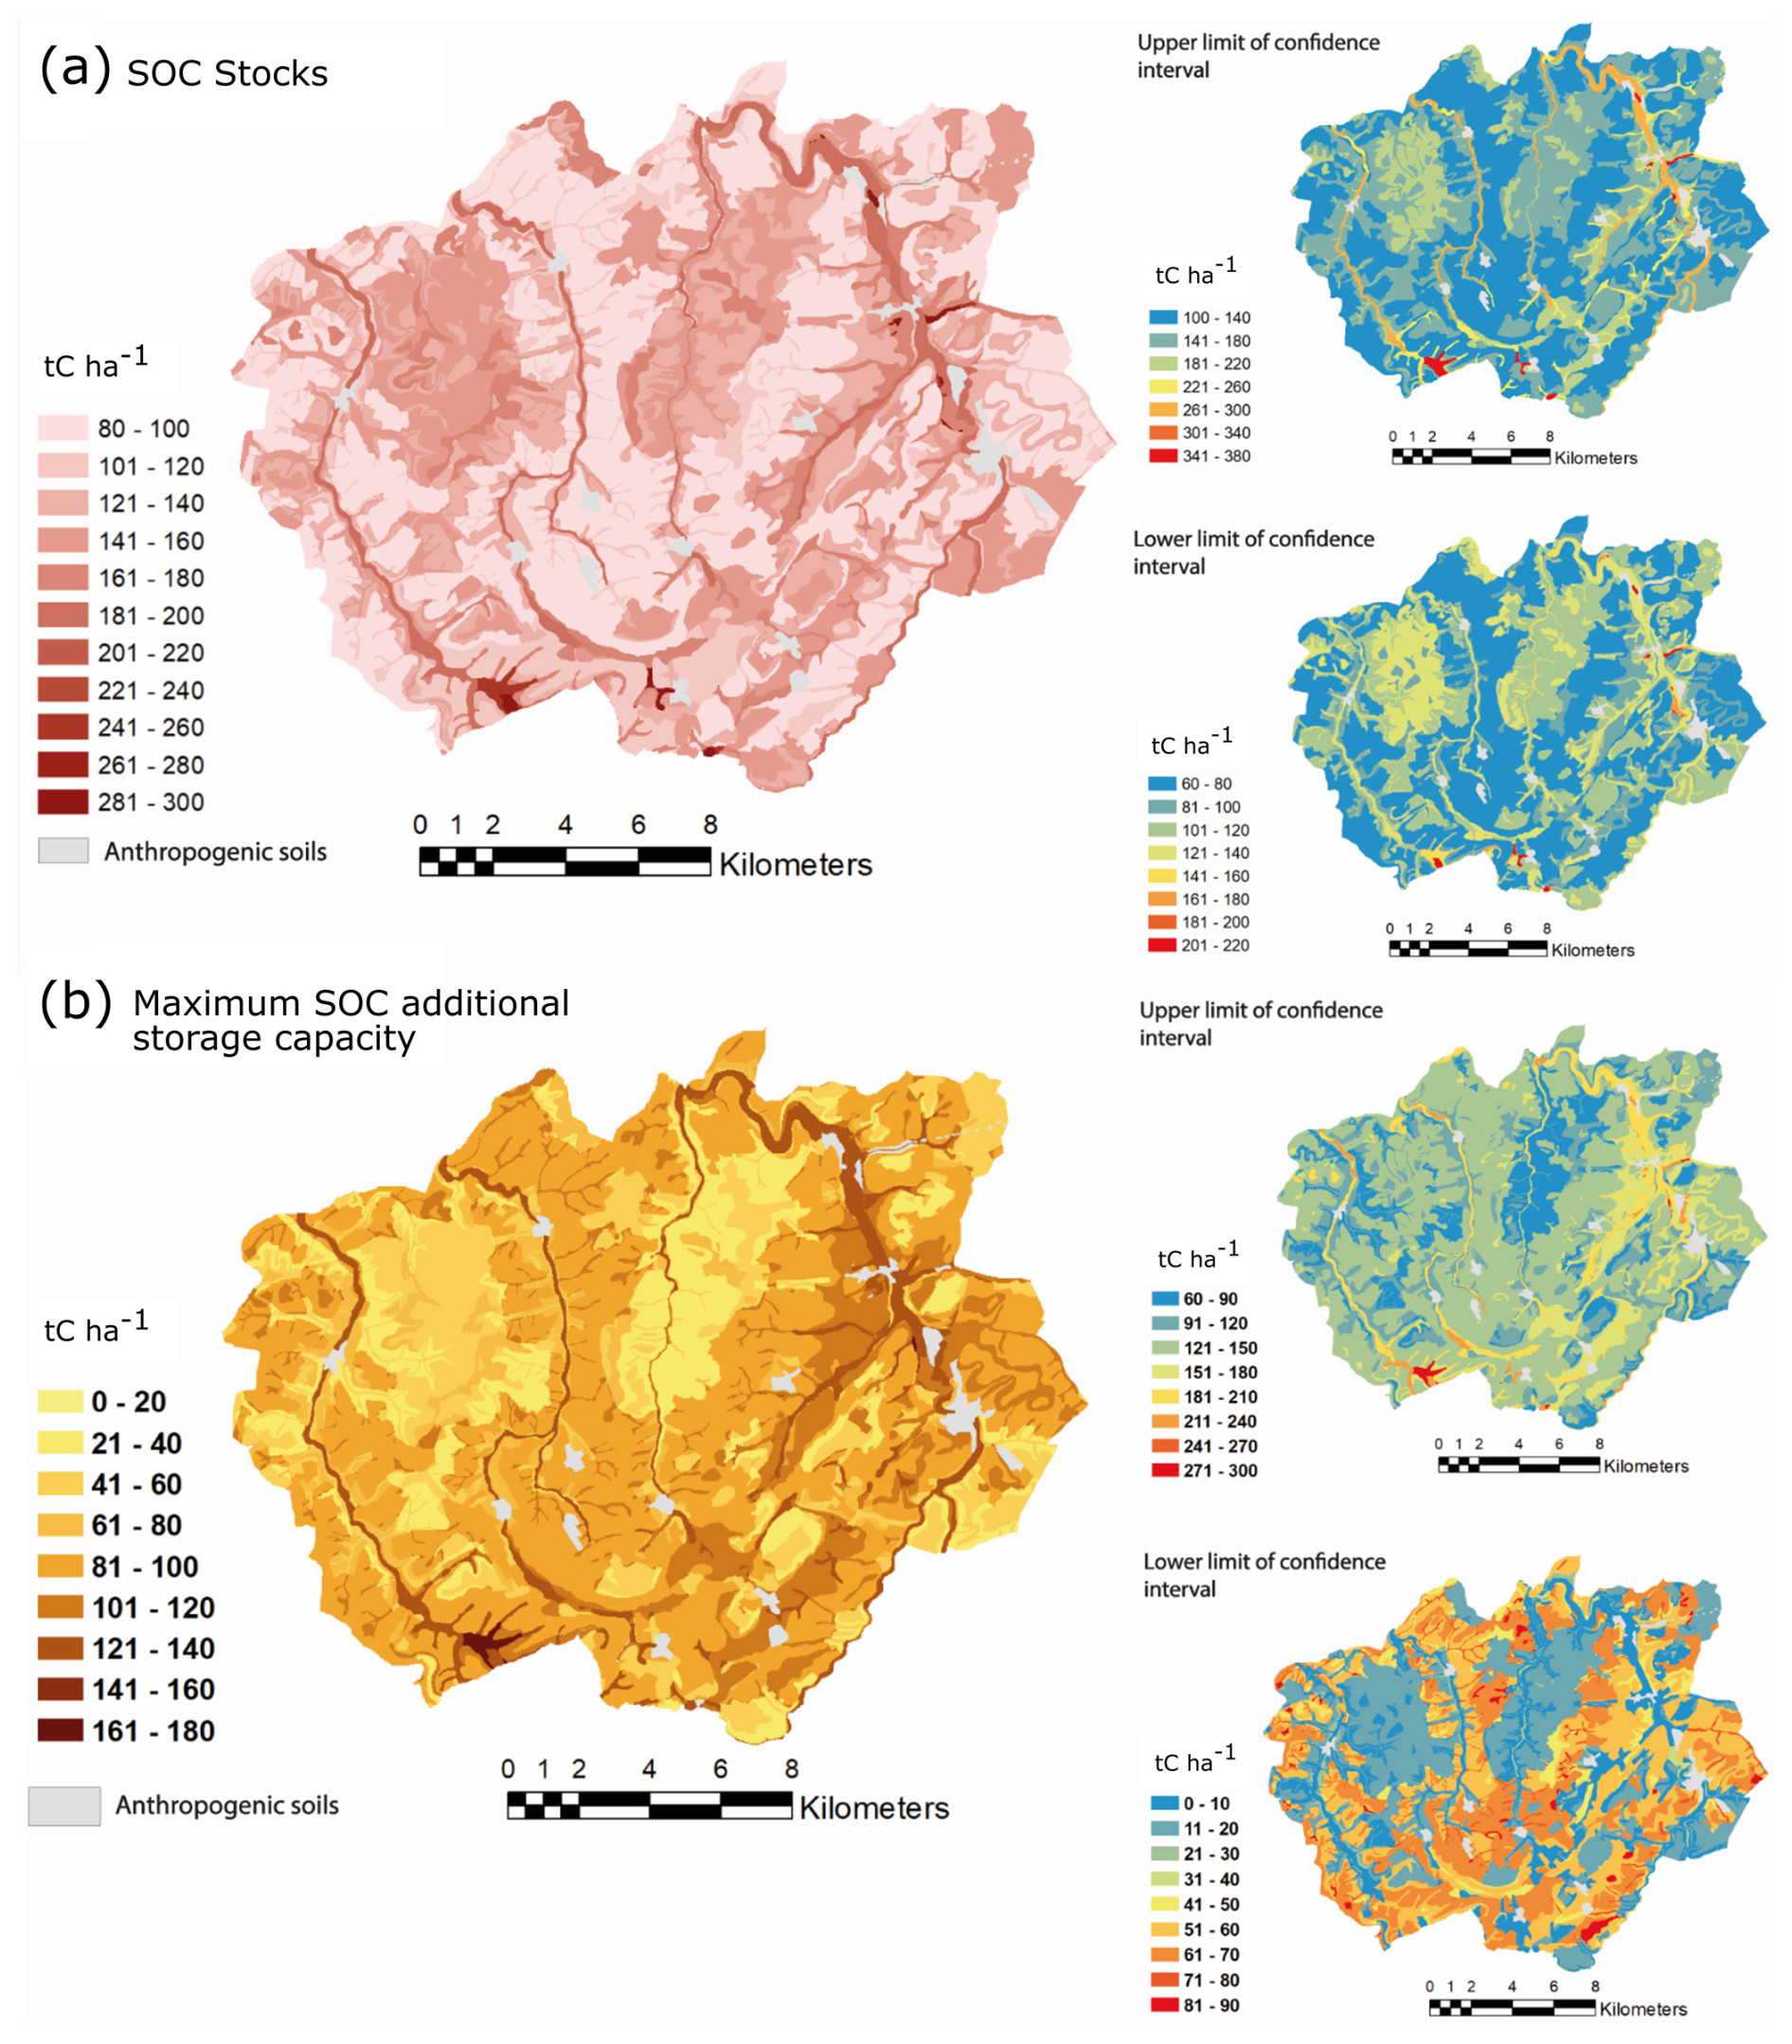
Figure F1SOC stocks and maximum SOC additional storage capacity, with lower and upper confidence intervals as estimated by the bootstrap method. The SOC stock in the region of study ranges from 2.4–5.3 MtC and the maximum SOC additional storage capacity from 1.2–4.1 MtC.
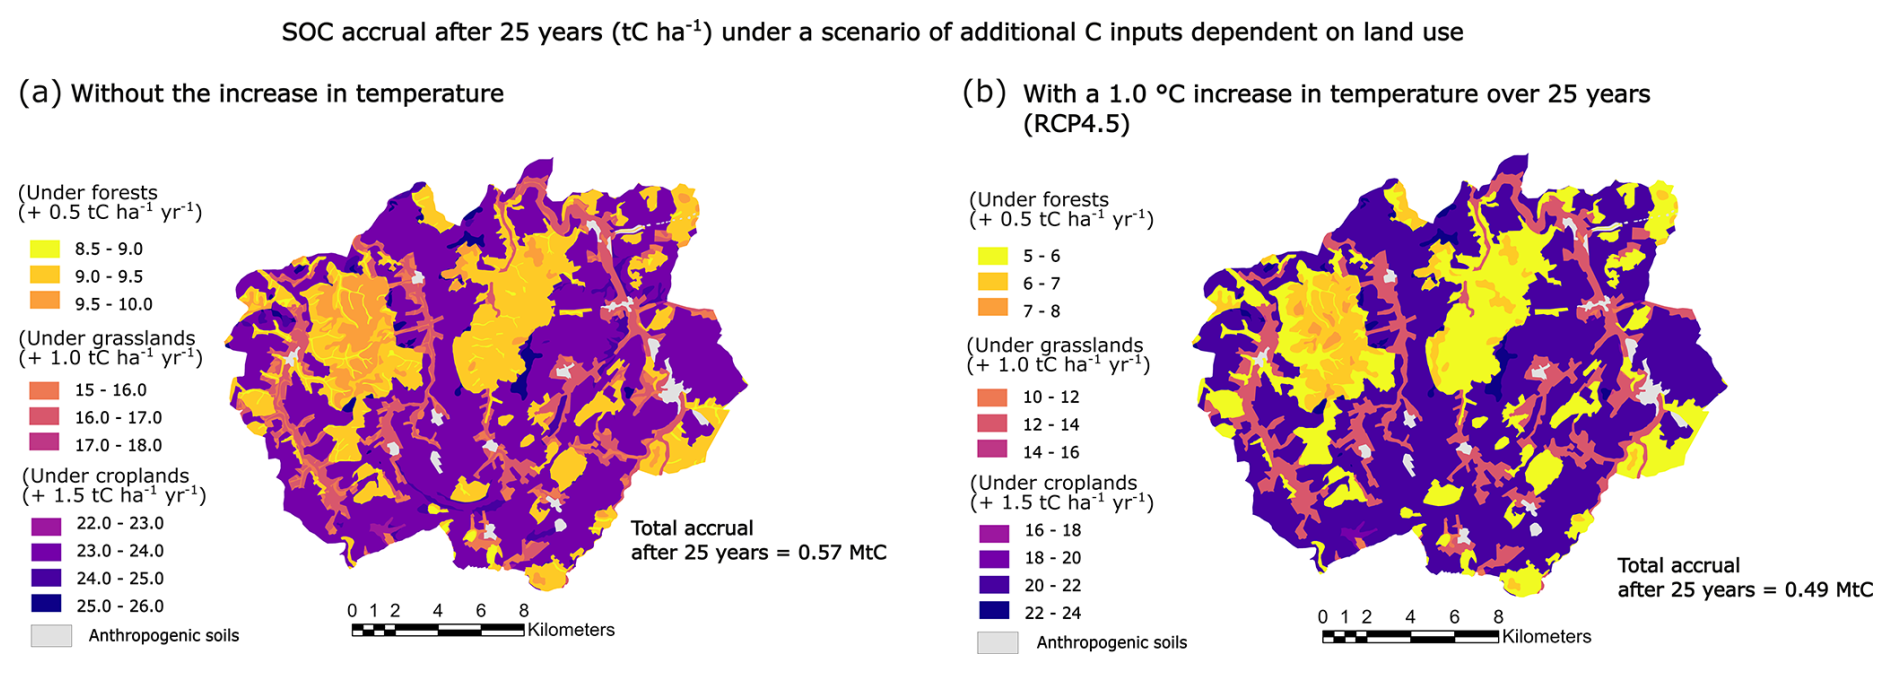
Figure F2SOC accrual after 25 years under a scenario of additional C inputs dependent on land use, (a) with temperatures staying at their 2018 level and (b) with a 1.0 °C increase in temperature over 25 years, increasing the C mineralization rates according to the correction factors of the AMG model. The attenuation in SOC accrual due to increased mineralization rates is (0.49–0.57) / 0.57=14 %. The 1.0 °C increase in temperature was obtained from model simulations of mean annual temperatures by the Météo France ALADIN63_CNRM-CM5 model under scenario RCP4.5 within an 8 km radius area around Bure (55087), comparing the intervals of 2046–2055 and 2009–2019. This information is sourced from DRIAS, Météo France, CERFACS, IPSL.
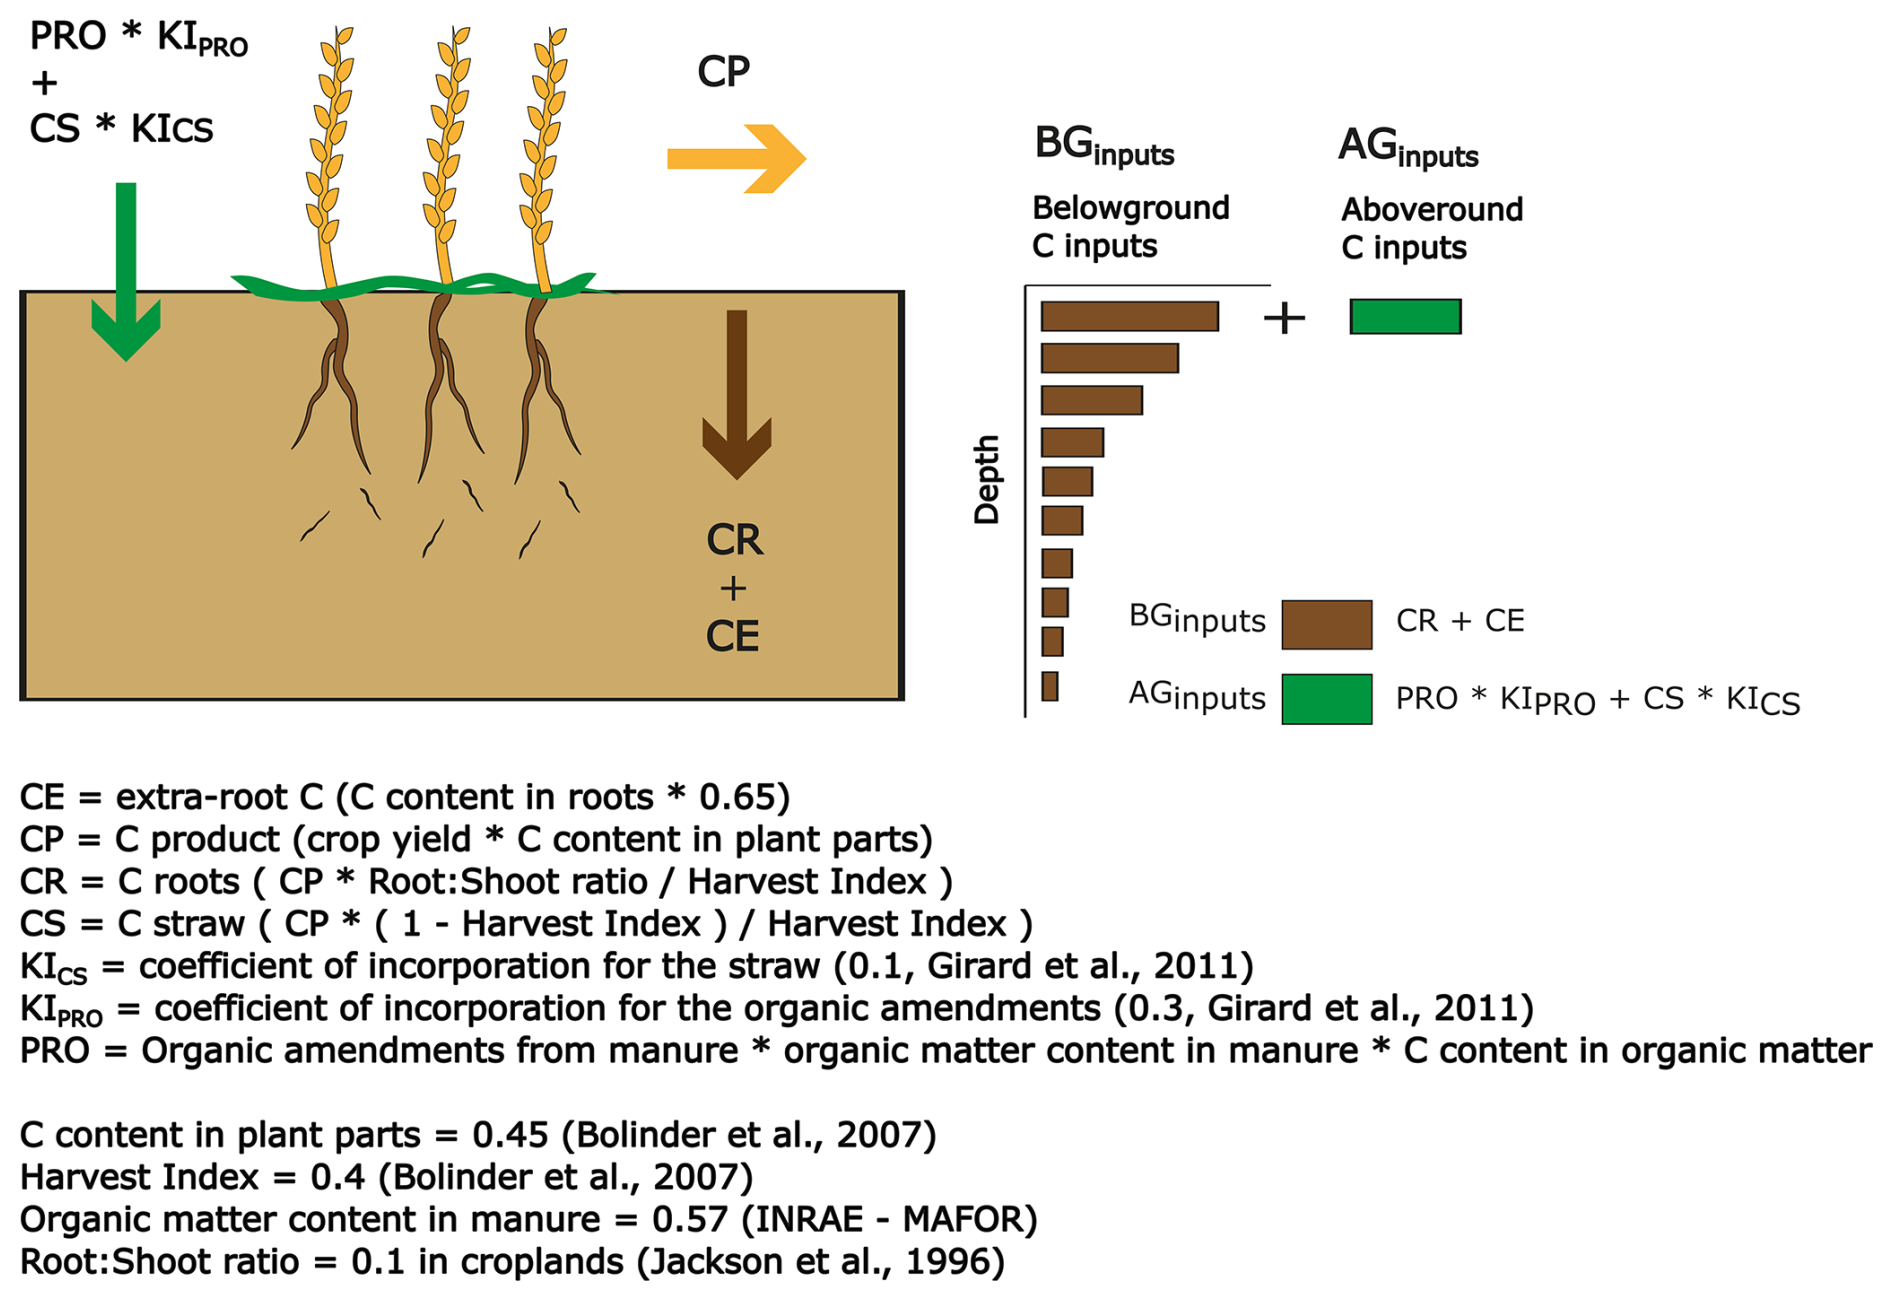
Figure G1Estimation of the current incorporated C inputs in croplands via a yield-based allocation coefficients method from Bolinder et al. (2017) using agricultural yield and amendment values based on compiled reports from 2010–2019 in the region of study. The allocation coefficients were derived from the literature (harvest index and carbon content in plant parts are from Bolinder et al., 2007; organic matter content in manure from Houot et al., 2014; root : shoot ratios in croplands from Jackson et al., 1996; and incorporation coefficients form Girard et al., 2011). Estimated C inputs in the croplands in the region of study are 1.4 tC ha−1 yr−1, with a mean winter wheat yield value of 5.53 t dry matter ha−1 yr−1 and an amendment value of 2.13 t dry matter ha−1 yr−1. The average C inputs in the steady state obtained via model inversion in the croplands of the region of study, weighted by the proportion of each soil type in the cropland areas, amount to 1.7 tC ha−1 yr−1.
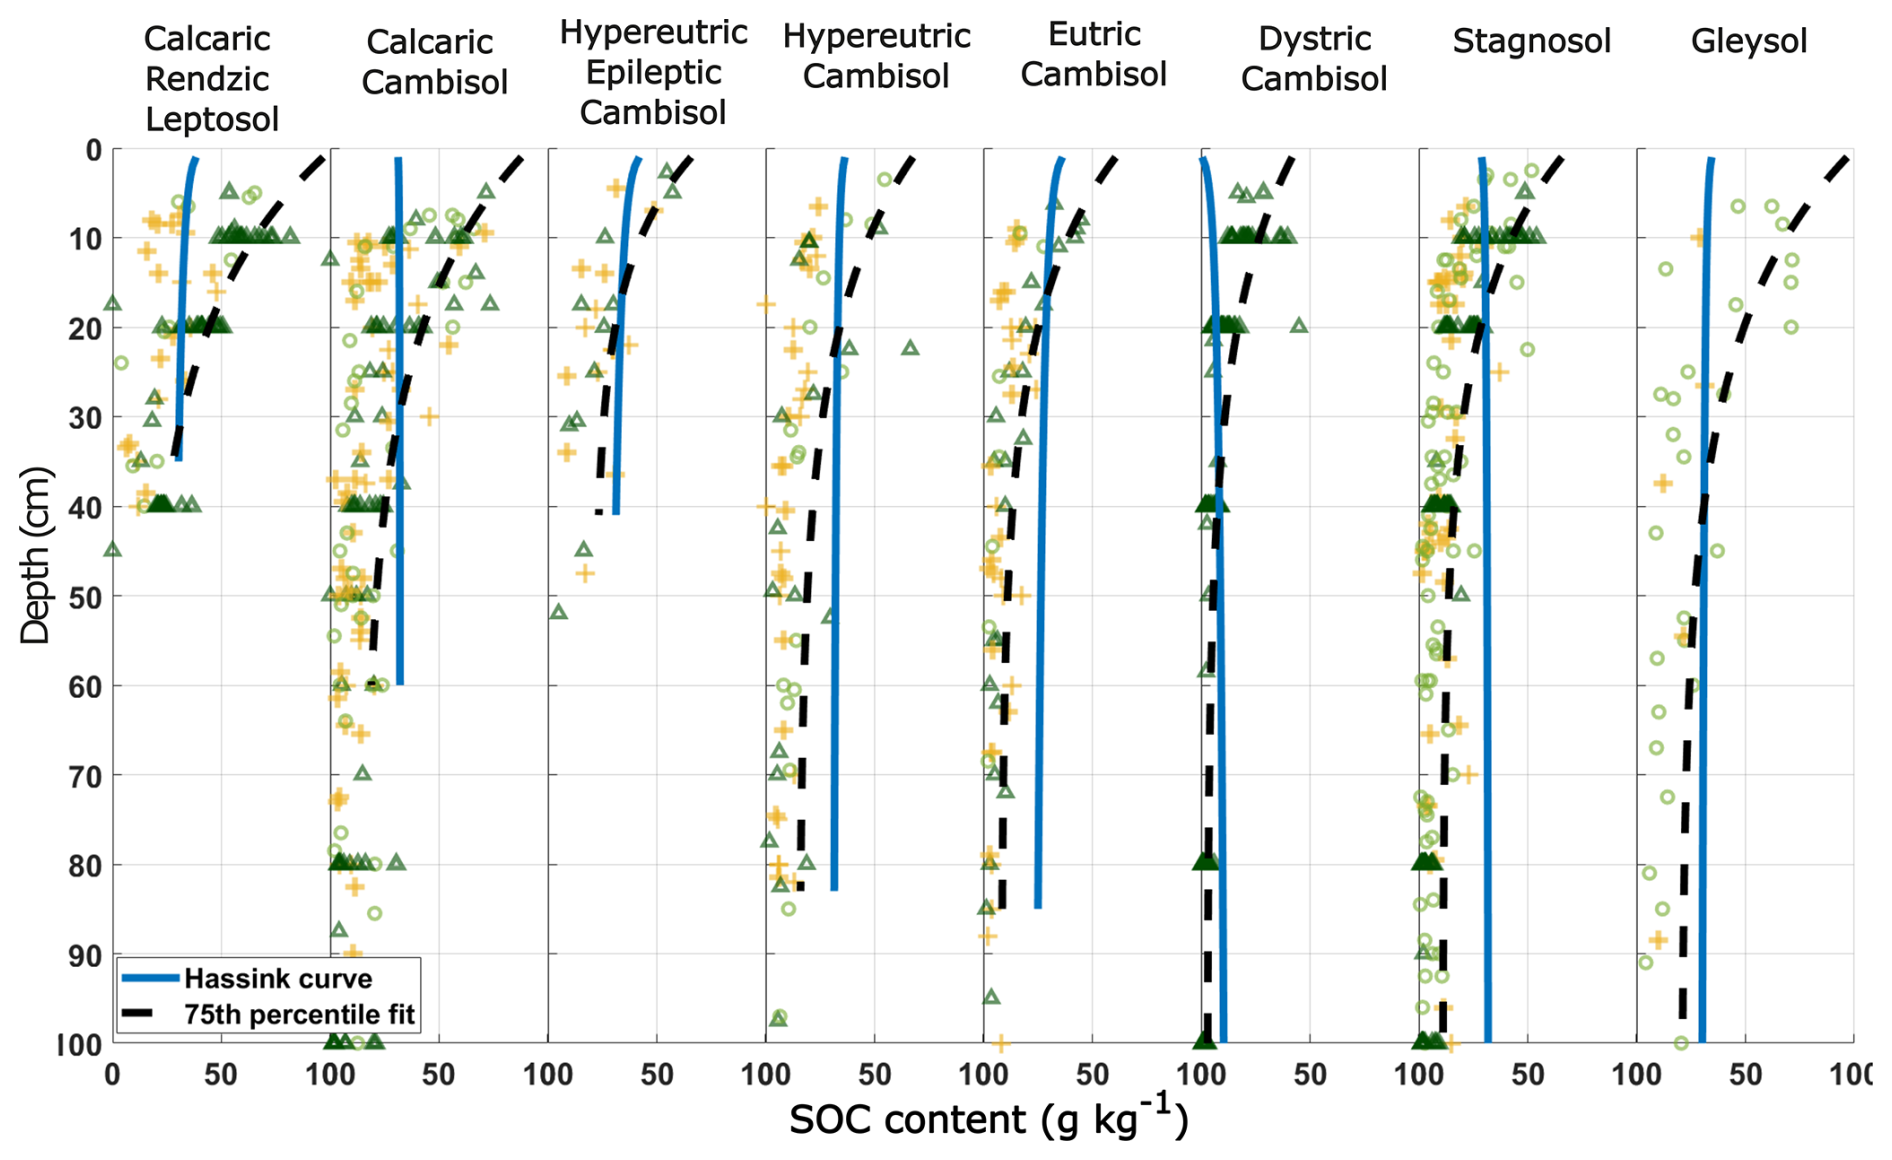
Figure H1Carbon saturation curves from Hassink as a function of depth. The Hassink equation was established empirically on the basis of 20 Dutch grassland soils considered to be in the stationary state, as follows: C (Clay + fineSilt) (%), where Csat is the theoretical carbon saturation concentration in the fine fraction in g kg−1. The Hassink equation provides unrealistic profiles of the maximum SOC content distribution in the fine fraction at depth below 30 cm, especially in the Hypereutric Cambisol, Eutric Cambisol, and Stagnosol, as the equation only accounts for soil texture and does not consider the biotic controls on C inputs and SOC decomposition rates. As a comparison, the 75th-percentile fit represents a theoretical maximum SOC content in both the fine fraction and the particulate organic matter.
All equations used in our model are detailed in Appendix B. The MATLAB codes are available upon reasonable request to the corresponding author.
The raw RMQS datasets of soil physico-chemical properties, including carbon content and land use, and the raw data of bulk density and rock fragment content can be accessed through the respective DOIs: https://doi.org/10.15454/QSXKGA (INRAE et al., 2021) and https://doi.org/10.57745/7Y3G5W (INRAE et al., 2024) (associated publication: Munera-Echeverri et al., 2024) The raw data of carbon content and bulk from the RENECOFOR are accessible upon reasonable request via the Open Data platform of the ONF (Office National des Forêts): https://www.onf.fr/renecofor/+/35::opendata-onf.html (Cissé et al., 2023). The Corine Land Cover data can be accessed at https://doi.org/10.2909/960998c1-1870-4e82-8051-6485205ebbac (European Environment Agency, 2020). Some soil profile description data as well as the soil map of the region of study belong to ANDRA and are not publicly accessible. All processed data used for our figures and interpretations are available as tables in the paper and in the Appendix.
All authors have given approval to the final version of the paper. The manuscript was written through contributions of all authors as follows. CC: conceptualization, data analysis, SOC model development, and original draft. GS: conceptualization and writing (review and editing). POR: data provider and writing (review and editing). CC: conceptualization and writing (review and editing). DD: conceptualization, SOC model advice and improvement, and writing (review and editing).
The contact author has declared that none of the authors has any competing interests.
Publisher’s note: Copernicus Publications remains neutral with regard to jurisdictional claims made in the text, published maps, institutional affiliations, or any other geographical representation in this paper. While Copernicus Publications makes every effort to include appropriate place names, the final responsibility lies with the authors.
We would like to thank Catherine Galy and Paul-Olivier Redon (ANDRA) for providing datasets and information on the OPE study area, Line Boulonne (RMQS) and Manuel Nicolas and Sébastien Macé (RENECOFOR) for providing datasets, and Laurent Saint-André and Marie-Pierre Turpault for their advice on the project.
This research has been supported by the French PIA project “Lorraine Université d'Excellence” (grant no. ANR-15-IDEX-04-LUE) and by the Radioactive Waste Management Agency (ANDRA).
This paper was edited by Claudio Zaccone and reviewed by two anonymous referees.
Abramoff, R. Z., Guenet, B., Zhang, H., Georgiou, K., Xu, X., Viscarra Rossel, R. A., Yuan, W., and Ciais, P.: Improved global-scale predictions of soil carbon stocks with Millennial Version 2, Soil Biol. Biochem., 164, 108466, https://doi.org/10.1016/j.soilbio.2021.108466, 2022.
Adhikari, K. and Hartemink, A. E.: Linking soils to ecosystem services – A global review, Geoderma, 262, 101–111, https://doi.org/10.1016/j.geoderma.2015.08.009, 2016.
Akpa, S. I., Odeh, I. O., Bishop, T. F., Hartemink, A. E., and Amapu, I. Y.: Total soil organic carbon and carbon sequestration potential in Nigeria, Geoderma, 271, 202–215, https://doi.org/10.1016/j.geoderma.2016.02.021, 2016.
Andriulo, A., Mary, B., and Guerif, J.: Modelling soil carbon dynamics with various cropping sequences on the rolling pampas, Agronomie, 19, 365–377, https://doi.org/10.1051/agro:19990504, 1999.
Angers, D. A., Arrouays, D., Saby, N. P. A., and Walter, C.: Estimating and mapping the carbon saturation deficit of French agricultural topsoils: Carbon saturation of French soils, Soil Use Manage., 27, 448–452, https://doi.org/10.1111/j.1475-2743.2011.00366.x, 2011.
Autret, B., Mary, B., Chenu, C., Balabane, M., Girardin, C., Bertrand, M., Grandeau, G., and Beaudoin, N.: Alternative arable cropping systems: A key to increase soil organic carbon storage? Results from a 16 year field experiment, Agr. Ecosyst. Environ., 232, 150–164, https://doi.org/10.1016/j.agee.2016.07.008, 2016.
Balesdent, J., Basile-Doelsch, I., Chadoeuf, J., Cornu, S., Derrien, D., Fekiacova, Z., and Hatté, C.: Atmosphere–Soil Carbon Transfer as a Function of Soil Depth, Nature, 559, 599–602, https://doi.org/10.1038/s41586-018-0328-3, 2018.
Barré, P., Angers, D. A., Basile-Doelsch, I., Bispo, A., Cécillon, L., Chenu, C., Chevallier, T., Derrien, D., Eglin, T. K., and Pellerin, S.: Ideas and perspectives: Can we use the soil carbon saturation deficit to quantitatively assess the soil carbon storage potential, or should we explore other strategies?, Biogeosciences Discuss. [preprint], https://doi.org/10.5194/bg-2017-395, 2017.
Beutler, S. J., Pereira, M. G., Tassinari, W. S., Menezes, M. D., Valladares, G. S., and dos Anjos, L. H. C.: Bulk density prediction for Histosols and soil horizons with high organic matter content, Rev. Bras. Cienc. Solo, 41, e0160158, https://doi.org/10.1590/18069657rbcs20160158, 2017.
Bormann, H.: Assessing the soil texture-specific sensitivity of simulated soil moisture to projected climate change by SVAT modelling, Geoderma, 185, 73–83, https://doi.org/10.1016/j.geoderma.2012.03.021, 2012.
Bolinder, M. A., Janzen, H. H., Gregorich, E. G., Angers, D. A., and VandenBygaart, A. J.: An approach for estimating net primary productivity and annual carbon inputs to soil for common agricultural crops in Canada, Agr. Ecosyst. Environ., 118, 29–42, https://doi.org/10.1016/j.agee.2006.05.013, 2007.
Bruni, E., Guenet, B., Huang, Y., Clivot, H., Virto, I., Farina, R., Kätterer, T., Ciais, P., Martin, M., and Chenu, C.: Additional carbon inputs to reach a 4 per 1000 objective in Europe: feasibility and projected impacts of climate change based on Century simulations of long-term arable experiments, Biogeosciences, 18, 3981–4004, https://doi.org/10.5194/bg-18-3981-2021, 2021.
Chen, S., Arrouays, D., Angers, D. A., Chenu, C., Barré, P., Martin, M. P., Saby, N. P., and Walter, C.: National estimation of soil organic carbon storage potential for arable soils: A data-driven approach coupled with carbon-landscape zones, Sci. Total Environ., 666, 355–367, https://doi.org/10.1016/j.scitotenv.2019.02.249, 2019.
Cissé, G., Essi, M., Kedi, B., Nicolas, M., and Staunton, S: Accumulation and vertical distribution of glomalin-related soil protein in French temperate forest soils as a function of tree type, climate and soil properties, Catena, 220, 106635, https://doi.org/10.1016/j.catena.2022.106635, 2023 (data available at: https://www.onf.fr/renecofor/+/35::opendata-onf.html, last access: 3 February 2025).
Clivot, H., Mary, B., Valé, M., Cohan, J.-P., Champolivier, L., Piraux, F., Laurent, F., and Justes, E.: Quantifying in situ and modeling net nitrogen mineralization from soil organic matter in arable cropping systems, Soil Biol. Biochem., 111, 44–59, https://doi.org/10.1016/j.soilbio.2017.03.010, 2017.
Cotrufo, M. F., Ranalli, M. G., Haddix, M. L., Six, J., and Lugato, E.: Soil carbon storage informed by particulate and mineral-associated organic matter, Nat. Geosci., 12, 989–994, https://doi.org/10.1038/s41561-019-0484-6, 2019.
Derrien, D., Barré, P., Basile-Doelsch, I., Cécillon, L., Chabbi, A., Crème, A., Fontaine, S., Henneron, L., Janot, N., Lashermes, G., Quénéa, K., Rees, F., and Dignac, M.-F.: Current controversies on mechanisms controlling soil carbon storage: Implications for interactions with practitioners and policy-makers. A review, Agron. Sustain. Dev., 43, 21, https://doi.org/10.1007/s13593-023-00876-x, 2023.
De Vos, B., Cools, N., Ilvesniemi, H., Vesterdal, L., Vanguelova, E., and Carnicelli, S.: Benchmark values for forest soil carbon stocks in Europe: Results from a large scale forest soil survey, Geoderma, 251–252, 33–46, https://doi.org/10.1016/j.geoderma.2015.03.008, 2015.
Dupouey, J. L., Cosserat, R., and Favre, F.: Etablissement de la carte de l'utilisation ancienne des sols dans la première moitié du XIXe siècle sur le territoire de l'observatoire de Meuse/Haute Marne, in: , Caractérisation des milieux forestiers – site Andra Meuse/Haute-Marne, Rapport scientifique, Observatoire de l'écosystème forestier, edited by: Turpault, M. P., HAVL-Programme observation et surveillance du stockage et de son environnement, ANDRA, https://hal.inrae.fr/hal-02823827 (last access: 31 January 2025), 2008.
European Environment Agency: CORINE Land Cover 2018 (Raster 100 m), Europe, 6-Yearly-Version 2020_20u1, May 2020 [data set], https://doi.org/10.2909/960998c1-1870-4e82-8051-6485205ebbac, 2020.
Fujita, Y., Witte, J. P. M., and van Bodegom, P. M.: Incorporating microbial ecology concepts into global soil mineralization models to improve predictions of carbon and nitrogen fluxes, Global Biogeochem. Cy., 28, 223–238, https://doi.org/10.1002/2013GB004595, 2014.
Georgiou, K., Jackson, R. B., Vindušková, O., Abramoff, R. Z., Ahlström, A., Feng, W., Harden, J. W., Pellegrini, A. F. A., Polley, H. W., Soong, J. L., Riley, W. J., and Torn, M. S.: Global stocks and capacity of mineral-associated soil organic carbon, Nat. Commun., 13, 3797, https://doi.org/10.1038/s41467-022-31540-9, 2022.
Guenet, B., Camino-Serrano, M., Ciais, P., Tifafi, M., Maignan, F., Soong, J. L., and Janssens, I. A.: Impact of priming on global soil carbon stocks, Glob. Change Biol., 24, 1873–1883, https://doi.org/10.1111/gcb.14069, 2018.
Guo, L. B. and Gifford, R. M.: Soil carbon stocks and land use change: a meta-analysis, Glob. Change Biol., 8, 345–360, https://doi.org/10.1046/j.1354-1013.2002.00486.x, 2002.
Harrison, R. B., Footen, P. W., and Strahm, B. D.: Deep soil horizons: Contribution and importance to soil carbon pools and in assessing whole-ecosystem response to management and global change, Forest Sci., 57, 67–76, https://doi.org/10.1093/forestscience/57.1.67, 2011.
Hartley, I. P., Hill, T. C., Chadburn, S. E., and Hugelius, G.: Temperature effects on carbon storage are controlled by soil stabilisation capacities, Nat. Commun., 12, 6713, https://doi.org/10.1038/s41467-021-27101-1, 2021.
Hassink, J.: The capacity of soils to preserve organic C and N by their association with clay and silt particles, Plant Soil, 191, 77–87, https://doi.org/10.1023/A:1004213929699, 1997.
Houot, S., Pons, M.-N., Pradel, M., Savini, I., and Tibi, A.: Valorisation des matières fertilisantes d'origine résiduaire sur les sols à usage agricole ou forestier, Expertise scientifique collective, Inra-CNRS-Irstea, France, https://doi.org/10.15454/2jrt-ec49, 2014.
INRAE et al.: Analyses physico-chimiques des sites du Réseau de Mesures de la Qualité des Sols (RMQS) du territoire métropolitain pour la 1ère campagne (2000–2009) avec coordonnées théoriques, Recherche Data Gouv [data set], https://doi.org/10.15454/QSXKGA, 2021.
INRAE et al.: Raw bulk density and coarse fragment data of the first campaign of the French Soil Quality Monitoring Network, Recherche Data Gouv [data set], https://doi.org/10.57745/7Y3G5W, 2024.
Jackson, R. B., Canadell, J., Ehleringer, J. R., Mooney, H. A., Sala, O. E., and Schulze, E. D.: A global analysis of root distributions for terrestrial biomes, Oecologia, 108, 389–411, https://doi.org/10.1007/BF00333714, 1996.
Jandl, R., Lindner, M., Vesterdal, L., Bauwens, B., Baritz, R., Hagedorn, F., Johnson, D. W., Minkkinen, K., and Byrne, K. A.: How strongly can forest management influence soil carbon sequestration?, Geoderma, 137, 253–268, https://doi.org/10.1016/j.geoderma.2006.09.003, 2007.
Jobbágy, E. G. and Jackson, R. B.: The vertical distribution of soil organic carbon and its relation to climate and vegetation, Ecol. Appl., 10, 423–436, https://doi.org/10.1890/1051-0761(2000)010[0423:TVDOSO]2.0.CO;2, 2000.
Jreich, R.: Vertical Distribution of carbon in Soils – Bayesian Analysis of carbon content and C14 profiles, Earth Sciences, Université Paris Saclay (COmUE), https://theses.hal.science/tel-02004461 (last access: 31 January 2025), 2018.
Keiluweit, M., Nico, P. S., Kleber, M., and Fendorf, S.: Are oxygen limitations under recognized regulators of organic carbon turnover in upland soils?, Biogeochemistry, 127, 157–171, https://doi.org/10.1007/s10533-015-0180-6, 2016.
Kögel-Knabner, I., and Amelung, W.: Soil organic matter in major pedogenic soil groups, Geoderma, 384, 114785, https://doi.org/10.1016/j.geoderma.2020.114785, 2021.
Lal, R.: Forest soils and carbon sequestration, Forest Ecol. Manag., 220, 242–258, https://doi.org/10.1016/j.foreco.2005.08.015, 2005.
Levavasseur, F., Mary, B., Christensen, B. T., Duparque, A., Ferchaud, F., Kätterer, T., Lagrange, H., Montenach, D., Resseguier, C., and Houot, S.: The simple AMG model accurately simulates organic carbon storage in soils after repeated application of exogenous organic matter, Nutr. Cycl. Agroecosys., 117, 215–229, https://doi.org/10.1007/s10705-020-10065-x, 2020.
Luo, Z., Feng, W., Luo, Y., Baldock, J., and Wang, E.: Soil organic carbon dynamics jointly controlled by climate, carbon inputs, soil properties and soil carbon fractions, Glob. Change Biol., 23, 4430–4439, https://doi.org/10.1111/gcb.13767, 2017.
Malik, A. A., Puissant, J., Buckeridge, K. M., Goodall, T., Jehmlich, N., Chowdhury, S., Gweon, H. S., Peyton, J. M., Mason, K. E., van Agtmaal, M., Blaud, A., Clark, I. M., Whitaker, J., Pywell, R. F., Ostle, N., Gleixner, G., and Griffiths, R. I.: Land use driven change in soil pH affects microbial carbon cycling processes, Nat. Commun., 9, 3591, https://doi.org/10.1038/s41467-018-05980-1, 2018.
Mao, Z., Derrien, D., Didion, M., Liski, J., Eglin, T., Nicolas, M., Jonard, M., and Saint-André, L.: Modeling soil organic carbon dynamics in temperate forests with Yasso07, Biogeosciences, 16, 1955–1973, https://doi.org/10.5194/bg-16-1955-2019, 2019.
Martin, M. P., Dimassi, B., Román Dobarco, M., Guenet, B., Arrouays, D., Angers, D. A., Blache, F., Huard, F., and Pellerin, S.: Feasibility of the 4 per 1000 aspirational target for soil carbon: A case study for France, Glob. Change Biol., 27, 2458–2477, https://doi.org/10.1111/gcb.15547, 2021.
Mathieu, J. A., Hatté, C., Balesdent, J., and Parent, É.: Deep soil carbon dynamics are driven more by soil type than by climate: A worldwide meta-analysis of radiocarbon profiles, Glob. Change Biol., 21, 4278–4292, https://doi.org/10.1111/gcb.13012, 2015.
Mayer, M., Prescott, C. E., Abaker, W. E., Augusto, L., Cécillon, L., Ferreira, G. W., James, J., Jandl, R., Katzensteiner, K., Laclau, J.-P., Laganière, J., Nouvellon, Y., Paré, D., Stanturf, J. A., Vanguelova, E. I., and Vesterdal, L.: Tamm Review: Influence of forest management activities on soil organic carbon stocks: A knowledge synthesis, Forest Ecol. Manag., 466, 118127, https://doi.org/10.1016/j.foreco.2020.118127, 2020.
Minasny, B., Malone, B. P., McBratney, A. B., Angers, D. A., Arrouays, D., Chambers, A., Chaplot, V., Chen, Z. S., Cheng, K., Das, B. S., Field, D. J., Gimona, A., Hedley, C. B., Hong, S. Y., Mandal, B., Marchant, B. P., Martin, M., McConkey, B. G., Mulder, V. L., and Winowiecki, L.: Soil carbon 4 per mille, Geoderma, 292, 59–86, https://doi.org/10.1016/j.geoderma.2017.01.002, 2017.
Munera-Echeverri, J. L., Boulonne, L., Saby, N. P., Arrouays, D., Bertouy, B., Lacarce, E., Serré, F., Toutain, B., Millet, F., Loiseau, T., and Martin, M.: Datasets on bulk density and coarse fragment content from the French soil quality monitoring network, Data in Brief, 56, 110767, https://doi.org/10.1016/j.dib.2024.110767, 2024.
Party, J. P., Vauthier, Q., and Rigou, L.: Notice de la carte pédologique au 1/50000 de la zone OPE, ANDRA (limited access), 2019.
Pellerin, S., Bamière, L., Savini, I., Rechauchère, O., Launay, C., Martin, R., Schiavo, M., Angers, D., Augusto, L., Balesdent, J., Basile-Doelsch, I., Bellassen, V., Cardinael, R., Cécillon, L., Ceschia, E., Chenu, C., Constantin, J., Daroussin, J., Delacote, P., Delame, N., Gastal, F., Gilbert, D., Graux, A.-I., Guenet, B., Houot, S., Klumpp, K., Letort, E., Litrico, I., Martin, M., Menasseri-Aubry, S., Meziere, D., Morvan, T., Mosnier, C., Roger-Estrade, J., Saint-André, L., Sierra, J., Therond, O., Viaud, V., Grateau, R., and Le Perchec, S.: Stocker du carbone dans les sols français, INRAE, https://doi.org/10.15454/nhxt-gn38, 2021.
Poeplau, C., Dechow, R., Begill, N., and Don, A.: Towards an ecosystem capacity to stabilise organic carbon in soils, Glob. Change Biol., 30, e17453, https://doi.org/10.1111/gcb.17453, 2024.
Rasmussen, C., Heckman, K., Wieder, W. R., Keiluweit, M., Lawrence, C. R., Berhe, A. A., Blankinship, J. C., Crow, S. E., Druhan, J. L., Hicks Pries, C. E., Marin-Spiotta, E., Plante, A. F., Schädel, C., Schimel, J. P., Sierra, C. A., Thompson, A., and Wagai, R.: Beyond clay: Towards an improved set of variables for predicting soil organic matter content, Biogeochemistry, 137, 297–306, 2018.
Rocci, K. S., Lavallee, J. M., Stewart, C. E., and Cotrufo, M. F.: Soil organic carbon response to global environmental change depends on its distribution between mineral-associated and particulate organic matter: A meta-analysis, Sci. Total Environ., 793, 148569, https://doi.org/10.1016/j.scitotenv.2021.148569, 2021.
Rowley, M. C., Grand, S., Spangenberg, J. E., and Verrecchia, E. P.: Evidence linking calcium to increased organo-mineral association in soils, Biogeochemistry, 153, 223–241, https://doi.org/10.1007/s10533-021-00779-7, 2021.
Saffih-Hdadi, K. and Mary, B.: Modeling consequences of straw residues export on soil organic carbon, Soil Biol. Biochem., 40, 594–607, https://doi.org/10.1016/j.soilbio.2007.08.022, 2008.
Sahrawat, K. L.: Organic matter accumulation in submerged soils, Adva. Agron., 81, 169–201, 2004.
Saxton, K. E. and Rawls, W. J.: Soil water characteristic estimates by texture and organic matter for hydrologic solutions, Soil Sci. Soc. Am. J., 70, 1569–1578, https://doi.org/10.2136/sssaj2005.0117, 2006.
Schimel, J.: Modeling ecosystem-scale carbon dynamics in soil: The microbial dimension, Soil Biol. Biochem., 178, 108948, https://doi.org/10.1016/j.soilbio.2023.108948, 2023.
Schlesinger, W. H., Dietze, M. C., Jackson, R. B., Phillips, R. P., Rhoades, C. C., Rustad, L. E., and Vose, J. M.: Forest biogeochemistry in response to drought, Glob. Change Biol., 22, 2318–2328, https://doi.org/10.1111/gcb.13105, 2016.
Sierra, C. A., Ahrens, B., Bolinder, M. A., Braakhekke, M. C., von Fromm, S., Kätterer, T., Luo, Z., Parvin, N., and Wang, G.: Carbon sequestration in the subsoil and the time required to stabilize carbon for climate change mitigation, Glob. Change Biol., 30, e17153, https://doi.org/10.1111/gcb.17153, 2024.
Shiri, J., Keshavarzi, A., Kisi, O., Karimi, S., and Iturraran-Viveros, U.: Modeling soil bulk density through a complete data scanning procedure: Heuristic alternatives, J. Hydrol., 549, 592–602, https://doi.org/10.1016/j.jhydrol.2017.04.035, 2017.
Tautges, N. E., Chiartas, J. L., Gaudin, A. C. M., O'Geen, A. T., Herrera, I., and Scow, K. M.: Deep soil inventories reveal that impacts of cover crops and compost on soil carbon sequestration differ in surface and subsurface soils, Glob. Change Biol., 25, 3753–3766, https://doi.org/10.1111/gcb.14762, 2019.
Verma, Y., Singh, N. K., and Pathak, S. O.: Application of carbon isotopic techniques in the study of soil organic matter dynamics, International Journal of Chemical Studies, 5, 1123–1128, 2017.
Wiesmeier, M., Von Lützow, M., Spörlein, P., Geuß, U., Hangen, E., Reischl, A., Schilling, B., and Kögel-Knabner, I.: Land use effects on organic carbon storage in soils of Bavaria: The importance of soil types, Soil Till. Res., 146, 296–302, https://doi.org/10.1016/j.still.2014.10.003, 2015.
Yang, Y., Tilman, D., Furey, G., and Lehman, C.: Soil carbon sequestration accelerated by restoration of grassland biodiversity, Nat. Commun., 10, 718, https://doi.org/10.1038/s41467-019-08636-w, 2019.
- Abstract
- Introduction
- Materials and methods
- Results
- Discussion
- Conclusions
- Appendix A
- Appendix B
- Appendix C
- Appendix D
- Appendix E
- Appendix F
- Appendix G
- Appendix H
- Code availability
- Data availability
- Author contributions
- Competing interests
- Disclaimer
- Acknowledgements
- Financial support
- Review statement
- References