the Creative Commons Attribution 4.0 License.
the Creative Commons Attribution 4.0 License.
 | 01 Feb 2024
Organic matters, but inorganic matters too: column examination of elevated mercury sorption on low organic matter aquifer material using concentrations and stable isotope ratios
David S. McLagan
Carina Esser
Lorenz Schwab
Jan G. Wiederhold
Jan-Helge Richard
Harald Biester
Sorption of mercury (Hg) in soils is suggested to be predominantly associated with organic matter (OM). However, there is a growing collection of research that suggests that clay minerals and oxides are also important solid phases for the sorption of soluble Hg in soil–groundwater systems. We use a series of (60 mL syringe based) column experiments to examine sorption and subsequent desorption of HgCl2 solutions (experiment 1 (EXP1): 46.1 ± 1.1 mg L−1; experiment 2 (EXP2): 144 ± 6 mg L−1) in low-OM (0.16 ± 0.02 %) solid-phase aquifer materials. Analyses of total Hg concentrations, Hg speciation (i.e. pyrolytic thermal desorption (PTD)), and Hg stable isotopes are performed on both solid- and liquid-phase samples across sorption and desorption phases of the experiments.
The sorption breakthrough curve best fitted a Freundlich model. Despite the very low-OM content, the Hg equilibrium sorptive capacity in these columns is very high: 1510 ± 100 and 2320 ± 60 mg kg−1 for EXP1 and EXP2, respectively, and it is similar to those determined for high-OM soils. Data from the experiments on mass-dependent Hg stable isotope fractionation data from these experiments (described by δ202Hg) support preferential sorption of lighter isotopes to the solid-phase materials with results indicating an isotopically heavier liquid phase and an isotopically lighter solid phase. Desorption fits exponential decay models, and 46 ± 6 % and 58 ± 10 % of the sorbed Hg is removed from the solid-phase materials at the termination of desorption in EXP1 and EXP2, respectively. The divergence of δ202Hg values between liquid and solid phases also continues into desorption. This desorption profile is linked to the initial release of easily exchangeable Hg(II) species physically sorbed to oxides and clay mineral surfaces (liquid phase enriched in heavy isotopes) and then slower release of Hg(II) species that have undergone secondary reaction to more stable/less-soluble Hg(II) species and/or diffusion/transport into the mineral matrices (processes favouring lighter isotopes; solid phase enriched in lighter isotopes). The secondary production of Hg(0) within the columns is confirmed by PTD analyses that indicate distinct Hg(0) release peaks in solid-phase samples at <175 ∘C, which again agrees with field observations. Retardation (RD) and distribution (KD) coefficients are 77.9 ± 5.5 and 26.1 ± 3.0 mL g−1 in EXP1, respectively, and 38.4 ± 2.7 and 12.4 ± 0.6 mL g−1 in EXP2, respectively. These values are similar to values derived from column experiments on high-OM soil and provide the basis for future Hg fate and transport modelling in soil–groundwater systems.
- Article
(2028 KB) - Full-text XML
-
Supplement
(2073 KB) - BibTeX
- EndNote


Mercury (Hg), a transition metal of group 12 and period 6 of the periodic table, has a unique electrochemical structure. The pair of electrons in the outermost (6 s) shell have a relativistically contracted radius, which greatly reduces the element's ability to form metal–metal bonds (Norrby, 1991). Hence, Hg is the only liquid-phase metal at standard temperature and pressure. Even with this radial contraction, Hg is an atomically large element, and species in its divalent oxidation state qualify as “soft acids”, which under hard and soft Lewis acid and base theory results in Hg having greater affinity for “soft bases” (Ho, 1975). One particularly pertinent soft base for Hg is sulfur. Cinnabar (α-HgS) and meta-cinnabar (β-HgS) are the dominant forms of Hg in the lithosphere (Gettens et al., 1972; Clarkson, 1997), but they are relatively stable ores that have very low solubility and bioavailability (Llanos et al., 2011; Lu et al., 2011). Mining of these cinnabar ores for industrial use of Hg has heavily perturbed the natural biogeochemical cycle of Hg. Other primary sources of Hg emissions/releases to the environment include geogenic (natural) sources, fossil-fuel combustion, industrial and medical uses of Hg, and legacy emissions from Hg-polluted sites (Pirrone et al., 2010; Kocman et al., 2013; Streets et al., 2019).
While redox conditions and organic matter (OM) availability and composition are key determinants in the mobility of Hg in aquatic/saturated-subsurface environments, pH (Andersson, 1979; Gu et al., 2011; Manceau and Nagy, 2019), chloride concentration (Cl−; Schuster, 1991), and speciation of Hg inputs (particularly for polluted systems; McLagan et al., 2022) also play important roles. Solubilities of Hg species vary widely from practically insoluble cinnabar species ( g L−1) via low-solubility elemental Hg (Hg(0): g L−1) to highly soluble mercury(II) chloride (HgCl2: 66 g L−1) (Sanemasa, 1975; Schroeder and Munthe, 1998; Skyllberg et al., 2012). In systems that are OM limited, clay minerals and oxides; hydroxides; and oxyhydroxides of Fe, Mn, and Al become increasingly important sorbents for Hg species (Lockwood and Chen, 1973; Schuster, 1991; Kim et al., 2004). Additionally, there is a strong tendency of Hg(II) to complex with hydroxides and halides under oxic conditions (Schuster, 1991, Ullrich et al., 2001). Uptake of Hg to inorganic sorbents has been reported to occur via rapid initial surface sorption followed by a slower phase of Hg undergoing secondary transformation to more stable/less-soluble species or diffusing into the mineral matrices (Avotins, 1975; Miretzky et al., 2005; McLagan et al., 2022).
More recently, laboratory and field studies have expanded biogeochemical assays of Hg in subsurface environments using stable isotopes (Jiskra et al., 2012; Zheng et al., 2018; McLagan et al., 2022). Hg is an isotopic system that has seven stable isotopes, and to which environmental processes can impart mass-dependent fractionation (MDF) as well as both odd and even mass-independent fractionation (MIF) (Bergquist and Blum, 2007, 2009; Wiederhold, 2015). In particular, this capacity for Hg stable isotope analyses to elicit valuable information on tracing/identifying specific environmental processes makes these analyses a vital tool in the examination of Hg biogeochemical cycling (Bergquist and Blum, 2007, 2009; Wiederhold, 2015).
Traditionally, column and batch experiments have been utilized to assess the sorption (including sorption or distribution coefficient, KD, and the related retardation coefficient, RD) and mobility of contaminants for solid-phase soil and aquifer materials. Both methods have strengths and weaknesses. Batch experiments represent the simplest means to test analyte sorption, but these experiments are static, and equilibrium oriented; questions about the applicability of the results to natural systems with flowing water and potentially changing levels of saturation logically persist (Schlüter et al., 1995; Schlüter, 1997; Van Glubt et al., 2022). Flow-through columns provide a much more dynamic and manipulatable experimental environment that is also not exclusively limited to equilibrium-based sorption simulations. Nonetheless, they are more laborious, they are difficult to replicate from column to column, column boundaries (walls) can present preferential flow problems, and despite the ability to manipulate the physicochemical properties of the columns this inevitably under-represents the inherent variability of actual soil/aquifer conditions (Sentenac et al., 2001; USEPA, 2004). Soil contaminant transport modelling is a rapidly developing field of research and provides an alternative/complementary method to these traditional experimental methods. While Hg soil transport modelling is also advancing, progress is somewhat limited by the lack of measurement data, particularly relating to KD values, Hg speciation, and methods of assessing specific processes for different soil/solid-phase materials (Leterme et al., 2014; Richard et al., 2016a).
Thus, it is important from both experimental and modelling standpoints that we determine effective means of deriving information on sorption/mobility of Hg in soils. Lacking the capacity to measure aquifer systems in situ, we deem column experiments using solid-phase materials sourced from sites of interest as the best available method to do so. Within this study, we aim to determine the sorptive (and desorptive) capacity of low-OM aquifer materials for Hg(II) using column experiments and total Hg (denoted THg) concentration, speciation, and stable isotope analyses of both solid- and liquid-phase materials. These experiments will be the first conducted on such low-OM soil/aquifer material and provide critical data into Hg transport and sorption within low-OM soil and aquifer systems to improve our geochemical understanding of subsurface Hg behaviour and for soil chemistry and transport modelling. In addition, these column experiments on uncontaminated aquifer material sourced from an area adjacent to a former industrial site at which HgCl2 was applied as wood preservative will simulate the contamination process. Data will aid our interpretation of the Hg biogeochemistry in coupled soil–groundwater systems, as well as future Hg groundwater transport modelling, and potentially provide guidance on contaminated site remediation.
2.1 Materials and experimental setup
The solid-phase material used in these experiments is highly permeable sand-gravel sediments sourced from the saturated zone of an unconsolidated aquifer (approximate depth: 10 m) extracted by a soil drill core in 2019. This site was impacted by losses of approximately 10–20 t of Hg in the form of a high-concentration HgCl2 solution (≈0.66 % HgCl2) that was applied to timber as a preservative (Schöndorf et al., 1999; Bollen et al., 2008; McLagan et al., 2022). The solid-phase materials were extracted from outside of the plume of contaminated groundwater (Site B in McLagan et al., 2022); hence, the starting THg concentration within these solid-phase materials was very low (Table 1). The geology and structure of the soil/aquifer profile has been described in detail in previous studies (Schöndorf et al., 1999; Bollen et al., 2008; McLagan et al., 2022). The material was stored in a dark and cool place before drying at 30 ∘C for 48 h. It was then sieved to a size of <2 mm using a mesh soil sieve, which resulted in a distribution of 74.1 ± 4.6 % coarse load (>2 mm; not used) and 25.8 ± 4.6 % fine load (<2 mm). A subsequent particle size analysis of the fine load was carried out using a sieving and sedimentation method (DIN ISO 11277, 2002), and results (see Table 1) categorize the solid-phase aquifer materials as a sandy loam on the soil texture triangle. A summary of the properties of the investigated material is shown in Table 1.

A set of preliminary experiments prior to experiment 1 (EXP1) and experiment 2 (EXP2) was run to optimize packing methods, flow rates, stock solution concentrations, and experiment run-times, and these are detailed in Sect. S1 in the Supplement. Based on these preliminary data, the experimental setup was based on a modified version of DIN method 19528-01 (DIN 2009). Eight ×60 mL disposable polypropylene syringes (height: 15.49 cm; inner diameter: 2.97 cm) were used as columns in each experiment (Fig. 1). The insides of the columns were roughened with sandpaper (and thoroughly cleaned with surfactant and rinsed with deionized water to remove any debris) in order to minimize preferential flow along the walls of the column. Each column was then filled with a layer of quartz wool and a layer of quartz beads, whose combined volume reached the 10 mL mark on the syringe. The sieved and dried material was then transferred by ≈14 g aliquots into the syringes (preliminary testing revealed dry packing achieved optimal column density and was best at preventing separation). Each aliquot was compacted to the desired volume, and the surface of each aliquot was broken up before the addition of the subsequent aliquot to prevent layering between each addition. The mean mass and bulk density (ρb) of the solid-phase aquifer materials added to the columns were 70.09 ± 0.04 g and 1.42 ± 0.01 g cm−3, respectively, in EXP1 and 70.05 ± 0.03 g and 1.43 ± 0.01 g cm−3, respectively, in EXP2. This resulted in the height of the solid-phase materials within the column being ≈11 cm. Additional layers of quartz beads and then quartz wool (syringe volume again ≈10 mL) were added on top of the solid-phase materials to reduce column separation and particle transport. Individual columns are named C1.1 to C1.8 for EXP1 and C2.1 to C2.8 for EXP2. According to Lewis and Sjöstrom (2010), the average bulk densities range from 1.2–2.0 g cm3 for sands and 1.6–2.0 g cm3 for gravel. Thus, we deem the achieved bulk density of the columns to be appropriate for these materials, particularly as densities of the removed coarse materials are higher (solid densities are estimated at 2.65 g cm3; Lewis and Sjöstrom (2010)).
All column experiments were conducted under saturated conditions. Figure 1a shows the configuration of the setup with the peristaltic pump upstream of the columns, and the direction of flow through the columns was bottom to top to minimize entrapment of air and preferential flow paths. The stock solution, peristaltic pump, columns, and eluate sampling points were connected with 3.125 mm (inner diameter) polypropylene tubing (length: 105 ± 10 cm; n=16). To simulate the aquifer (flow velocity of ≈3–10 m d−1; Schöndorf et al., 1999; Bollen et al., 2008) and prevent separation of the solid-phase materials within the column, the lowest possible flow rate of 0.62 ± 0.02 mL min−1 (n=16) was set across all columns (flow velocities measured before and after experiments; Sect. S2). The stock solution was made by mixing HgCl2 salt with tap water, and it was stored in a 20 L polyethylene container. Tap water was selected due to its inherent concentration of ions, low potential for biological activity, and ease of use (challenges in extraction, storage, and transport of large groundwater volumes from the study site ≈600 km away). Critically, the tap water and eluate DOC concentrations (2.3–3.3 mg L−1) were of a similar range (even slightly less) than the values measured by Richard et al. (2016a) at the site from where these solid-phase materials were removed (3.8–6.3 mg L−1). This should eliminate the possibility that tap water would introduce a significant amount of artificial sorption sites associated with DOC being added to the system.
Stock solutions were 46.1 ± 0.1 mg L−1 in EXP1 (n=6) and 144±6 mg L−1 in EXP2 (n=12) and were selected for the following reasons: (i) there were experimental constraints/time considerations (see Fig. S1.6) and (ii) these values remain between the HgCl2 concentration applied during industrial activities (6600 mg L−1; spillage of this solution to the top of the soil profile) and recently measured groundwater concentrations up to 164 ± 75.4 µg L−1, observed 55 years after cessation of the industrial activities at the site (McLagan et al., 2022). The physicochemical properties of both the stock solutions and eluate were monitored across the experiments, and data are listed in Sect. S2 in the Supplement. Desorption was performed by replacing the stock solution with tap water flowing at the same velocity. In total (sorption, equilibrium, and desorption), EXP1 and EXP2 ran continuously for 14 d, 3 h, and 9 min and 10 d, 13 h, and 4 min, respectively.
Columns were pre-conditioned with tap water for 1 week at the experimental flow rate to allow for equilibration between the solid-phase materials and the dissolved substances in the tap water, the major component of the stock solution used within the experiment. After 24 h of pre-conditioning, NaCl salt solution tracer experiments were conducted to monitor the rate of water transfer through the columns (assuming NaCl is a conserved tracer that does not interact with the solid-phase materials). The NaCl solution was passed into the system for 10 min and then replaced with tap water. The change in conductivity was measured over time using a hand-held electronic conductivity meter to produce NaCl (tracer) breakthrough curves. Results show good column flow consistencies similar to the volumetric flow measurements, and both data sets are described in detail in Sects. S1 and S2. The system was rigorously tested and checked for leaks during both the pre-conditioning and testing phases.
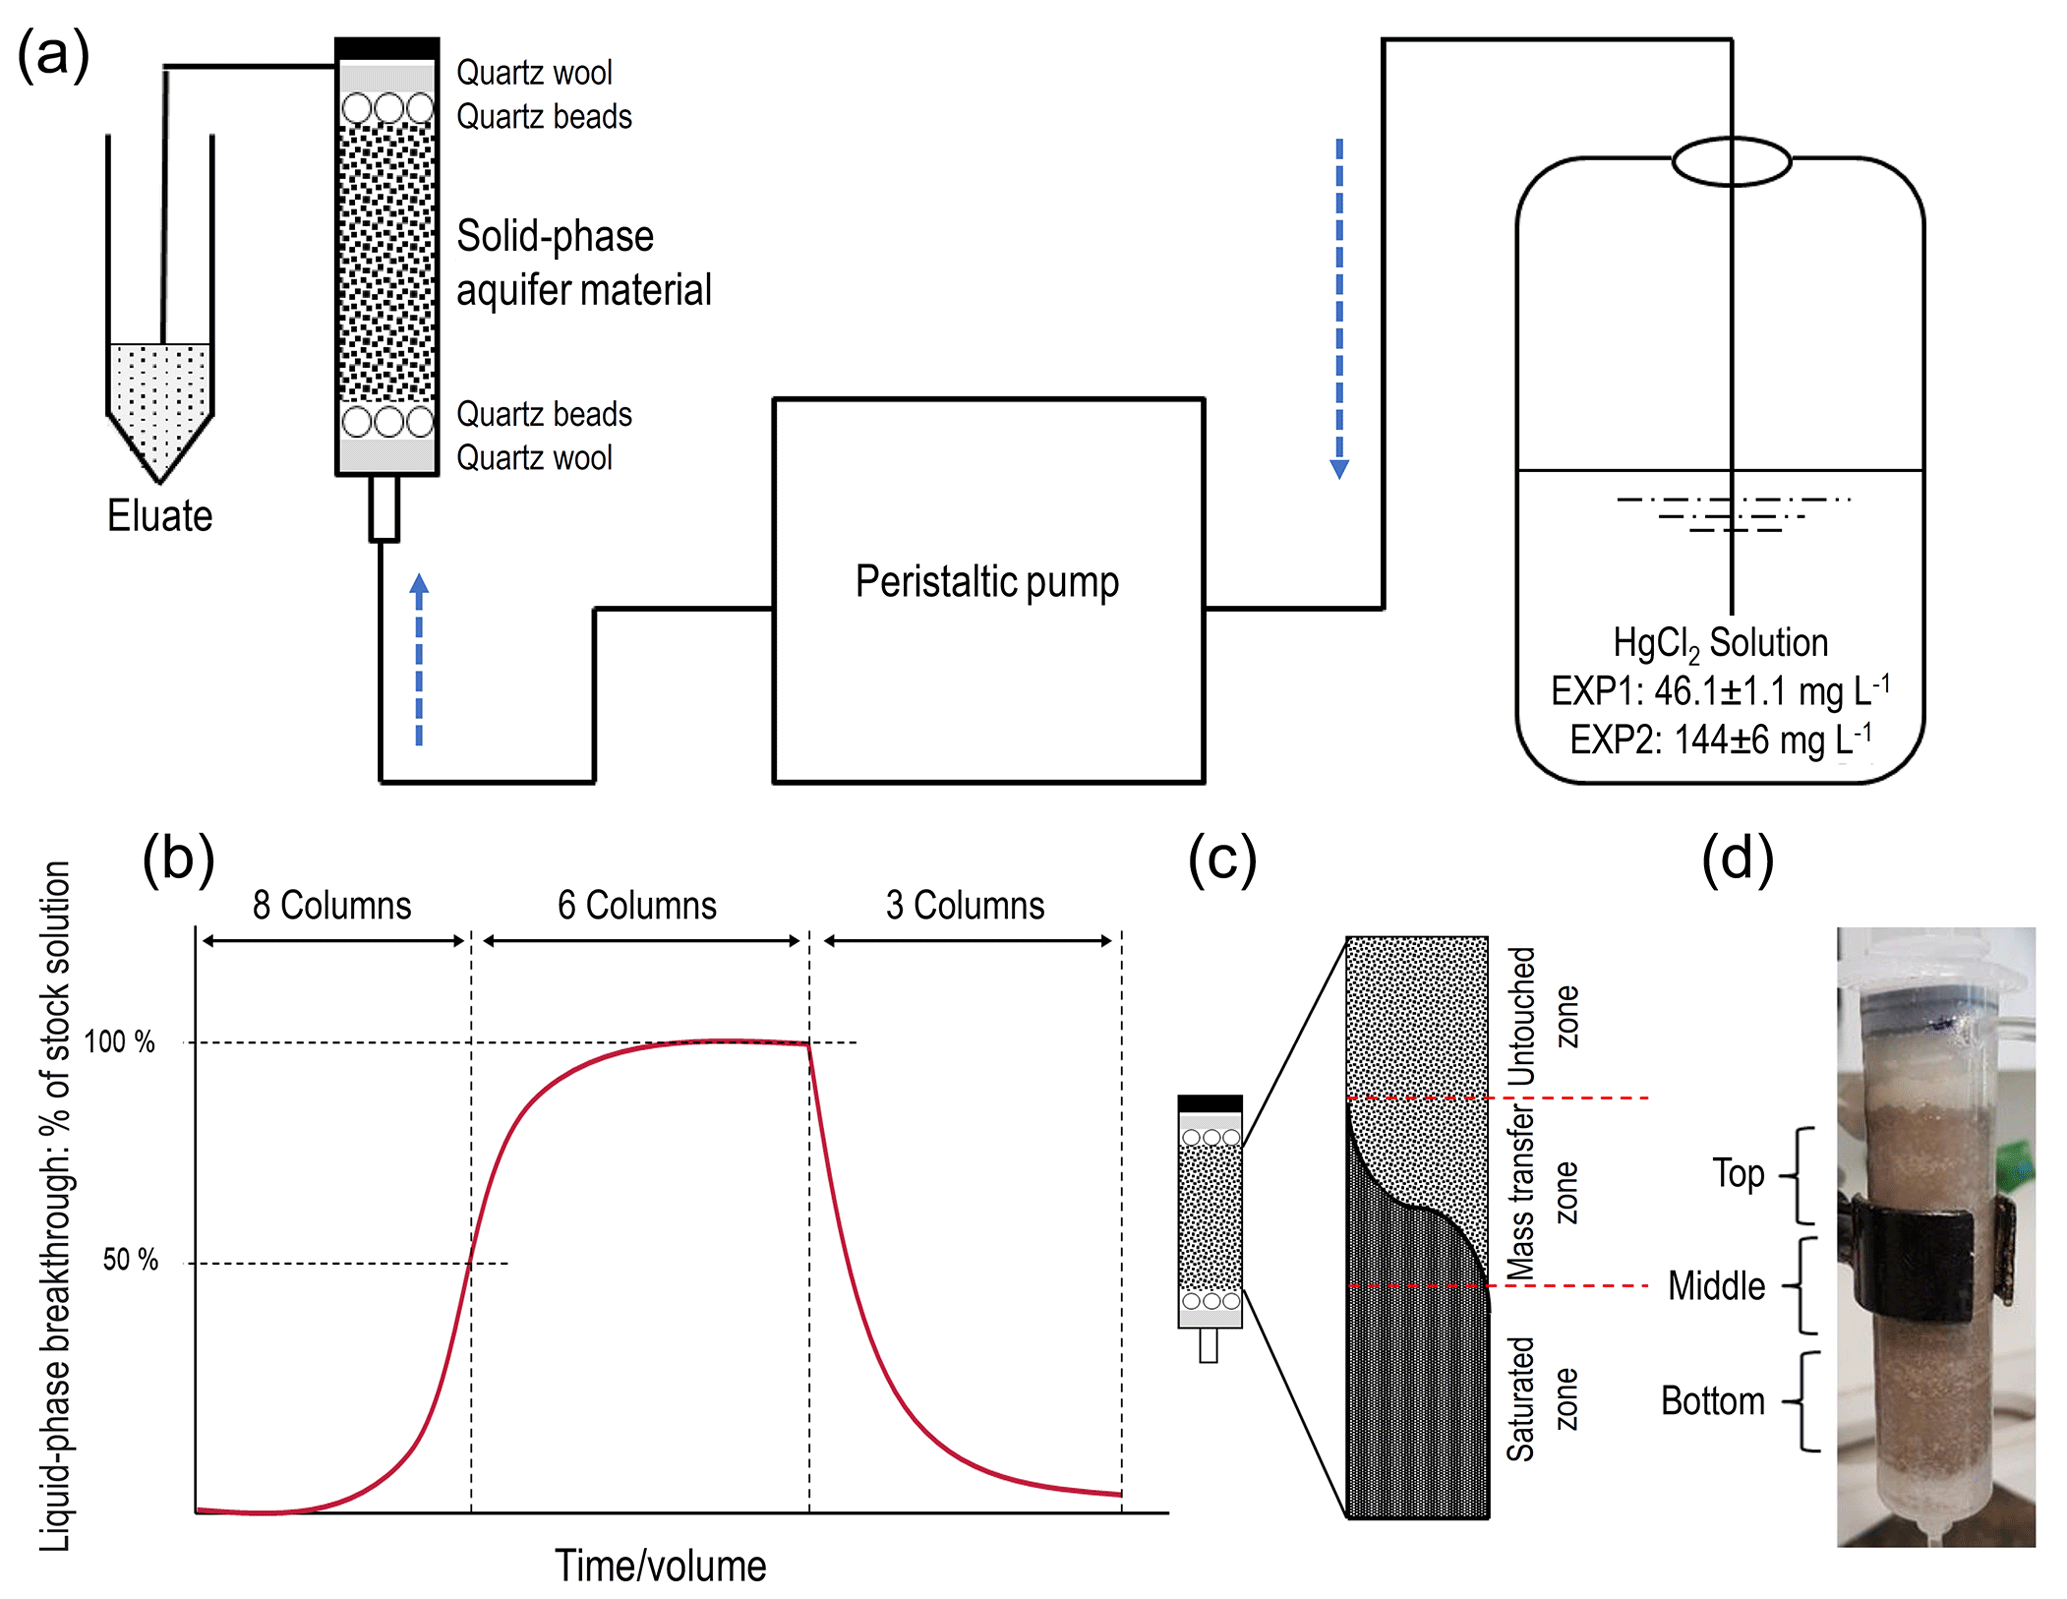
Figure 1(a) Schematic representation of the experimental setup. (b) Theoretical model of the experiments indicating sorption and desorption phases and column termination points for solid-phase analyses (two columns terminated at 50 % breakthrough, three columns terminated at ≈ equilibrium, and the final three columns terminated after desorption; end of experiment). (c) Representation of the zones of mass transfer of Hg during the sorption phase (“saturated zone” refers to solid phase in that zone reaching its equilibrium uptake capacity for Hg at the experimental solution concentration). The dark area describes the rising front of mercury. (c) Allocation of column sections (≈15 mL in each section) for solid-phase analyses (“Bottom” is the solution entry point).
A volume of 10 mL of eluate was allowed to flow off into a waste vessel before 5 mL of sample was collected for analysis (this was applied to all analyses). The liquid phase was sampled for THg concentrations consistently throughout the experiments: 38 times in EXP1 (10 times up to ≈50 % breakthrough (columns C1.1–C1.8); 11 times between ≈50 % breakthrough and ≈ equilibrium (columns C1.1–C1.6); and 17 times during desorption (columns C1.1–C1.3)) and 35 times in EXP2 (8 times up to ≈50 % breakthrough (columns C2.1–C2.8); 16 times between ≈50 % and ≈100 % breakthrough (columns C2.1–C2.3 and C2.6–C2.8); and 11 times during desorption (columns C2.1–C2.3)). Liquid-phase speciation samples were collected eight times at ≈25 %, 50 %, 75 % breakthrough, and approximately at equilibrium at the end of the equilibrium (immediately before stock solution was changed to tap water), and ≈0 % (immediately after stock solution was changed to tap water), 50 % and at the end of desorption for both experiments. Liquid-phase stable isotope samples were collected only from columns C2.1–C2.3 in EXP2 (9 times in total). Collections were similar to liquid-phase speciation sampling points with an additional collection during the sorption stage of the experiment. After termination, solid-phase materials were analysed for THg concentrations, Hg species, and Hg stable isotopes. In summary, C1.7 and C1.8 and C2.4 and C2.5 were sacrificed at ≈50 % breakthrough; C1.4–C1.6 and C2.6–C2.8 after equilibrium (≈100 % breakthrough), while C1.1–C1.3 and C2.1–C2.3 went through to the end of desorption.
2.2 Analyses
2.2.1 Liquid-phase THg and speciation analyses
Eluate samples for THg and Hg stable isotope analyses were immediately stabilized by adding 1 % by volume of 0.2 M bromine monochloride (BrCl), prepared according to Bloom et al. (2003). In order to break up all of the organically bound mercury in the liquid, a reaction time of the BrCl of 24 h is recommended (US EPA method 1631, 2002). However, with little OM (Table 1), we assessed sample THg analysis only 1 h after BrCl addition, and there was no impact on sample recovery (Table S1.2). Immediately prior to analysis, hydroxylamine hydrochloride (NH2OH ⋅ HCl) was added to neutralize the BrCl followed by addition of tin(II) chloride (SnCl2) solution as the Hg reducing agent.
Liquid-phase speciation analyses followed the same methods described elsewhere (Bollen et al., 2008; Richard et al., 2016b; McLagan et al., 2022). We describe this method as a complementary, semi-quantitative analytical tool that produces four distinct “fractions” of the total pool of liquid-phase Hg: (i) elemental Hg (Hg(0)) (purged from untreated eluate sample); (ii) dissolved inorganic Hg(II), termed Hg(II)A (purged after reduction with SnCl2 treatment, e.g. HgCl2); (iii) DOM-bound (dissolved organic matter) Hg(II), termed Hg(II)B (purged after BrCl and SnCl2 treatment); and (iv) particulate Hg, termed Hg(II)P (difference between THg concentrations in filtered and total unfiltered eluate samples). Both concentration and speciation results were measured using a cold-vapour atomic absorbance spectrometer (CV-AAS) (Hg-254 NE, Seefelder Messtechnik GmbH, Germany) according to DIN method 1483 (2007) and USEPA method 1631 (2002). Confidence in liquid-phase Hg(0) concentrations is higher than for other species, as these result from purging untreated/unstabilized samples of Hg(0) with nitrogen gas directly into the CV-AAS; all Hg(0) samples were analysed within 30 min of sample collection.
2.2.2 Solid-phase THg and speciation analyses
After individual columns were sacrificed for solid-phase analyses, the ends of the columns were sealed to prevent the columns from draining, and they were stored in the same upright position as the experimental setup (Fig. 1) to prevent further disturbance. Columns were cut into sections (Fig. 1d), homogenized and subset within 1 week of the end of the experiments, and stored at 4 ∘C in brown (opaque) Falcon tubes until digestions or analyses. All analyses were performed on wet samples to minimize any potential losses of Hg(0). The moisture content of solid-phase samples was determined on separate aliquots for each column by difference after drying at 35 ∘C and was 23 ± 2 % (n=48) (Sect. S8).
THg and Hg stable isotope analyses were cold digested in modified aqua regia following the methods described in McLagan et al. (2022) (8 mL HCl, 3 mL HNO3, and 1 mL BrCl). Analyses of THg concentrations from the digestion extracts were determined using CV-AAS following DIN method 1483 and USEPA method 1631. Results are reported on a dry weight basis, and moisture content was determined by difference after baking at 105 ∘C using aliquots of the solid-phase sample (Sect. S8). Due to the low concentrations in the original solid-phase aquifer materials, THg concentrations were measured with a DMA80 (Milestone SCI) via thermal decomposition, amalgamation, and AAS (Table 1).
Speciation analyses were performed by pyrolytic thermal desorption (PTD), which continually measures Hg at 254 nm within an AAS detector that is connected to a sample combustion furnace that heats samples from room temperature to 650 ∘C at 1 ∘C per minute in a stream of N2 gas. This method is described in detail by Biester and Scholz (1996). The sample release curves were compared to the release curves for a series of Hg reference materials (Hg(0), HgCl2, Hg2Cl2 (calomel), α-HgS (cinnabar), β-HgS (metacinnabar), and HgSO4 mercury(II) sulfate) in a silicon dioxide (SiO2) matrix (see Sect. S9 for reference material curves) to qualitatively assess the species or fractions of Hg present in the samples.
2.2.3 Liquid- and solid-phase Hg stable isotope analyses
Samples for stable Hg isotope analyses included stabilized liquid-phase eluate samples and solid-phase aqua regia extracts diluted with deionized water (18.2 MΩ cm). Liquid-phase samples were collected in 15 mL polypropylene tubes and stabilized with BrCl to reach 1 % of the sampled volume. Analyses were made using a Nu Plasma II (Nu Instruments) multicollector inductively coupled plasma mass spectrometer (MC-ICP-MS) with a cold-vapour generator (HGX-200; Teledyne Cetac) that allows for direct addition of Hg(0) into the MC-ICP-MS plasma by reducing all Hg in samples with SnCl2. The isotope ratios were determined relative to NIST-3133 (National Institute of Standards and Technology; NIST) using the standard bracketing approach and corrected for mass bias using thallium (Tl) doping from NIST-997 (NIST), introduced using an Aridus-2 desolvating nebulizer (Teledyne CETAC). MDF was assessed by variation in δ202Hg, while Δ199Hg, Δ200Hg, Δ201Hg, and Δ204Hg were used to assess MIF of odd and even isotopes (see Grigg et al., 2018; McLagan et al., 2022, for method details).
2.2.4 Complementary analyses
Metal cations in the solid and liquid phases were measured with inductively coupled plasma optical emission spectrometry (ICP-OES; Varian 715-ES; Agilent Technologies Inc.). Solid-phase total carbon (TC), total organic carbon (TOC), and total inorganic carbon (TIC; dissolved by hydrochloric acid) were measured by infrared detection of CO2 released (DIMA 1000NT; Dimatec, Germany). Dissolved organic carbon concentrations of the stock solution and eluate were measured with a carbon/nitrogen analyser (Multi N C 2100; Analytic Jena) (see Sect. S2). Liquid-phase dissolved oxygen content, redox potential, electrical conductivity, and pH were measured by handheld probes.
2.2.5 Retardation (RD) and sorption/partitioning/distribution (KD) coefficient calculations
The retardation coefficient (RD) is essentially the ratio of the velocity of the water front (νw) and velocity of the Hg front delayed by sorption processes (νHg) moving through the columns (Eq. 1). Since the path of the soluble pollutant (Hg) and water are the same, transport time can be determined based on the time it takes the fronts to pass through the columns (tHg and tw, respectively). NaCl breakthrough curve was used as a proxy for water based on the assumption that it is a conservative tracer. Times tHg and tw are given when the respective ratios of the NaCl and THg concentrations in the eluate are equal to half the input concentration (stock solution; ) (Patterson et al., 1993; Reichert, 1991; Schnaar and Brusseau, 2013).
RD is related to the sorption, partitioning, or distribution coefficient (KD; mL g−1) according to Eqs. (2) and (3) (USEPA, 2004):
where ne is the effective porosity (EXP1: 0.470 ± 0.008, n=3; EXP2: 0.459 ± 0.004, n=3; assumed to be equal to total porosity), which is the ratio of the column pore volume (EXP1: 23.3 ± 0.5 mL, n=3; EXP1: 22.5 ± 0.1 mL, n=3) to the total volume of the solid-phase materials of the columns (EXP1: 49.7 ± 0.3 mL, n=3; EXP2: 49.0 ± 0.5 mL, n=3). RD could only be calculated for columns that went to equilibrium and desorption (not 50 % breakthrough). ne was calculated for columns that went through desorption (C1.1–C1.3 and C2.1–C2.3); hence, KD was only calculated for these columns. Note that the pore volumes reported above are the data used when reporting the number of pore volumes.
2.3 Quality assurance and quality control (QAQC)
For liquid-phase analyses, a 140.8 ng L−1 Hg(II) stock solution (Sigma-Aldrich) was measured throughout the analyses, and recovery was 99 ± 5 % (n=250). For solid-phase analyses, Chinese soil (NCS DC73030; Chinese National Analysis Centre for Iron and Steel) was measured, and recovery was 101 ± 6 % (n=16). The accuracy and precision of Hg stable isotope measurements were assessed using the in-house “ETH Fluka” standard. Mean values across the measurement sessions were the following: δ202Hg = −1.42 ± 0.08 ‰; Δ199Hg = 0.08 ‰; Δ200Hg = 0.02 ± 0.02 ‰; Δ201Hg = 0.03 ± 0.03 ‰; Δ204Hg = −0.01 ± 0.06 ‰ (n=26; all uncertainty values are reported as 2 SD). All uncertainties are 1 SD, unless otherwise reported (i.e. 2 SD used to report Hg stable isotope analysis uncertainty). These values are within the range of other studies (i.e. Obrist et al., 2017; Goix et al., 2019; McLagan et al., 2022). Theoretical solid-phase THg concentrations (compared to measured THg concentrations) are determined via mass balance of liquid-phase THg concentrations of stock solution and eluate and the volume of stock solution applied to the columns. All statistical tests and sorption fitting comparisons were performed in OriginPro 2018 (Origin Lab Corporation).
3.1 Sorption and desorption behaviour of mercury in column experiments
3.1.1 Sorption
As expected, the uptake of the HgCl2 solution to the solid-phase aquifer materials followed an S-shaped breakthrough curve best described by a Freundlich function (Fig. 2; note that these are empirically fitted functions). Initially, >99.9 % of the Hg in solution was sorbed to the solid-phase materials and 1.0–1.3 L (43–55 pore volumes) and 0.3–0.45 L (13–16 pore volumes), in EXP1 and EXP2, respectively, was required to reach eluate THg concentrations equivalent to 1 % of stock solution (Sect. S5). This was followed by a phase of rapid increase in the eluate concentrations (decreasing fraction of the Hg in solution sorbing to the solid phase). Finally, the increase in eluate THg concentration slowed as it approached the upper asymptotic bound of the original stock solution concentration in each experiment and equilibrium of Hg fluxes between the solid and liquid phases was approached/reached. EXP1 likely did not completely reach a stable equilibrium point (eluate concentration was at ≈91 % of stock solution concentration when the stock solution was changed to water), and more time or volume of solution was required. This would have required the creation of more stock solution; instead, green chemistry prevailed, and the choice was made to move onto the desorption phase with consideration of the higher concentration (faster) follow-up EXP2.
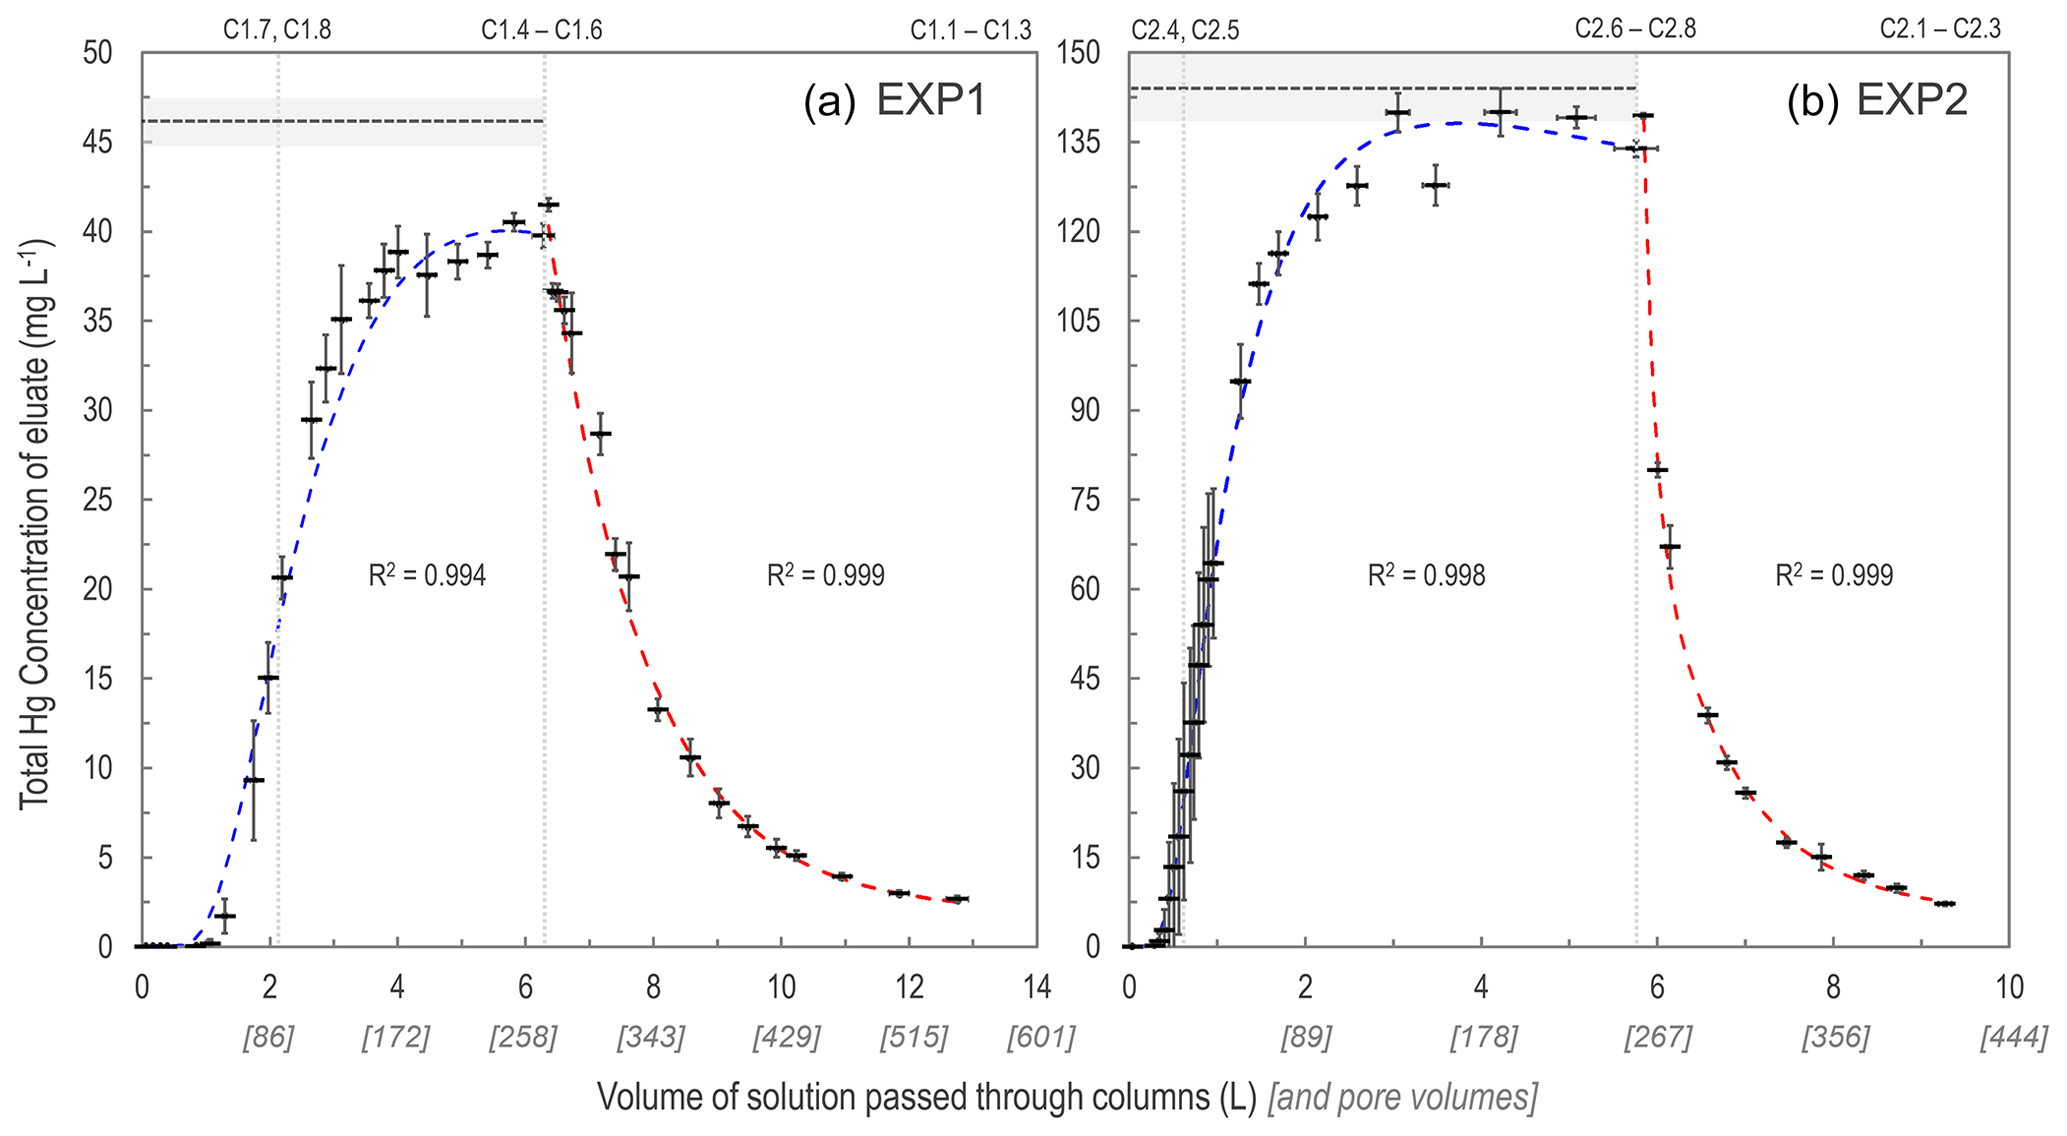
Figure 2Total Hg concentration eluate breakthrough curves for low- (EXP1; a) and high-concentration (EXP2; b) stock solution experiments. Horizontal dashed lines (mean) and shaded area (1 SD) indicate the original stock solution concentrations in each experiment, and vertical dotted lines indicate column removal points (column IDs above panels indicate which columns were removed). Uncertainty in the x axis relates to the differing volumes passed through individual columns at each sampling period. Sorption curves were fitted with Freundlich functions (blue dashed lines), and desorption curves were fitted with exponential decay functions (red dashed lines). These functions were empirically (not mechanistically) fitted to the data as these plots are not sorption isotherms (see Sect. S6 for details of fitting functions).
This S-shaped sorption behaviour was similar to the one other detailed study on Hg sorption in natural soils with sufficient liquid-phase sampling frequency to create column breakthrough curves on OM-rich (9.4–24.7 % OM) Amazonian soils and similar stock solution concentrations (60–120 mg L−1; Miretzky et al., 2005). Semi-quantitative liquid-phase Hg speciation analyses confirm that the majority of Hg was dissolved as inorganic Hg(II) (EXP1: 83 ± 6 %; EXP2: 77 ± 8 %), a fraction of which will be soluble HgCl2 (species used to generate stock solution), but also as fractions of hydrolysed species (i.e. HgClOH, Hg(OH)2, [HgCl3]−) formed in solution at pH in the observed range (7.7–8.1) of these experiments (Delnomdedieu et al., 1992; Gunneriusson and Sjöberg, 1992; Kim et al., 2004; see also Sect. S10 for theoretical Hg speciation results using Visual MINTEQ v3.1). These liquid-phase Hg speciation results are similar to those reported for groundwater samples previously collected at the contaminated site where these materials were extracted from (Bollen et al., 2008; Richard et al., 2016a; McLagan et al., 2022).
Despite the very low-OM content (Table 1) within these solid-phase aquifer materials, the equilibrium uptake capacity was very high in both experiments. These concentrations were determined both (i) analytically by solid-phase THg analyses and (ii) theoretically, based on the inverse of the breakthrough curve integral: the area above the curve and below the stock solution concentration. This has been referred to as “holdup” (H; mg of Hg) (Van Genuchten and Parker, 1984) and is described in Eq. (4):
where Ce is the eluate THg concentration (mg L−1), C0 is the stock solution THg concentration (mg L−1), and Vf is the accumulated solution volume that has passed through the columns at the point they were removed (L). Theoretical concentrations reached 1880 ± 20 mg kg−1 in EXP1 and 2810 ± 40 mg kg−1 in EXP2 (Table 2; Sect. S3). These data are directly comparable and indeed within the same range as the theoretical solid-phase concentrations calculated by Miretzky et al. (2005) for the OM-rich Amazonian soils (THg concentrations: 950–3960 mg kg−1). The elevated Hg sorption observed by Miretzky et al. (2005) is to be expected due to the affinity of Hg for OM (e.g. Yin et al. 1996; Jiskra et al., 2015; Manceau and Nagy, 2019). Nonetheless, Miretzky et al. (2005) found their calculated solid-phase THg concentrations at equilibrium (sorptive capacity of the soils) were greater when OM % + clay % was considered rather than OM % alone (Miretzky et al., 2005), which highlights the potential role clay (and oxide) minerals can play in Hg sorption to solid-phase soil or aquifer materials.
Hg sorption to OM has been observed to increase at lower pH (Andersson, 1979; Yin et al., 1996). However, the opposite has been reported for sorption of Hg to clay minerals: in neutral and slightly basic soils, the sorption capacity is controlled by the mineral components (Andersson, 1979; Schuster, 1991; Gabriel and Williamson, 2004). Indeed, the pH range of the eluate and stock solution (pH range: 7.7–8.1) present ideal conditions for Hg sorption to clay minerals and Fe and Mn (oxy)hydroxide minerals. Hg sorption to these inorganic minerals becomes more likely in our experiments, considering the very low-OM content of the solid-phase materials (Table 1). Haitzer et al. (2002) estimated that at ratios of THg-to-OM above 1 µg of Hg per milligram of OM, the strong thiol-group bonding sites for Hg within OM are saturated. Based on the TOC data of these solid-phase materials (assuming 0.16 % TOC = 0.32 % OM), there would be 224 mg of OM within a column. To surpass the ratio of 1 µg of Hg per milligram of OM, only 4.9 and 1.6 mL of stock solution or 0.21 and 0.07 pore volumes in EXP1 and EXP2, respectively, would need to be added to the columns to saturate the strong thiol-group binding sites with Hg. Considering that Hg breakthrough occurred only after about 50 and 15 pore volumes in EXP1 and EXP2, respectively, it can be assumed that not only the strong Hg-binding thiol groups but also the other less strong Hg-binding functional groups (e.g. carboxyl groups) of the small OM pool in the columns were fully saturated early in the experiments. Hence, solid-phase sorption of Hg within these experiments was dominated by interactions with inorganic minerals. The role of such inorganic minerals was also highlighted in one of the few studies that exist examining Hg transport and fate in aquifers (Lamborg et al., 2013).
Table 2Theoretical (liquid-phase THg mass balance) and measured solid-phase THg concentrations and recovery of the measured-to-expected (theoretical) concentrations for each of the columns in EXP1 and EXP2.
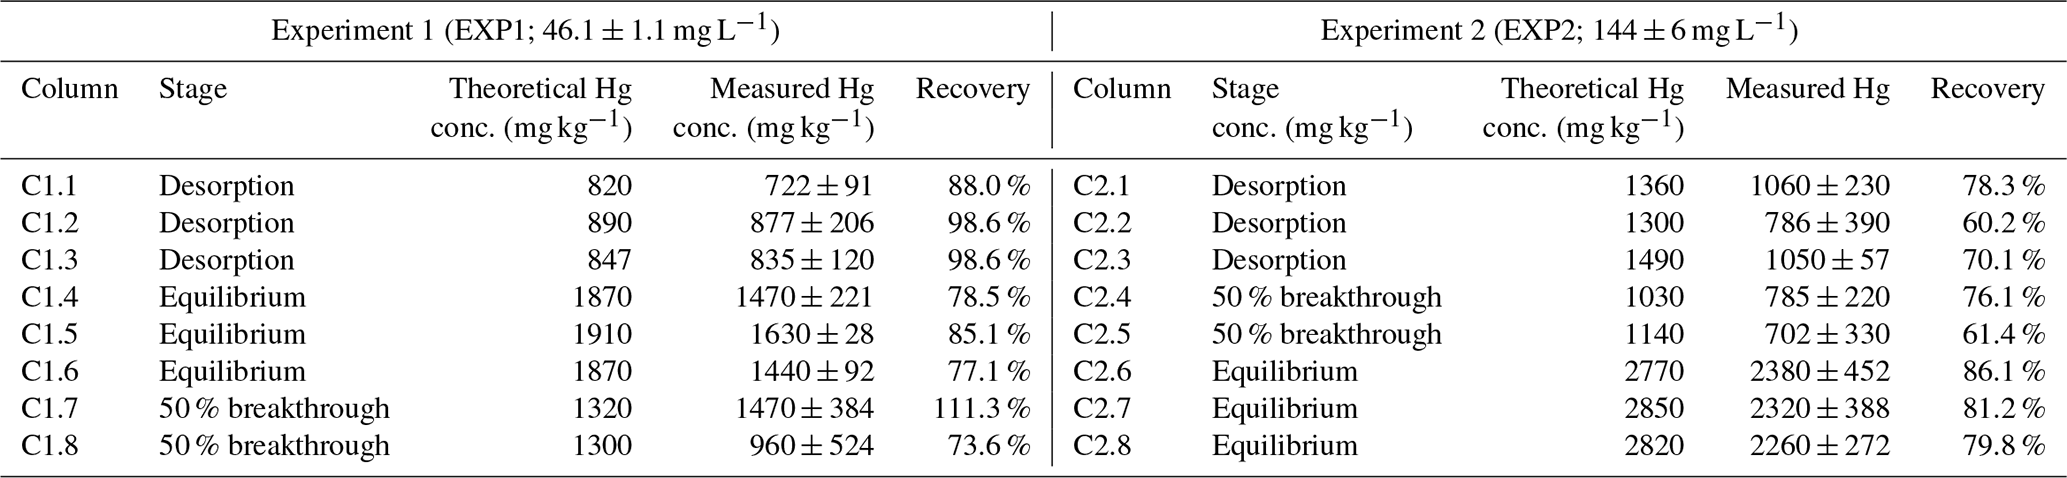
Measured THg concentrations were typically lower than the theoretical calculated values (Table 2), and contaminant masses can be difficult to balance in contaminant batch and column experiments (Van Genuchten and Parker, 1984; Hebig et al., 2014). This is of particular concern for a contaminant such as Hg, whose stability and contamination issues have been widely studied due to the capacity of different Hg species to sorb to and diffuse through plastic polymers (at differing rates) (Hall et al., 2002; Parker and Bloom, 2005; Hammerschmidt et al., 2011). Loss of a fraction of the THg in solution to/through tubing and the walls of the column is likely contributing to the lower recovery in some of these samples. Other factors that could be contributing to the differences between the theoretical and measured concentrations are heterogeneity of the solid phase and solid-phase sample extraction (particularly during movement of the Hg mass transfer front), loss of Hg from the solid phase before sample extraction and analyses (particularly for volatile Hg(0); Parker and Bloom, 2005), and inherent analytical uncertainties. The heterogeneity of the materials is emphasized by the absence of trends in THg concentrations within the sections of the columns, even for the columns undergoing movement of the mass transfer zone (see Sect. S8). Unfortunately, Miretzky et al. (2005) did not provide total sampling volumes for their experiments, and no assessment of measured THg recoveries was (or can be) made for direct comparison to our recovery data.
3.1.2 Desorption
The desorption phase of both EXP1 and EXP2 followed an exponential decay model; results confirm that sorption is (partially) reversible and initially rapid (Fig. 2). After the stock solution was switched to water for the desorption phase, the eluate solution reached <50 % of the stock solution THg concentration with additions of ≈1 L (≈43 pore volumes) and ≈0.5 L (≈22 pore volumes) of solution in EXP1 and EXP2, respectively (Fig. 2). At the termination of the experiments, eluate THg concentrations dropped to <10 % of the original stock solution (Fig. 2). While it is evident that more Hg would have been released if desorption was permitted to proceed further (terminated due to time and to prevent excess contaminated waste solution), measured data indicated that 46 ± 6 % (theoretical: 55 ± 2 %) in EXP1 and 58 ± 10 % (theoretical: 51 ± 4 %) in EXP2 of THg could be extracted from the solid-phase materials before the experiments were terminated. Evidence from the contaminated aquifer where these solid-phase materials were extracted suggests that the retention of a fraction of this Hg within the solid-phase materials is long-term (Bollen et al., 2008; McLagan et al., 2022). McLagan et al. (2022) reported that elevated solid- (up to 562 mg kg−1) and liquid-phase (up to 164 ± 75.4 µg L−1) THg concentrations are still found at the site to the present day, more than 55 years since the industrial use of Hg (kyanization) at the site ceased.
McLagan et al. (2022) associated this residual retention of Hg to the diffusion of Hg into the mineral matrix or secondary transformation to a more stable (and less-soluble) Hg(II) species (McLagan et al., 2022). Previous work agrees that sorption and subsequent release of Hg to/from solid-phase soils and solid-phase materials is likely controlled by multiple processes (Yin et al., 1997; Bradl, 2004; Reis et al., 2016). The more easily extractable Hg is likely to be associated with Fe and Mn (oxy)hydroxide and clay minerals through outer-sphere complexes that form through cation exchange and electrostatic intermolecular forces (Bradl, 2004; Reis et al., 2016). Over time, some of the Hg associated through these weaker surface interactions will diffuse into the matrix and/or form inner-sphere complexes; both processes slow the release of the sorbed Hg (Bradl, 2004; Reis et al., 2016). Similar results were observed by Miretzky et al. (2005) in the OM-rich Amazonian soil columns with 27 %–38 % of Hg sorbed to the solid-phase materials being rapidly redissolved in the initial desorption phase. However, the soils with higher OM content showed stronger hysteresis, and considerably less Hg was released during the second phase of desorption (Miretzky et al., 2005) than in our low-OM solid-phase materials, suggesting stronger interactions of inner-sphere complexed Hg with OM; these results are supported by work done in other studies examining Hg sorption to solid-phase materials (Yin et al., 1996; Reis et al., 2016).
3.1.3 Insights from stable Hg isotopes
Variations in δ202Hg values, describing MDF of Hg isotopes, were observed in both the liquid and solid phases across the experiments (Fig. 3; Sects. S7, S8). During the initial phase of the experiments (before eluate breakthrough), transfer of Hg from the applied stock solution (δ202Hg: −0.61 ± 0.01 ‰ relative to NIST-3133, 1 SD; n=3) to the solid-phase materials is complete. When there is complete transfer of a pool of Hg from reactants to products, there is complete transfer of stable isotopes; hence, no fractionation can be observed.
Once Hg breakthrough begins to occur within the columns, the eluate is initially enriched in heavy isotopes associated with the preferential transfer (sorption) of lighter isotopes to the solid-phase materials (Jiskra et al., 2012; Wiederhold, 2015), with heavier isotopes retained in solution (passed into the eluate). In all three of the EXP2 columns examined for stable isotopes in the liquid phase, the first two liquid-phase stable isotope samples (sampled just after ≈50 % breakthrough column removals) had more positive δ202Hg values than the remaining liquid-phase samples (Fig. 3). However, it is also apparent that at ≈50 % breakthrough there was little MDF imparted on the solid-phase materials compared to the stock solution (Fig. 3). This ostensibly contrasting finding (observable positive MDF in the liquid phase and little negative MDF in the solid phase) can be explained by the proportion of Hg transferred to the solid phase of the total mass added in solution. At the 50 % breakthrough column removal, the proportion of Hg sorbed by the columns was 95.4 % and 90.4 %, respectively, for C1.7 and C1.8 (EXP1) and 83.8 % and 88.5 %, respectively, for C2.4 and C2.5 (EXP2; based on theoretical calculations). The majority of this sorption occurred during the complete (or near-complete) transfer of isotopes before (or just after) eluate breakthrough. Hence, the MDF that began to occur after breakthrough (observable in the early liquid-phase eluate samples) had little influence on the Hg stable isotope ratios of the solid-phase materials of columns removed at the ≈50 % breakthrough point.
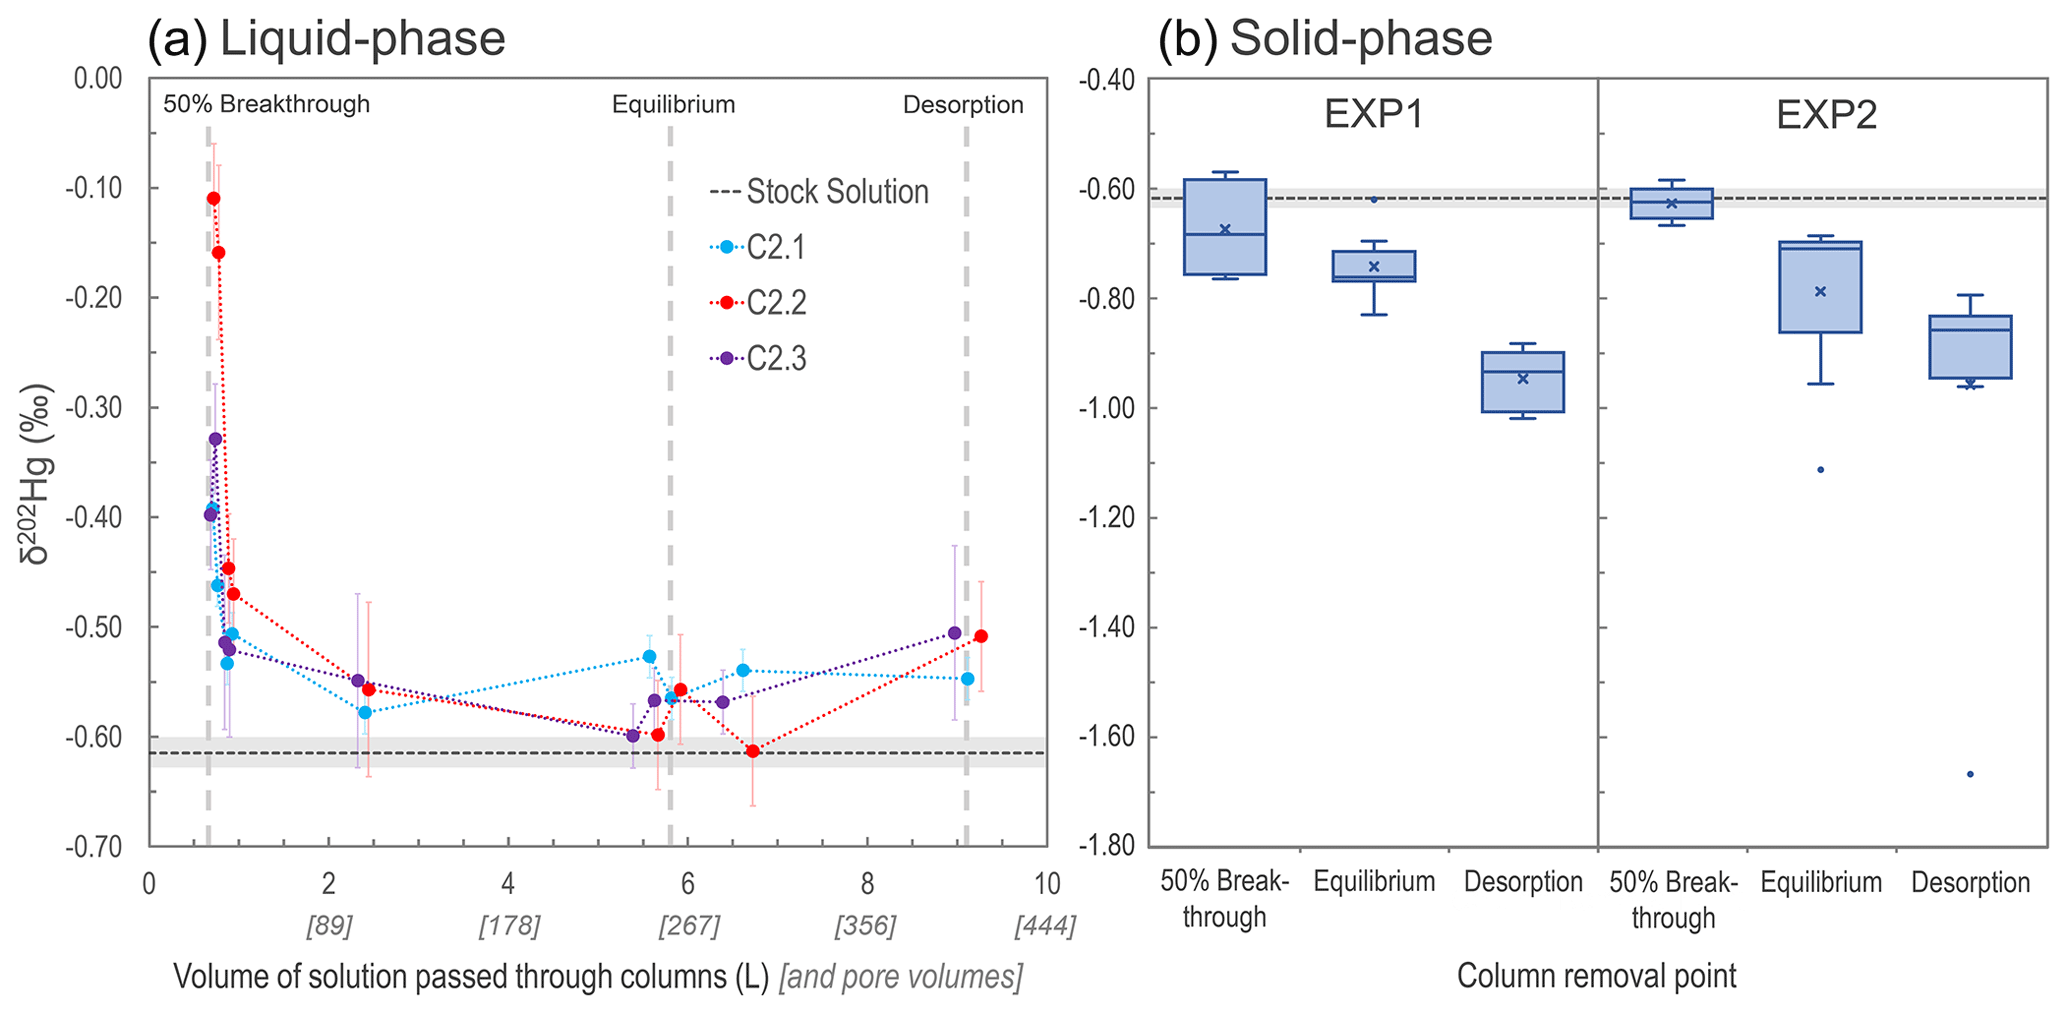
Figure 3Development of liquid-phase δ202Hg values for columns C2.1–C2.3 measured at nine intervals during EXP2 (a). Box plots of solid-phase δ202Hg values measured in both EXP1 and EXP2 (“x” denotes mean values; dots denote outliers) (b). In both panels, the grey dashed line represents the mean δ202Hg value (light grey rectangle: 1 SD) measured for the stock solution. Note that the vertical grey dashed lines indicating solid-phase column removal points in the left panel are only approximations as the liquid-phase stable isotope measurements were only made on columns C2.1–2.3 that proceeded until the end of desorption.
This finding of limited MDF on solid-phase materials at ≈50 % breakthrough is consistent with the δ202Hg values observed within the column layers. The bottom layers of C1.7 (δ202Hg: −0.76 ± 0.07 ‰) and C1.8 (δ202Hg: −0.75 ± 0.07 ‰) in EXP1 were more negative than the stock solution, while the top layers (δ202Hg: −0.57 ± 0.15 ‰ and δ202Hg: −0.59 ± 0.07 ‰ for C1.7 and C1.8, respectively) were equivalent to the stock solution (Sect. S8). These data suggest that observable MDF was beginning to occur in the part of the column exposed to the Hg front (bottom) for the longest time. The same was not the case in EXP2 (no observable trend in δ202Hg between layers; Sect. S8). We attribute this to the more elevated THg concentrations and faster movement of the Hg front moving through the columns (see Table 3 below) in EXP2, overwhelming the layering MDF observed in EXP1.
As sorption progresses to equilibrium, we observe a negative shift in the eluate δ202Hg value of all three columns falling in the range of ‰ to −0.5 ‰, which is slightly more positive than the stock solution (δ202Hg: −0.61 ± 0.01 ‰ 1 SD; ± 0.08 ‰ analytical 2 SD; Fig. 3). During this transition in the Hg uptake process, the net effect is that most, and then essentially all, Hg input from the stock solution is passing through the columns and into the eluate, and any kinetic MDF occurring would be limited. Nonetheless, equilibrium-based isotope exchange would also drive lighter isotopes into the solid-phase materials (Wiederhold et al., 2010; Jiskra et al., 2012; Wiederhold, 2015), which is the likely explanation for the liquid-phase δ202Hg values remaining slightly more positive than the stock solution. While the impact of this MDF on the continuously flowing eluate is small when the system is at equilibrium, the effect of this equilibrium-based MDF on the solid phase is more manifest as its effect is cumulative. Over time, more and more lighter isotopes preferentially sorb to the solid phase; hence, the mean δ202Hg values of the solid-phase materials in EXP1 (δ202Hg: 0.74 ± 0.06 ‰ 1 SD) and EXP2 (δ202Hg: −0.79 ± 0.15 ‰ 1 SD) at the end of the sorption experiments (at or near column equilibrium) are more negative than the stock solution (and solid-phase materials at ≈50 % breakthrough). Thus, we suggest equilibrium-based MDF (with some potential for kinetic MDF contributions) to be the primary driver of the more negative δ202Hg values observed in the solid-phase materials at the end of the equilibrium phase of the experiments. These observations agree with the observed results of McLagan et al. (2022) sampled within the contaminated aquifer adjacent from which these uncontaminated materials were derived.
At the end of the desorption phase, the solid-phase materials have undergone further MDF to more negative δ202Hg values (EXP1 δ202Hg: −0.95 ± 0.05 ‰; EXP2 δ202Hg: −0.96 ± 0.27 ‰ 1 SD). Two of the three columns monitored for liquid-phase stable isotopes at the end of desorption also show a slight positive MDF shift, and values for all three columns are slightly more positive (δ202Hg: −0.55 ‰ to −0.51 ‰) than the stock solution (Fig. 3). As discussed, desorption proceeds via a two-step mechanism: a rapid initial desorption as easily exchangeable, outer-sphere complexed Hg is released, followed by a slower phase of desorption as this easily exchangeable pool depletes. Brocza et al. (2019) and McLagan et al. (2022) suggest that this easily exchangeable pool is enriched in heavier isotopes compared to the fraction that diffuses into the mineral matrix or transforms to more stable, less-soluble Hg(II) species as these secondary processes favour lighter isotopes. Thus, removal of the heavy-isotope-enriched, easily exchangeable pool of Hg is the likely driver of more negative δ202Hg values in the solid-phase materials after desorption. While Demers et al. (2018) studied predominantly surface water samples linked to Hg soil–groundwater contamination at a site in Tennessee, USA (industrial use of Hg(0)), they did observe more positive δ202Hg values with elevated dissolved THg concentrations values in samples from the hyporheic zone associated with exfiltrating groundwater from the contaminated areas. These data would agree with the more positive liquid-phase δ202Hg values observed in our study and by McLagan et al. (2022).
Variation in both odd- and even-isotope MIF was within the range of analytical uncertainties (Sects. S7, S8). McLagan et al. (2022) did observe a small variation in Δ199Hg between solid and liquid phases, which the authors suggest may be linked to MIF driven by dark abiotic reduction of Hg(II) (Zheng and Hintelmann, 2010). However, it is unlikely that this process could manifest into an observable change in Δ199Hg, considering the short duration of these experiments, even if the process could occur at all within these columns.
3.2 Is reduction of Hg(II) to Hg(0) occurring within the columns?
Reduction of Hg(II) to Hg(0) has been observed previously at this and other sites impacted by kyanization activities (Bollen et al., 2008; Richard et al., 2016a, b; McLagan et al., 2022). In these subsurface environments with low-OM and very high THg concentrations, this secondary Hg(0) production has been linked to abiotic (hydr)oxide mineral surface catalysed reactions driven by other redox-active metals (Bollen et al., 2008; Richard et al., 2016a, b; Schwab et al., 2023). Since HgCl2 solution was the only form of Hg applied in the column experiments; the presence of Hg(0) in either the liquid or solid phases must be explained via reduction of Hg(II).
To examine the presence of Hg(0), PTD analyses were run on the (undried) solid-phase materials from the columns after the sorption experiments. The PTD extinction curves showed little variation across all sections of all columns from either experiment (see Sect. S9). All curves mimic the low-sample-weight (≈0.1 g) mean extinction curves displayed in Fig. 4 and are dominated by a single peak with a maximum release of ≈225 ∘C, which aligns with the maximum extinction of the HgCl2 standard in silicon dioxide (SiO2). This supports the hypothesis of direct (outer-sphere) complexation or electrostatic interaction of dissolved Hg(II) species to the mineral surfaces posited previously (Bradl, 2004; Reis et al., 2016) and by McLagan et al. (2022). Nonetheless, these low sample weight PTD curves were indicative of some qualitative evidence of very small peaks at <175 ∘C (Sect. S9); peaks in this range are associated with Hg(0) (Biester and Scholz, 1996; McLagan et al., 2022). The initial sample masses used in the PTD analyses were low (≈0.1 g) so as to not overwhelm the AAS detector, release large amounts of gas-phase Hg(0), or potentially cause memory effects in future analyses. Nevertheless, this would not occur if sample masses were increased (≈2.0 g) and the temperature ramp stopped at ≈175 ∘C. When the solid-phase materials were analysed in this manner, Hg(0) peaks were detected across all sections of all columns in both experiments (see Sect. S9; Fig. 4).
Additionally, detectable concentrations of Hg(0) were observed across all of the semi-quantitative liquid-phase Hg speciation analyses and elevated above the Hg(0) concentrations measured in the stock solution (Sect. S4). The observed liquid-phase fraction of Hg(0) was highest at the ≈25 % breakthrough sample collection point in EXP1 (0.7 %) and EXP2 (0.1 %) with the fraction being ≤0.1 % in all other samples (Sect. S4). While these data suggest that reduction of Hg(II) to Hg(0) begins almost immediately after the introduction of the HgCl2 solution, we link the declining proportion of Hg(0) to the low solubility of Hg(0) (≈50 µg L−1) (Skyllberg, 2012; Brocza et al., 2019), which was already reached at the ≈25 % breakthrough sample collection point in both experiments.
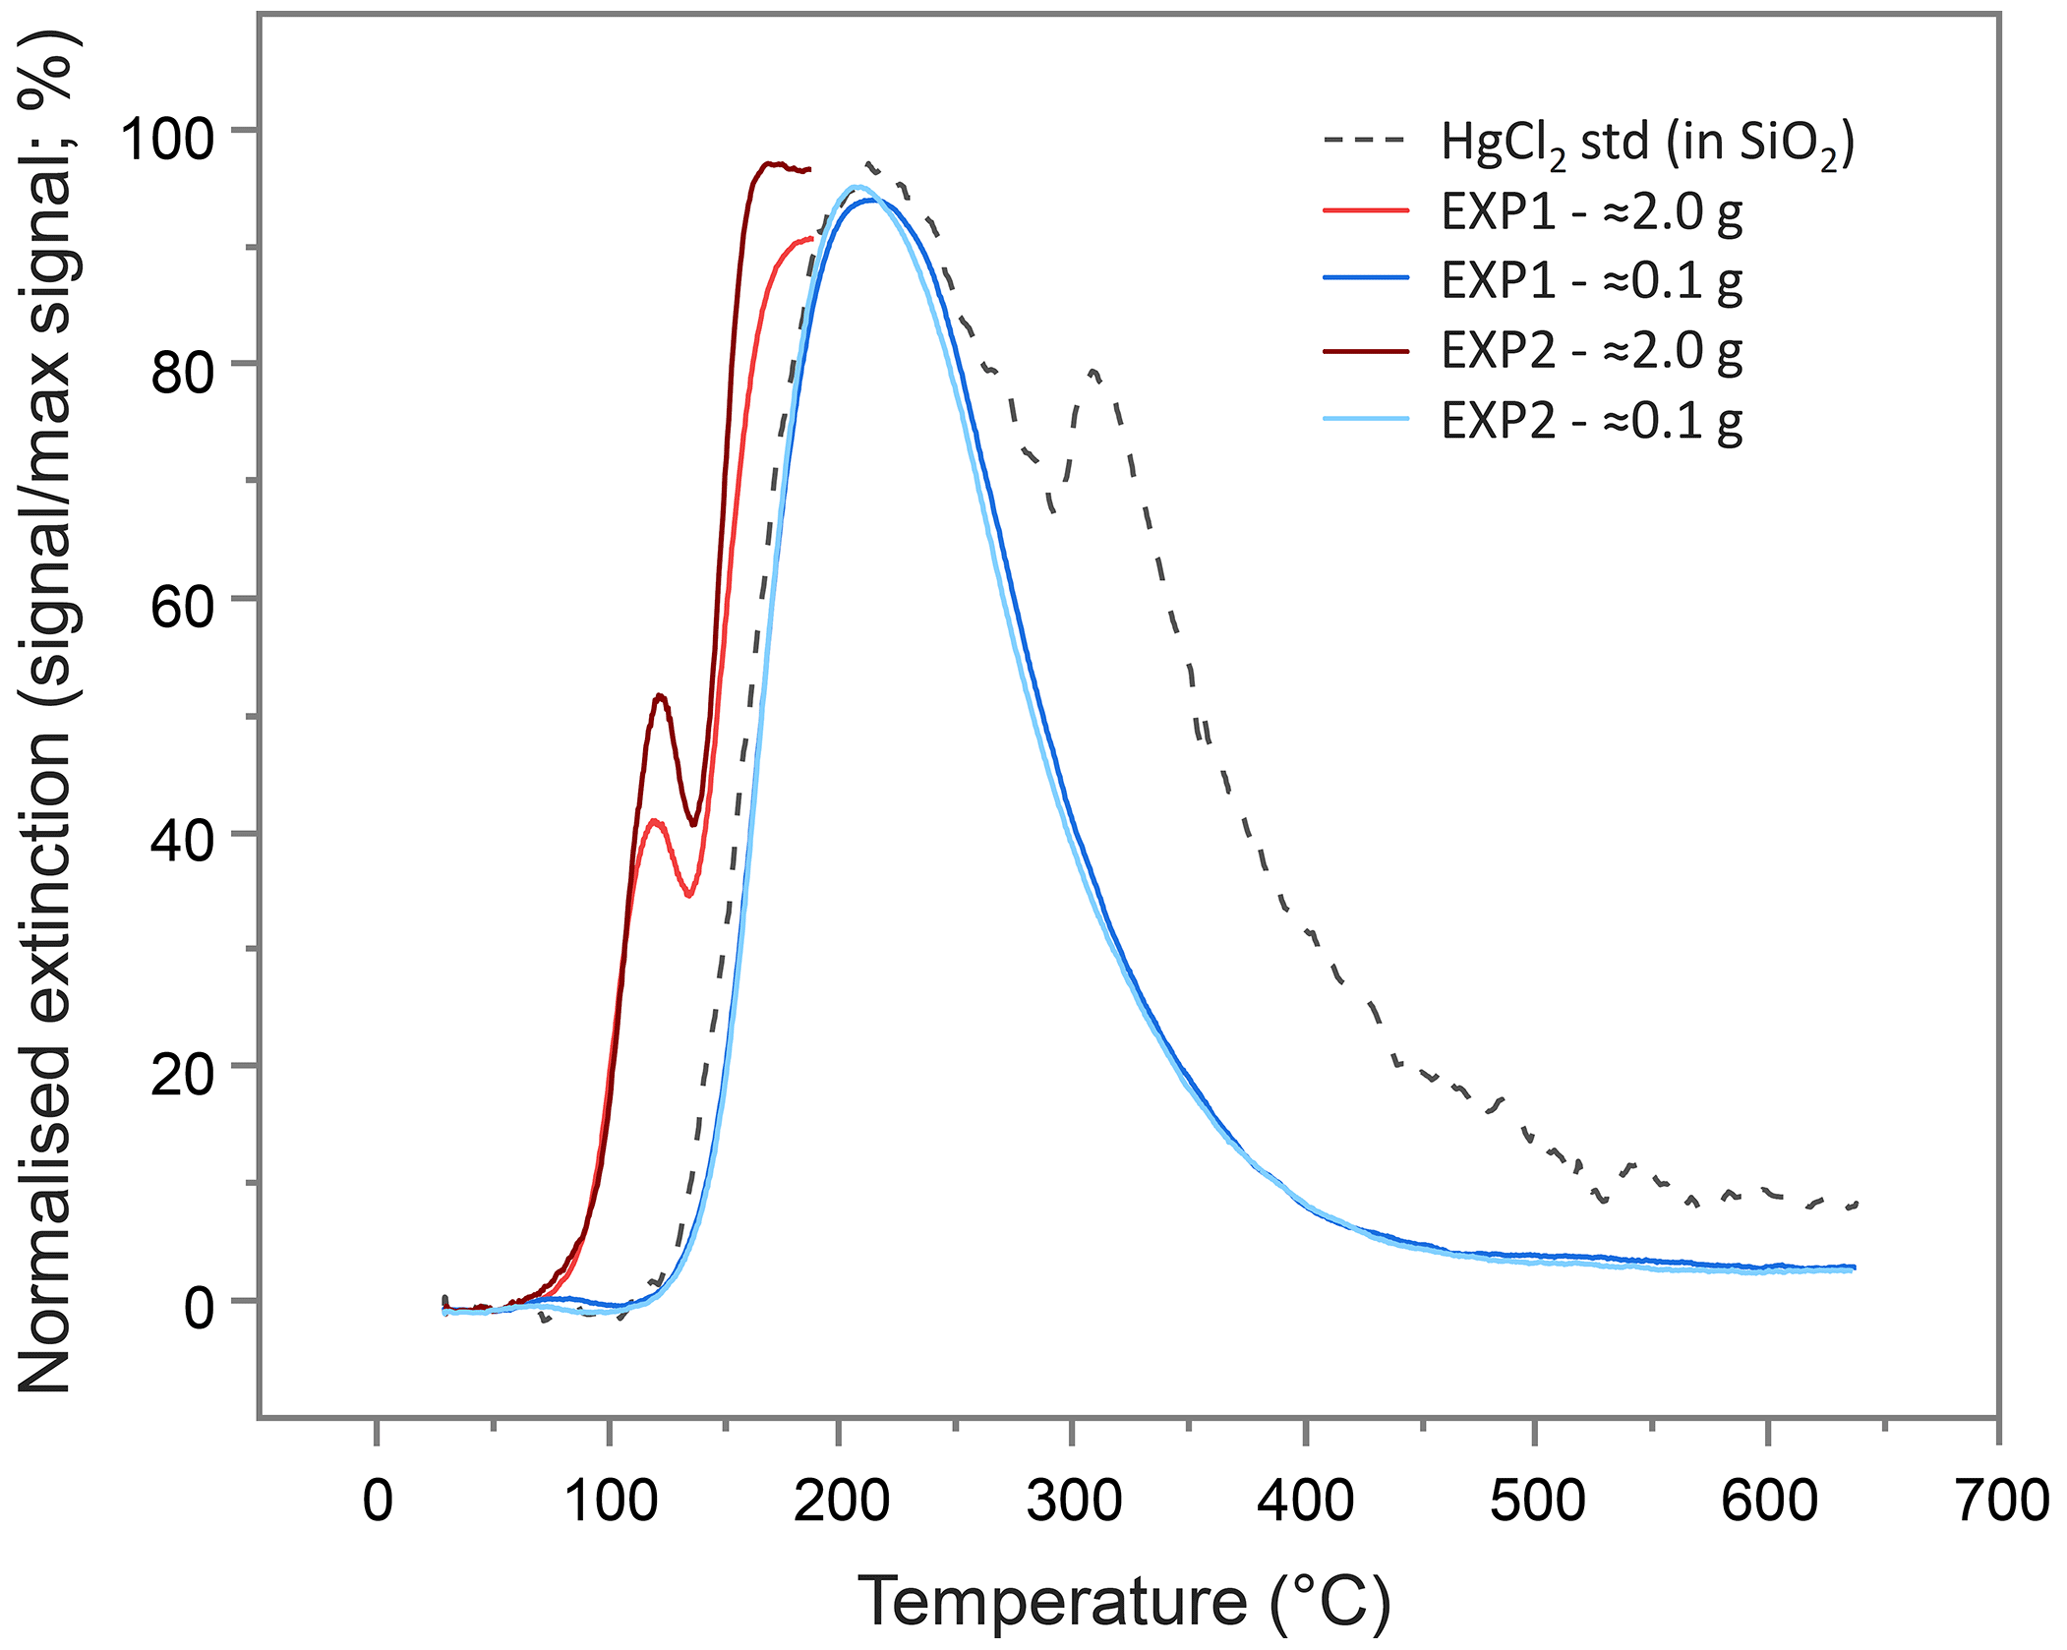
Figure 4Mean pyrolytic thermal desorption (PTD) extinction curves from solid-phase materials from EXP1 and EXP2 assessed with two different sample masses. Analyses of the larger sample mass (≈2.0 g of material) were terminated when the temperature ramp reached ≈175 ∘C to prevent excessive gas-phase Hg release and potential memory effects on the instrument.
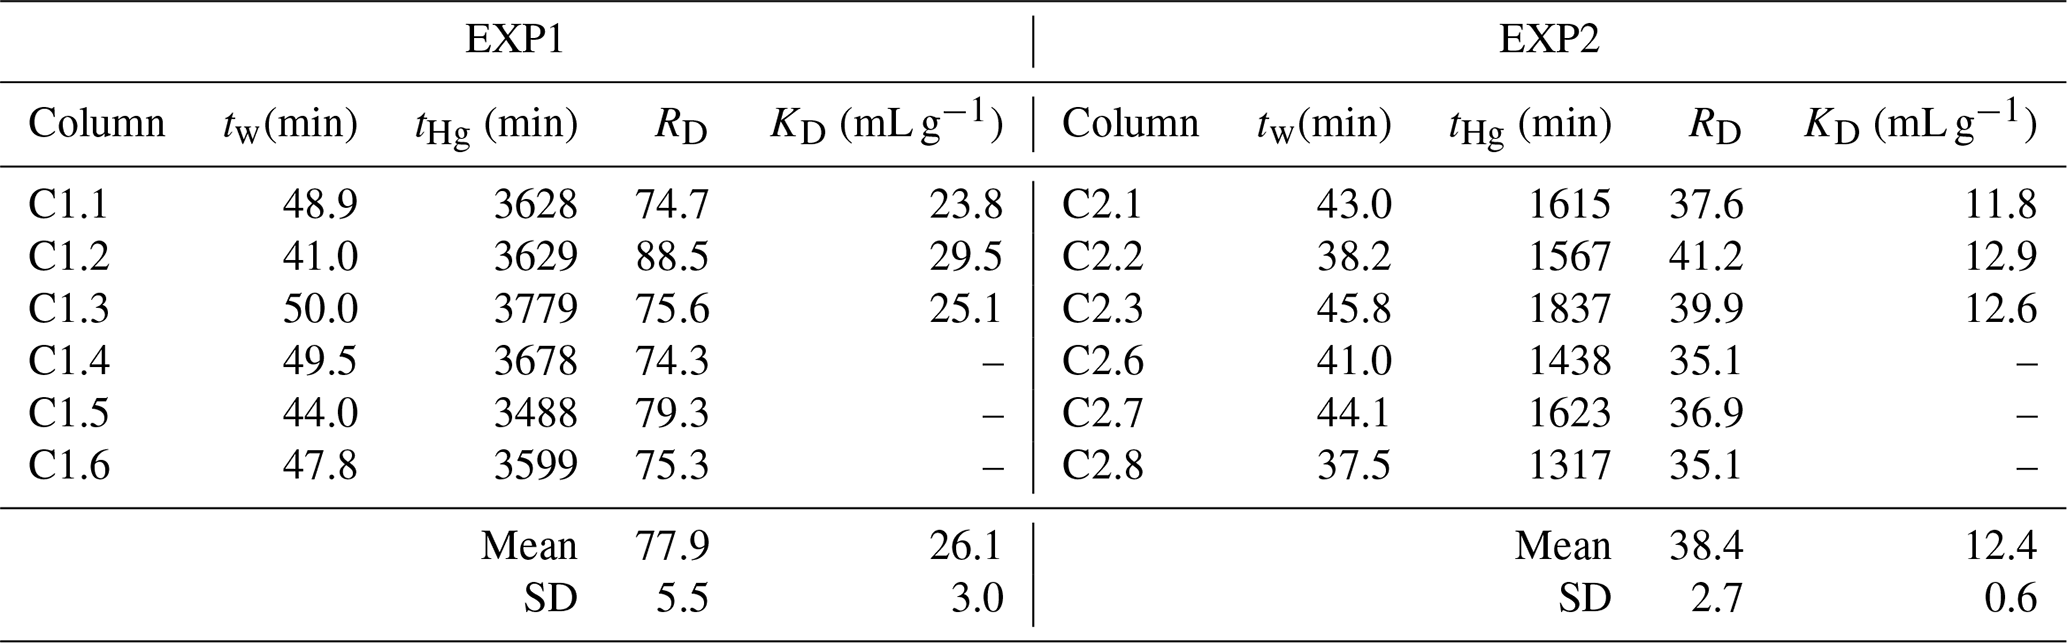
Table 3Calculated retardation (RD) and sorption (KD) coefficients for EXP1 and EXP2 (definitions are given in Sect. 2.2.5).
RD values can be calculated from Miretzky et al. (2005) based on the inverse of their value, and the mean of these derived RD values is 48 ± 13 for the high-OM Amazonian soils. This again affirms the high sorptive capacity of our low-OM solid-phase aquifer materials at these comparative concentration HgCl2 applications. Lamborg et al. (2013) calculated KD values for a Hg-contaminated (from wastewater treatment) aquifer between 100 and 6300 mL g−1 (log KD: 2–3.8), yet calculations had to assume liquid-phase concentrations from other studies. The log KD values calculated from soil and sediment batch experiments typically range from ≈2 in lower-OM materials (Akcay et al., 1996) up to ≈6 in higher-OM materials (Lyon et al., 1997). The logical next step is to utilize the measured RD and KD data from our study to perform soil–groundwater modelling to better understand Hg transport in this and other soil–groundwater systems as there are no previous estimates of RD and KD values based on measured data for low-OM solid-phase aquifer materials. The range of coefficient values from ours and other studies described above relating to differing solid-phase properties, input solution speciation, and assumptions used highlights the caution that should be made when applying these values to other systems as RD and KD values tend to be highly site specific (USEPA, 2004).
These measured Hg(0) fractions in solid- and liquid-phase analyses provide further direct evidence of Hg(0) production under saturated, oxic conditions in low-OM solid-phase materials. Hg(0) production in these contaminated aquifers has been linked to the slower-than-expected horizontal progress of the plume of Hg in the aquifer at the site where this contamination occurred (Bollen et al., 2008; Richard et al., 2016a, b; McLagan et al., 2022). While these data indicate that the fraction of Hg(0) produced is relatively small, the volume of soil and aquifer materials in which this process can occur is large. The contamination plume of the aquifer at the site where the solid-phase materials were removed from is ≈1000 m long and covers an area of m2 (Bollen et al., 2008; McLagan et al., 2022). If we assume conservative values for mean depth of contamination of 2 m (aquifer ≈3–4 m depth; Bollen et al., 2008; McLagan et al., 2022), mean THg concentration of 2 mg kg−1 (solid-phase THg concentration of 2–162 mg kg−1 along the contaminated aquifer; Bollen et al., 2008), the fraction of Hg(0) produced per day is 0.01 %–0.001 % of the THg (based on 0.1 % Hg(0) peak integration of total peak area of mean PTD curve from EXP2; see Sect. S9), and the same bulk density and flow rates as in our experiments, we can produce a back-of-an-envelope estimate of the mass of Hg(0) produced and potentially lost from the aquifer to overlying soils. Based on these numbers, we estimate that 0.3–0.4 g of Hg(II) is transformed to Hg(0) each day within the aquifer of the contaminated site in southern Germany; over the course of 1 year, this equates to the transformation of ≈5–15 kg of Hg(II) to Hg(0). Even a relatively conservative estimate of the conversion (and potential loss) of this mass of Hg(II) in contaminated aquifers such as this provides strong evidence that the process of Hg(II) reduction plays a key role in limiting the transport of the 10–20 t of Hg that was added to this soil–groundwater system in the ≈120 years since industrial operations commenced.
3.3 Retardation (RD) and sorption coefficient (KD) calculations
As expected, RD values were substantially greater than 1, confirming substantial interaction between the applied HgCl2 solution and the solid-phase aquifer materials (Table 3). The difference in RD and KD values between EXP1 and EXP2 (Table 3) indicate that stock solution concentration is a factor in the transport of mercury within these columns. The elevated stock solution concentrations may be undermining the assumption of equal accessibility to sorption sites (USEPA, 2004). However, the purpose of these experiments was to simulate the original contamination by the industrial (mis)use of HgCl2 solution, and while we can only estimate the original concentration of solution being transported through the soil–groundwater system, we do expect they were very high due to the extent (both in terms of elevated concentrations and longitudinal and transverse dispersion of the contamination plume) of contamination that remains and the very high concentration of the solution used in rot-prevention treatment of timber (Bollen et al., 2008; Richard et al., 2016a; McLagan et al., 2022). Considering the high concentrations of Hg that have been observed within this and other Hg-contaminated aquifers (Katsenovich et al., 2010; Lamborg et al., 2013; Demers et al., 2018), it is critical that we do not isolate our study of Hg transport dynamics to low concentration experiments that meet assumptions for theoretical sorption (batch and column) experiments.
All data used within this study are available within this publication and the associated supplement. For any additional request please contact the corresponding author.
The supplement related to this article is available online at: https://doi.org/10.5194/soil-10-77-2024-supplement.
DSM, CE, and HB designed the study and experiments with some feedback from other co-authors, particularly JHR during preliminary experiments. CE led all concentration and speciation analyses with assistance from DSM. Isotope analyses were led by LS with assistance from JGW (and Adelina Calean; see below). This work was the basis for CE's master's thesis, which was written in German. The first draft of the manuscript was written by DSM, and all other authors provided feedback in building the manuscript towards submission. Figures, tables, and the Supplement were produced by DSM, CE, and LS.
The contact author has declared that none of the authors has any competing interests.
Publisher’s note: Copernicus Publications remains neutral with regard to jurisdictional claims made in the text, published maps, institutional affiliations, or any other geographical representation in this paper. While Copernicus Publications makes every effort to include appropriate place names, the final responsibility lies with the authors.
We would like to thank Adelina Calean and Petra Schmidt for their support and contributions in terms of experimental setup and sample analyses (including Adelina Calean travelling to Vienna to assist with isotope analyses). We also thank undergraduate students Jan Pietrucha, Jette Greiser, and Katja Braun for helping with liquid-phase sample collection and analyses. We thank Stephan M. Kraemer for supporting the Hg isotope analyses at the University of Vienna. We would also like to acknowledge Thomas Schöndorf from HPC Environmental Consulting for providing the solid-phase materials used in this study. Also, thanks go to Hans Esser for helping to design the eight-column holding rack used in the experiments. David S. McLagan would like to acknowledge the support provided through a National Sciences and Engineering Research Council of Canada (NSERC) postdoctoral fellowship.
This research has been supported by the Deutsche Forschungsgemeinschaft (grant no. B1 734/17-1) and the Austrian Science Fund (grant no. I-3489-N28).
This open-access publication was funded by Technische Universität Braunschweig.
This paper was edited by Maria Jesus Gutierrez Gines and reviewed by Johannes West and two anonymous referees.
Andersson, A.: Mercury in soil, in: The biochemistry of mercury in the environment, edited by: Nriagu, J. O., Elsevier, Amsterdam, Holland, 79–112, ISBN 0444801103, 1979.
Akcay, H., Kilinç, S., and Karapire, C.: A comparative study on the sorption and desorption of Hg, Th and U on clay, J. Radioanal. Nucl. Chem., 214, 51–66, https://doi.org/10.1007/bf02165058, 1996.
Avotins, P. V.: Adsorption and coprecipitation studies of mercury on hydrous iron oxide, Stanford University, Stanford, USA, ISBN 9798660526602, 1975.
Bergquist, B. A. and Blum, J. D.: Mass-dependent and-independent fractionation of Hg isotopes by photoreduction in aquatic systems, Science, 318, 417–420, https://doi.org/10.1126/science.1148050, 2007.
Bergquist, B. A. and Blum, J. D.: The odds and evens of mercury isotopes: applications of mass-dependent and mass-independent isotope fractionation, Elements, 5, 353–357, https://doi.org/10.2113/gselements.5.6.353, 2009.
Biester, H. and Scholz, C.: Determination of mercury binding forms in contaminated soils: mercury pyrolysis versus sequential extractions, Environ. Sci. Technol., 31, 233–239, https://doi.org/10.1021/es960369h, 1996.
Bloom, N. S., Preus, E., Katon, J., and Hiltner, M.: Selective extractions to assess the biogeochemically relevant fractionation of inorganic mercury in sediments and soils, Anal. Chim. Ac, 479, 233–248, https://doi.org/10.1016/S0003-2670(02)01550-7, 2003.
Bollen, A., Wenke, A., and Biester, H.: Mercury speciation analyses in HgCl2-contaminated soils and groundwater – implications for risk assessment and remediation strategies, Water Res., 42, 91–100, https://doi.org/10.1016/j.watres.2007.07.011, 2008.
Brocza, F. M., Biester, H., Richard, J. H., Kraemer, S. M., and Wiederhold, J. G.: Mercury isotope fractionation in the subsurface of a Hg(II) chloride-contaminated industrial legacy site, Environ. Sci. Technol., 53, 7296–7305, https://doi.org/10.1021/acs.est.9b00619, 2019.
Bradl, H. B.: Adsorption of heavy metal ions on soils and soils constituents, J. Colloid Interf. Sci., 277, 1–18, https://doi.org/10.1016/j.jcis.2004.04.005, 2004.
Clarkson, T. W.: The toxicology of mercury, Crit. Rev. Clinic. Lab. Sci., 34, 369–403, https://doi.org/10.3109/10408369708998098, 1997.
Delnomdedieu, M., Boudou, A., Georgescauld, D., and Dufourc, E. J.: Specific interactions of mercury chloride with membranes and other ligands as revealed by mercury-NMR, Chem.-Biol. Interact., 81, 243–269, https://doi.org/10.1016/0009-2797(92)90081-U, 1992.
Demers, J. D., Blum, J. D., Brooks, S. C., Donovan, P. M., Riscassi, A. L., Miller, C. L., Zheng, W. and Gu, B.: Hg isotopes reveal in-stream processing and legacy inputs in East Fork Poplar Creek, Oak Ridge, Tennessee, USA, Environ. Sci. Process. Impacts, 20, 686–707, https://doi.org/10.1039/C7EM00538E, 2018.
DIN ISO: Method 11277: Soil quality–Determination of particle size distribution in mineral soil material–Method by sieving and sedimentation, German Institute for Standardisation (Deutsches Institut für Normung; DIN) International Organization for Standardization (ISO), Berlin, ICS number: 13.080.20, Germany, 2002.
DIN: Method 1483: Water quality - Determination of mercury - Method using atomic absorption spectrometry, German Institute for Standardisation (Deutsches Institut für Normung; DIN), Berlin, ICS number: 13.060.50, Germany, 2007.
DIN: 19528-01: Leaching of solid materials – Percolation method for the joint examination of the leaching behaviour of organic and inorganic substances for materials with a particle size up to 32 mm – Basic characterization using a comprehensive column test and compliance test using a quick column test, German Institute for Standardisation (Deutsches Institut für Normung; DIN), Berlin, Germany, ICS number: 13.060.50, 2009.
Gabriel, M. C. and Williamson, D. G.: Principal biogeochemical factors affecting the speciation and transport of mercury through the terrestrial environment, Environ. Geochem. Health, 26, 421–434, https://doi.org/10.1007/s10653-004-1308-0, 2004.
Gettens, R. J., Feller, R. L., and Chase, W. T.: Vermilion and cinnabar, Stud. Conserv., 17, 45–69, https://doi.org/10.1179/sic.1972.006, 1972.
Goix, S., Maurice, L., Laffont, L., Rinaldo, R., Lagane, C., Chmeleff, J., Menges, J., Heimbürger, L. E., Maury-Brachet, R., and Sonke, J. E.: Quantifying the impacts of artisanal gold mining on a tropical river system using mercury isotopes, Chemosphere, 219, 684–694, https://doi.org/10.1016/j.chemosphere.2018.12.036, 2019.
Grigg, A. R., Kretzschmar, R., Gilli, R. S., and Wiederhold, J. G.: Mercury isotope signatures of digests and sequential extracts from industrially contaminated soils and sediments, Sci. Tot. Environ., 636, 1344–1354, https://doi.org/10.1016/j.scitotenv.2018.04.261, 2018.
Gu, B., Bian, Y., Miller, C. L., Dong, W., Jiang, X., and Liang, L.: Mercury reduction and complexation by natural organic matter in anoxic environments, P. Natl. Acad. Sci. USA, 108, 1479–1483, https://doi.org/10.1073/pnas.1008747108, 2011.
Gunneriusson, L. and Sjöberg, S.: Surface complexation in the H+-goethite (α-FeOOH)-Hg (II)-chloride system, J. Colloid Interf. Sci., 156, 121–128, https://doi.org/10.1006/jcis.1993.1090, 1993.
Haitzer, M., Aiken, G. R., and Ryan, J. N.: Binding of mercury (II) to dissolved organic matter: the role of the mercury-to-DOM concentration ratio, Environ. Sci. Technol., 36, 3564–3570, https://doi.org/10.1021/es025699i, 2002.
Hall, G. E., Pelchat, J. C., Pelchat, P., and Vaive, J. E.: Sample collection, filtration and preservation protocols for the determination of “total dissolved” mercury in waters, Analyst, 127, 674–680, https://doi.org/10.1039/B110491H, 2002.
Hammerschmidt, C. R., Bowman, K. L., Tabatchnick, M. D., and Lamborg, C. H.: Storage bottle material and cleaning for determination of total mercury in seawater, Limnol. Oceanogr.-Meth., 9, 426–431, https://doi.org/10.4319/lom.2011.9.426, 2011.
Hebig, K. H., Nödler, K., Licha, T., and Scheytt, T. J.: Impact of materials used in lab and field experiments on the recovery of organic micropollutants, Sci. Tot. Environ., 473, 125–131, https://doi.org/10.1016/j.scitotenv.2013.12.004, 2014.
Ho, T. L.: Hard soft acids bases (HSAB) principle and organic chemistry, Chem. Rev., 75, 1–20, https://doi.org/10.1021/cr60293a001, 1975.
Jiskra, M., Wiederhold, J. G., Bourdon, B., and Kretzschmar, R.: Solution speciation controls mercury isotope fractionation of Hg(II) sorption to goethite, Environ. Sci. Technol., 46, 6654–6662, https://doi.org/10.1021/es3008112, 2012.
Jiskra, M., Wiederhold, J. G., Skyllberg, U., Kronberg, R. M., and Kretzschmar, R.: Source tracing of natural organic matter bound mercury in boreal forest runoff with mercury stable isotopes, Environ. Sci. Process. Impacts, 19, 1235–1248, https://doi.org/10.1039/C7EM00245A, 2017.
Katsenovich, Y., Tachiev, G., Fuentes, H. R., Roelant, D., and Henao, A.: A study of the mercury (II) sorption and transport with Oak Ridge Reservation soil, Waste Management Conference 2010, Phoenix, USA, https://archivedproceedings.econference.io/wmsym/2010/pdfs/10222.pdf (last access: 19 January 2024), 2010.
Kim, C. S., Rytuba, J. J., and Brown Jr., G. E.: EXAFS study of mercury (II) sorption to Fe-and Al-(hydr) oxides: II. Effects of chloride and sulfate, J. Colloid Interf. Sci., 270, 9–20, https://doi.org/10.1016/j.jcis.2003.07.029, 2004.
Kocman, D., Horvat, M., Pirrone, N., and Cinnirella, S.: Contribution of contaminated sites to the global mercury budget, Environ. Res., 125, 160–170, https://doi.org/10.1016/j.envres.2012.12.011, 2013.
Lamborg, C. H., Kent, D. B., Swarr, G. J., Munson, K. M., Kading, T., O'Connor, A. E., Fairchild, G. M., LeBlanc, D. R., and Wiatrowski, H. A.: Mercury speciation and mobilization in a wastewater-contaminated groundwater plume, Environ. Sci. Technol., 47, 13239–13249, https://doi.org/10.1021/es402441d, 2013.
Leterme, B., Blanc, P., and Jacques, D.: A reactive transport model for mercury fate in soil – application to different anthropogenic pollution sources, Environ. Sci. Poll. Res., 21, 12279–12293, https://doi.org/10.1007/s11356-014-3135-x, 2014.
Lewis, J. and Sjöstrom, J.: Optimizing the experimental design of soil columns in saturated and unsaturated transport experiments, J. Contam. Hydrol., 115, 1–13, https://doi.org/10.1016/j.jconhyd.2010.04.001, 2010.
Lockwood, R. A. and Chen, K. Y.: Adsorption of mercury (II) by hydrous manganese oxides, Environ. Sci. Technol., 7, 1028–1034, https://doi.org/10.1021/es60083a006, 1973.
Llanos, W., Kocman, D., Higueras, P., and Horvat, M.: Mercury emission and dispersion models from soils contaminated by cinnabar mining and metallurgy, J. Environ. Monit., 13, 3460–3468, https://doi.org/10.1039/C1EM10694E, 2011.
Lu, Y. F., Wu, Q., Yan, J. W., Shi, J. Z., Liu, J., and Shi, J. S.: Realgar, cinnabar and An-Gong-Niu-Huang Wan are much less chronically nephrotoxic than common arsenicals and mercurial, Exp. Biol. Med., 236, 233–239, https://doi.org/10.1258/ebm.2010.010247, 2011.
Lyon, B. F., Ambrose, R., Rice, G., and Maxwell, C. J.: Calculation of soil-water and benthic sediment partition coefficients for mercury, Chemosphere, 35, 791–808, https://doi.org/10.1016/S0045-6535(97)00200-2, 1997.
Manceau, A. and Nagy, K. L.: Thiols in natural organic matter: Molecular forms, acidity, and reactivity with mercury (II) from First-Principles calculations and high energy-resolution X-ray absorption near-edge structure spectroscopy, ACS Earth Space Chem., 3, 2795–2807, https://doi.org/10.1021/acsearthspacechem.9b00278, 2019.
McLagan, D. S., Schwab, L., Wiederhold, J. G., Chen, L., Pietrucha, J., Kraemer, S. M., and Biester, H.: Demystifying mercury geochemistry in contaminated soil–groundwater systems with complementary mercury stable isotope, concentration, and speciation analyses, Environ. Sci. Process. Impacts, 24, 1406–1429, https://doi.org/10.1039/D1EM00368B, 2022.
Miretzky, P., Bisinoti, M. C., andJardim, W. F.: Sorption of mercury (II) in Amazon soils from column studies, Chemosphere, 60, 1583–1589, https://doi.org/10.1016/j.chemosphere.2005.02.050, 2005.
Norrby, L. J.: Why is mercury liquid? Or, why do relativistic effects not get into chemistry textbooks?, J. Chem. Ed., 68, 110, https://doi.org/10.1021/ed068p110, 1991.
Obrist, D., Agnan, Y., Jiskra, M., Olson, C. L., Colegrove, D. P., Hueber, J., Moore, C. W., Sonke, J. E., and Helmig, D.: Tundra uptake of atmospheric elemental mercury drives Arctic mercury pollution, Nature, 547, 201–204, https://doi.org/10.1038/nature22997, 2017.
Parker, J. L. and Bloom, N. S.: Preservation and storage techniques for low-level aqueous mercury speciation, Sci. Tot. Environ., 337, 253–263, https://doi.org/10.1016/j.scitotenv.2004.07.006, 2005.
Patterson, B. M., Pribac, F., Barber, C., Davis, G. B., and Gibbs, R.: Biodegradation and retardation of PCE and BTEX compounds in aquifer material from Western Australia using large-scale columns, J. Contam. Hydrol., 14, 261–278, https://doi.org/10.1016/0169-7722(93)90028-Q, 1993.
Pirrone, N., Cinnirella, S., Feng, X., Finkelman, R. B., Friedli, H. R., Leaner, J., Mason, R., Mukherjee, A. B., Stracher, G. B., Streets, D. G., and Telmer, K.: Global mercury emissions to the atmosphere from anthropogenic and natural sources, Atmos. Chem. Phys., 10, 5951–5964, https://doi.org/10.5194/acp-10-5951-2010, 2010.
Reis, A. T., Davidson, C. M., Vale, C., and Pereira, E.: Overview and challenges of mercury fractionation and speciation in soils, Trends Anal. Chem., 82, 109–117, https://doi.org/10.1016/j.trac.2016.05.008, 2016.
Richard, J. H., Bischoff, C., and Biester, H.: Comparing modeled and measured mercury speciation in contaminated groundwater: Importance of dissolved organic matter composition, Environ. Sci. Technol., 50, 7508–7516, https://doi.org/10.1016/j.trac.2016.05.008, 2016a.
Richard, J. H., Bischoff, C., Ahrens, C. G., and Biester, H.: Mercury (II) reduction and co-precipitation of metallic mercury on hydrous ferric oxide in contaminated groundwater, Sci. Tot. Environ., 539, 36–44, https://doi.org/10.1016/j.scitotenv.2015.08.116, 2016b.
Sentenac, P., Lynch, R. J., and Bolton, M. D.: Measurement of a side-wall boundary effect in soil columns using fibre-optics sensing, Int. J. Phys. Model. Geotech., 1, 35–41, https://doi.org/10.1680/ijpmg.2001.010404, 2001.
Sanemasa, I.: The solubility of elemental mercury vapor in water, Bull. Chem. Soc. Jpn., 48, 1795–1798, https://doi.org/10.1246/bcsj.48.1795, 1975
Schroeder, W. H. and Munthe, J.: Atmospheric mercury – an overview, Atmos. Environ., 32, 809–822, https://doi.org/10.1016/S1352-2310(97)00293-8, 1998.
Schlüter, K., Seip, H. M., and Alstad, J.: Mercury translocation in and evaporation from soil. II. Evaporation of mercury from podzolized soil profiles treated with HgCl2 and CH3HgCl, Soil Sediment Contam., 4, 269–298, https://doi.org/10.1080/15320389509383498, 1995.
Schlüter, K.: Sorption of inorganic mercury and monomethyl mercury in an iron–humus podzol soil of southern Norway studied by batch experiments, Environ. Geol., 30, 266–279, https://doi.org/10.1007/s002540050156, 1997.
Schnaar, G. and Brusseau, M. L.: Measuring equilibrium sorption coefficients with the miscible-displacement method, J. Environ. Sci. Health A, 48, 355–359, https://doi.org/10.1080/10934529.2013.727733, 2013.
Schöndorf, T., Egli, M., Biester, H., Mailahn, W., and Rotard, W.: Distribution, Bioavailability and Speciation of Mercury in Contaminated Soil and Groundwater of a Former Wood Impregnation Plant, in: Mercury Contaminated Sites, edited by: Ebinghaus, R., Turner, R. R., de Lacerda, L. D., Vasiliev, O., Salomons, W., Springer, Berlin, Heidelberg, 181–206, https://doi.org/10.1007/978-3-662-03754-6_ 9, 1999.
Schuster, E.: The behavior of mercury in the soil with special emphasis on complexation and adsorption processes-a review of the literature, Water Air Soil Poll., 56, 667–680, https://doi.org/10.1007/BF00342308, 1991.
Schuster, P. F., Shanley, J. B., Marvin-Dipasquale, M., Reddy, M. M., Aiken, G. R., Roth, D. A., Taylor, H. E., Krabbenhoft, D. P. and DeWild, J. F.: Mercury and organic carbon dynamics during runoff episodes from a northeastern USA watershed, Water Air Soil Poll., 187, 89–108, https://doi.org/10.1007/s11270-007-9500-3, 2008.
Schwab, L., Gallati, N., Reiter, S. M., Kimber, R. L., Kumar, N., McLagan, D. S., Biester, H., Kraemer, S. M., and Wiederhold, J. G.: Mercury Isotope Fractionation during Dark Abiotic Reduction of Hg (II) by Dissolved, Surface-Bound, and Structural Fe (II), Environ. Sci. Technol., 57, 15243–15254, https://doi.org/10.1021/acs.est.3c03703, 2023.
Skyllberg, U.: Chemical speciation of mercury in soil and sediment, in: Environmental chemistry and toxicology of mercury, edited by: Liu, G., Cai, Y., Driscoll, N., Wiley & Sons Inc., Hoboken, USA, 219–258, https://doi.org/10.1002/9781118146644.ch7, 2012.
Streets, D. G., Horowitz, H. M., Lu, Z., Levin, L., Thackray, C. P., and Sunderland, E. M.: Global and regional trends in mercury emissions and concentrations, 2010–2015, Atmos. Environ., 201, 417–427, https://doi.org/10.1016/j.atmosenv.2018.12.031, 2019.
Ullrich, S. M., Tanton, T. W., and Abdrashitova, S. A.: Mercury in the aquatic environment: a review of factors affecting methylation, Crit. Rev. Environ. Sci. Technol., 31, 241–293, https://doi.org/10.1080/20016491089226, 2001.
USEPA: Method 1631, Revision E: Mercury in water by oxidation, purge and trap, and cold vapor atomic fluorescence spectrometry, United States Environmental Protection Agency (USEPA), Washington, DC, https://www.epa.gov/sites/default/files/2015-08/documents/method_1631e_2002.pdf, (last access: 19 January 2024), 2002.
USEPA.: Understanding variation in partition coefficient, Kd, values. Volume III: Review of Geochemistry and Available Kd Values for Americium, Arsenic, Curium, Iodine, Neptunium, Radium, and Technetium. United States Environmental Protection Agency (USEPA), Washington, DC, USA, https://www.epa.gov/sites/default/files/2015-05/documents/402-r-04-002c.pdf, (last access: 19 January 2024), 2004.
Van Genuchten, M. T. and Parker, J. C.: Boundary conditions for displacement experiments through short laboratory soil columns, Soil Sci. Soc. Am. J., 48, 703–708, https://doi.org/10.2136/sssaj1984.03615995004800040002x, 1984.
Van Glubt, S., Brusseau, M. L., Yan, N., Huang, D., Khan, N., and Carroll, K. C.: Column versus batch methods for measuring PFOS and PFOA sorption to geomedia. Environ. Poll., 268, 115917, https://doi.org/10.1016/j.envpol.2020.115917, 2021.
Wiederhold, J. G.: Metal stable isotope signatures as tracers in environmental geochemistry, Environ. Sci. Technol., 49, 2606–2624, https://doi.org/10.1021/es504683e, 2015.
Wiederhold, J. G., Cramer, C. J., Daniel, K., Infante, I., Bourdon, B., and Kretzschmar, R.: Equilibrium mercury isotope fractionation between dissolved Hg (II) species and thiol-bound Hg, Environ. Sci. Technol., 44, 4191–4197, https://doi.org/10.1021/es100205t, 2010.
Yin, Y., Allen, H. E., Li, Y., Huang, C. P., and Sanders, P. F.: Adsorption of mercury (II) by soil: effects of pH, chloride, and organic matter, J. Environ. Qual., 25, 837–844, https://doi.org/10.2134/jeq1996.00472425002500040027x, 1996.
Yin, Y., Allen, H. E., Huang, C., Sparks, D. L., and Sanders, P. F.: Kinetics of mercury (II) adsorption and desorption on soil, Environ. Sci. Technol., 31, 496–503, https://doi.org/10.1021/es9603214, 1997.
Zheng, W. and Hintelmann, H.: Nuclear field shift effect in isotope fractionation of mercury during abiotic reduction in the absence of light, J. Phys. Chem. A, 114, 4238–4245, https://doi.org/10.1021/jp910353y, 2010.