the Creative Commons Attribution 4.0 License.
the Creative Commons Attribution 4.0 License.
 | 19 Jul 2024
Improving measurements of microbial growth, death, and turnover by accounting for extracellular DNA in soils
Jörg Schnecker
Theresa Böckle
Julia Horak
Victoria Martin
Taru Sandén
Heide Spiegel
Microbial respiration, growth, and turnover are driving processes in the formation and decomposition of soil organic matter. In contrast to respiration and growth, microbial turnover and death currently lack distinct methods to be determined. Here we propose a new approach to determine microbial death rates and to improve measurements of microbial growth. By combining sequential DNA extraction to distinguish between intracellular and extracellular DNA and 18O incorporation into DNA, we were able to measure microbial death rates. We first evaluated methods to determine and extract intracellular and extracellular DNA separately. We then tested the method by subjecting soil from a temperate agricultural field and a deciduous beech forest to either 20, 30, or 45 °C for 24 h. Our results show that while mass-specific respiration and gross growth either increased with temperature or remained stable, microbial death rates strongly increased at 45 °C and caused a decrease in microbial biomass and thus in microbial net growth. We further found that also extracellular DNA pools decreased at 45 °C compared to lower temperatures, further indicating the enhanced uptake and recycling of extracellular DNA along with increased respiration, growth, and death rates. Additional experiments including soils from more and different ecosystems as well as testing the effects of factors other than temperature on microbial death are certainly necessary to better understand the role of microbial death in soil C cycling. We are nevertheless confident that this new approach to determine microbial death rates and dynamics of intracellular and extracellular DNA separately will help to improve concepts and models of C dynamics in soils in the future.
- Article
(1680 KB) - Full-text XML
-
Supplement
(410 KB) - BibTeX
- EndNote


Microorganisms are the driving force that sustains the 1450 Gt of carbon (C) in soils globally (Liang et al., 2017; Scharlemann et al., 2014). Active microorganisms take up and convert plant-derived C and soil organic C into microbial biomass and release C as CO2 to the atmosphere via respiration. Upon cell death, microbial C is released back to the soil solution and can be stabilized on mineral surfaces or in aggregates. While causes for microbial death in soils can be numerous, ranging from osmotic shock and dehydration to viral lysis and predation (Sokol et al., 2022), the relevance of this process and of the microbial necromass pool for soil C cycling is undisputed. Since a large proportion of soil organic matter (SOM) is passing through the microbial biomass pool (Kallenbach et al., 2016; Miltner et al., 2012), the process of microbial death might be of equal importance as microbial growth for SOM formation.
Methodological developments in the last decades have made it possible to measure microbial C uptake (Bååth, 2001; Frey et al., 2013; Rousk and Bååth, 2007). Substrate independent methods that use 18O have enabled the measurement of growth of the whole soil microbial community and individual taxa without changing substrate availability for microbes (Blazewicz and Schwartz, 2011; Hungate et al., 2015; Spohn et al., 2016). Recently developed methods even allow for these measurements without changing soil water contents (Canarini et al., 2020; Metze et al., 2023). In contrast to uptake and growth, turnover and death rates of the microbial community have not seen a suitable method yet. Microbial turnover can be calculated using only growth rates and the microbial biomass pool (e.g., Prommer et al., 2020; Spohn et al., 2016). This is done under the assumption of a stabile state of the microbial community and no net changes in the living microbial biomass as well as death rates being the same as growth rates. An assumption that might not always be met under natural conditions.
A reason for the lack of methods to determine microbial death rates might be that DNA extractions used for 18O-based methods do not account for extracellular DNA (eDNA). Extracellular DNA is DNA that persists outside of intact microbial cells (Pietramellara et al., 2009). The eDNA pool is, on the one hand, fed by disintegrated microbial cells (Ascher et al., 2009; Nagler et al., 2020), which could have died as a consequence of chemical or physical stressors or lysis caused by predators or viruses (Sokol et al., 2022). On the other hand, it has been shown that DNA is actively exuded by microorganisms as an integral component of microbial biofilms in soils (Cai et al., 2019; Das et al., 2013). Pools of eDNA can be rather prominent in soils and have been shown to account for up to 80 % of the total DNA extracted (Carini et al., 2016). Such a large pool of DNA, irrespective of its origin, has the capacity to mask subtle changes in the pool of DNA inside living microbial cells (intracellular DNA, iDNA) and to bias measurements of microbial growth that are based on the determination of DNA contents.
Here we propose a novel approach to assess microbial turnover rates. We suggest that separating the eDNA and iDNA pools upon the determination of microbial growth rates based on 18O-water incorporation into DNA harbors several advantages over the conventional method. The adaptation provides more precise growth rate measurements as it also allows for the calculation of only iDNA production rates. Accordingly, changes in the iDNA pool can be used to calculate gross DNA release rates, i.e., microbial death rates. Besides providing insights into microbial death rates, observing changes in the iDNA as well as eDNA pools holds potential information about microbial processes like microbial DNA uptake and recycling.
In addition to evaluating extraction methods for eDNA and iDNA and evaluation of 18O incorporation in the two DNA pools over time, we have tested the method by subjecting soils to different temperatures. We used 20, 30, and 45 °C, assuming that these temperatures represent three distinct but relevant temperatures for microbial activities in the investigated soils. The investigated soils were from two contrasting temperate systems (an agricultural field and a deciduous forest) that regularly experience 20 °C and sometimes even 30 °C in the topsoil layers (Schnecker et al., 2023a). Around 30 °C is the assumed optimum temperature for microbial activity in many soils (Birgander et al., 2018; Nottingham et al., 2019; Rousk et al., 2012). At 45 °C, microbial process rates are reduced in comparison to the temperature optimum at 30 °C (Cruz-Paredes et al., 2021; Rousk et al., 2012). We expected that (1) mass-specific respiration would increase from 20 to 30 °C and further to 45 °C. We further hypothesized that (2) a previously shown decrease in microbial net growth above the temperature optimum at 30 °C would be caused by increased microbial death and a net decrease in microbial biomass.
2.1 Sampling sites
Soil samples were collected from an agricultural field site and a deciduous forest. The long-term agricultural field experiment near Grabenegg, Alpenvorland, Austria (48°12′ N, 15°15′ E), was established in 1986 and previously described in Spiegel et al. (2018). The soil is classified as gleyic Luvisol (Spiegel et al., 2018) and has a silt loam texture (10 % sand, 73 % silt, and 17 % clay). Soil pH is 6.1 (Canarini et al., 2020). The forest study site at the experimental forest Rosalia, Austria (47°42′ N, 16°17′ E), is dominated by European beech (Fagus sylvatica L.). The soil at the site is a gleyic Cambisol (Leitner et al., 2016). Texture is a sandy loam (55 % sand, 38 % silt, and 7 % clay), and soil pH is 4.9 (Canarini et al., 2020). Soils were sampled from 0–5 cm depth with a soil corer with a diameter of 2 cm. At both sites, 10 soil cores for each of the four replicate plots were combined into one sample, resulting in four field replicates per site. At the agricultural site, the four sampled plots were 7.5 m wide, 28 m long, and at least 5 m apart from the next plot. At the forest site, the 3 m by 3 m plots were at least 10 m apart from each other. All samples were homogenized by sieving in the field through a 2 mm mesh before they were transported to the laboratory.
2.2 Experimental setup
To evaluate the feasibility of eDNA extraction and determination of eDNA pool size, as well as the potential for its use in conjunction with 18O-based determination of microbial growth, we carried out three tests:
-
comparing methods to collect or remove eDNA;
-
dynamics of eDNA over time at constant temperature;
-
temperature response of microbial biomass; DNA pools; and microbial growth, death, and respiration.
2.2.1 Comparing methods to collect or remove eDNA
To determine the contribution of eDNA to the total DNA pool, we compared two published methods. The first method removes eDNA by addition of DNases (the DNase method; Lennon et al., 2018), and the second method is based on a sequential DNA extraction (Ascher et al., 2009).
For this test, soil samples were collected in October 2021 and kept at 4 °C for 1 week before the experiment. For the DNase method, 400 mg of field-moist soil was weighed in two 2 mL plastic tubes. All tubes were then amended with 440 µL of buffer consisting of 382.5 µL of ultrapure water, 5 µL of 1 M MgCl2, 2.5 µL of bovine serum albumin (10 mg mL−1), and 120 µL of 0.5 M Tris-HCl (pH 7.5). One of the two samples further received 40 µL of DNase I solution (10 U µL−1) (U represents enzyme unit), and the other tube received 40 µL of ultrapure water and served as a control. Both samples were incubated in an incubator at 37 °C for 1 h. Afterwards, 25 µL of 0.5 M EDTA was added, and the tubes were transferred to an incubator at 75 °C to stop DNase activity. After 15 min, the samples were centrifuged, the supernatant was discarded, and the remaining sample was extracted using the FastDNA™ SPIN Kit for Soil (MP Biomedicals).
For the sequential DNA extraction, we used the chemicals and materials provided in the FastDNA™ SPIN Kit for Soil (MP Biomedicals). For this approach, 400 mg of field-moist soil was weighed in the 2 mL of Lysing Matrix E tubes, from which the contents had been emptied and collected in a 2 mL plastic vial. We added 1100 µL of sodium phosphate buffer to the soil in the lysing tube and shook the vials gently in a horizontal position at 100 rpm at 4 °C for 20 min. After this, the vials were centrifuged at 12 500 rpm for 2 min, and the supernatant was collected as the eDNA-containing fraction. The original content of the Lysing Matrix E tubes was returned to the tubes and handled as described in the manufacturer instructions to obtain the iDNA pool. To the eDNA fraction, we then added 250 µL of protein precipitation solution and followed the MP Biomedicals instructions after this step, except for additional centrifugation steps for separating binding matrix and the liquid solution. After DNA extraction and purification, DNA extracts were stored at −80 °C until further use. In addition to these two approaches, the same soils were also extracted regularly using the FastDNA™ SPIN Kit for Soil (MP Biomedicals) to determine the total extractable DNA pool. The DNA concentration of all extracts was determined fluorometrically by a PicoGreen assay using a kit (Quant-iT™ PicoGreen® dsDNA reagent, Life Technologies). The content of eDNA determined with the DNase method was calculated by subtracting the DNA content of samples that received DNase I from samples that only received water and served as a control.
2.2.2 Dynamics of eDNA and iDNA over time at constant temperature
In this experiment, we explored the changes in eDNA and iDNA pools over time as well as the incorporation of 18O from added water into these two distinct DNA pools. Soils were sampled in August 2022, and the incubation was started 1 week later, where samples were stored at 20 °C. For the experiment, 400 mg of field-moist soil was weighed into empty Lysing Matrix E tubes and amended with 18O water to achieve 60 % of the soil's water-holding capacity and a labeling of 20 atom percent (at. %) of the total water in the soil. From each of the four field replicates, seven vials were filled, labeled with 18O water, and closed. Immediately after label addition and after 6, 12, 24, 48, 72 and 168 h, eDNA and iDNA were extracted with sequential DNA extraction as described above. DNA concentrations in all DNA fractions were determined using the PicoGreen assay. Subsequently, total oxygen content and 18O enrichment of the purified DNA fractions were measured following Spohn et al. (2016) and Zheng et al. (2019) using a thermochemical elemental analyzer (TC/EA, Thermo Fisher) coupled via a ConFlo III open split system to an isotope ratio mass spectrometer (Delta V Advantage, Thermo Fisher).
2.2.3 Temperature response of microbial biomass; DNA pools; and microbial growth, death, and respiration
In this experiment, we subjected the samples to three different temperatures to test the response of microbial communities. Soils were collected in August 2022 and stored at 20 °C for 2 d before the start of the experiment.
For the incubation, around 400 mg of soil was weighed into empty Lysing Matrix E tubes. From each field replicate, five Lysing Matrix E tubes were filled. Two sets of samples were amended with natural-abundance water and three sets were amended with 18O water to achieve 60 % water-holding capacity and 20 at. % 18O in the final soil water, when 18O water was added. One set of samples that received natural-abundance water was extracted immediately using sequential DNA extraction. The second set of natural-abundance samples and one set of samples with 18O water were put in an incubator set to 20 °C. A second set was put in an incubator set to 30 °C and the third set of samples was incubated at 45 °C.
After 24 h in the incubators, all samples were subjected to sequential DNA extraction to recover eDNA and iDNA pools. All obtained DNA extracts were stored at −80 °C before DNA concentrations were determined using PicoGreen assay, and oxygen content and 18O enrichment were determined as described above.
In addition to the 18O incubation, we determined microbial respiration rates and microbial biomass C following the descriptions in Schnecker et al. (2023b). For microbial respiration, 400 mg of soil was weighed in plastic vials, water was added to achieve 60 % water-holding capacity, and the open plastic vials containing the soil were inserted into 27 mL headspace vials. The headspace vials were sealed with a rubber septum. This was done in three replicates for each soil sample, with one set being incubated at 20, 30, and 45 °C, respectively. In addition to the headspace vials containing soil samples, five empty glass vials were sealed with rubber septa and added for each temperature. After 24 h, we measured the CO2 concentration by taking gas samples from a sealed headspace vial and measuring it directly with an infrared gas analyzer (EGM4, PP Systems). The microbial respiration rate was then calculated as the difference in CO2 concentrations between the vials containing soil samples and empty glass vials, which contained the air at the start of the incubation. The net increase in CO2 was divided by the incubation time.
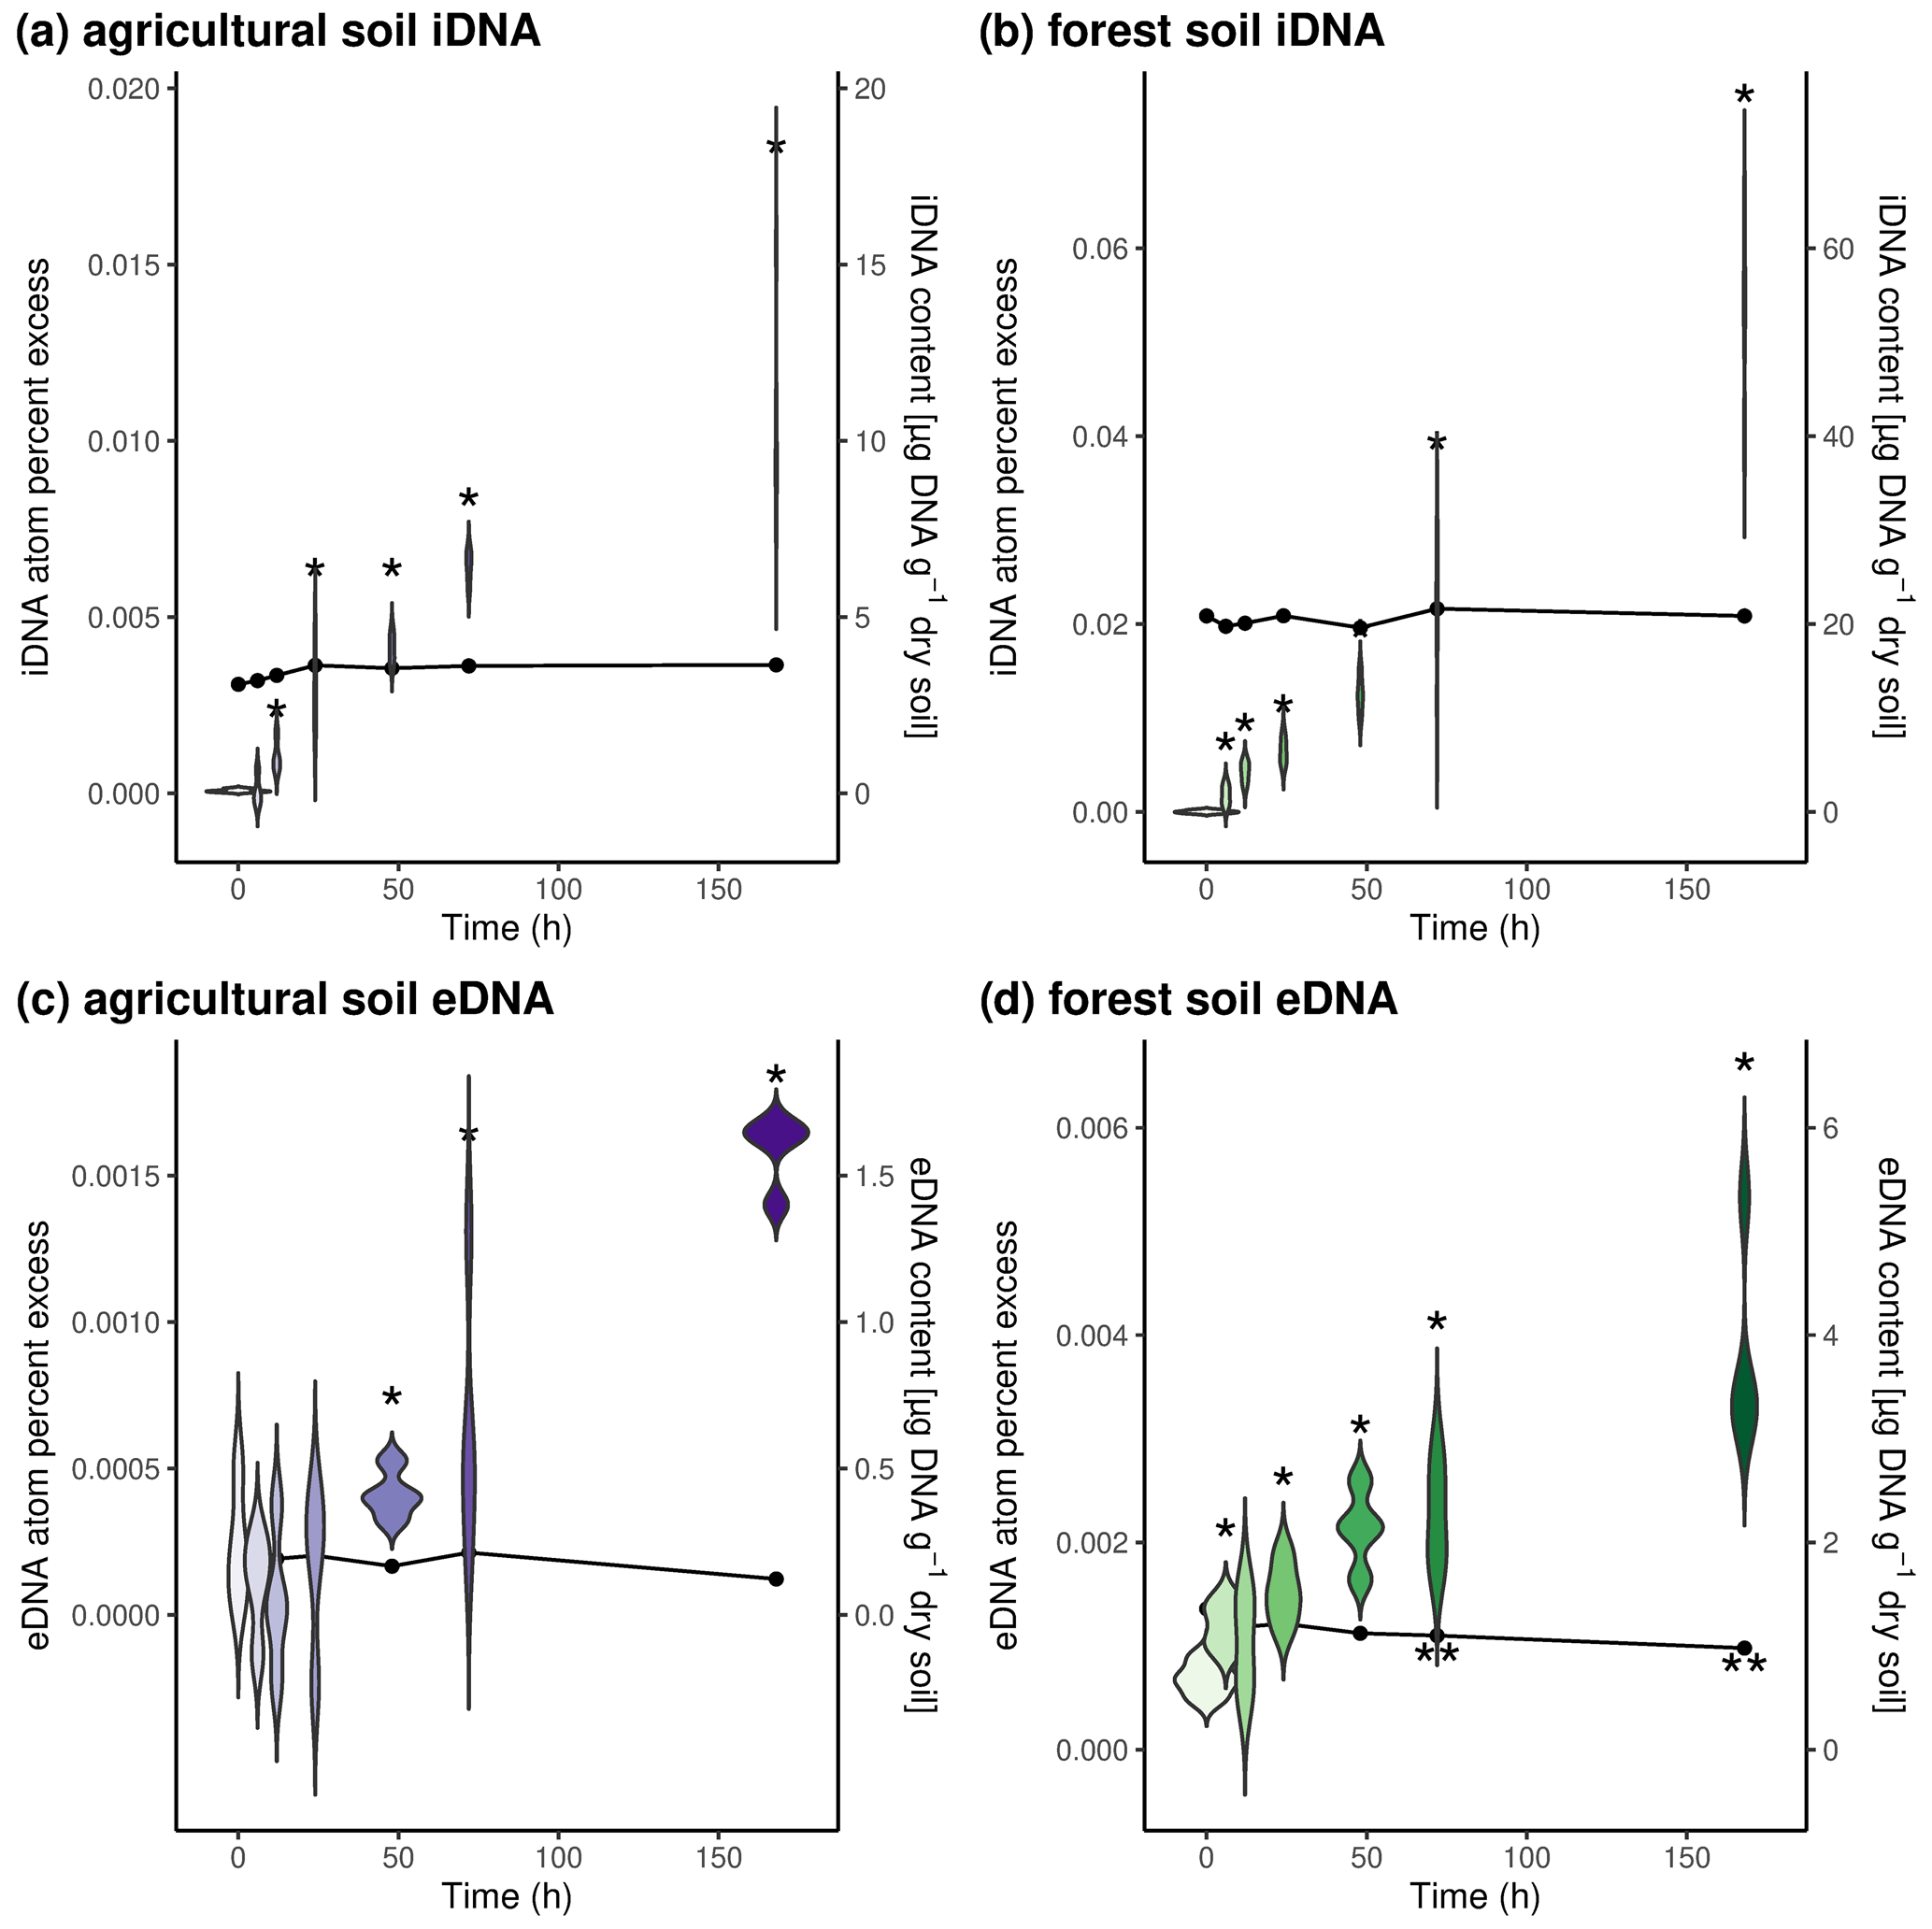
Figure 1Temporal development of DNA pools and 18O enrichment during incubation with 18O water. Upper panels depict iDNA pools and enrichment in (a) agricultural soils and (b) forest soils. Lower panels depict eDNA pools and enrichment in (c) agricultural soils and (d) forest soils. Violin plots represent 18O enrichment of DNA pools (atom percent excess), and dot-and-line plots represent DNA pool sizes over time. Asterisks indicate significant differences (p value < 0.05) from time point 0.
Microbial biomass C (MBC) was determined following an approach based on Brookes et al. (1985) and described in Schnecker et al. (2023b) with parallel determinations for MBC at the three temperatures. MBC was determined in 1 M KCl and measured on a total organic carbon and total nitrogen (TOC/TN) analyzer (TOC-L CPH/CPN, Shimadzu). Measured MBC values were divided by 0.45 (Wu et al., 1990) to account for extraction efficiency.
For each of the three temperatures, we calculated microbial gross growth rates, microbial net growth rates, microbial gross death rates (DNAdeath), and microbial carbon use efficiency (CUE).
Microbial gross growth was calculated following Canarini et al. (2020) as the amount of iDNA produced:
where OiDNA extr is the total amount of oxygen in the iDNA extract; 18O at %iDNA L and 18O at % are the 18O enrichment in the labeled DNA extracts from the different temperatures and unlabeled DNA extracts, respectively; and 18O at %soil water is the 18O enrichment of the soil water. The fraction at the end of the formula accounts for the average oxygen content of DNA (31.21 %; Canarini et al., 2020; Zheng et al., 2019).
Mass-specific gross growth rate (MSgG) was calculated by dividing iDNAproduced by the amount of iDNA in the respective sample.
Microbial net growth rate was calculated by subtracting the amount of iDNA in the samples that was extracted immediately from the amount of iDNA at the end of the incubation divided by the incubation time. Mass-specific net growth rate (MSnG) was calculated by dividing microbial net growth rates by the iDNA content at the end of the incubation. Microbial gross death rates were calculated by using the following formula:
where microbial death rates (DNAdeath) are determined by subtracting iDNA growth (iDNAproduced), determined by 18O incorporation into iDNA, from the net growth rate (ΔiDNA). Mass-specific gross death (MSD) was calculated by dividing DNAdeath by the iDNA content.
Microbial CUE was calculated using the following equation (Manzoni et al., 2012):
where microbial biomass C produced (CGrowth) during the incubation was calculated as iDNAproduced divided by the total amount of iDNA in the sample and multiplied by MBC values. Microbial respiration (CRespiration) was calculated from the respiration measurements described above. Mass-specific microbial respiration (MSR) was calculated as CRespiration divided by MBC.
2.3 Statistics
All statistical analyses were performed in R 4.1.2 (R Development Core Team, 2013). To determine whether eDNA or iDNA pools or 18O atom percent access were different from time point 0 in Sect. 2.2.2, we used two sample comparison tests. We used either t tests, Welch t tests when variances were not homogeneous, or Wilcoxon rank sum tests when data were not normally distributed. We used the fit linear model using generalized least squares (R function “gls”) and the linear mixed-effects models (“lme”), which are both contained in the R package “nlme” (Pinheiro et al., 2021), and we estimated marginal means (“emmeans”) to determine the effects of temperature on microbial processes and MBC and DNA pools (Experiment 4) as well as differences in the extraction assays (Sect. 2.2.1). To account for non-normal distributed residuals, we used log transformations where necessary. If residuals of the models were non-homoscedastic, we introduced weights in the respective functions. We also introduced field plots as random effects. Different models including weights and random effects were set up and compared with the ANOVA (“anova”). If models were statistically different, we chose the model with the lowest Akaike information criterion (AIC). Statistical tests were assumed to be significant at p<0.05.
3.1 Comparing methods to collect or remove eDNA
To distinguish eDNA and iDNA, we tested two methods. First, eDNA digestion by DNase (Lennon et al., 2018) and sequential extraction (Ascher et al., 2009). Compared to regular DNA extraction, sequential extraction yielded on average 23.1 % less, and the DNase method yielded on average 78.2 % less total DNA (Table 1). The differences between regular extraction and sequential extraction were only statistically significant in the agricultural soil but not in forest soil. Lower yields in total DNA extracted with sequential extraction could be explained by the additional pipetting and cleaning steps used for this approach, which can have an impact on extraction efficiency (Pold et al., 2020). The DNase digestion yielded significantly less total DNA then the two other methods and also did not work as expected in two out of four replicates at each site.
Table 1Comparison of methods to estimate eDNA in soil samples from two soil systems. The column “Stat” indicates statistical differences in total DNA amounts between the three extraction methods.
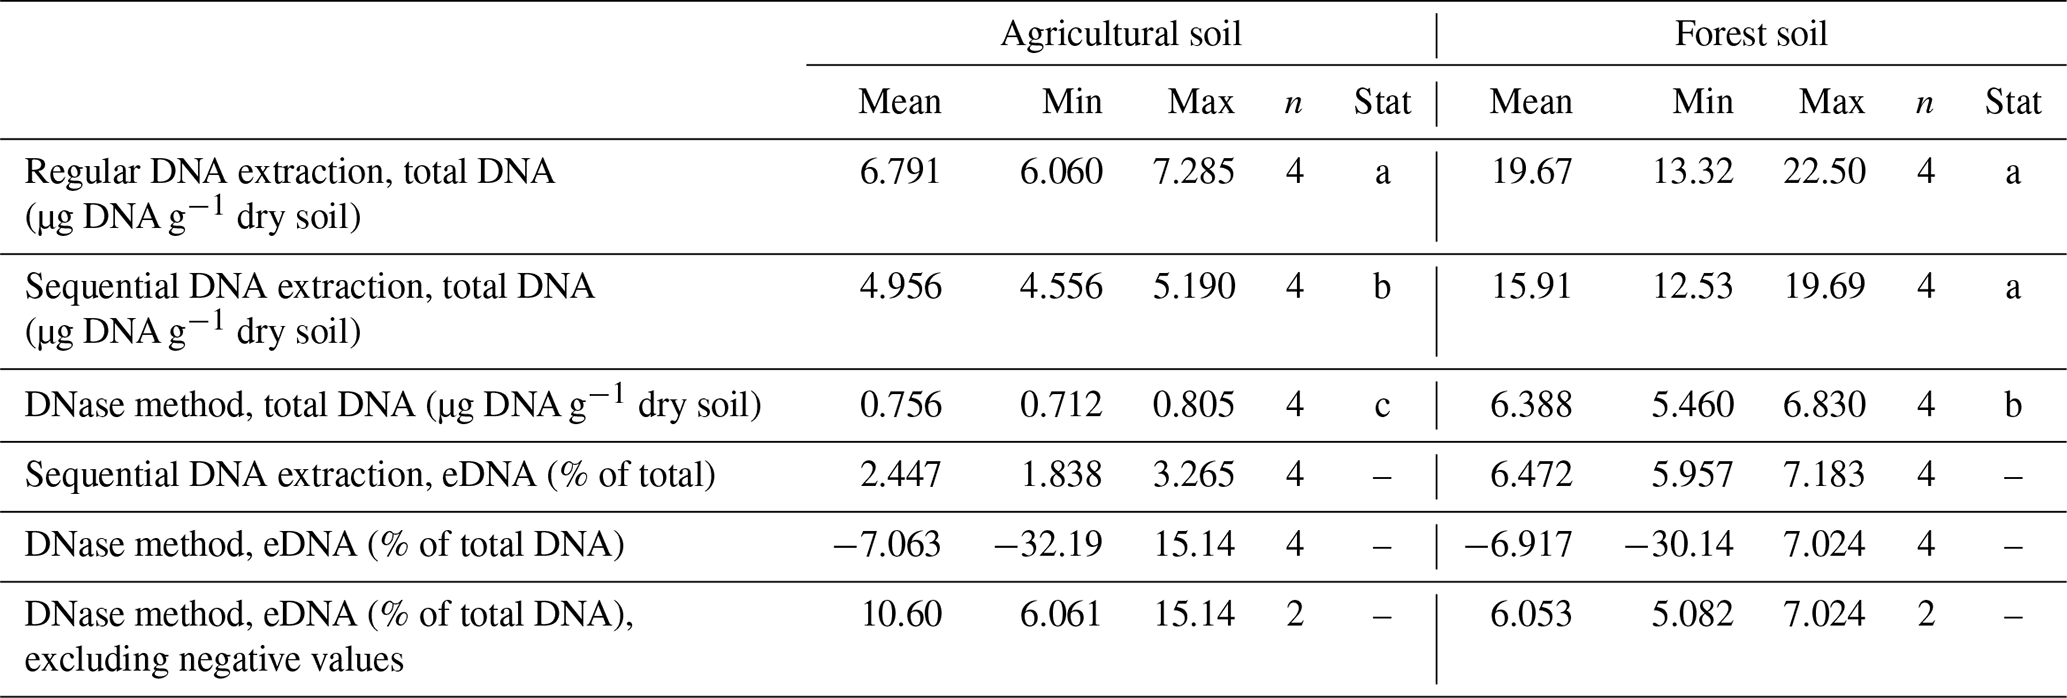
Due to these findings and the fact that the DNase method uses incubation temperatures of 35 and 75 °C, which likely interfere with potential temperature treatments, we decided to use sequential extraction for our further experiments. Sequential extraction also has the advantage that both eDNA and iDNA are recovered and can be used for further analyses. The amounts of eDNA recovered with sequential DNA extraction were on average 2.4 % of total DNA in agricultural soils and 6.5 % of total DNA in forest soils, which is on the lower end of the range found in other studies (Carini et al., 2016; Lennon et al., 2018). However, agricultural soils examined by Carini et al. (2016) fell on the lower end of the wide range of eDNA contents. Another reason for our low eDNA values could be that our soils were stored in the lab for at least a couple of days. During this time, eDNA might have already been degraded.
3.2 Dynamics of eDNA and iDNA over time at constant temperature
We also determined the change in eDNA and iDNA content as well as the incorporation of 18O from amended 18O-labeled water into these two DNA pools over time (Fig. 1). We found that only the amount of eDNA in forest soils slightly decreased over time and was significantly lower after 72 h and after 168 h compared to the initial eDNA content (Fig. 1d). In forest soils, the iDNA content and both DNA pools in the agricultural soil did not change over time (Fig. 1a–c). The amended 18O was incorporated into both DNA pools at both sites over time, indicating production of iDNA and eDNA. While we could detect the 18O label at the latest after 12 h in both DNA pools of the forest soil and the iDNA pool of the agricultural soil, increased 18O values could only be found after 48 h in the eDNA pool of the agricultural soil. This could indicate that the eDNA pool in the agricultural soil might mainly be fed by microbial death and that the 18O is thus first incorporated into iDNA; only when these newly formed cells die will the label be released as eDNA. In the forest soil, our findings indicate that eDNA is actively exuded from the beginning on. It should be noted that the detection of the label in eDNA early on could also indicate that freshly formed cells were lysed during the eDNA extraction. However, if eDNA is actively exuded as, for example, part of a microbial biofilm (Das et al., 2013; Nagler et al., 2018; Pietramellara et al., 2009), then this depends on the present microorganisms (Cai et al., 2019). The amount of eDNA produced can also vary for different microorganisms (Fig. S1).
3.3 Temperature response of microbial biomass; DNA pools; and microbial growth, death, and respiration
To test the combination of sequential DNA extraction and 18O incorporation in DNA, we subjected soil from the agricultural site and the forest site to three different temperatures. Microbial processes and activity have been shown to strongly increase with temperature up to a temperature optimum (Rousk et al., 2012). Above this temperature threshold, conditions are adverse and have been shown to lead to a reduction in the microbial biomass (Riah-Anglet et al., 2015). By subjecting the two investigated soil types to 20, 30, and 45 °C, we found that MBC was not affected by temperature (Fig. 2a, b). The content of iDNA did not change from 20 to 30 °C and decreased significantly when soils were brought to 45 °C (Fig. 2c, d). The decrease in iDNA at 45 °C indicated that a part of the microbial community died because of the high temperature, and DNA might have been lost from within the microbial cells. In agricultural soils, eDNA contents were significantly lower at 30 and 45 °C than at 20 °C, while eDNA contents in forest soils only dropped significantly in the 45 °C treatment (Fig. 2e–f). As we observed an increase in mass-specific death rate and a concomitant decrease in the eDNA pool, we concluded that the efflux from the eDNA pool must be increased. This could be eDNA uptake or degradation of eDNA. We thus suggest that decreasing eDNA contents with temperature rather indicate a higher degradation and recycling of eDNA than the reduction of eDNA release from microbial cells.
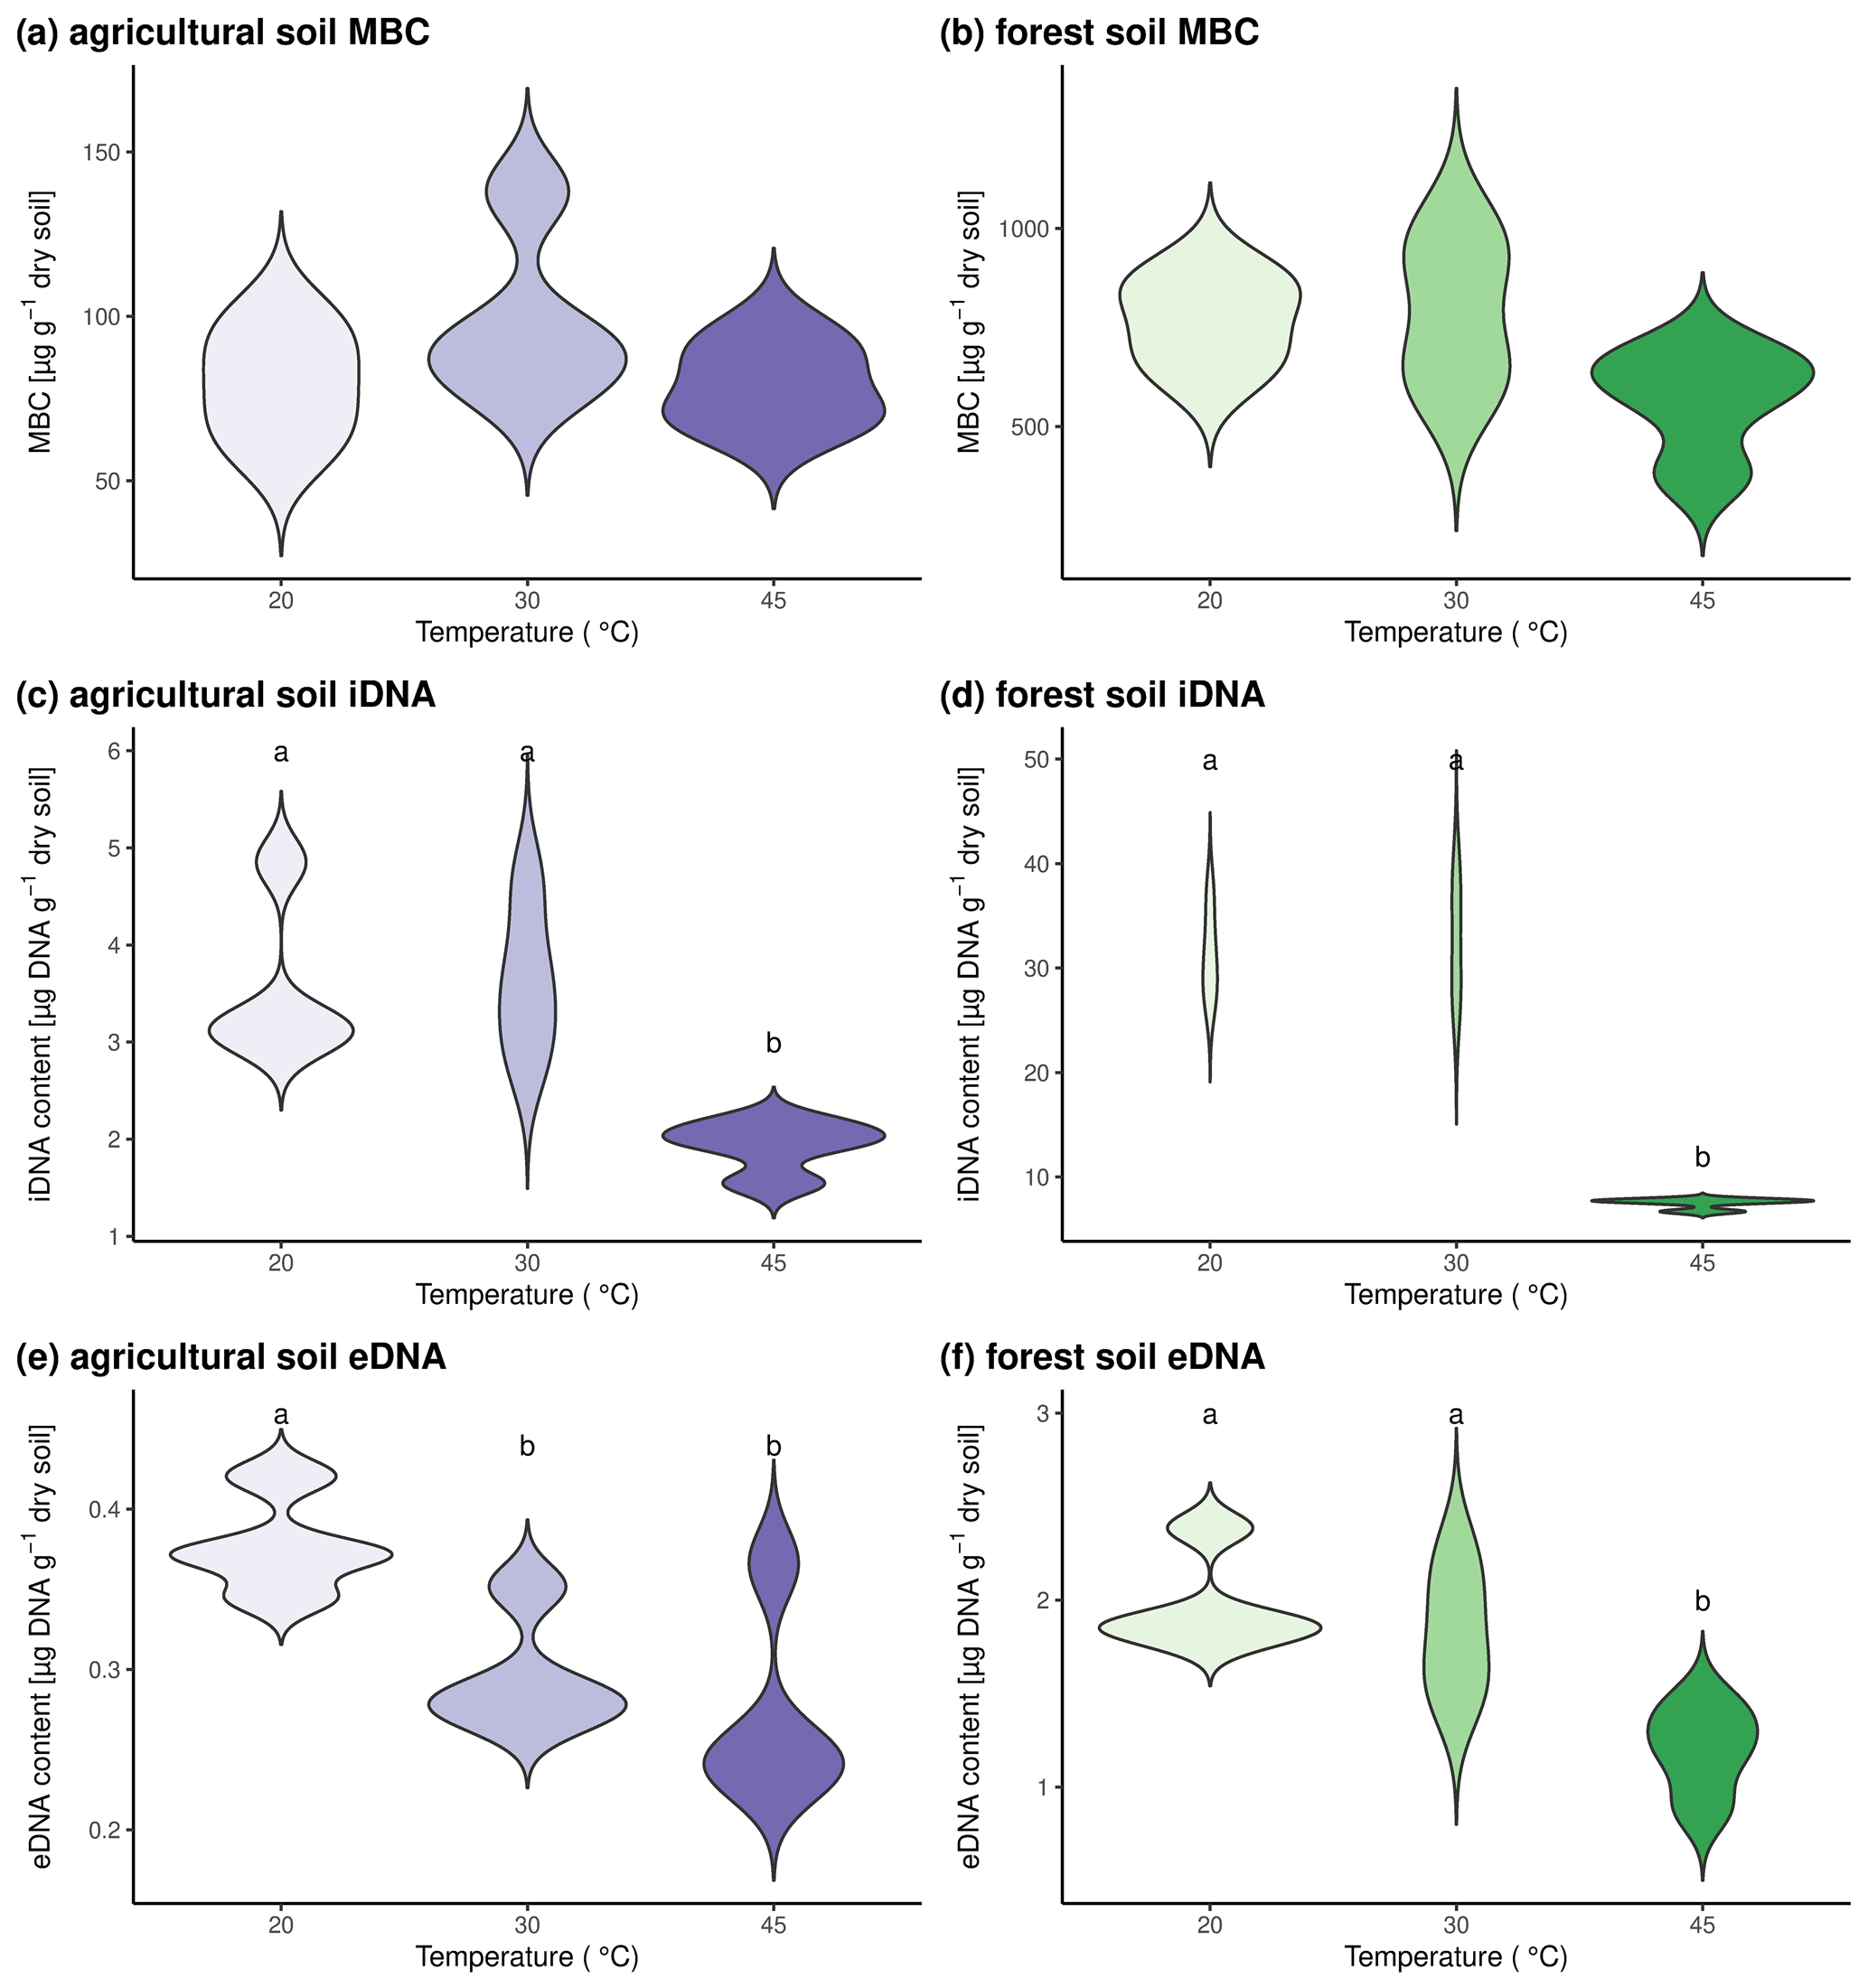
Figure 2Microbial pool sizes in the two investigated soils after incubation at three different temperatures for 24 h. Results for agricultural soils are shown in panels (a), (c), and (e). Forest soils are shown in panels (b), (d), and (f). Microbial biomass C is shown in panels (a) and (b), iDNA contents are shown in panels (c) and (d), and eDNA contents are shown in panels (e) and (f). Statistically significant differences between pool sizes at the three investigated temperatures are marked with different letters above the violin plots.
Mass-specific respiration increased in both soils from 20 °C over 30 to 45 °C (Fig. 3a), confirming previous findings of other studies (Birgander et al., 2018; Cruz-Paredes et al., 2021; Rousk et al., 2012). Mass-specific gross growth did not change with temperature in agricultural soils but increased from 20 to 30 °C and even to 45 °C in forest soils (Fig. 3b). This is in contrast to previous studies (Birgander et al., 2018; Cruz-Paredes et al., 2021; Rousk et al., 2012), which found that microbial uptake of leucine in microbial biomass and acetate in fungal ergosterol, which were used as indicators of growth, showed a clear temperature optimum around 30 °C and concomitant decrease at higher temperatures. These studies, however, used other methods than we did, under the assumption of no net decrease in microbial biomass and equal rates of microbial growth or uptake and microbial death. While our data also show no mass-specific net change in microbial biomass from 20 to 30 °C, a significant negative mass-specific net growth was observed at 45 °C in both soils (Fig. 3c). When we subtracted mass-specific gross growth from mass-specific net growth, the calculated microbial death rates were significantly higher at 45 °C than at 20 and 30 °C in both soils (Fig. 3d).
Carbon use efficiency decreased with increasing temperature in forest soil, while it stayed constant in agricultural soils (Fig. 3e). This finding adds to an ever-growing list of ambiguous reactions of CUE with soil temperature (e.g., Hagerty et al., 2014; Schnecker et al., 2023b; Simon et al., 2020; Walker et al., 2018), and it once again shows that CUE should be used with caution to infer soil C cycling. As showcased in our experiment, CUE was low at high temperatures in forest soils while growth and death rates were high, thereby indicating fast microbial C cycling.
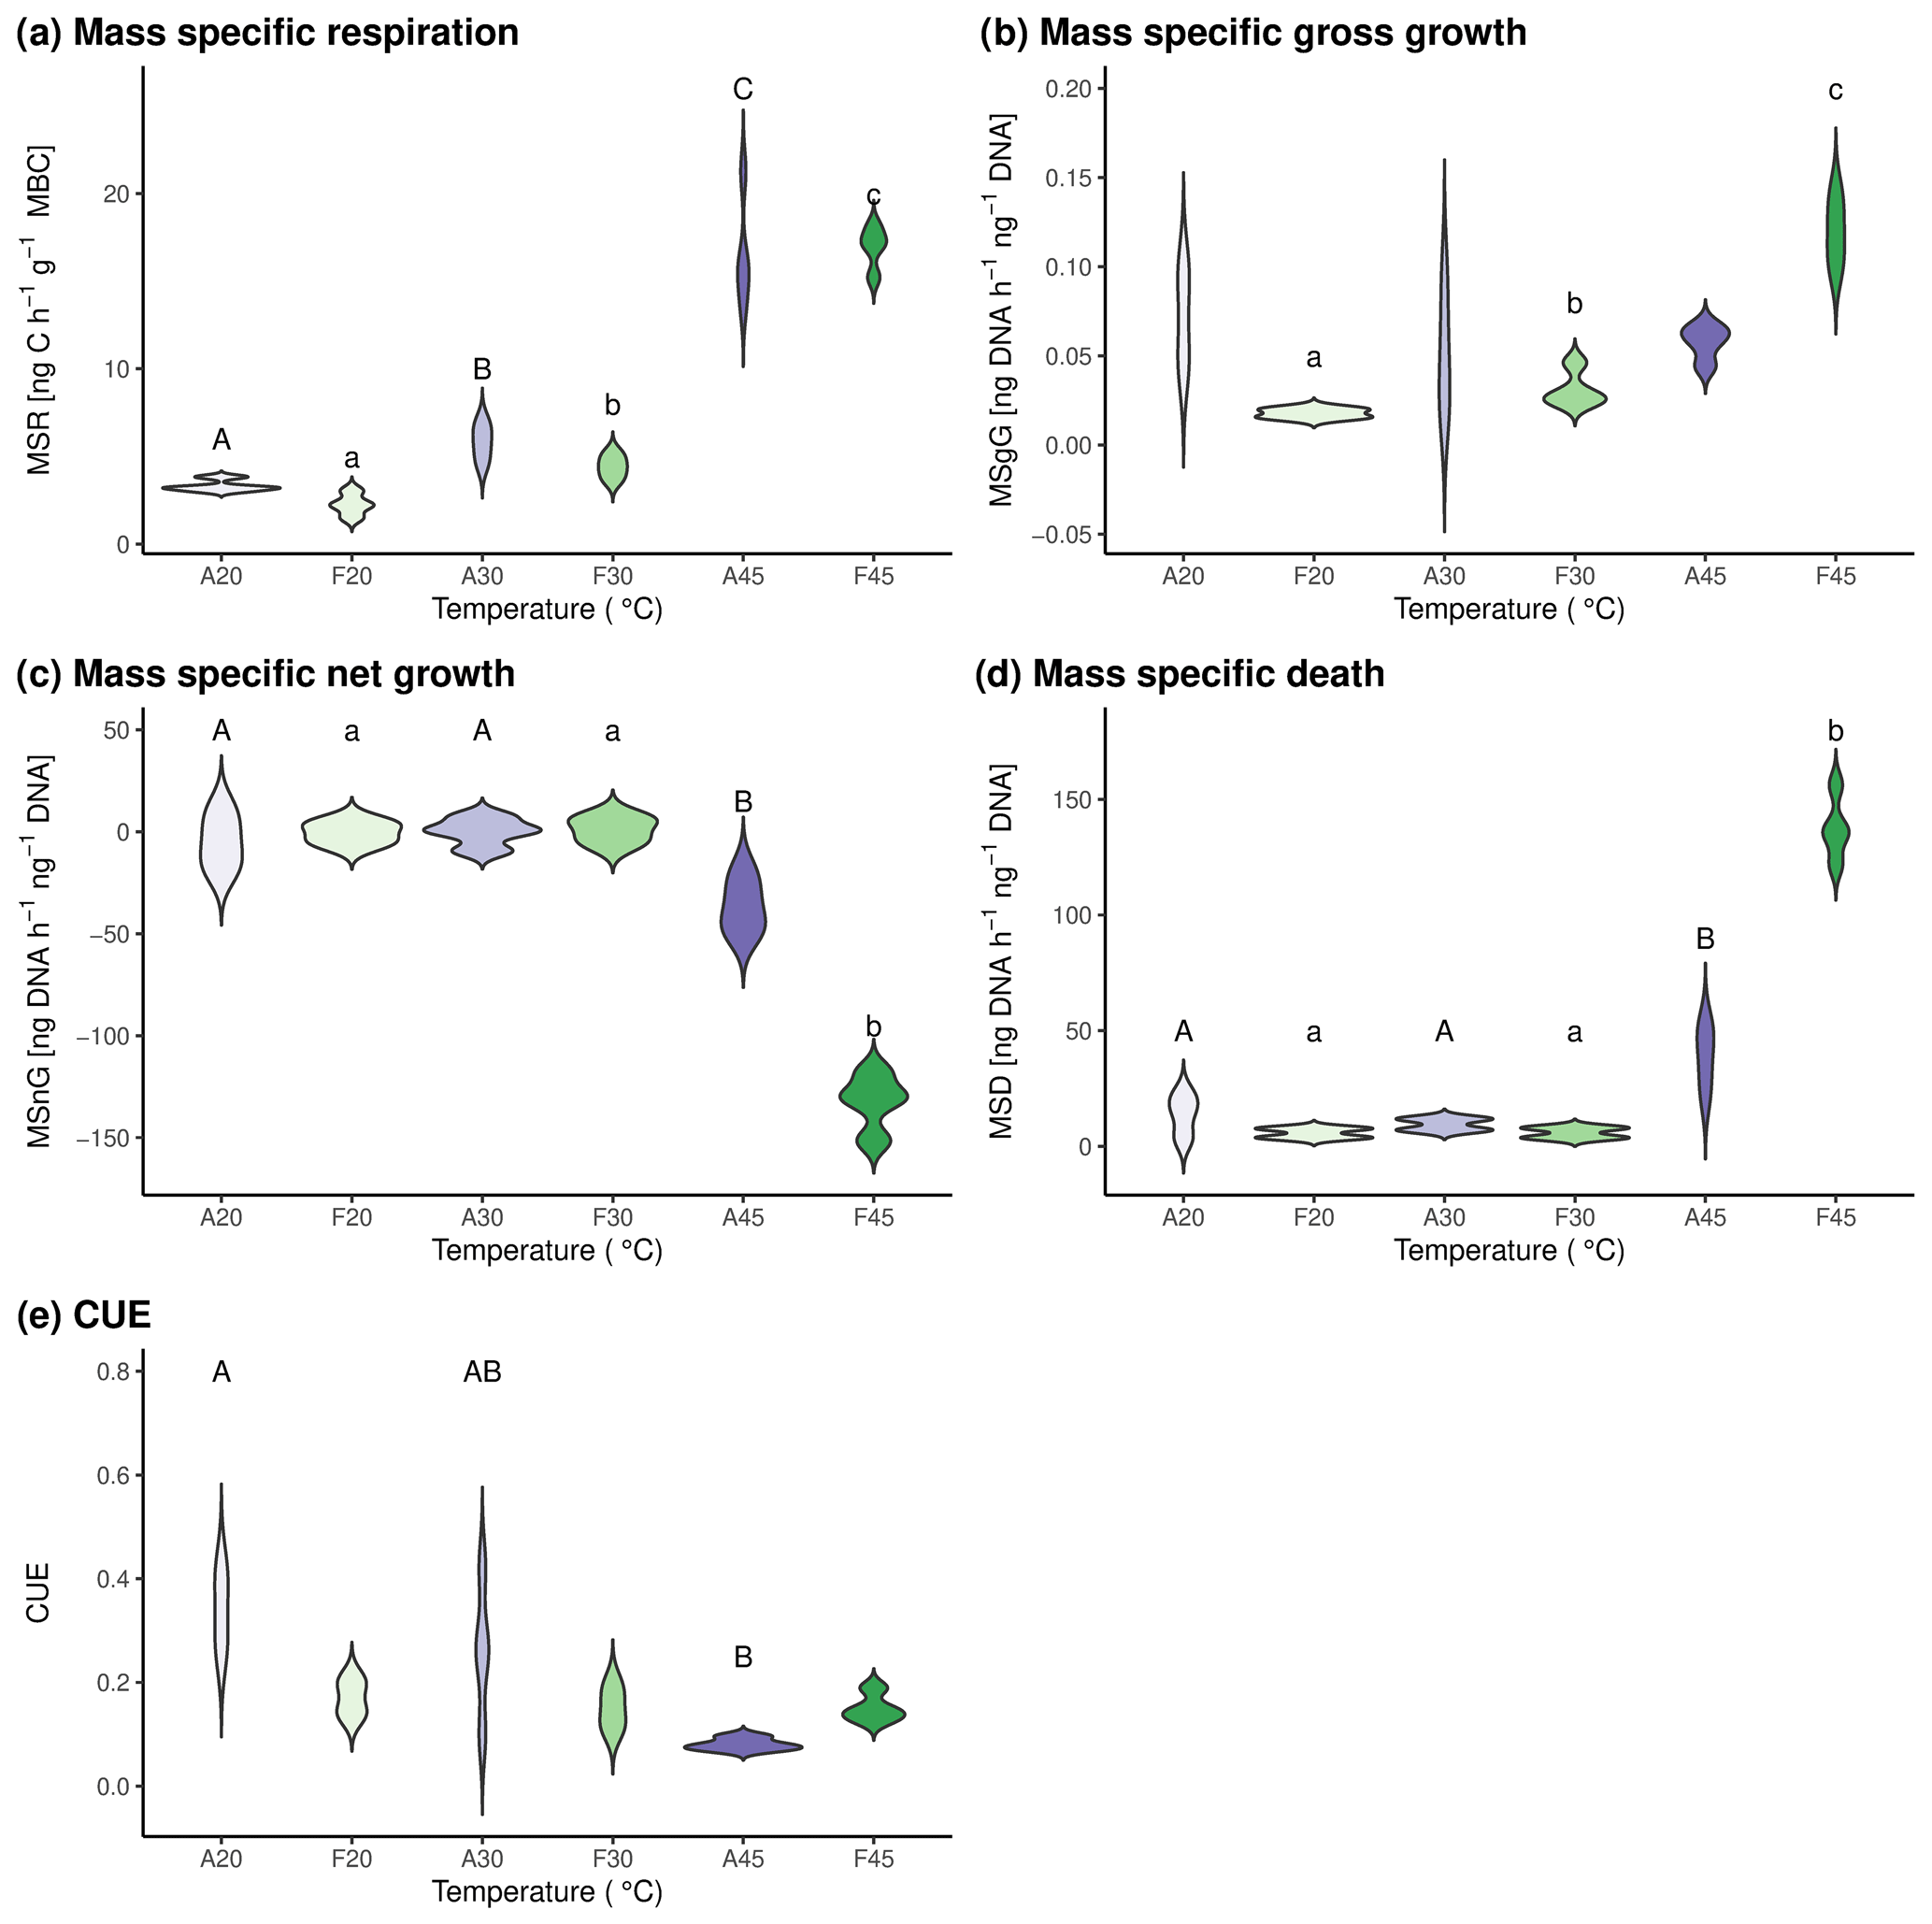
Figure 3Mass-specific microbial process rates and CUE in the two investigated soils after incubation at three different temperatures for 24 h. Results for agricultural soils are shown in purple hues and for forest soils in green hues. A20, A30, and A45 indicate agricultural soils incubated at 20, 30, and 45 °C, respectively. F20, F30, and F45 indicate forest soils incubated at 20, 30, and 45 °C, respectively. Statistically significant differences between pool sizes at the three investigated temperatures and respective soils are marked with different letters above the violin plots. Capital letters are used for differences between agricultural soils, whereas lowercase letters are used to indicate differences between forest soil.
3.4 Caveats and the potential of the approach
To our knowledge, this is the first attempt to combine 18O labeling of DNA to measure microbial growth and sequential DNA extraction to determine microbial death rates. Both of these methods have their individual caveats and biases. Growth measurements depend on extractions of DNA and MBC. These extractions have varying efficiencies, depending on, for example, soil type, fungal–bacterial ratios and much more (Pold et al., 2020). Sequential extraction methods to extract eDNA often have to use rather large amounts of soil to capture the low amounts of eDNA. In our approach, we had to accept tradeoffs between how practical our method would be (e.g., using commercially available soil extraction kits) and how precise it is (e.g., using less soil). And while there is room to improve both methods individually as well as the combination of them, we think that our approach provides a first step in doing this. We hope that our approach will be picked up by the scientific community and will be developed further to improve practicality and precision, especially since we have only taken a first glimpse at its potential. Besides determination of growth and death, this method could be used to study eDNA and iDNA dynamics separately, which could help understand exudation but also degradation and recycling of eDNA as well as the formation of microbial necromass and extracellular polymeric substance in soils.
In conclusion, we here present an approach to determine microbial death rates and turnover by accounting for eDNA dynamics. To our knowledge, this is the first time that microbial death rates were investigated in addition to microbial growth rates and net changes in microbial iDNA. With this approach, we could show that microbial respiration and microbial growth in the two investigated soils increase with temperature, even up to 45 °C, a temperature that is considered to be way beyond the temperature optimum of most temperate microbial communities. The often-observed drop in microbial growth or uptake at high temperatures was, however, caused by the death of a significant part of the microbial community and higher microbial death rates. While there is certainly room for improving the method and the necessity to investigate its feasibility in other soil systems and under different environmental conditions, we think that this approach will help to shed light on the role of microbial death in soils and is a step forward to understand soil C cycling.
R scripts generated in this study are available from the corresponding authors upon reasonable request.
The data generated in this study are available from the corresponding authors upon reasonable request.
The supplement related to this article is available online at: https://doi.org/10.5194/soil-10-521-2024-supplement.
JS: conceptualization (lead); investigation (supporting); methodology (supporting); supervision (lead); formal analysis (lead); writing (original draft) (lead) and writing (review and editing) (equal). TB: investigation (equal); methodology (equal); writing (review and editing) (equal). JH: investigation (equal); methodology (equal); writing (review and editing) (equal). VM: investigation (supporting); methodology (supporting); writing (review and editing) (equal). TS: resources (equal); writing (review and editing) (equal). HS: resources (equal); writing (review and editing) (equal).
The contact author has declared that none of the authors has any competing interests.
Publisher’s note: Copernicus Publications remains neutral with regard to jurisdictional claims made in the text, published maps, institutional affiliations, or any other geographical representation in this paper. While Copernicus Publications makes every effort to include appropriate place names, the final responsibility lies with the authors.
This research acknowledges the Austrian Science Fund (FWF TAI 328). We thank Sophie Zechmeister-Boltenstern, University of Natural Resources and Life Sciences, Vienna, for granting access to the field site.
This research has been supported by the Austrian Science Fund (grant no. TAI 328).
This paper was edited by Ember Morrissey and reviewed by three anonymous referees.
Ascher, J., Ceccherini, M. T., Pantani, O. L., Agnelli, A., Borgogni, F., Guerri, G., Nannipieri, P., and Pietramellara, G.: Sequential extraction and genetic fingerprinting of a forest soil metagenome, Appl. Soil Ecol., 42, 176–181, https://doi.org/10.1016/j.apsoil.2009.03.005, 2009.
Bååth, E.: Estimation of fungal growth rates in soil using 14C-acetate incorporation into ergosterol, Soil Biol. Biochem., 33, 2011–2018, https://doi.org/10.1016/S0038-0717(01)00137-7, 2001.
Birgander, J., Olsson, P. A., and Rousk, J.: The responses of microbial temperature relationships to seasonal change and winter warming in a temperate grassland, Glob. Change Biol., 24, 3357–3367, https://doi.org/10.1111/gcb.14060, 2018.
Blazewicz, S. J. and Schwartz, E.: Dynamics of 18O Incorporation from H2 18O into Soil Microbial DNA, Microb. Ecol., 61, 911–916, https://doi.org/10.1007/s00248-011-9826-7, 2011.
Brookes, P. C., Landman, A., Pruden, G., and Jenkinson, D. S.: Chloroform fumigation and the release of soil nitrogen: A rapid direct extraction method to measure microbial biomass nitrogen in soil, Soil Biol. Biochem., 17, 837–842, https://doi.org/10.1016/0038-0717(85)90144-0, 1985.
Cai, P., Sun, X., Wu, Y., Gao, C., Mortimer, M., Holden, P. A., Redmile-Gordon, M., and Huang, Q.: Soil biofilms: microbial interactions, challenges, and advanced techniques for ex-situ characterization, Soil Ecol. Lett., 1, 85–93, https://doi.org/10.1007/s42832-019-0017-7, 2019.
Canarini, A., Wanek, W., Watzka, M., Sandén, T., Spiegel, H., Šantrůček, J., and Schnecker, J.: Quantifying microbial growth and carbon use efficiency in dry soil environments via 18O water vapor equilibration, Glob. Change Biol., 26, 5333–5341, https://doi.org/10.1111/gcb.15168, 2020.
Carini, P., Marsden, P. J., Leff, J. W., Morgan, E. E., Strickland, M. S., and Fierer, N.: Relic DNA is abundant in soil and obscures estimates of soil microbial diversity, Nat. Microbiol., 2, 16242, https://doi.org/10.1038/nmicrobiol.2016.242, 2016.
Cruz-Paredes, C., Tájmel, D., and Rousk, J.: Can moisture affect temperature dependences of microbial growth and respiration?, Soil Biol. Biochem., 156, 108223, https://doi.org/10.1016/j.soilbio.2021.108223, 2021.
Das, T., Sehar, S., and Manefield, M.: The roles of extracellular DNA in the structural integrity of extracellular polymeric substance and bacterial biofilm development: The roles of eDNA in the bacterial biofilm development, Env. Microbiol. Rep., 5, 778–786, https://doi.org/10.1111/1758-2229.12085, 2013.
Frey, S. D., Lee, J., Melillo, J. M., and Six, J.: The temperature response of soil microbial efficiency and its feedback to climate, Nat. Clim. Change, 3, 395–398, https://doi.org/10.1038/nclimate1796, 2013.
Hagerty, S. B., Van Groenigen, K. J., Allison, S. D., Hungate, B. A., Schwartz, E., Koch, G. W., Kolka, R. K., and Dijkstra, P.: Accelerated microbial turnover but constant growth efficiency with warming in soil, Nat. Clim. Change, 4, 903–906, https://doi.org/10.1038/nclimate2361, 2014.
Hungate, B. A., Mau, R. L., Schwartz, E., Gregory Caporaso, J., Dijkstra, P., van Gestel, N., Koch, B. J., Liu, C. M., McHugh, T. A., Marks, J. C., Morrissey, E. M., and Price, L. B.: Quantitative microbial ecology through stable isotope probing, Appl. Environ. Microbiol., 81, 7570–7581, https://doi.org/10.1128/AEM.02280-15, 2015.
Kallenbach, C. M., Frey, S. D., and Grandy, A. S.: Direct evidence for microbial-derived soil organic matter formation and its ecophysiological controls, Nat. Commun., 7, 13630, https://doi.org/10.1038/ncomms13630, 2016.
Leitner, S., Sae-Tun, O., Kranzinger, L., Zechmeister-Boltenstern, S., and Zimmermann, M.: Contribution of litter layer to soil greenhouse gas emissions in a temperate beech forest, Plant Soil, 403, 455–469, https://doi.org/10.1007/s11104-015-2771-3, 2016.
Lennon, J. T., Muscarella, M. E., Placella, S. A., and Lehmkuhl, B. K.: How, When, and Where Relic DNA Affects Microbial Diversity, mBio, 9, e00637-18, https://doi.org/10.1128/mBio.00637-18, 2018.
Liang, C., Schimel, J. P., and Jastrow, J. D.: The importance of anabolism in microbial control over soil carbon storage, Nat. Microbiol., 2, 17105, https://doi.org/10.1038/nmicrobiol.2017.105, 2017.
Manzoni, S., Taylor, P., Richter, A., Porporato, A., and Agren, G. I.: Environmental and stoichiometric controls on microbial carbon-use efficiency in soils, New Phytol., 196, 79–91, https://doi.org/10.1111/j.1469-8137.2012.04225.x, 2012.
Metze, D., Schnecker, J., Canarini, A., Fuchslueger, L., Koch, B. J., Stone, B. W., Hungate, B. A., Hausmann, B., Schmidt, H., Schaumberger, A., Bahn, M., Kaiser, C., and Richter, A.: Microbial growth under drought is confined to distinct taxa and modified by potential future climate conditions, Nat. Commun., 14, 5895, https://doi.org/10.1038/s41467-023-41524-y, 2023.
Miltner, A., Bombach, P., Schmidt-Brücken, B., and Kästner, M.: SOM genesis: microbial biomass as a significant source, Biogeochemistry, 111, 41–55, https://doi.org/10.1007/s10533-011-9658-z, 2012.
Nagler, M., Podmirseg, S. M., Griffith, G. W., Insam, H., and Ascher-Jenull, J.: The use of extracellular DNA as a proxy for specific microbial activity, Appl. Microbiol. Biotechnol., 102, 2885–2898, https://doi.org/10.1007/s00253-018-8786-y, 2018.
Nagler, M., Podmirseg, S. M., Mayr, M., Ascher-Jenull, J., and Insam, H.: Quantities of Intra- and Extracellular DNA Reveal Information About Activity and Physiological State of Methanogenic Archaea, Front. Microbiol., 11, 1894, https://doi.org/10.3389/fmicb.2020.01894, 2020.
Nottingham, A. T., Bååth, E., Reischke, S., Salinas, N., and Meir, P.: Adaptation of soil microbial growth to temperature: Using a tropical elevation gradient to predict future changes, Glob. Change Biol., 25, 827–838, https://doi.org/10.1111/gcb.14502, 2019.
Pietramellara, G., Ascher, J., Borgogni, F., Ceccherini, M. T., Guerri, G., and Nannipieri, P.: Extracellular DNA in soil and sediment: fate and ecological relevance, Biol. Fertil. Soil., 45, 219–235, https://doi.org/10.1007/s00374-008-0345-8, 2009.
Pinheiro, J., Bates, D., DebRoy, S., Sarkar, D., and Team., R. C.: nlme: Linear and nonlinear mixed effects models, R package version 3.1-142, https://cran.r-project.org/package=nlme (last access: 15 May 2024), 2021.
Pold, G., Domeignoz-Horta, L. A., and DeAngelis, K. M.: Heavy and wet: The consequences of violating assumptions of measuring soil microbial growth efficiency using the 18O water method, Elem. Sci. Anth., 8, 069, https://doi.org/10.1525/elementa.069, 2020.
Prommer, J., Walker, T. W. N., Wanek, W., Braun, J., Zezula, D., Hu, Y., Hofhansl, F., and Richter, A.: Increased microbial growth, biomass, and turnover drive soil organic carbon accumulation at higher plant diversity, Glob. Change Biol., 26, 669–681, https://doi.org/10.1111/gcb.14777, 2020.
R Development Core Team: R: A language and environment for statistical computing, http://www.r-project.org/ (last access: 15 May 2024), 2013.
Riah-Anglet, W., Trinsoutrot-Gattin, I., Martin-Laurent, F., Laroche-Ajzenberg, E., Norini, M.-P., Latour, X., and Laval, K.: Soil microbial community structure and function relationships: A heat stress experiment, Appl. Soil Ecol., 86, 121–130, https://doi.org/10.1016/j.apsoil.2014.10.001, 2015.
Rousk, J. and Bååth, E.: Fungal and bacterial growth in soil with plant materials of different ratios: Fungal and bacterial growth with plant materials in soil, FEMS Microbiol. Ecol., 62, 258–267, https://doi.org/10.1111/j.1574-6941.2007.00398.x, 2007.
Rousk, J., Frey, S. D., and Bååth, E.: Temperature adaptation of bacterial communities in experimentally warmed forest soils, Glob. Change Biol., 18, 3252–3258, https://doi.org/10.1111/j.1365-2486.2012.02764.x, 2012.
Scharlemann, J. P., Tanner, E. V., Hiederer, R., and Kapos, V.: Global soil carbon: understanding and managing the largest terrestrial carbon pool, Carbon Manag., 5, 81–91, https://doi.org/10.4155/cmt.13.77, 2014.
Schnecker, J., Baldaszti, L., Gündler, P., Pleitner, M., Sandén, T., Simon, E., Spiegel, F., Spiegel, H., Urbina Malo, C., Zechmeister-Boltenstern, S., and Richter, A.: Seasonal dynamics of soil microbial growth, respiration, biomass, and carbon use efficiency in temperate soils, Geoderma, 440, 116693, https://doi.org/10.1016/j.geoderma.2023.116693, 2023a.
Schnecker, J., Spiegel, F., Li, Y., Richter, A., Sandén, T., Spiegel, H., Zechmeister-Boltenstern, S., and Fuchslueger, L.: Microbial responses to soil cooling might explain increases in microbial biomass in winter, Biogeochemistry, 164, 521–535, https://doi.org/10.1007/s10533-023-01050-x, 2023b.
Simon, E., Canarini, A., Martin, V., Séneca, J., Böckle, T., Reinthaler, D., Pötsch, E. M., Piepho, H.-P., Bahn, M., Wanek, W., and Richter, A.: Microbial growth and carbon use efficiency show seasonal responses in a multifactorial climate change experiment, Commun. Biol., 3, 584, https://doi.org/10.1038/s42003-020-01317-1, 2020.
Sokol, N. W., Slessarev, E., Marschmann, G. L., Nicolas, A., Blazewicz, S. J., Brodie, E. L., Firestone, M. K., Foley, M. M., Hestrin, R., Hungate, B. A., Koch, B. J., Stone, B. W., Sullivan, M. B., Zablocki, O., LLNL Soil Microbiome Consortium, Trubl, G., McFarlane, K., Stuart, R., Nuccio, E., Weber, P., Jiao, Y., Zavarin, M., Kimbrel, J., Morrison, K., Adhikari, D., Bhattacharaya, A., Nico, P., Tang, J., Didonato, N., Paša-Tolić, L., Greenlon, A., Sieradzki, E. T., Dijkstra, P., Schwartz, E., Sachdeva, R., Banfield, J., and Pett-Ridge, J.: Life and death in the soil microbiome: how ecological processes influence biogeochemistry, Nat. Rev. Microbiol., 20, 415–430, https://doi.org/10.1038/s41579-022-00695-z, 2022.
Spiegel, H., Sandén, T., Dersch, G., Baumgarten, A., Gründling, R., and Franko, U.: Chap. 17 – Soil Organic Matter and Nutrient Dynamics Following Different Management of Crop Residues at Two Sites in Austria, edited by: Muñoz, M. Á., Zornoza, R. B. T.-S. M., and Change, C., Academic Press, 253–265, https://doi.org/10.1016/B978-0-12-812128-3.00017-3, 2018.
Spohn, M., Klaus, K., Wanek, W., and Richter, A.: Microbial carbon use efficiency and biomass turnover times depending on soil depth – Implications for carbon cycling, Soil Biol. Biochem., 96, 74–81, https://doi.org/10.1016/j.soilbio.2016.01.016, 2016.
Walker, T. W. N., Kaiser, C., Strasser, F., Herbold, C. W., Leblans, N. I. W., Woebken, D., Janssens, I. A., Sigurdsson, B. D., and Richter, A.: Microbial temperature sensitivity and biomass change explain soil carbon loss with warming, Nat. Clim. Change, 8, 885–889, https://doi.org/10.1038/s41558-018-0259-x, 2018.
Wu, J., Joergensen, R. G., Pommerening, B., Chaussod, R., and Brookes, P.C.: Measurement of soil microbial biomass C by fumigation-extraction – an automated procedure, Soil Biol. Biochem., 22, 1167–1169, https://doi.org/10.1016/0038-0717(90)90046-3, 1990.
Zheng, Q., Hu, Y., Zhang, S., Noll, L., Böckle, T., Richter, A., and Wanek, W.: Growth explains microbial carbon use efficiency across soils differing in land use and geology, Soil Biol. Biochem., 128, 45–55, https://doi.org/10.1016/j.soilbio.2018.10.006, 2019.