the Creative Commons Attribution 4.0 License.
the Creative Commons Attribution 4.0 License.
 | 11 Apr 2024
Unraveling biogeographical patterns and environmental drivers of soil fungal diversity at the French national scale
Christophe Djemiel
Samuel Dequiedt
Walid Horrigue
Arthur Bailly
Mélanie Lelièvre
Julie Tripied
Charles Guilland
Solène Perrin
Gwendoline Comment
Nicolas P. A. Saby
Claudy Jolivet
Antonio Bispo
Line Boulonne
Antoine Pierart
Patrick Wincker
Corinne Cruaud
Pierre-Alain Maron
Sébastien Terrat
Lionel Ranjard
The fungal kingdom is among the most diversified kingdoms on Earth, with estimations of up to 12 million species. However, it remains poorly understood, with only 150 000 fungal species currently described. Given the major ecological role of fungi in ecosystem functioning, these numbers stress the importance of investigating fungal diversity description across different ecosystem types. Here, we explored the spatial distribution of the soil fungal diversity on a broad geographical scale, using the French Soil Quality Monitoring Network that covers the whole French territory (2171 soils sampled along a systematic grid). Fungal alpha diversity was assessed directly from soil DNA using a meta-barcoding approach by targeting the 18S rDNA gene. The total accumulated fungal diversity across France included 136 219 operational taxonomic units (OTUs), i.e., about 1 % of worldwide soil fungal diversity (based on a maximum diversity estimate of 12 million) for a territory representing only 0.3 % of the terrestrial surface on Earth. Based on this dataset, the first extensive map of fungal alpha diversity was drawn and showed a heterogeneous and spatially structured distribution in large biogeographical patterns of 231 km radius for richness (Hill diversity of order 0) and smaller patterns of 36 km radius for dominant fungi (Hill diversity of order 2). As related to other environmental parameters, the spatial distribution of fungal diversity (Hill numbers based on different orders of diversity) was mainly influenced by local filters such as soil characteristics and land management and also by global filters such as climate conditions with various relative influences. Interestingly, cropped soils exhibited the highest pool of fungal diversity relative to forest and vineyard soils. To complement this, soil fungal OTU network interactions were calculated for the different land uses across France. They varied hugely and showed a loss of 75 % of the complexity in crop systems and grasslands compared to forests and up to 83 % in vineyard systems. Overall, our study revealed that a nationwide survey with a high spatial-resolution approach is relevant for deeply investigating the spatial distribution and determinism of soil fungal diversity. Our findings provide novel insights for a better understanding of soil fungal ecology across the 18S rDNA gene and upgrade biodiversity conservation policies by supplying representative repositories dedicated to soil fungi.
- Article
(6981 KB) - Full-text XML
-
Supplement
(1848 KB) - BibTeX
- EndNote


The fungal kingdom has been evolving continuously for more than 800×106 years to adapt to and colonize a large number of habitats on Earth (Loron et al., 2019; Naranjo-Ortiz and Gabaldón, 2019; Li et al., 2021; Bonneville et al., 2020; Berbee et al., 2020). This heterotrophic kingdom represents about 2 % of the global biomass on Earth (Bar-On et al., 2018) and is among the most diverse kingdoms in the Eukaryota domain (Mora et al., 2011; Blackwell, 2011; Taylor et al., 2014; Hawksworth and Lücking, 2017). Recent extrapolations, based on environmental DNA characterization using a meta-barcoding approach with mainly the internal transcribed spacer (ITS), evaluated that the total number of fungal taxa ranged from 6.28 million to 12 million (Baldrian et al., 2022; Wu et al., 2019; Phukhamsakda et al., 2022). To date, only 150 000 fungal species have been described by the scientific community (Species Fungorum 2022, http://www.speciesfungorum.org/Names/Names.asp), i.e., only 1.25 %–2.4 % of the whole estimated fungal diversity.
The majority of fungi are found in terrestrial ecosystems, especially in soils; only 4000 extant fungi from freshwater habitats are presently listed (Calabon et al., 2022). Fungi play crucial ecological roles in soils by contributing to their proper functioning due to a wide range of functional guilds (Bar-On et al., 2018; Frac et al., 2018). Fungi are keystones of the soil food web, both in biogeochemical cycles and in interactions with other macro- and micro-organisms (de Vries et al., 2013; Treseder and Lennon, 2015; Hannula and Träger, 2020). The functions of fungal communities provide many ecosystem services that promote mineral nutrition of plants linked to soil organic-matter turnover and phosphorus and nitrogen availability (Miyauchi et al., 2020; Ward et al., 2022). They are important decomposers (saprotrophs) of organic matter: they break down complex biopolymers and play a key role in organic-matter recycling (Hage and Rosso, 2021). Regarding symbiotic interactions, there are no less than 50 000 mycorrhizal fungi interacting with 340 000 land plants representing 90 % of beneficial symbiosis with a host plant association (Genre et al., 2020). Fungal pathogens and parasites can cause diseases and important crop losses and have a significant economic impact (Möller and Stukenbrock, 2017; Fausto et al., 2019). Some of them are also identified as biocontrol agents and are involved in plant protection through the regulation of pathogenic microorganisms and insect pests (Peng et al., 2021). Fungi are also known as ecosystem engineers contributing to soil aggregation and maintenance. Thus, the stability of the soil structure largely depends on mycelium density and the pool of fungal enzymatic activities (Lehmann et al., 2020).
The spatial distribution of fungal diversity has been studied more in recent times but less than the spatial distribution of bacterial diversity, in particular when it comes to identifying and ranking the local and global filters that influence species richness (Griffiths et al., 2011; Terrat et al., 2017; Fierer and Jackson, 2006; Delgado-Baquerizo et al., 2018; Ranjard et al., 2013; Tedersoo et al., 2021). In 2014, Tedersoo and collaborators generated the first global map of fungal richness by using the ITS marker and revealed that fungi are spatially structured and exhibit biogeographical patterns (Tedersoo et al., 2014). One major hotspot of fungal diversity was located in Latin America and a cold spot in the Sahel region, whereas fungal diversity distribution was shown to be homogeneous across Europe. A second global map of fungal diversity was drawn from a meta-analysis of the Chao index (Větrovský et al., 2019). Conversely to Tedersoo et al. (2014), this highlighted a lower fungal diversity in Latin America and a higher one in northern Africa (Větrovský et al., 2019). In parallel, Ma and collaborators (Ma et al., 2017) revealed a heterogeneous spatial distribution according to a gradient of forest soils at the continental scale in eastern China. These differences and even discrepancies in the location of biogeographical patterns at a global scale reflect the huge gap of knowledge regarding fungal diversity distribution and the need to complete these studies with high-resolution approaches at a finer scale.
Soil fungal communities are constantly subjected to natural biotic and abiotic stresses and also to human activities through global warming, deforestation, and land use intensification. These stresses altogether have a significant influence on fungal abundance, diversity, and community assembly and lead to an overall impact on soil functions (Pärtel et al., 2017; Geisen et al., 2019; Thomson et al., 2015; Tsiafouli et al., 2015; Shi et al., 2019). Several large- and small-scale studies showed that fungal richness is driven by land uses, edaphic factors, climate conditions, and spatial descriptors (Ma et al., 2017; Větrovský et al., 2019; George et al., 2019a). Farming practices on cropped soils such as tillage, fertilization, or crop rotation can have an influence on fungal diversity (Sommermann et al., 2018; Sadet-Bourgeteau et al., 2019; Stefan et al., 2021; Finn et al., 2021; Tedersoo et al., 2014) or not (Lentendu et al., 2014). Altogether, soil pH emerges as the strongest driver of fungal alpha diversity, similar to bacteria at global or territorial scales (Delgado-Baquerizo et al., 2018; Terrat et al., 2017). Some studies indicate a positive effect of soil pH on fungal richness at the national (George et al., 2019b) and global (Bastida et al., 2021) scales, whereas others show a negative effect on a global scale (Tedersoo et al., 2014). In 2020, Tedersoo and collaborators also proposed a unimodal relationship between soil pH and fungal richness or Shannon diversity (Tedersoo et al., 2020). Fungal richness also appears higher in fine soil textures than in coarse soil textures (George et al., 2019b). In the same vein, plant cover – especially increased tree richness – shows a positive impact on fungal richness and Shannon diversity (Tedersoo et al., 2020). Soil carbon is also an important driver of fungal diversity, with a positive (Maestre et al., 2015; Yang et al., 2019; Bastida et al., 2021) or negative effect (George et al., 2019b), depending on the territory studied, the scale investigated, and the molecular marker used. Other findings show that soil calcium and phosphorus, the C : N ratio, bulk density, some spatial descriptors (e.g., latitude, longitude, altitude), and climate conditions also have an influence on fungal alpha diversity (Maestre et al., 2015; Bastida et al., 2021; Tedersoo et al., 2014).
In the face of these discrepancies and given the essential role of fungi for ecosystem functioning and sustainability, it is essential to deeply characterize soil fungal diversity – in terms of alpha and beta diversity – using the most recent molecular and high-throughput methods to better decipher the impacts of global and local filters (Chu et al., 2020; Hyde, 2022). In this context, we investigated the French Soil Quality Monitoring Network (RMQS) using a meta-barcoding approach to determine the soil fungal diversity at a national scale. Based on a regular grid of 2171 sites across France, this survey captured the various land uses, climates, geomorphology types, and soil characteristics. Located in western Europe, France is the third-largest European country and exhibits the third-highest pedological diversity across the world according to the WRB classification (Minasny et al., 2010) and is also known to exhibit diversified land use and climate conditions (Ballabio et al., 2016; Karimi et al., 2020). Main land uses in France are dominated by croplands, grasslands, and forests. Climate conditions are also among the most diverse ones in Europe and organized into three major poles: oceanic, Mediterranean, and mountainous. All these facts lead us to conclude that France could be regarded as an ideal national-scale observatory for monitoring the variations in biotic and abiotic components of soil ecosystems. The RMQS soil sampling strategy is probably one of the most intensive and extensive national soil sampling strategies in the world, and this systematic random sampling leads to good spatial coverage profitable both for mapping soil characteristics and unraveling environmental variation. Using this soil survey, a substantial body of scientific knowledge on soil bacterial biogeography has been produced by the use of molecular tools (Ranjard et al., 2013; Terrat et al., 2017; Karimi et al., 2018, 2020), associated with several technical developments to standardize meta-barcoding, associated bioinformatics, and statistical analysis (Djemiel et al., 2020; Terrat et al., 2019, 2012).
Here, we explored the spatial distribution of the soil fungal communities on a broad geographical scale in order to better understand fungal diversity determinism according to environmental filters using high-throughput sequencing of the small 18S rDNA gene subunit directly amplified from soil DNA. In most studies, alpha diversity is characterized by one index. However, in order to obtain a global overview of fungal diversity in a biogeographical context, it is important to explore more deeply the distribution of rare and dominant taxa and to rank the influence of environmental filters in a deterministic process (Jousset et al., 2017; Rivett and Bell, 2018; Jiao and Lu, 2020). To reach this objective, we used Hill numbers to combine complementary diversity indexes such as richness, exponential Shannon diversity, and inverse Simpson. Methods based on spatial prediction (geostatistics) were applied to the data to map and explore the macro-ecological patterns of soil fungal diversity along the environmental gradients encountered in France. We used a set of environmental datasets – including soil physicochemical characteristics, climate conditions, and land use – to explain variations in soil fungal diversity and to rank the environmental filters structuring the spatial fungal distribution over a wide are. Finally, we compared the variations in fungal diversity across different land uses plus climate types with the variations in the complexity of the fungal interaction networks by inferring co-occurrence networks at the operational taxonomic unit (OTU) level.
2.1 Soil sampling design
Soils were sampled from 2171 locations across France between June 2000 and June 2009 as part of the RMQS setup to monitor the quality of French soils. As described previously (Ranjard et al., 2013), these sites included a wide range of land uses: forests (n=589), grasslands (n=537), crops (n=886), vineyards or orchards (n=65), and low-anthropization environments (n=94). They also include eight climatic regions: type 1 (n=284), type 2 (n=270), type 3 (n=545), type 4 (n=418), type 5 (n=265), type 6 (n=86), type 7 (n=94), and type 8 (n=95). In France, low-anthropization environments encompass wetlands, peatlands, sclerophyllous forests, natural grasslands, sparsely vegetated areas, and bare rocks (Karimi et al., 2020). Inside each of the 2171 cells of a regular 16 km × 16 km grid throughout France, a smaller 20 m × 20 m grid was used for sampling where 25 core samples of topsoil (approximately 0–30 cm depth) were taken. The core samples were pooled and homogenized to obtain a composite sample. The sampling protocols applied to the RMQS are available through the RMQS2 manual (Jolivet et al., 2022). Each sample was air-dried following a standardized procedure at 35 °C until the soil humidity was below 1 % and then sieved to 2 mm and separated into two subsamples. The first subsample was frozen at −40 °C for molecular analyses, while the second subsample was used for physicochemical analyses. A detailed description of the physicochemical analyses performed in this study (soil pH, texture, organic carbon, nitrogen, and phosphorus) is accessible from Jolivet et al. (2006). All the data are available in the dataverse GisSol (https://doi.org/10.15454/QSXKGA).
2.2 Molecular characterization of fungal communities
2.2.1 Soil DNA extraction
Soil DNA was extracted from 1 g of soil using the GnS-GII standard procedure (Terrat et al., 2012, 2015). Briefly, the soil underwent two lysis steps, i.e., mechanical lysis and chemical lysis. In both cases, the soil was ground and homogenized for 90 s with 2 g of 0.1 mm diameter silica beads, 2.5 g of 1.4 mm diameter ceramic beads, and four glass beads of 4 mm diameter in 5 mL of a mix solution containing 100 mM Tris-HCl (pH 8), 100 mM EDTA (pH 8), 100 mM NaCl, 2 % (wt vol) sodium dodecyl sulfate, and up to 2.5 mL ultrapure water using a Fast-Prep-24 classic kit. This was then incubated at 70 °C for 30 min. The mixture was centrifuged (7000 g, 20 °C, 5 min) to retrieve the lysate. A deproteinization step was necessary using 10 % of the volume with 3 M potassium acetate (pH 5.5) followed by a centrifugation step (14 000 g, 4 °C, 5 min) to recover the supernatant containing the soil DNA. DNA was precipitated using isopropanol at −20 °C and stored at −20 °C for 30 min. The last step consisted of washing the DNA pellet with ethanol and resuspending it in 200 µL of ultrapure water. Then, crude DNA was purified with NucleoSpin Soil kits following the manufacturer's instructions (NucleoSpin Soil, Macherey-Nagel). The purified DNA was quantified by fluorescence (QuantiFluor, Promega) using an Infinite® 200 PRO plate reader (Tecan) and then normalized to 1 ng µL−1.
2.2.2 Library preparation for sequencing
The V7–V8 regions of the fungal 18S rDNA gene were amplified from purified DNA using forward primer FR1 and reverse primer FF390 (Chemidlin Prévost-Bouré et al., 2011) with a two-step PCR. Both amplifications were carried out in a total volume of 25 µL using 1 to 5 ng of DNA, 4 µL of 5× HOT FIREPol® Blend Master Mix with 7.5 mM MgCl2 (Solis BioDyne, Tartu, Estonia), and 1 µL (10 µM) of each primer (Eurogentec). The first step amplified the target region under the following conditions: initial denaturation at 94 °C for 3 min, followed by 35 cycles of 94 °C for 30 s, 52 °C for 1 min, 72 °C for 1 min, and final extension at 72 °C for 5 min. The 18S PCR products were purified using an AMPure bead kit (Beckman) and quantified using a QuantiFluor staining kit (Promega, USA). The second amplification was performed to add barcodes for multiplexing samples. The conditions of the second PCR were similar, with a reduced number of cycles (seven) and a specific purification with a MinElute kit (Qiagen). Library preparation for the 2171 samples was conducted on the GenoSol platform; Illumina HiSeq 2 × 250 bp paired-end sequencing was conducted by Genoscope (Evry, France).
2.3 Bioinformatic analysis
We used the BIOCOM-PIPE v.20 pipeline (https://forgemia.inra.fr/biocom/biocom-pipe, last access: 21 February 2020) to process the 18S rRNA gene sequences (Djemiel et al., 2020). FASTQ paired-end raw reads were filtered with PRINSEQ to keep the good-quality sequences and then overlapped with FLASH to form contiguous reads. The libraries were demultiplexed and trimmed with zero difference between the barcode and primer sequences. The sequences were aligned with the Infernal tool based on RNA structures (Nawrocki and Eddy, 2013). Chimeras were removed by a “hunting–recovering” step specific to BIOCOM-PIPE (Djemiel et al., 2020). An additional step allowed us to check whether all our sequences were indeed affiliated with fungal sequences. Following this, a global clustering at 95 % similarity was performed with the cleaned sequences to cluster them into OTUs, followed by a post-clustering step with ReClustOR to improve the clustering (Terrat et al., 2019). All our diversity indices (geostatistical modeling, variance partitioning) and co-occurrence network analyses are performed with this OTU-based approach with a post-clustering step for consistency with the evaluations of fungal diversity generally described in the literature (Terrat et al., 2015; Karimi et al., 2019).
2.4 Statistical analysis
Hill numbers were calculated to estimate alpha diversity and compare samples on a linear scale to provide a complete interpretation of alpha diversity through different metrics. Hill numbers with q=0 corresponded to the OTU richness observed in a sample (emphasizing rare fungal OTUs), q=1 to the exponential Shannon diversity (corresponding to “typical” or “common” fungal OTUs), and q=2 to the inverse Simpson index (corresponding to dominant fungal OTUs) (Alberdi and Gilbert, 2019). We tested whether the variables were normally distributed or approximately so, using the shapiro.test function (R “stats” package). Depending on the result, we applied a Box–Cox transformation if the Gaussian assumption was not satisfied. To compute the Box–Cox transformation from the “forecast” R package (Hyndman et al., 2020), we estimated the lambda value with the BoxCox.lambda function and applied the transformation with the BoxCox function. Outliers were tracked using the grubbs.test function in the “outliers” R package (Komsta and Komsta, 2011) for each Hill number dataset. Once the outliers were removed, to estimate the multiple comparisons across the modalities (land uses or climate types), analyses of variance (ANOVAs) were used, and we verified the normality assumption of residuals. If this was satisfied, we used a least significant difference (LSD) test with an adjusted p value < 0.05; if it was not satisfied, we used a nonparametric test with the kruskal function from the “agricolae” package and a correction by the Bonferroni method for the multiple comparisons.
The details of the removed samples (i.e., the samples considered to be outliers and the “low-anthropization environment” samples that we decided to exclude) in the different land uses are available in Supplement Fig. S1, as recommended by Dini-Andreote et al. (2021), who developed a data management strategy with good practices for biogeographical studies.
The environmental data that did not follow a Gaussian distribution were log-transformed. Moreover, the soil pH covaries with land uses, with a majority of acidic soils in forests and a majority of neutral and basic soils in croplands and vineyards or orchards (Supplement Fig. S2). Therefore, we performed a polynomial transformation of degree 2 for the soil pH variable to improve the accuracy of fitting for the variance partitioning analysis.
The relationship between fungal alpha diversity and environmental filters was assessed using variance partitioning. Briefly, the first step consisted of reducing the effect of model collinearity to obtain the most parsimonious models. We used the vif function (the variance inflation factors – VIFs) in the “usdm” R package (Naimi, 2015) and kept the explanatory variables with VIF ≤ 5. A second filtering step was performed to determine the best environmental variables using the regsubset function (“leaps” R package, Lumley and Lumley, 2013) and based on the Bayesian information criterion (BIC) and adjusted R2. Lastly, we conducted a redundancy analysis (Legendre, 2018) to model variation in the overall environmental filters using the rda and ordiR2step functions (“vegan” R package, Oksanen et al., 2013). To select the best variables, we performed a forward multiple-regression selection to build a model maximizing the adjusted R2. We used the ordiR2step function with a maximum of 10 000 permutations and the anova.cca function (“vegan” R package) to evaluate the variance explained by the best explanatory environmental filtering variables.
Geostatistical modeling was used to assess the alpha-diversity spatial variations. We followed a standard approach as proposed in Granger et al. (2015). First, a variogram model was fitted to the experimental variogram computed using alpha diversity observed at the sample sites. Then, we predicted the unsampled locations by a global kriging approach that used all the points in the dataset (global neighborhood). We implemented this approach with the “gstat” R package (Bivand et al., 2015). We tried to fit various authorized variogram models and kept the one that minimized the objective function. Then, we used the results of leave-one-out cross-validation (LOOCV) to evaluate the performance of the best-fitted geostatistical model by computing the standardized squared prediction errors (Lark, 2002).
To obtain the information of the putative OTU richness across France, we computed the rarefaction (interpolation) and prediction (extrapolation) curves for fungal richness (q=0) using the R package “iNEXT” (Hsieh et al., 2016).
2.5 Fungal co-occurrence networks
We used the methodological analysis previously described in Karimi et al. (2020, 2019) to compute the fungal co-occurrence networks between land uses and climate types. Briefly, two main steps were required: (i) standardizing the number of soils (fixed at 60 samples for land uses and 83 for climate types) used to compute the networks per land use to avoid a sampling size effect and (ii) carrying out network repetitions (100 repetitions) to integrate the residual heterogeneity of the soils within each land use and climate type. Thus, the minimum number of combinations ensured that each network was computed from a unique combination of sites. Then, for each replicate, network computation was based on a contingency matrix of 136 219 fungal OTUs for the 60 or 83 randomly selected soil samples. The Spearman correlation coefficient for each pair of OTUs was used as a similarity index to estimate fungal OTU co-occurrence. A correlation was considered robust and non-random if the p value was below 0.06 after correction using the false discovery rate (FDR) method. To describe the topology of the networks, a set of metrics was calculated using the “statnet” package (Handcock et al., 2019), including the number of connected nodes, the proportion of connected nodes, the number of links, connectance, and the ratio between the positive and negative links. These metrics are defined in Karimi et al. (2017). We used a Kruskal–Wallis test with Bonferroni correction for the multiple comparisons of the fungal networks across land uses and climate types, using 100 repetitions. The median networks were mapped using Cytoscape software (v. 3.9.1) (Shannon et al., 2003).
3.1 Evaluation and extrapolation of fungal alpha diversity across France
Based on 18S rDNA amplicon sequencing to characterize the fungal diversity of the 2171 sampled soils, we obtained a total of 180 million raw sequences. The use of bioinformatic filters (in the BIOCOM-PIPE workflow) resulted in 2060 samples with sufficient high-quality data for the assessment of fungal communities. Regarding the cumulated fungal diversity from the whole of France, we identified 136 219 OTUs from the 2060 samples. Thanks to our intensive soil sampling strategy combined with in-depth sequencing, we obtained an extrapolated total value of 186 794 fungal OTUs (Fig. 1) at the national scale.
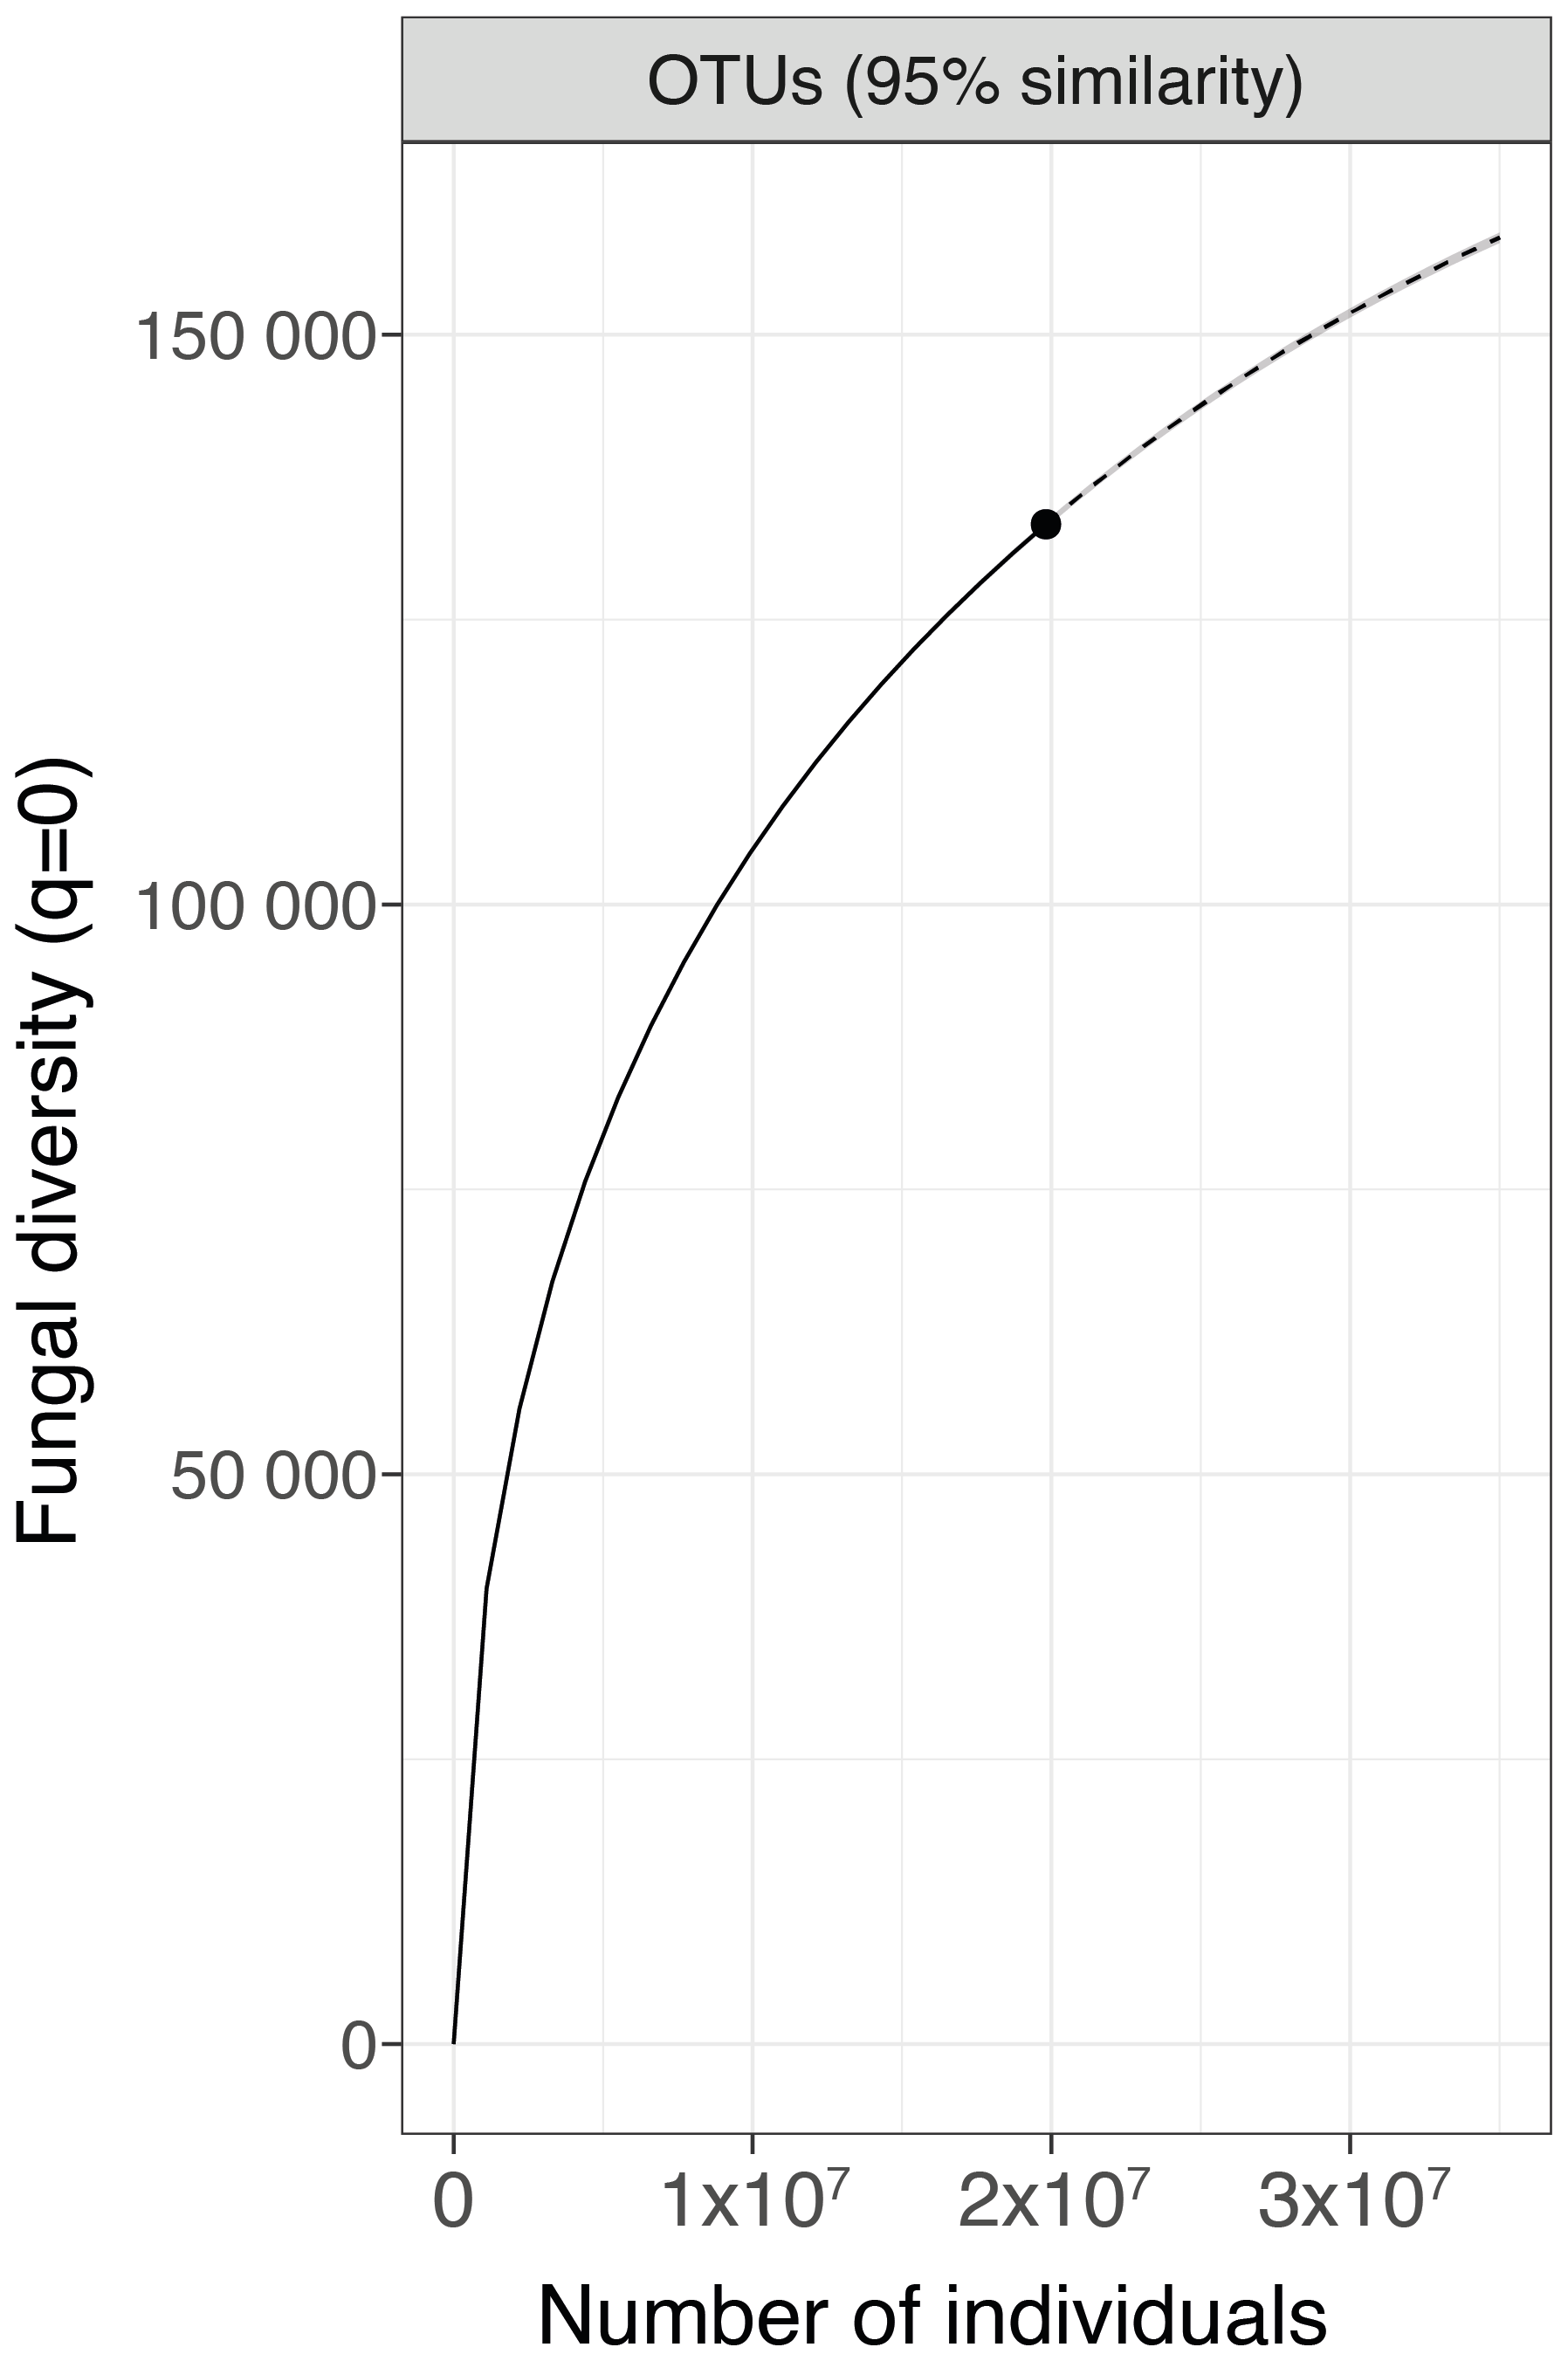
Figure 1Maximum number of fungal species expected across France based on OTUs. The analyses of fungal richness rarefaction (solid line segment) and extrapolation (dotted line segment) were performed with iNEXT.
3.2 Spatial distribution of fungal alpha diversity across France
We generated three national maps showing the soil fungal alpha diversity based on Hill numbers with orders of diversity of 0, 1, and 2 using a kriging interpolation approach (Fig. 2). The results of the LOOCV show very low R2 values equal to 0.058, 0.057, and 0.038 for q=0, q=1, and q=2, respectively. However, the median and mean of the squared standardizing prediction errors (SSPEs) are very close to the expected values (e.g., 0.45 or 1). The fitted variograms reveal different spatial structuring depending on the weighting of OTU relative abundances (Supplement Table S1). Thus, the predicted map of fungal richness (Hill diversity of order 0) exhibited a heterogeneous and spatially structured distribution with a large autocorrelation distance of an about 231 km radius (Fig. 2a, d). More or less wide regions with hot or cold spots of fungal diversity were observed. More specifically, soils from the northwest to the center of France support a high level of fungal richness, whereas soils from the northeast, the southeast, and the southwest support a lower level of fungal richness.
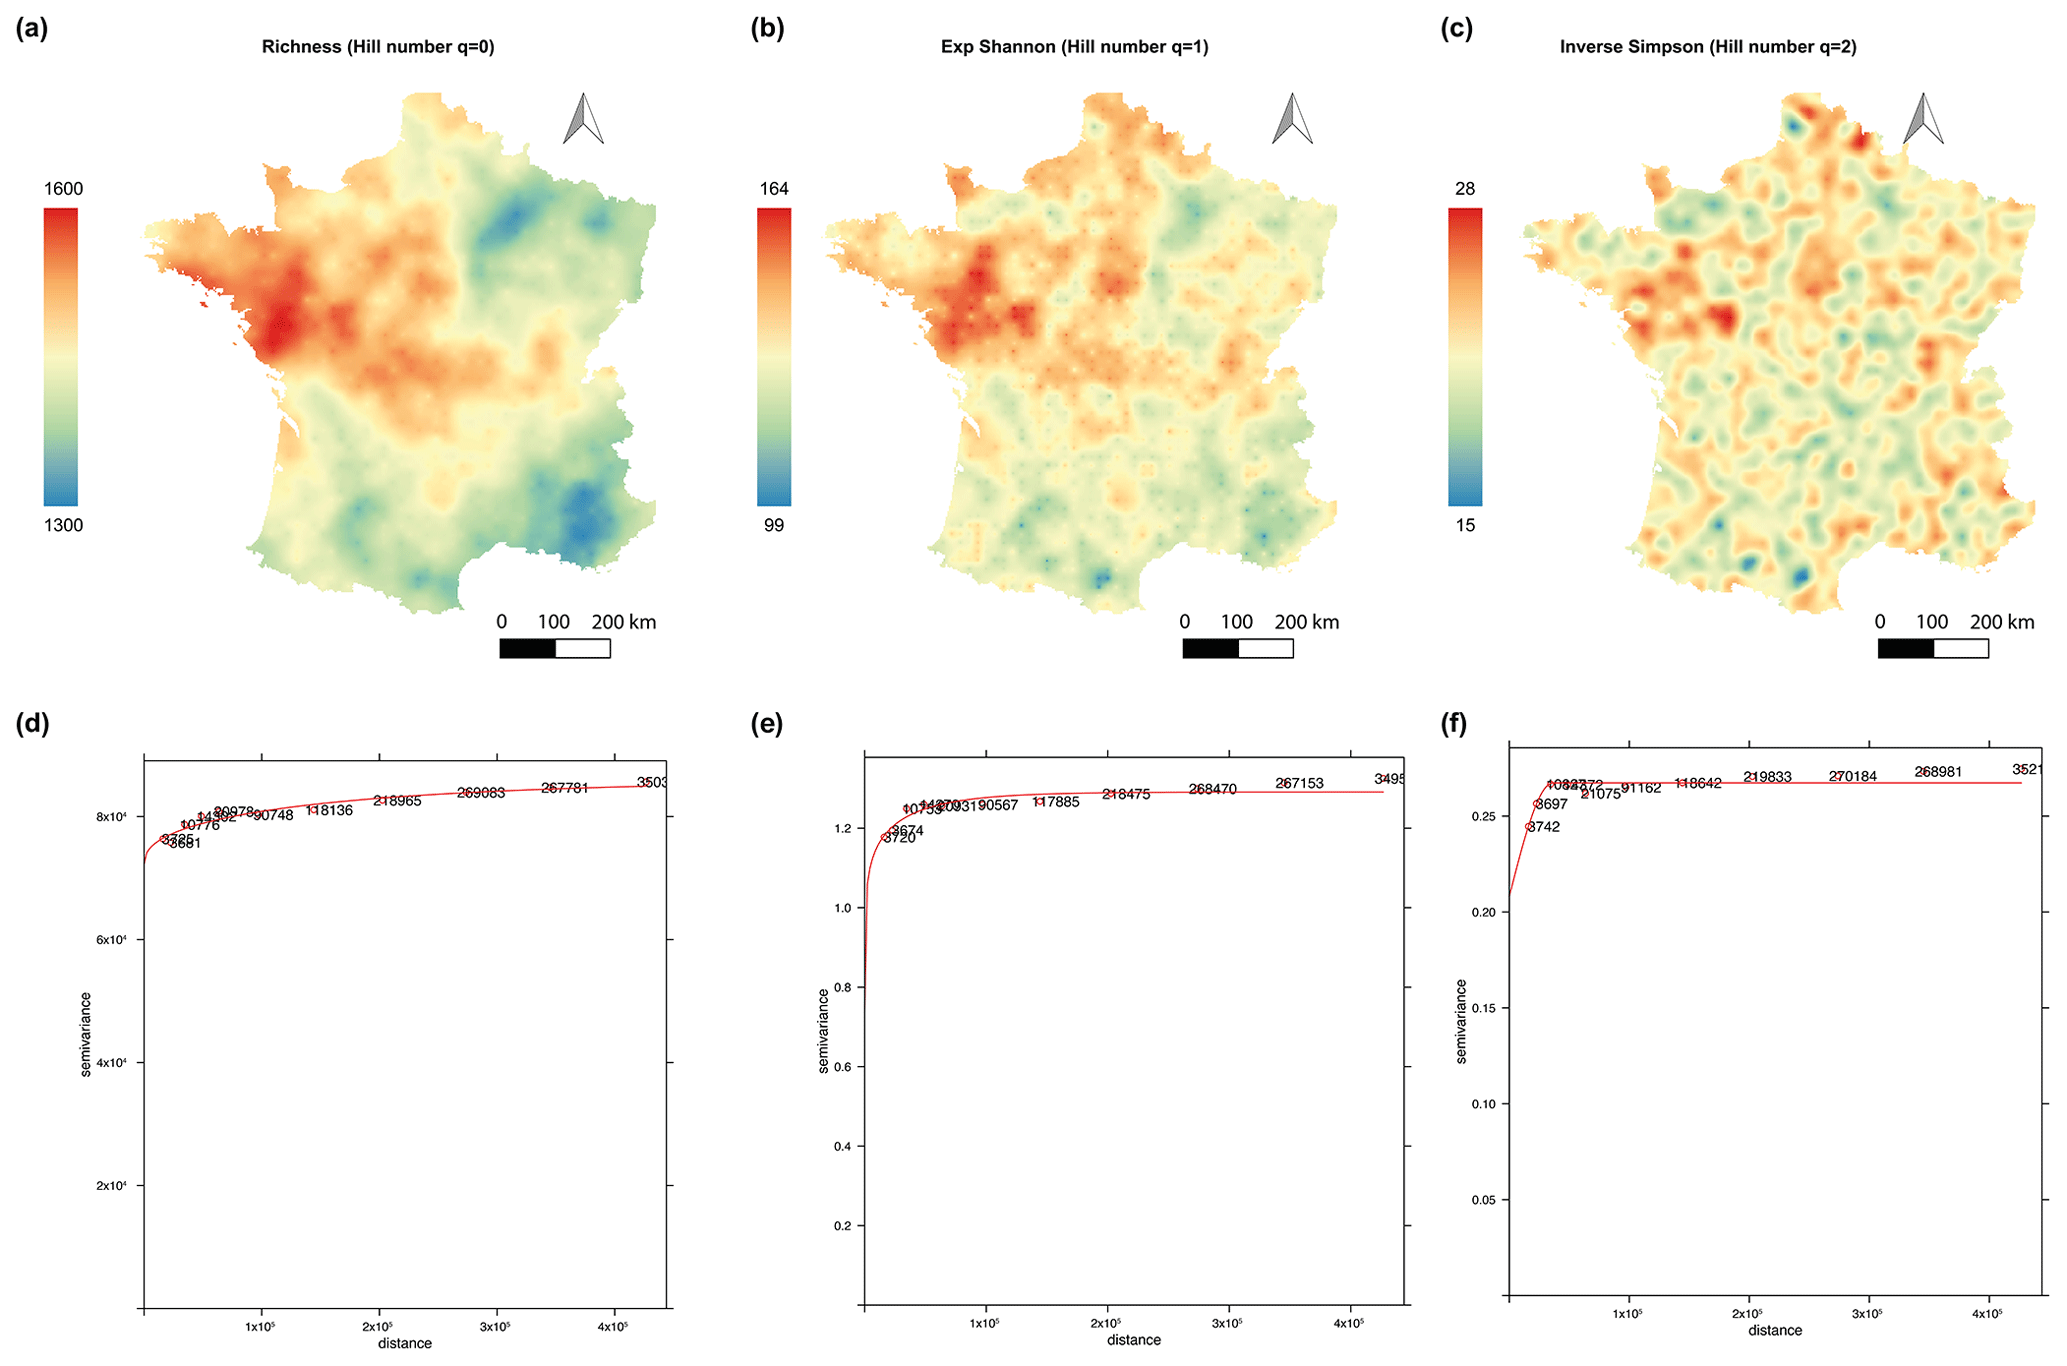
Figure 2National soil fungal alpha-diversity maps and robust variograms in France. Map of fungal richness (a). Map of the fungal exponential Shannon diversity (b). Map of the fungal inverse Simpson index (c). The variogram of fungal richness and the exponential Shannon diversity are based on the Matérn model with M. Stein's parameterization (d, e). The variogram of the fungal inverse Simpson index is based on a spherical model (f). Colors correspond to the extrapolated values expressed as OTUs per soil sample.
The models fitted for q=1 (exponential Shannon diversity) and q=2 (inverse Simpson index) exhibited the spottiest distribution with short autocorrelation distances (27 km radius and 36 km radius, respectively) (Fig. 2b, e, c, and f). The hotspots observed for q=1 and q=2 were less diffuse and remained strongly present in the northwest to the center of France. This spotty distribution highlighted small hotspots of abundant fungal OTUs in certain geographical zones described as having low fungal diversity by q=0, such as the southeast and the northeast of France.
3.3 Relationship between sets of environmental filters and fungal alpha diversity
We used a variance partitioning approach to evaluate the relative share of fungal diversity explained variance by each set of environmental variables (soil characteristics, land use, climate conditions, and spatial descriptors) for the different Hill numbers in partial models using a redundancy analysis (RDA). Globally, environmental filters explained 20.1 %, 15.52, %, and 7.54 % of the total variance of fungal richness for q=0, q=1, and q=2, respectively (Figs. 3a, 4a, and 5a and Supplement Table S2). For q=0, the main drivers of fungal richness variance were the soil characteristics (11.30 %) and then to a lesser extent climate conditions (0.88 %), land use (0.39 %), and spatial descriptors (0.26 %) (Fig. 3a). For q=1, the soil characteristics (9.30 %) were the main drivers and then to a lesser extent spatial descriptors (0.90 %), climate conditions (0.63 %), and land use (0.44 %) (Fig. 4a). For q=2, the soil parameters (4.25 %) and land use (2.16 %) were the main drivers, followed to a lesser extent by climate conditions (0.69 %) and spatial descriptors (0.31 %) (Fig. 5a). The percentage of interactions between the environmental filters decreased from 7.25 % for q=0 to 4.25 % for q=1 and neared zero for q=2 (0.12 %). The main soil physical and chemical properties for each land use and climate condition are summarized in Supplement Figs. S3 and S4.
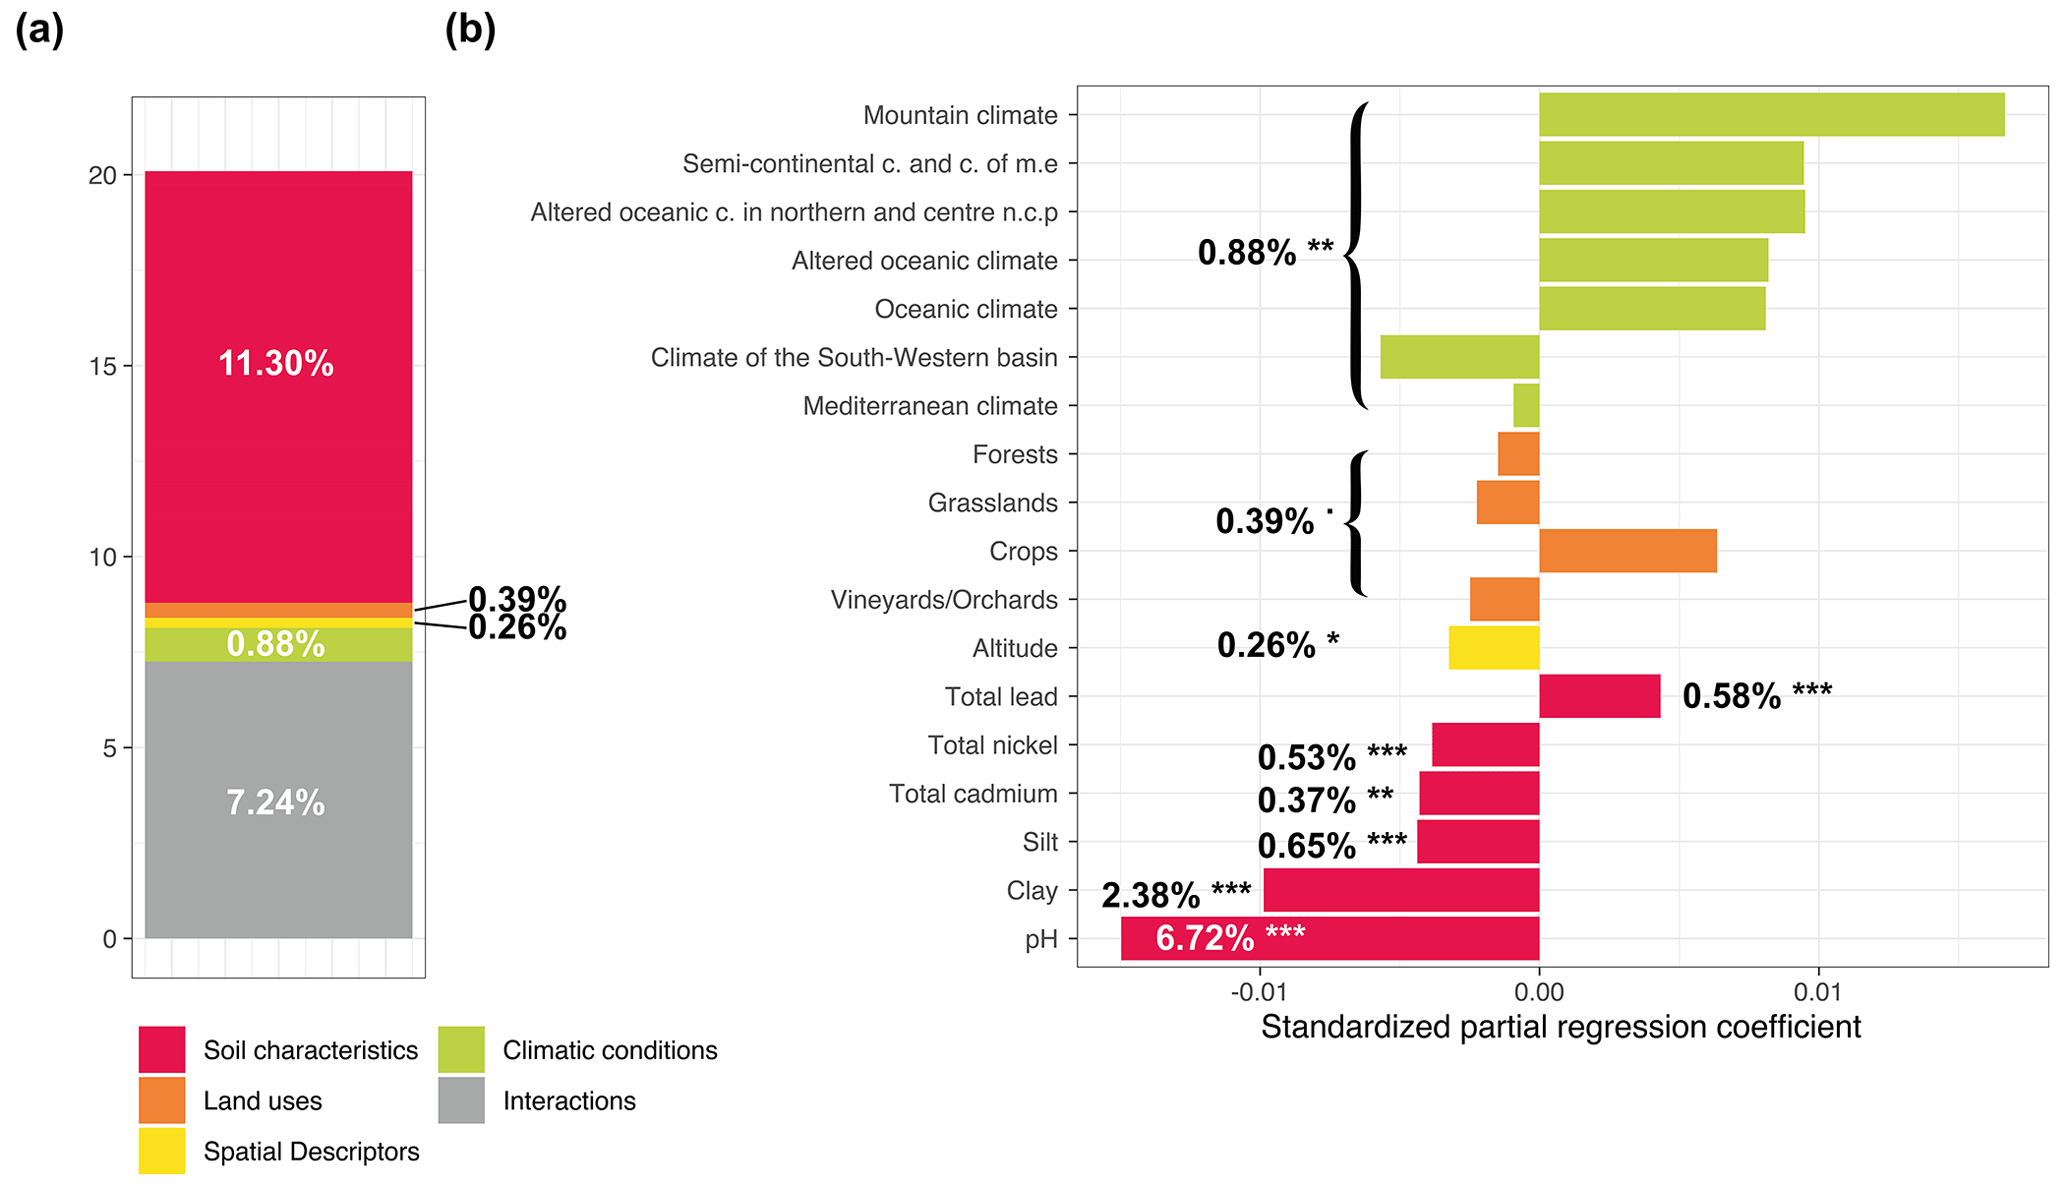
Figure 3Variance partitioning analysis to determine how local factors and factors related to global environmental filters explained variance in fungal richness (a). The amount of explained variance corresponds to the adjusted R2 values of the contextual groups using partial redundancy analysis. (b) Model parameters for the distribution of fungal richness. Each parameter is presented with its estimated model coefficients and its marginal effect assessed by a permutation test. * P<0.1; P<0.01; P<0.001. Missing values indicate that the variable was not retained in the model. Sand was removed prior to model evaluation since it was represented by the opposite of the sum of the silt and clay contents.
3.4 Influence of the soil characteristics on soil fungal alpha diversity
The key determining soil parameter for fungal richness was pH (variation explained by 6.72 %). A unimodal relationship was evidenced, with minimum fungal diversity in the most acidic and alkaline soils (Supplement Fig. S2). For q=0, a significant influence of the soil texture was also demonstrated, with a linear negative relationship observed with clay (2.38 %) and silt (0.65 %). Conversely, a positive relationship was observed with the total lead content (0.58 %) and a negative relationship with the total nickel content (0.53 %) and total cadmium content (0.37 %) (Fig. 3b).
For q=1, soil pH (6.30 %) had a unimodal distribution and was also the strongest driver, followed by the clay content (3 %) with a negative linear correlation (Fig. 4b). For q=2, the soil pH remained the strongest driver with a unimodal relationship, and organic carbon and the total iron content were also identified as secondary drivers, with a negative linear relationship (Fig. 5b). Moreover, a weak positive relationship was observed with silt (variation explained by 0.16 % with a significance level of 0.1).
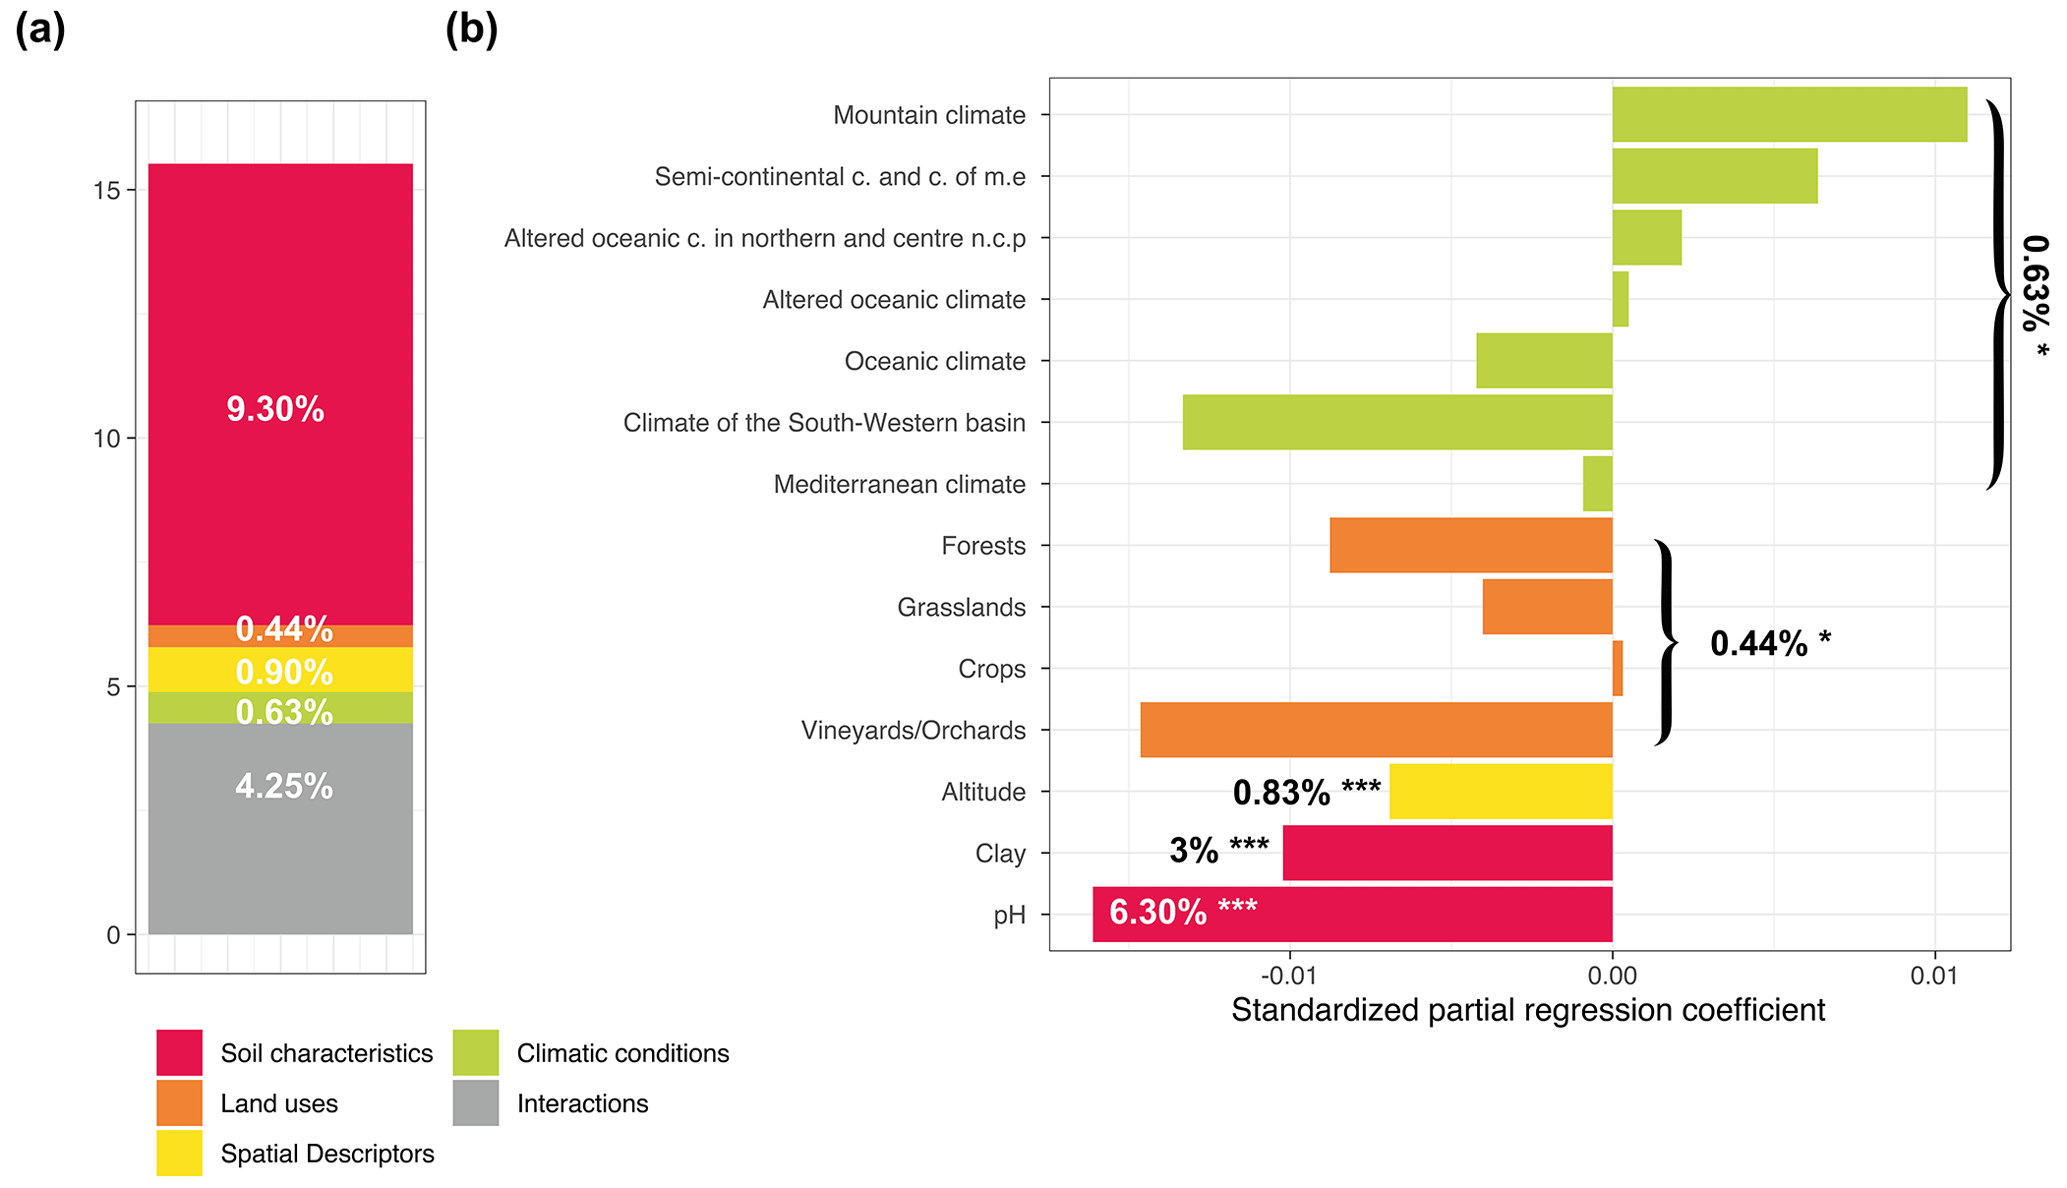
Figure 4Variance partitioning analysis to determine how local factors and factors related to global environmental filters explained variance in the exponential fungal Shannon diversity (a). The amount of explained variance corresponds to the adjusted R2 values of the contextual groups using partial redundancy analysis. Model parameters for the distribution of the exponential fungal Shannon diversity (b). Each parameter is presented with its estimated model coefficients and its marginal effect assessed by a permutation test. * P<0.1; P<0.01; P<0.001. Missing values indicate that the variable was not retained in the model. Sand was removed prior to model evaluation since it was represented by the opposite of the sum of the silt and clay contents.
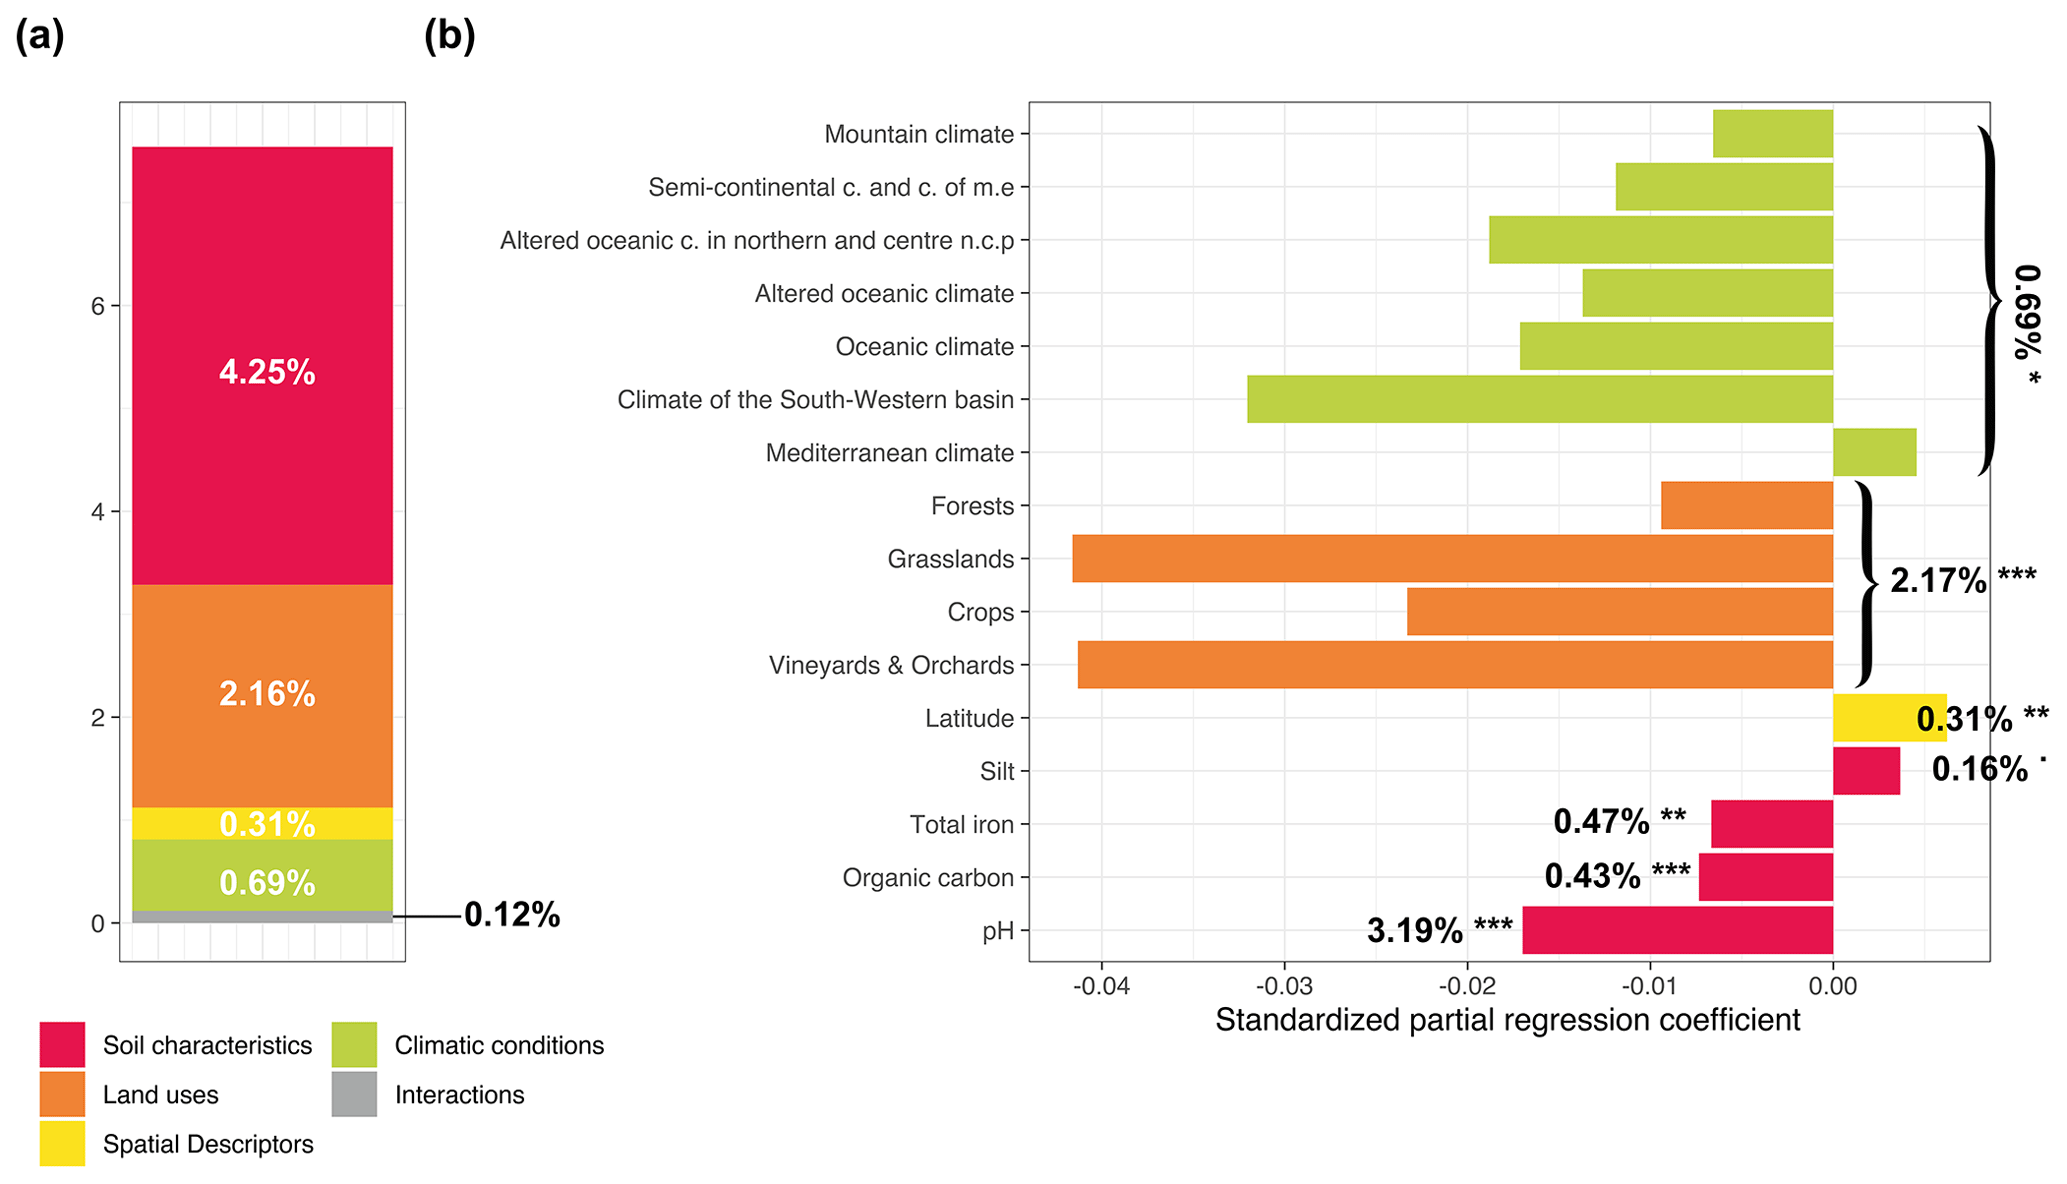
Figure 5Variance partitioning analysis to determine how local factors and factors related to global environmental filters explained variance in the fungal inverse Simpson index (a). The amount of explained variance corresponds to the adjusted R2 values of the contextual groups using partial redundancy analysis. Model parameters for the distribution of the fungal inverse Simpson index (b). Each parameter is presented with its estimated model coefficients and its marginal effect assessed by a permutation test. * P<0.1; P<0.01; P<0.001. Missing values indicate that the variable was not retained in the model. Sand was removed prior to model evaluation since it was represented by the opposite of the sum of the silt and clay contents.
3.5 Influence of climate conditions on soil fungal alpha diversity
The great diversity of climate conditions in France allowed us to compare fungal diversity across eight types of climates (Fig. 6a). Temperature, rainfall, and elevation are summarized in Supplement Fig. S4. Our analyses revealed that fungal diversities for q=0 and q=1 were highest under oceanic climate (type 5) and lowest under Mediterranean climate (types 6 and 8) and the climate of the southwestern basin (type 7) (Fig. 6b and c). Moreover, we observed no significant difference from types 6, 7, and 8. Fungal diversities for q=0 and q=1 under mountain and continental climates had an intermediate value between oceanic and Mediterranean climates. Regarding the dominant OTUs (q=2), there was no significant difference in fungal diversity across the various climate types of France (Fig. 6d).
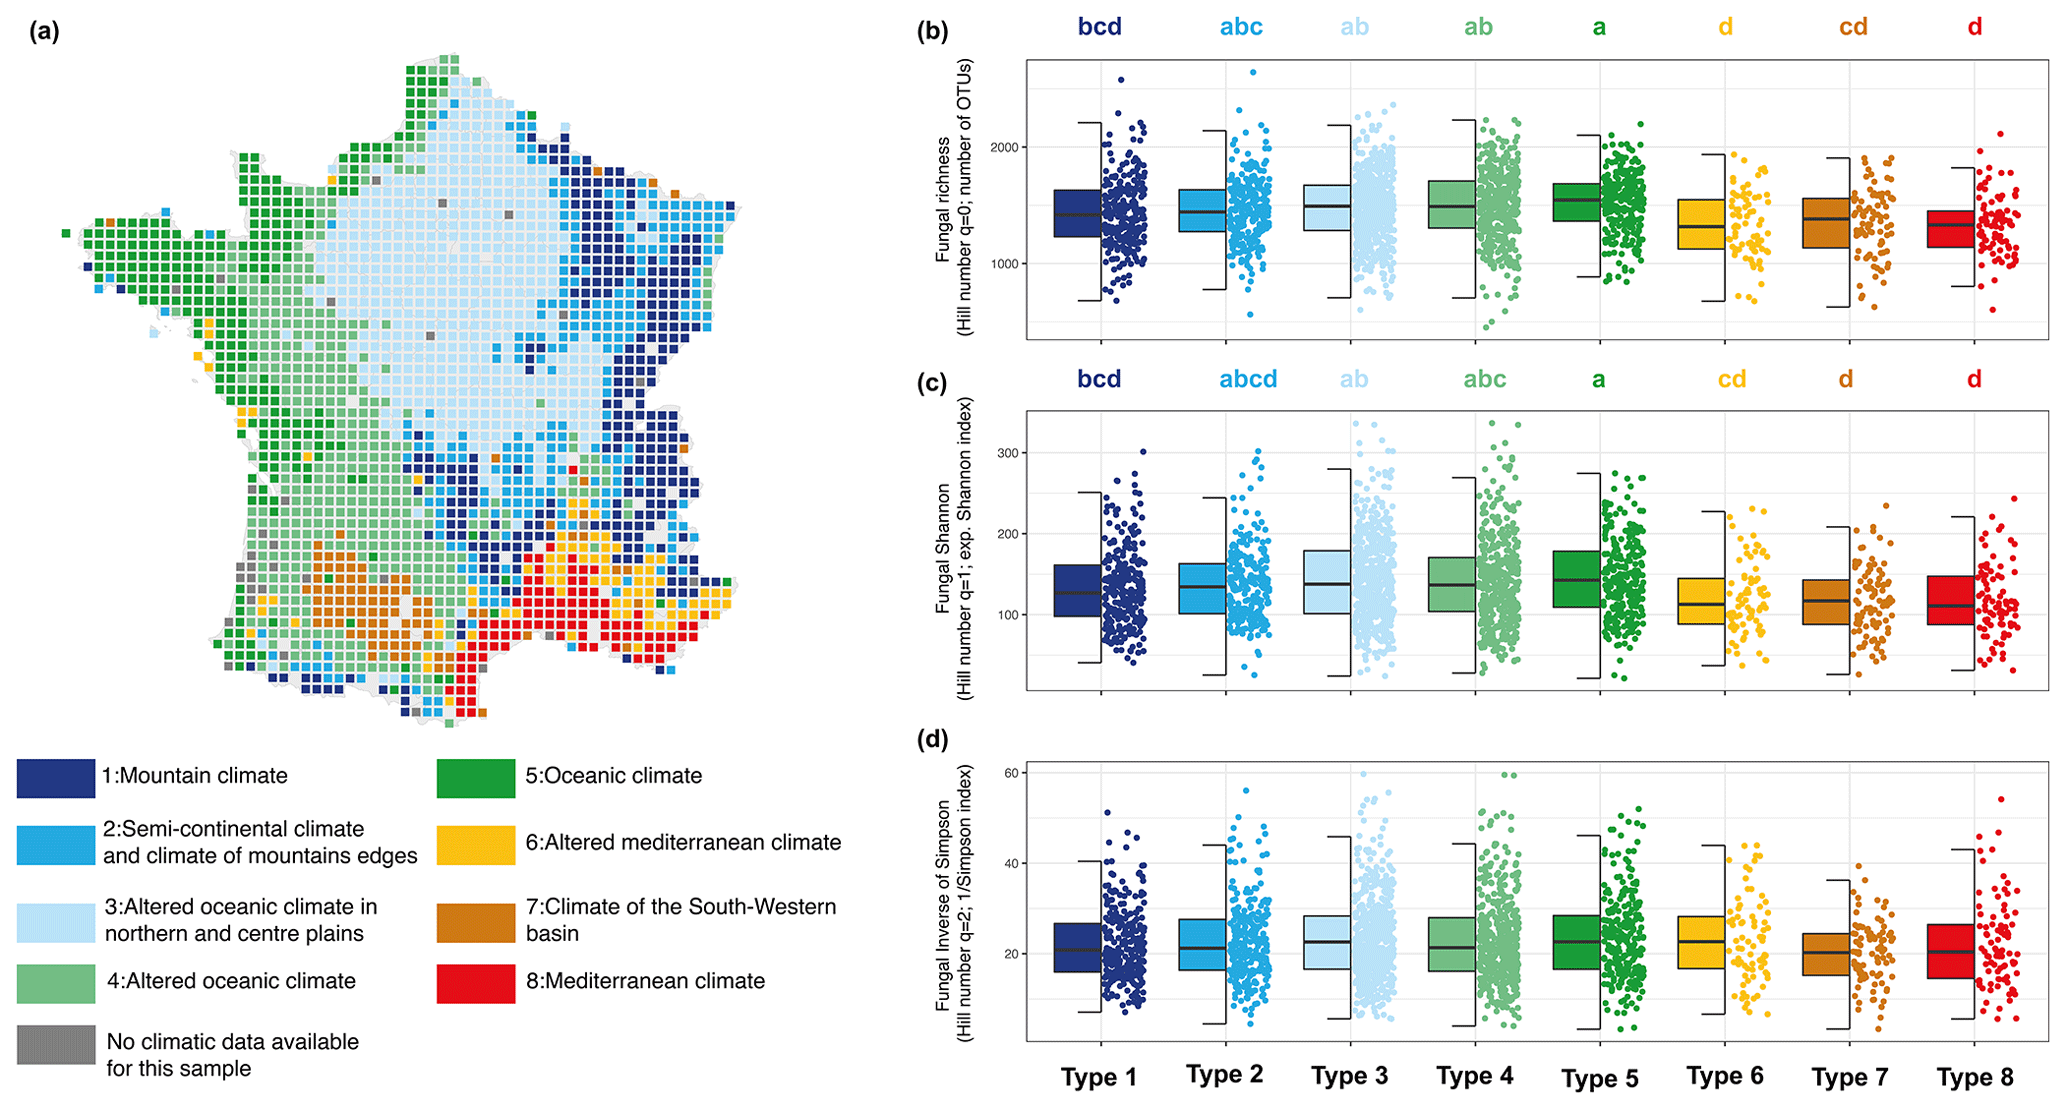
Figure 6Map of the RMQS sampling sites and classification of the eight climate types (a). Soil fungal alpha-diversity distribution across climate types for fungal richness (b), the exponential fungal Shannon diversity (c), and the fungal inverse Simpson index (d). Different letters designate significantly different values following multiple comparisons.
3.6 Variation in soil fungal diversity as related to land uses
By comparing fungal richness (q=0) across the different land uses encountered in France (Fig. 7a), we observed several significant differences (Fig. 7b). Forest and vineyard or orchard soils harbored a lower fungal richness than grassland and agricultural soils and can be ranked as follows: vineyards or orchards ( OTUs) ≤ forests ( OTUs) < grasslands ( OTUs) ≤ crops ( OTUs) (Fig. 7b). The same trend was observed for q=1 (Fig. 7c) but was different for q=2 (Fig. 7d). For q=2, fungal diversity in grassland and vineyard soils appeared lowest compared to forest and crop soils.
Within the four major land uses of French soils, we identified and compared more precisely land managements (Fig. 8). For example, forests can be categorized into three groups – deciduous forests, coniferous forests, and mixed forests. Among forest managements, we observed significant differences between deciduous and mixed forests: the lowest richness was found in mixed forests (Fig. 8a). For q=1, fungal diversity in deciduous forests was significantly higher than in coniferous and mixed forests (Fig. 8b), while no difference was detected for q=2 (Fig. 8c). Significant differences were also recorded by comparing the different land managements of the crop systems: whatever the metrics, soil fungal diversity was higher under crops with a grassland rotation than under crops without a grassland rotation. No significant difference was recorded between vineyards and orchards or between the various grassland managements (Fig. 8).
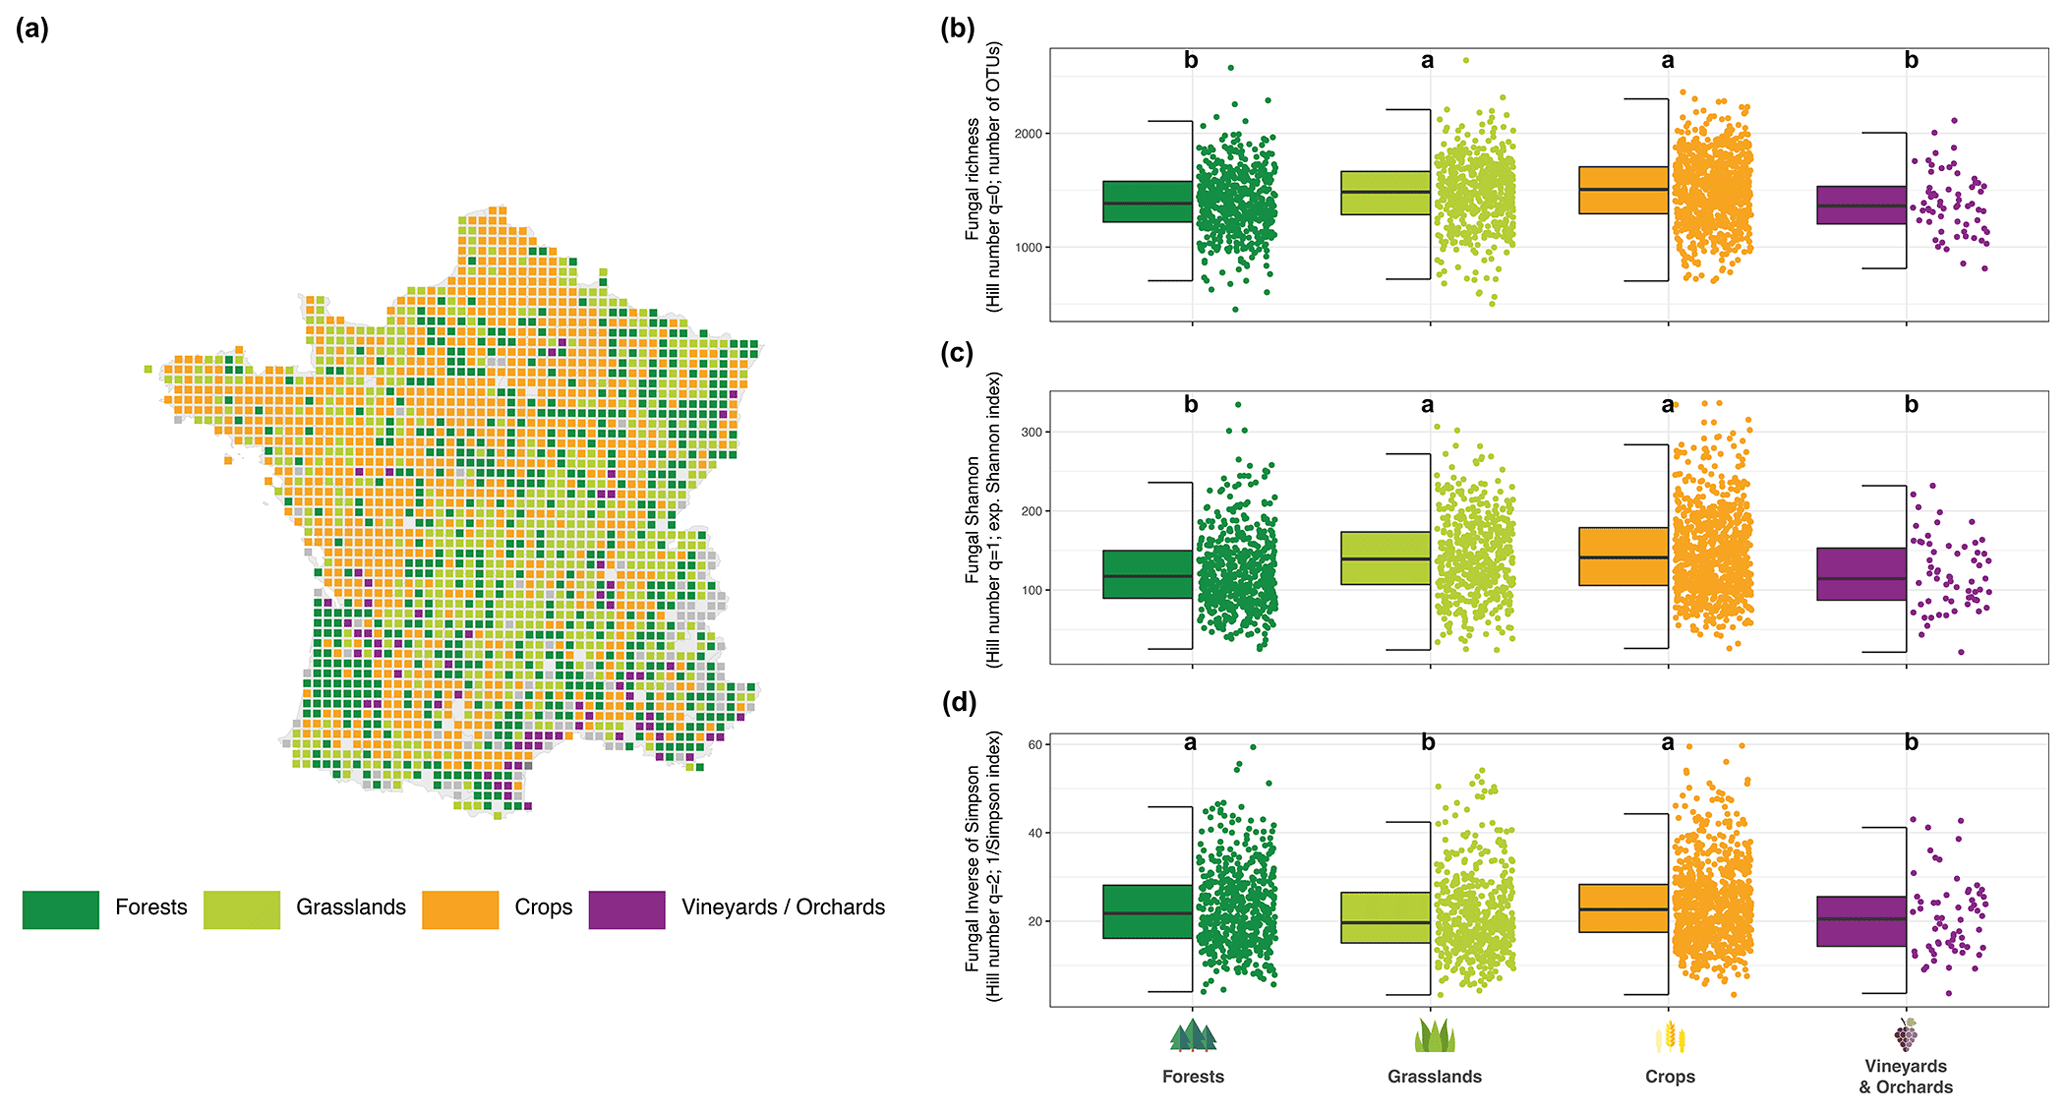
Figure 7Map of the RMQS sampling sites and classification for the four land uses (a). Fungal richness distribution across land uses (b). Distribution of the exponential fungal Shannon diversity across land uses (c). Fungal inverse Simpson distribution across land uses (d). Different letters designate significantly different values following multiple comparisons.
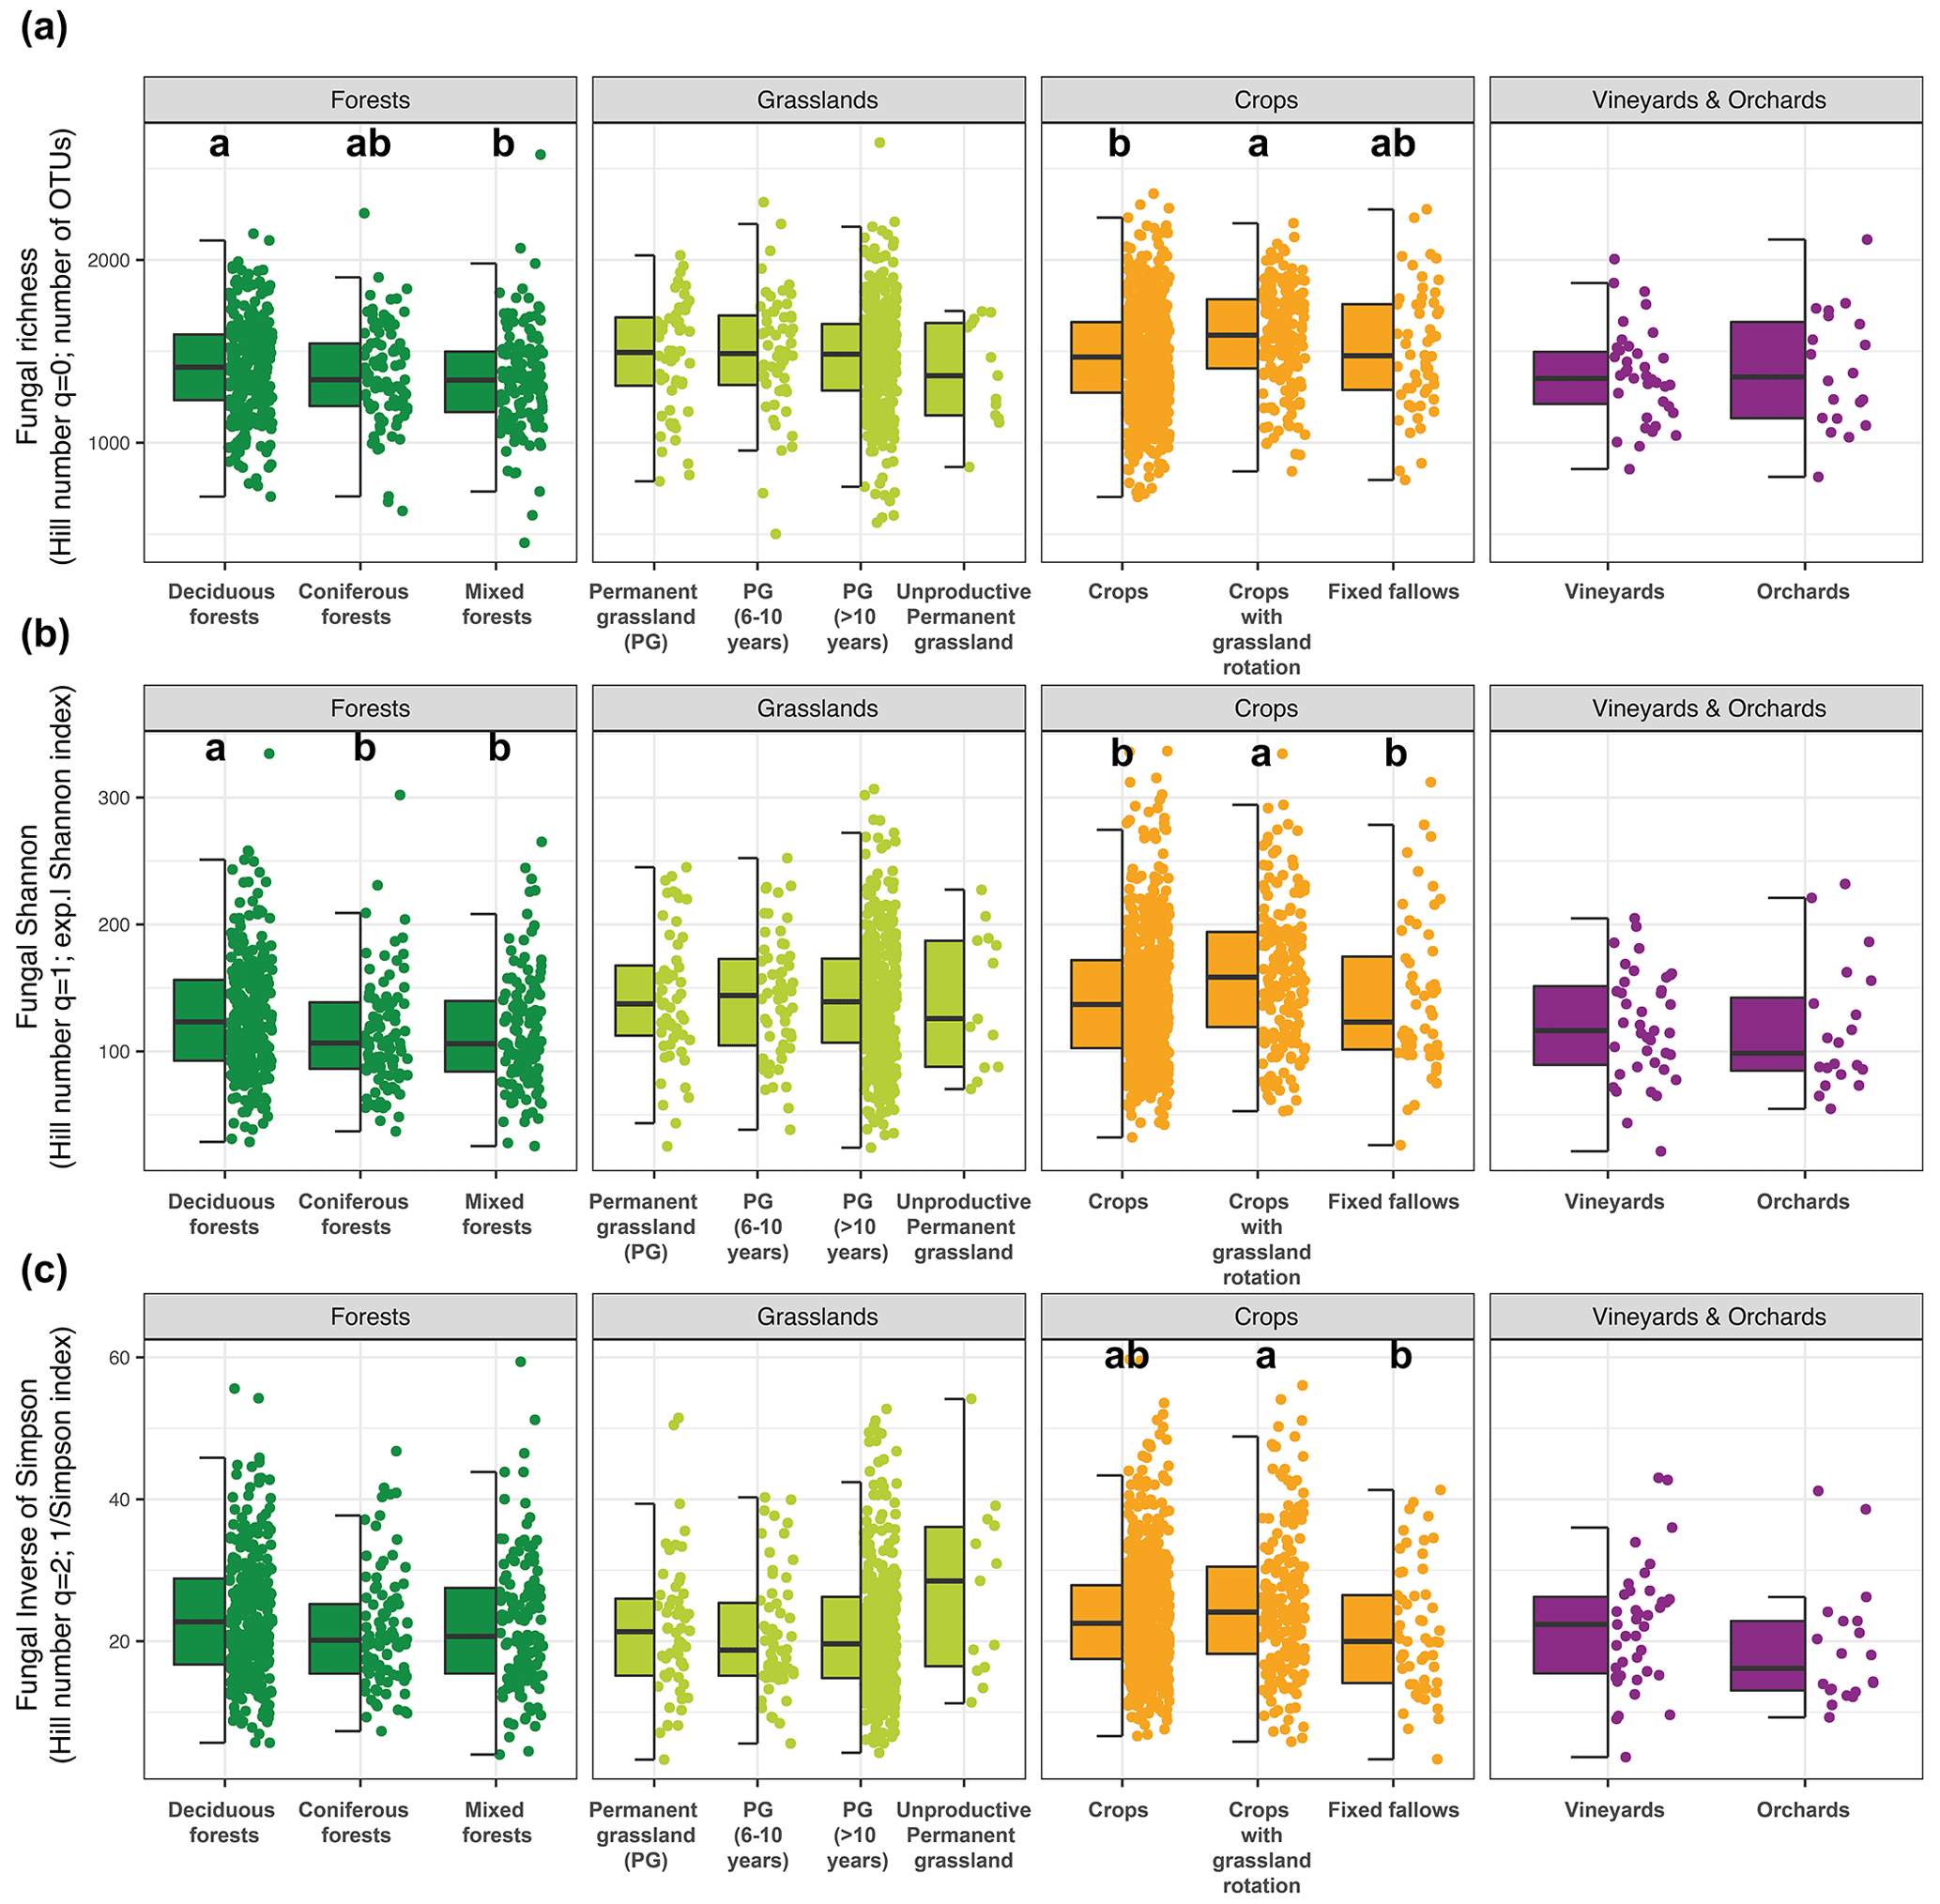
Figure 8Distribution of soil fungal alpha diversity within the four major land uses of French soils according to a more precise land management characterization for fungal richness (a), the exponential fungal Shannon diversity (b), and the fungal inverse Simpson index (c). Different letters designate significantly different values following multiple comparisons.
3.7 Comparison of soil fungal co-occurrence networks with land uses and climate types
The networks were graphically composed of connections (links) between the nodes corresponding to the OTUs. The links represented the significant positive and negative correlations between the OTUs occurring in the soils under the respective land uses or climate types (Fig. 9). A visual analysis of the networks obtained for the different land uses revealed a significant shift in structure ranging from a highly connected, tightly closed structure in forests to a sparse, open structure in vineyards (Fig. 9a). In grassland and crop soils, the networks exhibited an intermediate structural complexity in terms of their numbers of links and connected OTUs (Fig. 10a). Statistical comparisons of the network metrics between land uses confirmed a highly significant decreasing gradient of network complexity, with the pattern forest ≫ grassland ≥ crop system > vineyard and orchard soils (Supplement Table S3, Fig. 10a). The average number of links significantly decreased by 84 % from forest to vineyard soils and by 76 % from forest to field crop and grassland soils. The average connectance also progressively decreased by 81 % from forest to vineyard soils and by 78 % from forest to field crop and grassland soils. The ratio between the positive and negative links was lower in forest soil and higher in vineyard and orchard soil (Fig. 10a). The fungal networks across the eight climate types exhibited a progressive decrease in connectivity between climate types 1, 2, 3, and 4, then a very significant drop for types 5 and 7, and then the greatest connectivity for types 6 and 8 (Figs. 9b and 10b, Supplement Table S4). Conversely, the highest ratio between the positive and negative links was observed in networks within types 5 and 7, and the lowest one was observed for type 8.
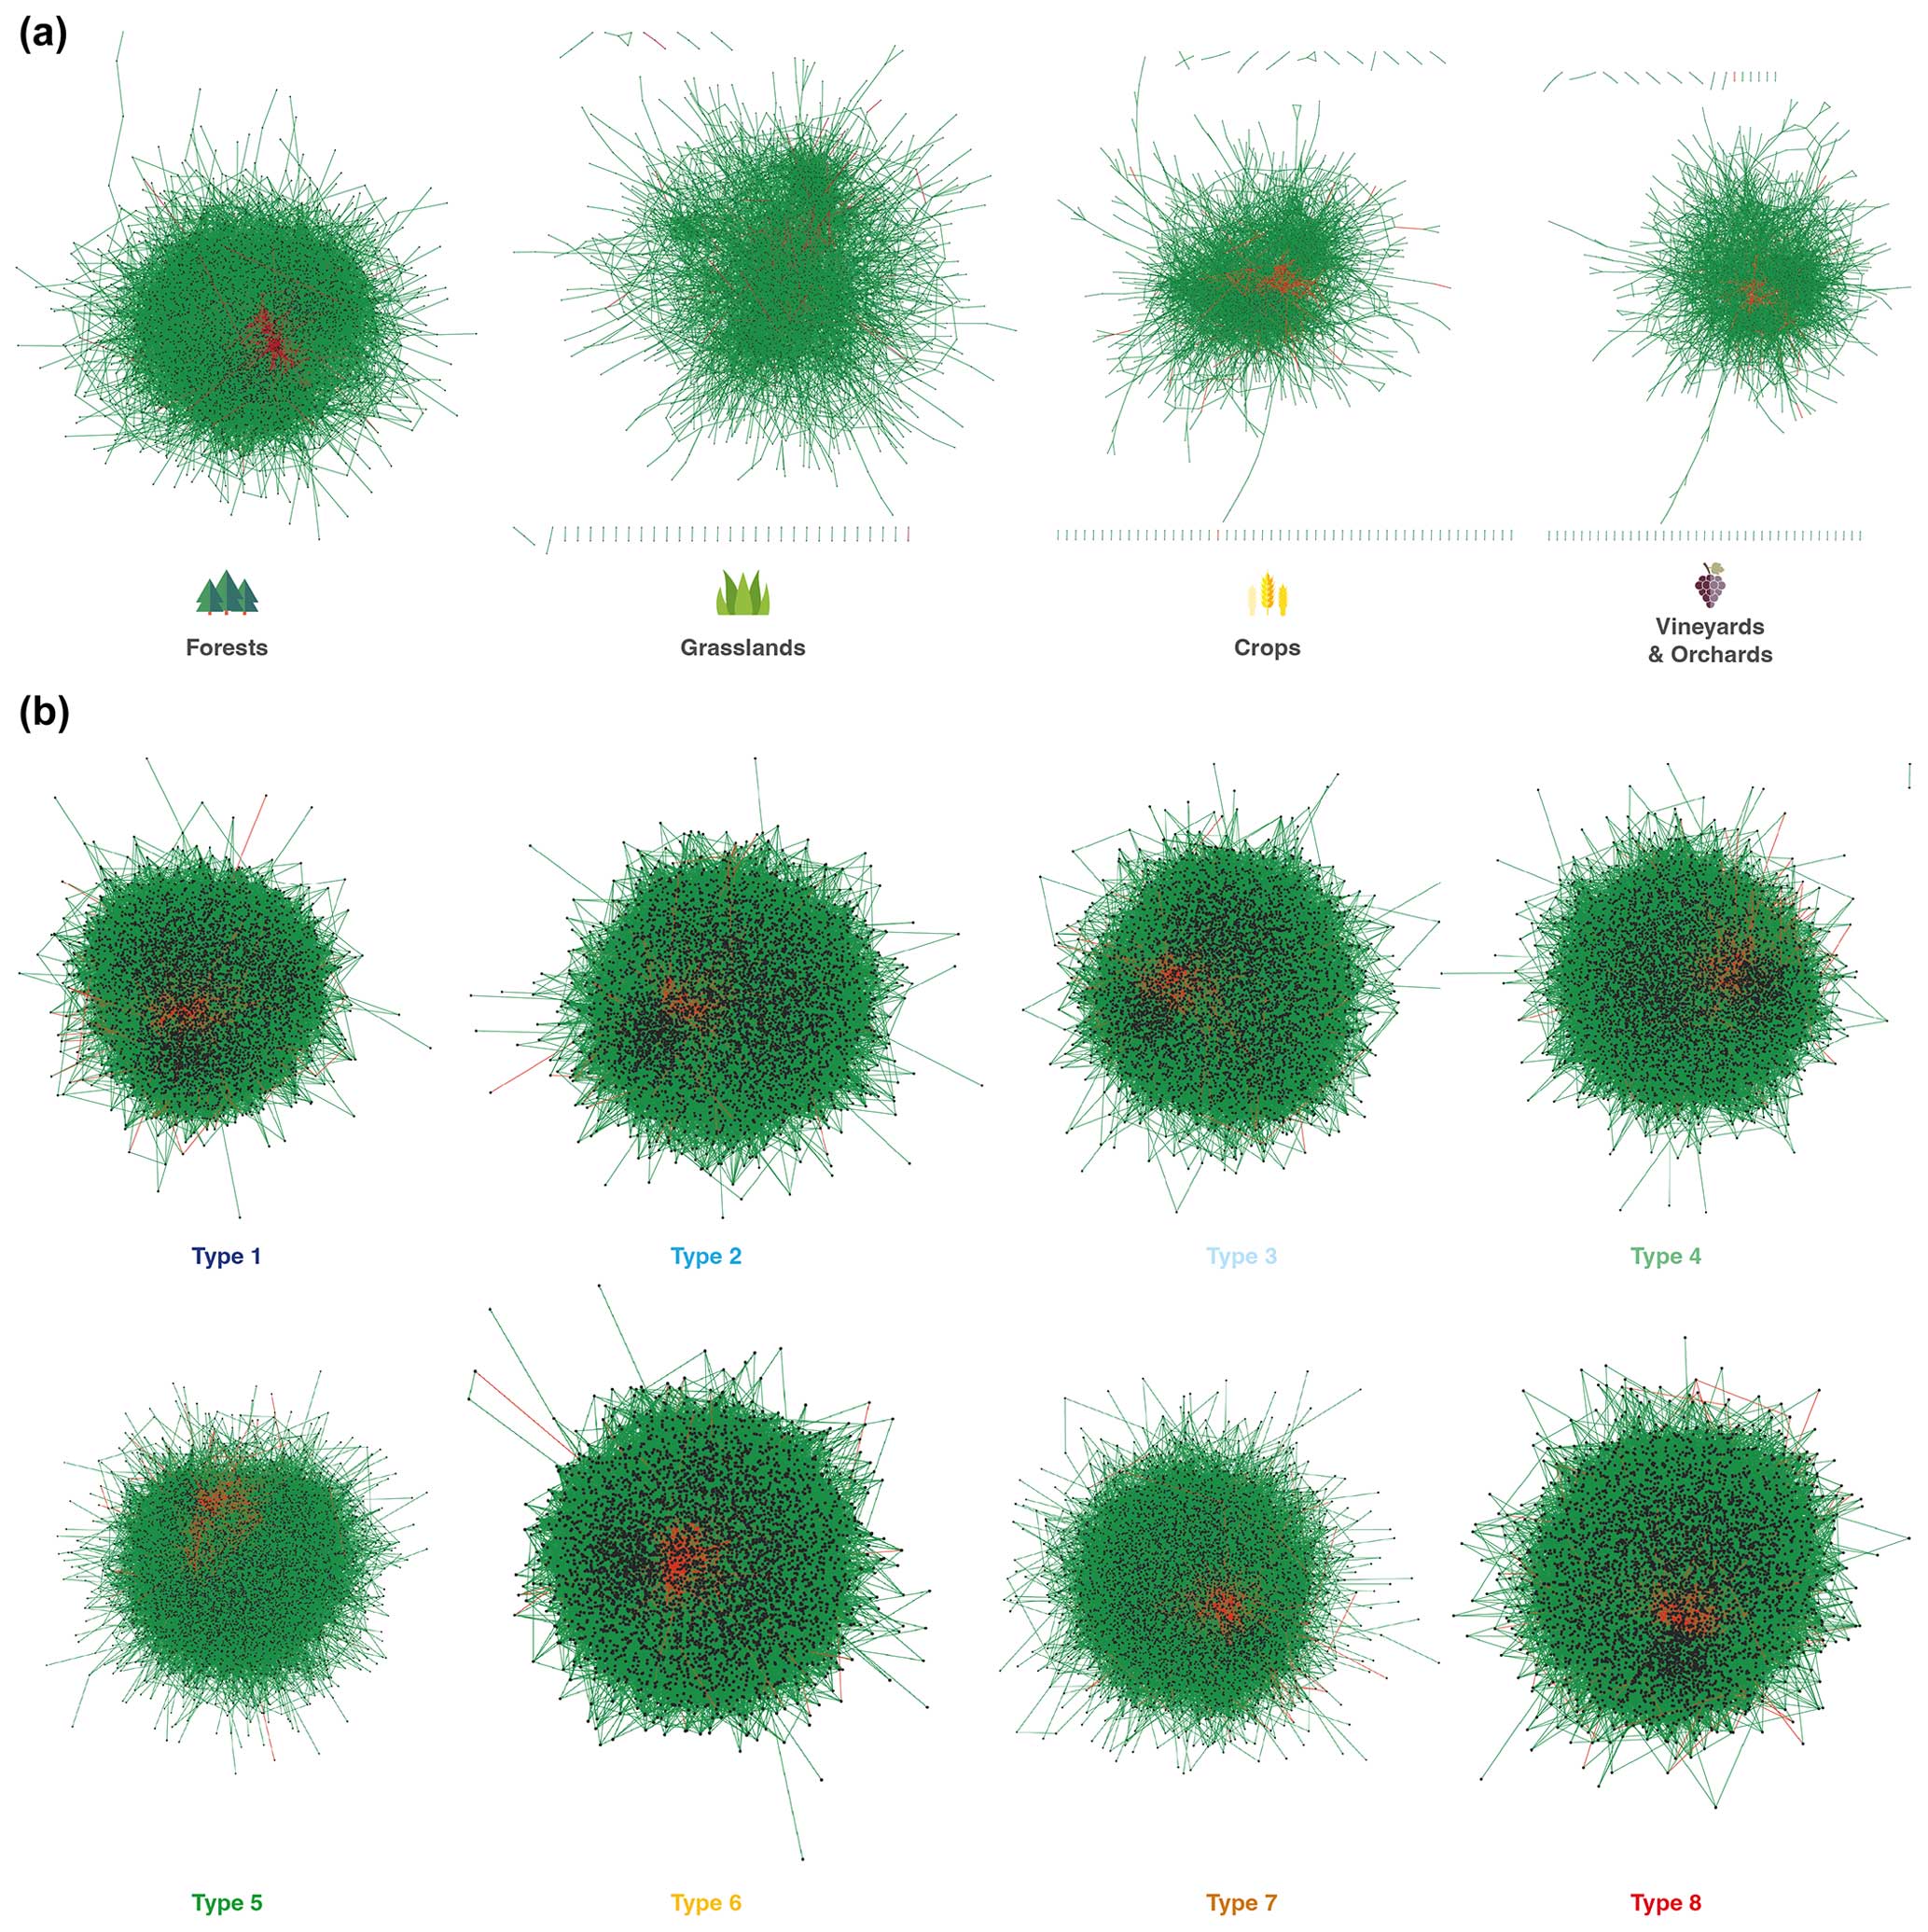
Figure 9Co-occurrence networks of fungal OTUs across land uses (a) and climate types (b) in France. Among the 100 replicates of the four types of land cover or eight climate types, we visualized the network closest to the median network based on the number of links and connectances. The red edges represent the negative links, and the green edges represent the positive links. Nodes: OTUs; edges: links between the nodes.
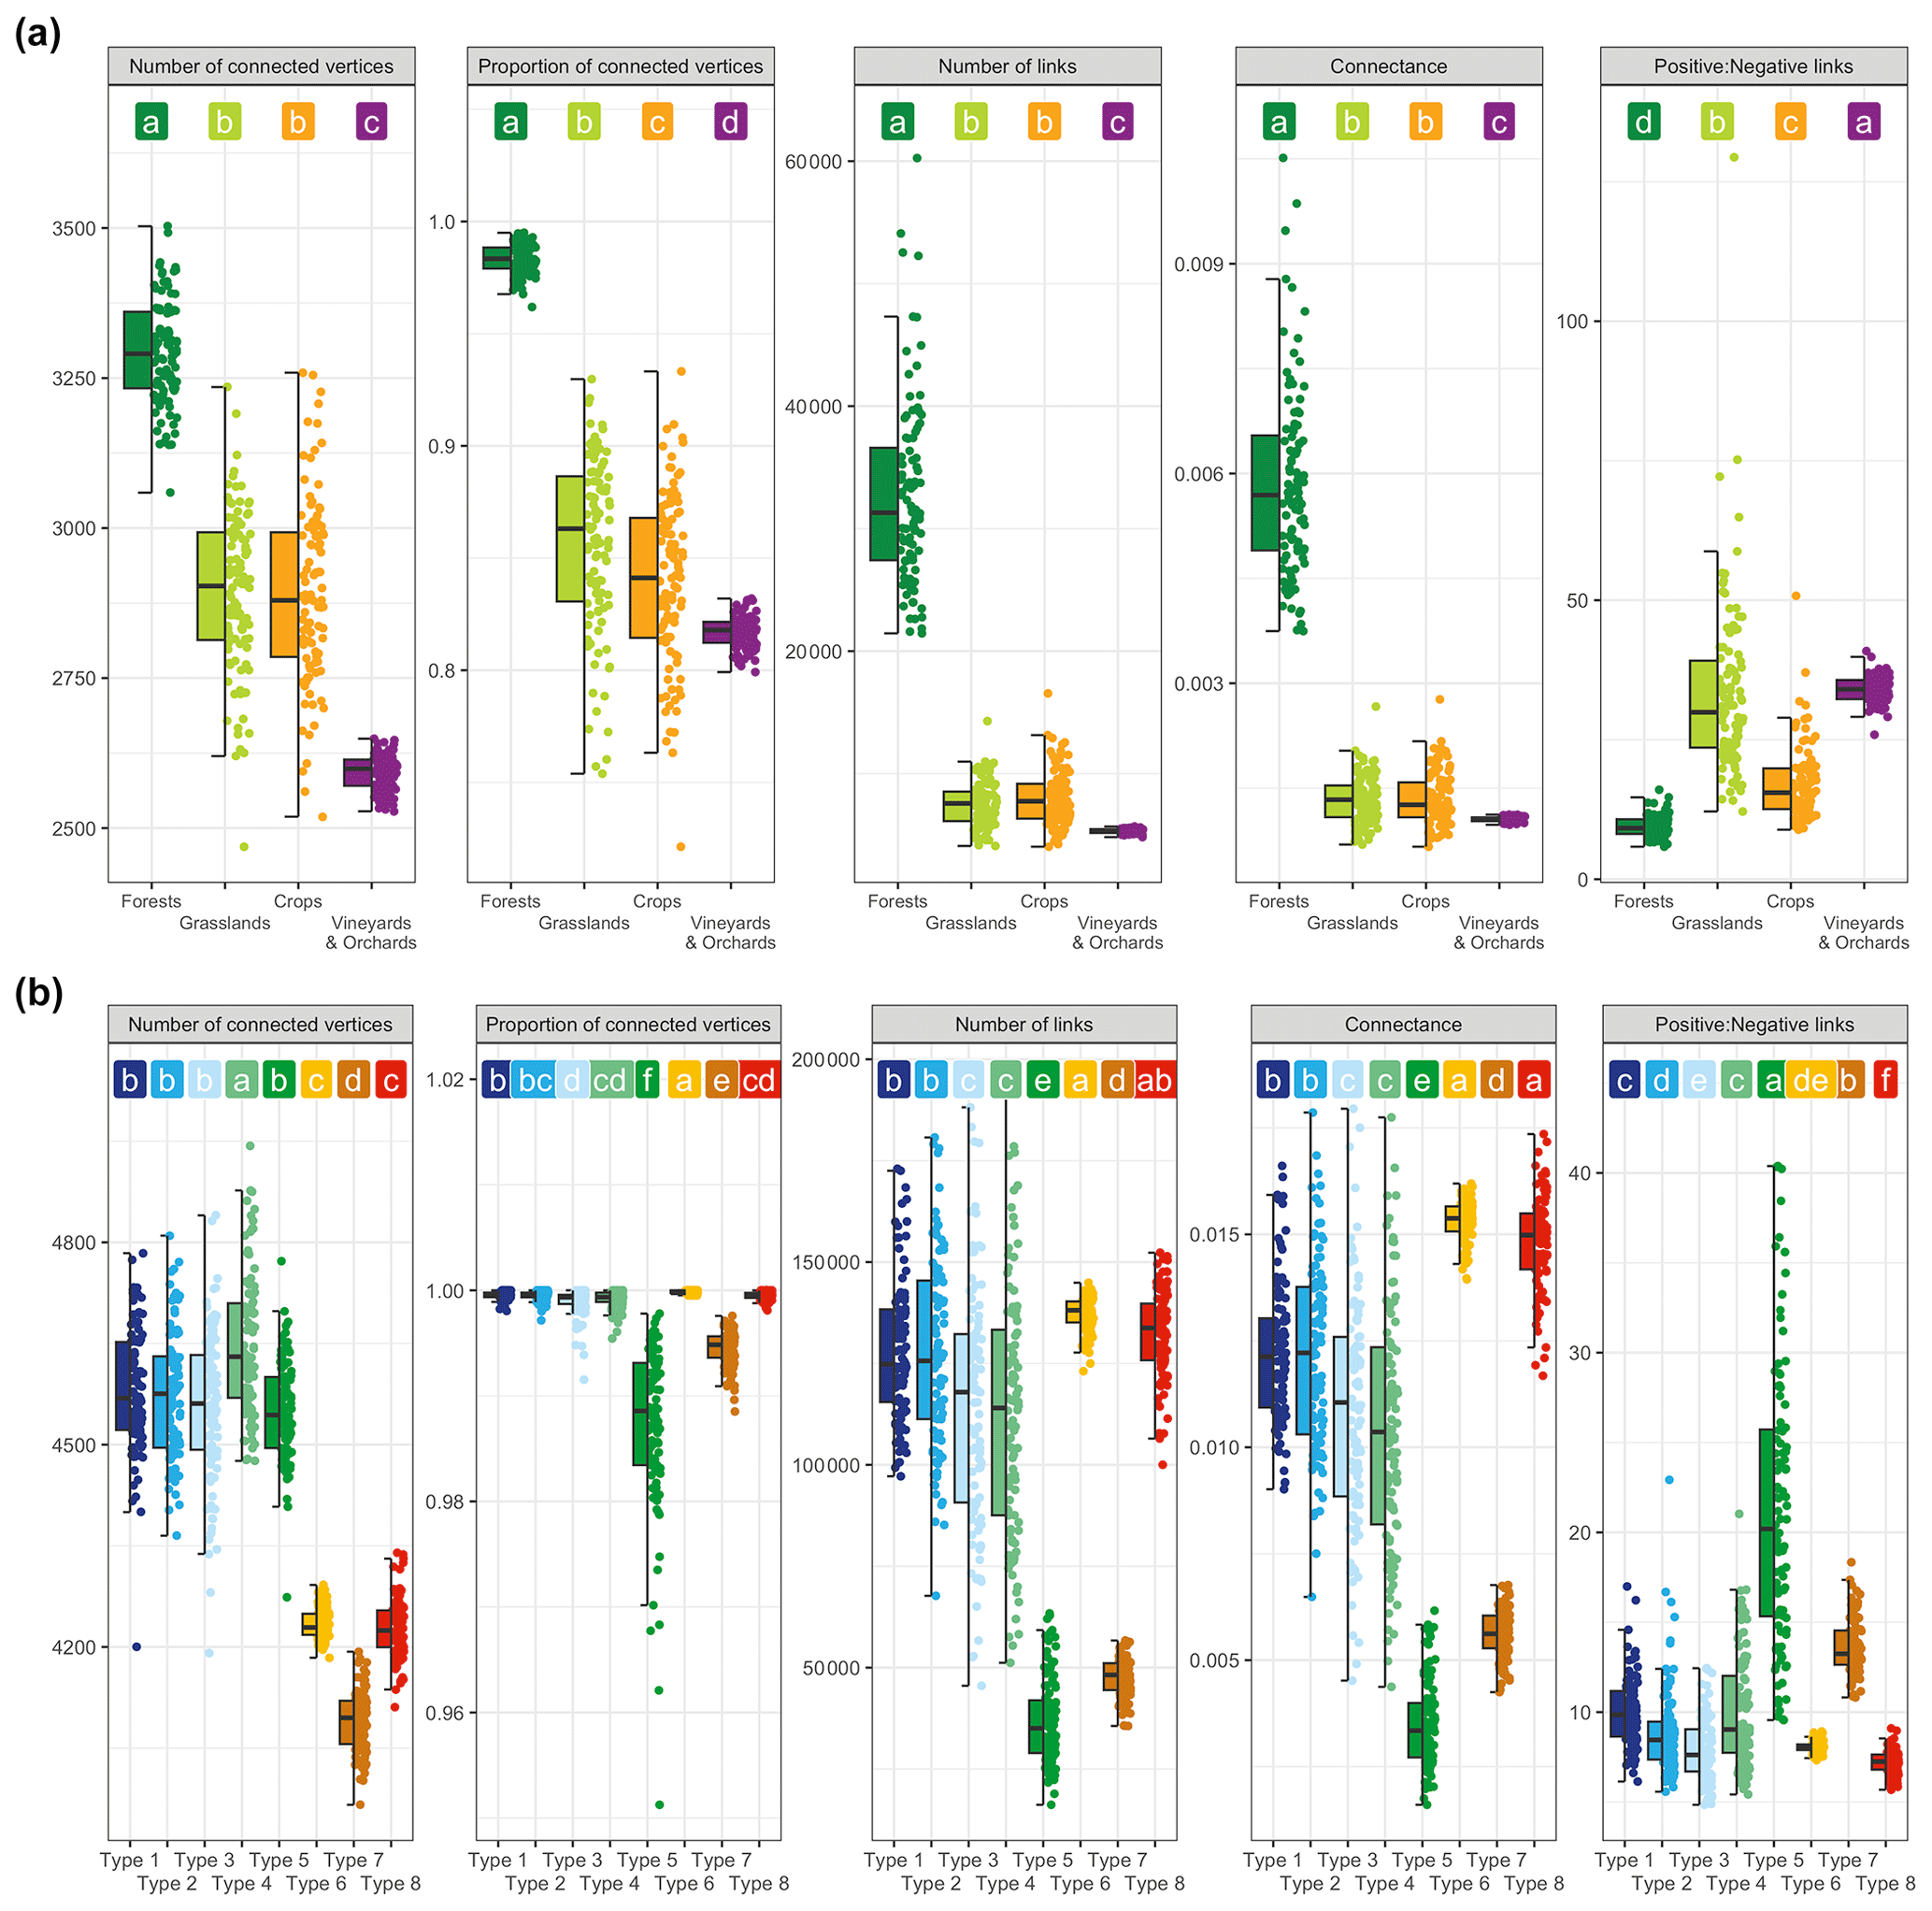
Figure 10Fungal co-occurrence network metrics for the four land uses (a) and eight climate types (b) based on five indices. Different letters designate significantly different values following multiple comparisons.
Two molecular markers are commonly used to explore fungal diversity thanks to meta-barcoding approaches: the ITS region, accepted as a universal barcode, and the 18S rRNA gene as an alternative, the two being considered today to be complementary. Both have advantages and drawbacks, in particular in observing specific functional groups. For example, members of the class glomeromycetes are better characterized using 18S rDNA than ITS, especially in the soil microbiota, and this could have a significant impact on fungal diversity metrics (George et al., 2019b). In addition, important reference sequences are only annotated at the phylum level in the international databases (Nilsson et al., 2012, 2016; Banos et al., 2018). Moreover, a recent study highlighted that national-scale fungal biogeography studies based on 18S rDNA were robust and sensitive for deciphering the relationships between fungal diversity and environmental filters (George et al., 2019b). For all these reasons, the use of the 18S rDNA gene to characterize fungal alpha diversity in soil can be relevant. Once the molecular marker was chosen, the hypervariable region had to be selected for sequencing. Various criteria had to be taken into account, such as amplicon length in relation to the sequencer or the desired taxonomic and phylogenetic resolutions. We sequenced the V7–V8 regions because they appeared to be the most promising regions for fungal diversity assessment (Banos et al., 2018). The last tricky step of a fungal diversity study is bioinformatics analysis, which is dependent on the pipeline (Pauvert et al., 2019). Nevertheless, our previous studies on bacterial biogeography showed that our meta-barcoding pipeline and the associated tools were highly appropriate for analyzing large microbial datasets (Djemiel et al., 2020; Terrat et al., 2019).
As for the alpha-diversity analysis, we chose to use the Hill numbers – which have several advantages (Roswell et al., 2021) – to provide an overview of the fungal diversity for each site. This allowed us to observe all OTUs – “typical” OTUs and dominant ones – based on their abundance frequencies (Chao et al., 2014), especially as fungal diversity can be represented by a few dominant species with a high relative abundance (Egidi et al., 2019a).
The first predictions of worldwide fungal diversity ranked from 2.2 to 3.8 million species (Hawksworth and Lücking, 2017), but recent molecular works updated estimations of up to 6.28 to 12 million species predicted by computing several hundreds of international studies (Phukhamsakda et al., 2022; Wu et al., 2019; Baldrian et al., 2022). At the national scale, this question remains unexplored for soil ecosystems. In our study, we predict total fungal richness at a national scale for the first time by an extrapolation analysis from meta-barcoding at the OTU levels. Compared to the estimated worldwide diversity, France exhibits a very high cumulated soil fungal richness (about 1 % of the global soil fungal diversity based on a maximum diversity estimate of 12 million) relative to its small surface (0.3 % of terrestrial land). Independently of the molecular marker used, this suggests that global soil fungal richness is underestimated worldwide, partly due to the poor intensive sampling strategy that has only been extensive to date with few sampling sites. Consequently, this strategy seems relatively inefficient for capturing the local environmental heterogeneity that hosts and shapes fungal richness. Therefore, it is important to gather several deeply investigated national surveys to estimate global soil fungal diversity more robustly (Dini-Andreote et al., 2021). Another example of soil fungal diversity estimation at a national scale has been described in Wales, where 437 samples were collected in sites on a surface area of 20×103 km2, leading to a total evaluation of 4408 OTUs based on 18S rDNA characterization (George et al., 2019b).
Our first maps of the three Hill numbers were provided to describe the spatial distribution of soil fungal alpha diversity across France, as previously done for molecular microbial biomass and bacterial richness (Dequiedt et al., 2011; Terrat et al., 2017). The heterogeneous spatial distribution of fungal diversity observed in France is not congruent with several studies using an ITS marker (Větrovský et al., 2019; Tedersoo et al., 2014), which did not observe significant variations across Europe with a global soil mapping approach. The two studies computed 365 and 3085 soil samples across the world, respectively, compared to 2171 in the present study at the scale of France. In addition, these global sampling strategies were based on non-random designs that generally left difficult-to-access (polar, arid, mountainous) regions with possible biases in the environmental representativeness of the soil fungal habitats. A recent study in northern Europe generated an extrapolated fungal richness map of Estonia using an ITS marker that confirmed a heterogeneous geographic distribution with hotspots and cold spots at the national scale (Tedersoo et al., 2020). Altogether, these observations stress the need to assess more intensive samplings at different scales in order to describe robustly the global distribution of soil fungal diversity and its determinism (Dini-Andreote et al., 2021).
The soil fungal community is well known for being largely dominated by a few highly abundant taxa and including a large number of rare taxa (Egidi et al., 2019). Few biogeography studies have focused on abundant and rare taxa through the different alpha-diversity metrics (e.g., Hill numbers) (Bent and Forney, 2008). However, comparing the spatial distribution of dominant and rare biosphere fungi is important to better grasp the environmental determinism that shapes soil fungal diversity (Mo et al., 2018). Mapping of richness (q=0, including all OTUs), and “typical” (q=1, including common fungal OTU abundances) and dominant (q=2, including OTUs with high relative abundance) fungal OTUs revealed different spatial patterns, “patchier” (i.e., spatially more diffuse) for q=0 with 231 km radius, and “spottier” (i.e., spatially more restricted) for q=1 (27 km) and q=2 (36 km). These results altogether suggest a “patchier” pattern, generally considered less stochastic than a “spottier” distribution (Dequiedt et al., 2011; Terrat al., 2015). A similar observation was made in eastern China, with different spatial distributions of rare and dominant soil fungal OTUs based on the ITS marker (the authors did not use Hill numbers but relative abundance and a threshold to group rare and dominant OTUs), suggesting differential sensitivity to various environmental filters leading to an increase in the endemicity of particular dominant taxa (Jiao and Lu, 2020).
The decrease in the explained variance between the q=0, q=1 and q=2 Hill numbers indicates that environmental and spatial characteristics had a low influence on the national distribution of dominant OTUs. These are generally regarded as generalist and more driven by stochastic processes, whereas rare taxa are more driven by deterministic processes (Zhao et al., 2022; Jia et al., 2018; Xu et al., 2022a, b). The spottier distribution observed for q=2 could support this hypothesis of a more random distribution across France less influenced by environmental filters. Whatever the Hill numbers, the main filters explaining the variance of fungal diversity were the soil characteristics: soil pH was the main driver, followed by clay content for q=0 and q=1 and the trophic conditions for q=2 (organic C and total Fe contents). Such an influence of soil trophic resources on dominant fungal OTU diversity seems in accordance with their generalist and copiotrophic strategy (Wang et al., 2021). Numerous studies have reported the importance of soil pH in the distribution of fungal richness across different scales (Rousk et al., 2010; Glassman et al., 2017; Tedersoo et al., 2014, 2020; George et al., 2019b). Interestingly, we revealed a unimodal relationship of soil pH with fungal diversity, whereas most studies found either a positive or a negative linear relationship (Tedersoo et al., 2014; Maestre et al., 2015; Bastida et al., 2021; Yang et al., 2019). Such a discrepancy could be partly explained by the large pH range recorded in France – 3.7 to 9 – versus 3.6 to 5.2 in Wales (George et al., 2019b) or more surprisingly 3.34 to 10.43 at the European scale (Fernandez-Ugalde et al., 2022). Emphasizing our hypothesis, other studies report the same unimodal relationship for fungi by using ITS marker and even for bacteria (Bickel et al., 2019; Tedersoo et al., 2020). As for bacterial richness across France, fungal richness was lower in fine-textured soil, which is not congruent with the results obtained in Wales based on the 18S rDNA marker (George et al., 2019b). In France, we may think that fine-textured soils offer less diverse habitats for fungi, as previously reported (Witzgall et al., 2021; Tecon and Or, 2017). This might be partly explained by the decrease in microscale heterogeneity with increasing clay content, leading to a lower diversity of microbial habitats and a smaller hosting capacity for various indigenous microbial species (Tecon and Or, 2017). Finally, some soil heavy metals were minor but represented significant drivers of fungal richness. A positive relationship was observed with total lead but a negative one with cadmium and nickel. These metallic elements occur naturally, result from human activities, and are known to be toxic for soil fungi when accumulated in the environment (Sun et al., 2022; Ding et al., 2022). In crop soils, significant Cd accumulation through the input of phosphate fertilizers extracted from contaminated limestone rocks has been observed (Khan et al., 2017) and our results could reflect the significant impact of this contamination on soil fungi at a broad scale.
Conversely to bacterial biogeography at the scale of France, climate conditions have been identified as important global filters of the distribution of fungal diversity across France for all Hill numbers based on three different orders of diversity (Terrat et al., 2017). The highest fungal richness and the highest typical OTU diversity found under oceanic climate may be partly explained by particular conditions such as buffered mean temperature and humidity inducing soil homeothermy and stability of water availability favorable to fungal development (Canini et al., 2019; Jiao et al., 2021). By contrast, the high variability in these conditions between seasons could explain the decline observed under Mediterranean climate. The poor influence of climate on the diversity of abundant fungal OTUs across France could reflect their generalist strategy better adapted to a high magnitude of environmental fluctuations over time, as previously observed in eastern China (Jiao and Lu, 2020). Moreover, our results indicate that rare fungi were more present in geographical regions with abundant annual rainfall and mild mean temperature, in line with the observation of increasing fungal richness with frequent rainfall (Tedersoo et al., 2014; Wang et al., 2018; Bahram et al., 2018).
In France, each land use corresponds to a particular intensity of soil disturbance resulting from the intensification of agricultural practices. We can rank the different land uses according to the intensity level of their soil disturbance as follows: forests < grasslands < crops < vineyards/orchards. The crop systems – vineyards in particular – use pesticides and soil tillage that have deleterious effects on fungal diversity (Karimi et al., 2021; Christel et al., 2021). We observed the highest richness (q=0) and typical (q=1) OTU diversity in grasslands and crops corresponding to the intermediate levels of disturbance. Similar observations have been reported about nematodes (Vazquez et al., 2019), bacteria (Delgado-Baquerizo et al., 2018; Terrat et al., 2017), and fungi by using an 18S rDNA marker (George et al., 2019b) at different scales. Conversely, no difference has been reported between forest, grassland, and crop soils in Estonia (Tedersoo et al., 2020), and decreased fungal richness has been reported between temperate-forest and crop soils at a global scale (Bastida et al., 2021). Our observations support the intermediate disturbance hypothesis (IDH) stating that the species richness of an ecosystem is maximized when it is submitted to an intermediate disturbance and minimized when it is submitted either to a low disturbance by a competitive exclusion process or to a high disturbance by a selection process (Connell, 1978; Wilkinson, 1999; Giller et al., 1998). More precisely, agricultural practices such as tillage can stimulate microbial richness in crop systems (Szoboszlay et al., 2017; Lienhard et al., 2013), and the highest level of richness is generally explained by the coexistence of microorganisms with different ecological strategies that promote ecosystem stability (Griffiths and Philippot, 2013). Interestingly, we also observed the highest diversity of dominant fungal OTUs (inverse Simpson index, Hill q=2) in crop systems versus the lowest diversity in grasslands, in line with previous studies reporting a similar trend in grassland and crop soils (Xu et al., 2017; Zhang et al., 2022). This observation suggests that increased fungal diversity in intensive soil management crop systems is consistent with decreased fungal evenness.
Analyzing fungal diversity according to the different land managements within each land use highlighted the highest fungal diversity in the agricultural systems when crop rotation included grasslands. Inserting temporary grasslands into the rotations is well known for improving soil quality in terms of nutrient provision and recycling, soil structure, and biological regulation (Martin et al., 2020) and could favor the development of soil fungi, as previously described at the landscape scale in Brittany by using an 18S rDNA marker (western France, Le Guillou et al., 2019). More fundamentally, this statement also raises the question of the influence of aboveground (plant) diversity on the abundance and diversity of belowground (micro-)organisms due to the maintenance of diverse habitats in soils and changes in nutrient cycling poorly investigated in crop systems to date (Wardle et al., 2004). Among forest ecosystems, deciduous forests seem to provide the most favorable conditions for fungal diversity. Across France, deciduous forests present the highest tree family richness compared to mixed and coniferous forests (data not shown). Therefore, our results are in line with studies showing that plant species richness positively affects the soil fungal diversity (Tedersoo et al., 2016; Hiiesalu et al., 2017). The lowest fungal diversity observed in coniferous forest soil also confirmed the strong influence of the lower availability and/or degradability of organic substrates provided by this litter for microorganisms (Leckie et al., 2004; De Boer et al., 2005). However, other parameters such as plant genotype, forest stand age, or tree density not taken into account in the present study could also affect fungal diversity (Tedersoo et al., 2016; Hazard and Johnson, 2018; Spake et al., 2015). In contrast, no difference related to the different types of grassland or to the distinction between vineyards and orchards was recorded.
Beyond fungal alpha diversity, the analysis of co-occurrence networks is a relevant way of providing a more comprehensive view of fungal diversity and its interactions according to environmental variations on a broad scale (Karimi et al., 2017). As previously observed for bacterial co-occurrence networks across France, land use intensity affects the complexity of fungal networks (Karimi et al., 2019). Although forest ecosystems exhibited the lowest fungal richness, they harbored the highest complexity of fungal co-occurrence networks. Strong losses of about 83 % of the links between forests and vineyards and about 75 % between “forests” on the one hand and “grasslands and crop systems” on the other hand were observed across France. A similar trend has been observed for bacterial networks across France (Karimi et al., 2019) and also for fungi along a transect from forests to vineyards in Australia (Xue et al., 2022). However, soil fungal interaction networks remain poorly described when comparing land uses on a broad scale. The lowest fungal diversity and the lowest complexity of interaction networks observed in vineyard and orchard soils could be related to the intensification of agricultural practices in these systems (Karimi et al., 2019). Vineyard soils are indeed known to be strongly disturbed by intensive tillage, restricted plant cover, and large pesticide inputs (Quiquerez et al., 2022). This intensification of agricultural practices can lead to the isolation of fungal taxa and the loss of links between taxa in these soils by (i) reducing microbial biomass and hence a lower probability of each cell encountering another and interacting with it (Dequiedt et al., 2011), (ii) stimulating self-sufficient opportunistic microorganisms that do not interact with others (Lienhard et al., 2013), and (iii) reducing the spatial connectivity between soil ecological niches due to soil tillage and compaction and hence physical isolation of fungal taxa (Cordero and Datta, 2016). Altogether, our results confirm that forest soils remain a favorable habitat for soil fungi by representing a mosaic of connected ecological niches that are fully complete and shared by non-opportunistic taxa (Karimi et al., 2019). Interestingly, the highest fungal diversity and lowest complexity of interaction networks were observed in oceanic climate soils. The lowest fungal diversity and a very low complexity of interaction networks were also observed under the climate of the southwestern basin. Finally, the lowest fungal diversity and the lowest complexity of interaction networks were observed under Mediterranean climate (region types 6 and 8). The soils under Mediterranean climate presented the greatest level of stress, with the highest annual temperatures and the lowest annual precipitation, and did not provide favorable ecological niches for fungal diversity.
At the scale of France, by using the 18S rDNA gene, the soil fungal diversity is driven by soil characteristics, land management, and climatic conditions. Soil pH was the most important soil property explaining rare and abundant fungal diversity. The lowest fungal richness was found in less disturbed environments (forests) and highly disturbed environments (vineyards and orchards) compared to grasslands and croplands. Highly disturbed environments (crops, vineyards, and orchards) harbored the lowest fungal network complexity compared to forest soils, which harbored the most connected networks. Our study confirms that a nationwide survey is relevant to deeply investigating the spatial distribution and determinism of soil fungal diversity.
In addition, compiling data obtained from different molecular markers (ITS and 18S rDNA) could significantly improve the description and comprehensiveness of the soil fungal diversity. The multiplication and sum of such studies conducted across the world could greatly upgrade biodiversity conservation policies and provide representative repositories dedicated to soil microorganisms in the context of global change. To go further, it will be important to explore fungal beta diversity and fungal taxonomy at the scale of France in order to reach a more comprehensive understanding of spatial distribution, ecological processes, and environmental filters. Finally, it will also be important to investigate the ecological and functional trait assignment of soil fungal communities using recent tools and databases developed to better predict the shift in soil functioning according to land management intensity (Djemiel et al., 2022).
The fungal DNA sequencing datasets supporting the results presented in this article are available at the EBI ENA https://www.ebi.ac.uk/ena/browser/api/xml/PRJEB57875 (MetaOMIC-RMQS, 2024) under accession number PRJEB57875. The code that supports the findings of this study is available from the first author upon request.
The supplement related to this article is available online at: https://doi.org/10.5194/soil-10-251-2024-supplement.
All the authors conceptualized the research project. CJ coordinated the RMQS program and the soil sampling at the territory scale. LR is the scientific coordinator of the different projects dealing with the characterization of the soil microbial communities at the scale of France. CG, SP, GC, JT, and ML performed the molecular analyses. PW and CC contributed to DNA sequencing. CD and ST performed the bioinformatics analyses. CJ, NPAS, and LB provided the environmental dataset. CD, SD, WH, AB, and NPAS contributed to the statistical and geostatistical analyses. CD and LR wrote the original draft. CD, ST, NPAS, CJ, LB, AP, PAM, and LR reviewed and edited the final paper.
At least one of the (co-)authors is a member of the editorial board of SOIL. The peer-review process was guided by an independent editor, and the authors also have no other competing interests to declare.
Publisher’s note: Copernicus Publications remains neutral with regard to jurisdictional claims made in the text, published maps, institutional affiliations, or any other geographical representation in this paper. While Copernicus Publications makes every effort to include appropriate place names, the final responsibility lies with the authors.
All our results are part of a science program that will result in the publication of a French atlas of soil fungi. In this context, we thank Francis Martin (research director emeritus at INRAE in Nancy, France) and Guillaume Eyssartier (honorary research associate at the National Museum of Natural History in Paris, France) – both international experts in soil fungi – for their comments and validation of our results based on the 18S rDNA molecular marker so as to robustly assess the soil fungal diversity of French soils. This study was supported by France Génomique (project no. ANR-10-INBS-09-08) and by the AgroEcoSol project coordinated by Aurea Agrosciences in partnership with INRAE and ARVALIS. The project is supported by ADEME as part of the Eco-efficient Industry and Agriculture program of the Future Investments program (project no. 1782C0109). We also thank the French Biodiversity Agency, the Roullier Endowment Fund, and the TMCE company, which financed part of this evaluation. In addition, due to the involvement of technical facilities of the GenoSol platform (https://doi.org/10.15454/L7QN45) of the ANAEE-Services infrastructure, a grant was provided by the French state through the National Agency for Research under the Investments for the Future program (reference ANR-11-INBS-0001) as well as a grant from the Regional Council of Bourgogne Franche Comté. The BRC GenoSol is a part of BRC4Env (10.15454/TRBJTB), the Environmental Resources pillar of the AgroBRC-RARe research infrastructure. RMQS soil sampling and physicochemical analyses were supported by the French Scientific Group of Interest on soils, the GisSol, involving the French Ministry for an Ecological Transition and Territorial Cohesion (MCT), the French Ministry of Agriculture and Food (MASA), ADEME, the French Biodiversity Agency (OFB), the National Institute of Geographic and Forest Information (IGN), the French Institute for Research and Development (IRD), the French Geological Survey (BRGM), and INRAE. We thank all the soil surveyors and technical assistants involved in sampling the sites and the staff of the European Soil Samples Conservatory (INRAE Orléans) for preparing the soil samples. Calculations were performed using high-performance computing (HPC) resources from DNUM CCUB (Centre de Calcul de l'Université de Bourgogne). Thanks are also extended to Frédérick Gavory for submitting the dataset to EBI ENA and Annie Buchwalter for correcting and improving the English language in an earlier version of the manuscript.
This study was supported by France Génomique (project no. ANR-10-INBS-09-08) and by the AgroEcoSol project coordinated by Aurea Agrosciences in partnership with INRAE and ARVALIS. The project is supported by ADEME as part of the Eco-efficient Industry and Agriculture program of the Future Investments program (project no. 1782C0109). We also thank the French Biodiversity Agency, the Roullier Endowment Fund, and the TMCE company, which financed part of this evaluation.
This paper was edited by Elizabeth Bach and reviewed by César Marín and one anonymous referee.
Alberdi, A. and Gilbert, M. T. P.: A guide to the application of Hill numbers to DNA-based diversity analyses, Mol. Ecol. Resour., 19, 804–817, https://doi.org/10.1111/1755-0998.13014, 2019.
Bahram, M., Hildebrand, F., Forslund, S. K., Anderson, J. L., Soudzilovskaia, N. A., Bodegom, P. M., Bengtsson-Palme, J., Anslan, S., Coelho, L. P., Harend, H., Huerta-Cepas, J., Medema, M. H., Maltz, M. R., Mundra, S., Olsson, P. A., Pent, M., Põlme, S., Sunagawa, S., Ryberg, M., Tedersoo, L., and Bork, P.: Structure and function of the global topsoil microbiome, Nature, 560, 233–237, https://doi.org/10.1038/s41586-018-0386-6, 2018.
Baldrian, P., Větrovský, T., Lepinay, C., and Kohout, P.: High-throughput sequencing view on the magnitude of global fungal diversity, Fungal Divers., 114, 539–547, https://doi.org/10.1007/s13225-021-00472-y, 2022.
Ballabio, C., Panagos, P., and Monatanarella, L.: Mapping topsoil physical properties at European scale using the LUCAS database, Geoderma, 261, 110–123, https://doi.org/10.1016/j.geoderma.2015.07.006, 2016.
Banos, S., Lentendu, G., Kopf, A., Wubet, T., Glöckner, F. O., and Reich, M.: A comprehensive fungi-specific 18S rRNA gene sequence primer toolkit suited for diverse research issues and sequencing platforms, BMC Microbiol., 18, 190, https://doi.org/10.1186/s12866-018-1331-4, 2018.
Bar-On, Y. M., Phillips, R., and Milo, R.: The biomass distribution on Earth, P. Natl. Acad. Sci., 115, 6506–6511, https://doi.org/10.1073/pnas.1711842115, 2018.
Bastida, F., Eldridge, D. J., García, C., Kenny Png, G., Bardgett, R. D., and Delgado-Baquerizo, M.: Soil microbial diversity–biomass relationships are driven by soil carbon content across global biomes, ISME J., 15, 2081–2091, https://doi.org/10.1038/s41396-021-00906-0, 2021.
Bent, S. J. and Forney, L. J.: The tragedy of the uncommon: understanding limitations in the analysis of microbial diversity, ISME J., 2, 689–695, https://doi.org/10.1038/ismej.2008.44, 2008.
Berbee, M. L., Strullu-Derrien, C., Delaux, P. M., Strother, P. K., Kenrick, P., Selosse, M. A., and Taylor, J. W.: Genomic and fossil windows into the secret lives of the most ancient fungi, Nat. Rev. Microbiol., 18, 717–730, https://doi.org/10.1038/s41579-020-0426-8, 2020.
Bickel, S., Chen, X., Papritz, A., and Or, D.: A hierarchy of environmental covariates control the global biogeography of soil bacterial richness, Sci. Rep., 9, 12129, https://doi.org/10.1038/s41598-019-48571-w, 2019.
Bivand, R., Keitt, T., Rowlingson, B., Pebesma, E., Sumner, M., Hijmans, R., Rouault, E., and Bivand, M. R.: Package “rgdal”, Bindings for the Geospatial Data Abstraction Library, https://cran.r-project.org/web/packages/rgdal/index.html (last access: 15 October 2017), 2015.
Blackwell, M.: The fungi: 1, 2, 3 …5.1 million species?, Am. J. Bot., 98, 426–38, https://doi.org/10.3732/ajb.1000298, 2011.
Bonneville, S., Delpomdor, F., Preat, A., Chevalier, C., Araki, T., Kazemian, M., Steele, A., Schreiber, A., Wirth, R., and Benning, L. G.: Molecular identification of fungi microfossils in a Neoproterozoic shale rock, Sci. Adv., 6, eaax7599, https://doi.org/10.1126/sciadv.aax7599, 2020.
Calabon, M. S., Hyde, K. D., Jones, E. B. G., Luo, Z. L., Dong, W., Hurdeal, V. G., Gentekaki, E., Rossi, W., Leonardi, M., Thiyagaraja, V., Lestari, A. S., Shen, H. W., Bao, D. F., Boonyuen, N., and Zeng, M.: Freshwater fungal numbers, Fungal Divers., 114, 3–235, https://doi.org/10.1007/s13225-022-00503-2, 2022.
Canini, F., Zucconi, L., Pacelli, C., Selbmann, L., Onofri, S., and Geml, J.: Vegetation, pH and Water Content as Main Factors for Shaping Fungal Richness, Community Composition and Functional Guilds Distribution in Soils of Western Greenland, Front. Microbiol., 10, 2348, https://doi.org/10.3389/fmicb.2019.02348, 2019.
Chao, A., Gotelli, N. J., Hsieh, T. C., Sander, E. L., Ma, K. H., Colwell, R. K., and Ellison, A. M.: Rarefaction and extrapolation with Hill numbers: a framework for sampling and estimation in species diversity studies, Ecol. Monogr., 84, 45–67, https://doi.org/10.1890/13-0133.1, 2014.
Chemidlin Prévost-Bouré, N., Christen, R., Dequiedt, S., Mougel, C., Lelièvre, M., Jolivet, C., Shahbazkia, H. R., Guillou, L., Arrouays, D., and Ranjard, L.: Validation and Application of a PCR Primer Set to Quantify Fungal Communities in the Soil Environment by Real-Time Quantitative PCR, PLoS ONE, 6, e24166, https://doi.org/10.1371/journal.pone.0024166, 2011.
Christel, A., Maron, P.-A., and Ranjard, L.: Impact of farming systems on soil ecological quality: a meta-analysis, Environ. Chem. Lett., 19, 4603–4625, https://doi.org/10.1007/s10311-021-01302-y, 2021.
Chu, H., Gao, G.-F., Ma, Y., Fan, K., and Delgado-Baquerizo, M.: Soil Microbial Biogeography in a Changing World: Recent Advances and Future Perspectives, mSystems, 5, e00803-19, https://doi.org/10.1128/mSystems.00803-19, 2020.
Connell, J. H.: Diversity in Tropical Rain Forests and Coral Reefs, Science, 199, 1302–1310, https://doi.org/10.1126/science.199.4335.1302, 1978.
Cordero, O. X. and Datta, M. S.: Microbial interactions and community assembly at microscales, Curr. Opin. Microbiol., 31, 227–234, https://doi.org/10.1016/j.mib.2016.03.015, 2016.
De Boer, W., Folman, L. B., Summerbell, R. C., and Boddy, L.: Living in a fungal world: Impact of fungi on soil bacterial niche development, FEMS Microbiol. Rev., 29, 795–811, https://doi.org/10.1016/j.femsre.2004.11.005, 2005.
Delgado-Baquerizo, M., Oliverio, A. M., Brewer, T. E., Benavent-González, A., Eldridge, D. J., Bardgett, R. D., Maestre, F. T., Singh, B. K., and Fierer, N.: A global atlas of the dominant bacteria found in soil, Science, 359, 320–325, https://doi.org/10.1126/science.aap9516, 2018.
Dequiedt, S., Saby, N. P. A., Lelievre, M., Jolivet, C., Thioulouse, J., Toutain, B., Arrouays, D., Bispo, A., Lemanceau, P., and Ranjard, L.: Biogeographical patterns of soil molecular microbial biomass as influenced by soil characteristics and management, Glob. Ecol. Biogeogr., 20, 641–652, https://doi.org/10.1111/j.1466-8238.2010.00628.x, 2011.
de Vries, F. T., Thébault, E., Liiri, M., Birkhofer, K., Tsiafouli, M. A., Bjørnlund, L., Bracht Jørgensen, H., Brady, M. V., Christensen, S., de Ruiter, P. C., D'Hertefeldt, T., Frouz, J., Hedlund, K., Hemerik, L., Hol, W. H. G., Hotes, S., Mortimer, S. R., Setälä, H., Sgardelis, S. P., Uteseny, K., van der Putten, W. H., Wolters, V., and Bardgett, R. D.: Soil food web properties explain ecosystem services across European land use systems, P. Natl. Acad. Sci. USA, 110, 14296–14301, https://doi.org/10.1073/pnas.1305198110, 2013.
Ding, C., Chen, J., Zhu, F., Chai, L., Lin, Z., Zhang, K., and Shi, Y.: Biological Toxicity of Heavy Metal(loid)s in Natural Environments: From Microbes to Humans, Front. Environ. Sci., 10, 920957, https://doi.org/10.3389/fenvs.2022.920957, 2022.
Dini-Andreote, F., Kowalchuk, G. A., Prosser, J. I., and Raaijmakers, J. M.: Towards meaningful scales in ecosystem microbiome research, Environ. Microbiol., 23, 1–4, https://doi.org/10.1111/1462-2920.15276, 2021.
Djemiel, C., Dequiedt, S., Karimi, B., Cottin, A., Girier, T., El Djoudi, Y., Wincker, P., Lelièvre, M., Mondy, S., Chemidlin Prévost-Bouré, N., Maron, P. A., Ranjard, L., and Terrat, S.: BIOCOM-PIPE: a new user-friendly metabarcoding pipeline for the characterization of microbial diversity from 16S, 18S and 23S rRNA gene amplicons, BMC Bioinformatics, 21, 492, https://doi.org/10.1186/s12859-020-03829-3, 2020.
Djemiel, C., Maron, P. A., Terrat, S., Dequiedt, S., Cottin, A., and Ranjard, L.: Inferring microbiota functions from taxonomic genes: a review, GigaScience, 11, giab090, https://doi.org/10.1093/gigascience/giab090, 2022.
Egidi, E., Delgado-Baquerizo, M., Plett, J. M., Wang, J., Eldridge, D. J., Bardgett, R. D., Maestre, F. T., and Singh, B. K.: A few Ascomycota taxa dominate soil fungal communities worldwide, Nat. Commun., 10, 2369, https://doi.org/10.1038/s41467-019-10373-z, 2019.
Fausto, A., Rodrigues, M. L., and Coelho, C.: The still underestimated problem of fungal diseases worldwide, Front. Microbiol., 10, 214, https://doi.org/10.3389/fmicb.2019.00214, 2019.
Fernandez-Ugalde, O., Scarpa, S., Orgiazzi, A., Panagos, P., Van Liedekerke, M., Marechal, A., and Jones, A.: LUCAS 2018 Soil Module, ISBN 978-92-76-54832-4, 2022.
Fierer, N. and Jackson, R. B.: The diversity and biogeography of soil bacterial communities, P. Natl. Acad. Sci. USA, 103, 626–631, https://doi.org/10.1073/pnas.0507535103, 2006.
Finn, D. R., Lee, S., Lanzén, A., Bertrand, M., Nicol, G. W., and Hazard, C.: Cropping systems impact changes in soil fungal, but not prokaryote, alpha-diversity and community composition stability over a growing season in a long-term field trial, FEMS Microbiol. Ecol., 97, fiab136, https://doi.org/10.1093/femsec/fiab136, 2021.
Frac, M., Hannula, S. E., Belka, M., and Jȩdryczka, M.: Fungal biodiversity and their role in soil health, Front. Microbiol., 9, 1–9, https://doi.org/10.3389/fmicb.2018.00707, 2018.
Geisen, S., Wall, D. H., and van der Putten, W. H.: Challenges and Opportunities for Soil Biodiversity in the Anthropocene, Curr. Biol., 29, R1036–R1044, https://doi.org/10.1016/j.cub.2019.08.007, 2019.
Genre, A., Lanfranco, L., Perotto, S., and Bonfante, P.: Unique and common traits in mycorrhizal symbioses, Nat. Rev. Microbiol., 18, 649–660, https://doi.org/10.1038/s41579-020-0402-3, 2020.
George, P. B. L., Lallias, D., Creer, S., Seaton, F. M., Kenny, J. G., Eccles, R. M., Griffiths, R. I., Lebron, I., Emmett, B. A., Robinson, D. A., and Jones, D. L.: Divergent national-scale trends of microbial and animal biodiversity revealed across diverse temperate soil ecosystems, Nat. Commun., 10, 1107, https://doi.org/10.1038/s41467-019-09031-1, 2019a.
George, P. B. L., Creer, S., Griffiths, R. I., Emmett, B. A., Robinson, D. A., and Jones, D. L.: Primer and Database Choice Affect Fungal Functional but Not Biological Diversity Findings in a National Soil Survey, Front. Environ. Sci., 7, 173, https://doi.org/10.3389/fenvs.2019.00173, 2019b.
Giller, K. E., Witter, E., and Mcgrath, S. P.: Toxicity of heavy metals to microorganisms and microbial processes in agricultural soils: A review, Soil Biol. Biochem., 30, 1389–1414, https://doi.org/10.1016/S0038-0717(97)00270-8, 1998.
Glassman, S. I., Wang, I. J., and Bruns, T. D.: Environmental filtering by pH and soil nutrients drives community assembly in fungi at fine spatial scales, Mol. Ecol., 26, 6960–6973, https://doi.org/10.1111/mec.14414, 2017.
Granger, V., Bez, N., Fromentin, J., Meynard, C., Jadaud, A., and Mérigot, B.: Mapping diversity indices: not a trivial issue, Methods Ecol. Evol., 6, 688–696, https://doi.org/10.1111/2041-210X.12357, 2015.
Griffiths, B. S. and Philippot, L.: Insights into the resistance and resilience of the soil microbial community, FEMS Microbiol. Rev., 37, 112–129, https://doi.org/10.1111/j.1574-6976.2012.00343.x, 2013.
Griffiths, R. I., Thomson, B. C., James, P., Bell, T., Bailey, M., and Whiteley, A. S.: The bacterial biogeography of British soils, Environ. Microbiol., 13, 1642–1654, https://doi.org/10.1111/j.1462-2920.2011.02480.x, 2011.
Le Guillou, C., Chemidlin Prévost-Bouré, N., Karimi, B., Akkal-Corfini, N., Dequiedt, S., Nowak, V., Terrat, S., Menasseri-Aubry, S., Viaud, V., Maron, P., and Ranjard, L.: Tillage intensity and pasture in rotation effectively shape soil microbial communities at a landscape scale, MicrobiologyOpen, 8, e00676, https://doi.org/10.1002/mbo3.676, 2019.
Hage, H. and Rosso, M. N.: Evolution of fungal carbohydrate-active enzyme portfolios and adaptation to plant cell-wall polymers, J. Fungi, 7, 1–16, https://doi.org/10.3390/jof7030185, 2021.
Handcock, M. S., Hunter, D. R., Butts, C. T., Goodreau, S. M., Krivitsky, P. N., Bender-deMoll, S., Morris, M., and Morris, M. M.: Package “statnet”, https://github.com/statnet/statnet (last access: 2 April 2024), 2019.
Hannula, S. E. and Träger, S.: Soil fungal guilds as important drivers of the plant richness–productivity relationship, New Phytol., 226, 947–949, https://doi.org/10.1111/nph.16523, 2020.
Hawksworth, D. L. and Lücking, R.: Fungal Diversity Revisited: 2.2 to 3.8 Million Species, Microbiol. Spectr., 5, 10–128, https://doi.org/10.1128/microbiolspec.funk-0052-2016, 2017.
Hazard, C. and Johnson, D.: Does genotypic and species diversity of mycorrhizal plants and fungi affect ecosystem function?, New Phytol., 220, 1122–1128, https://doi.org/10.1111/nph.15010, 2018.
Hiiesalu, I., Bahram, M., and Tedersoo, L.: Plant species richness and productivity determine the diversity of soil fungal guilds in temperate coniferous forest and bog habitats, Mol. Ecol., 26, 4846–4858, https://doi.org/10.1111/mec.14246, 2017.
Hsieh, T. C., Ma, K. H., and Chao, A.: iNEXT: an R package for rarefaction and extrapolation of species diversity (Hill numbers), Methods Ecol. Evol., 7, 1451–1456, https://doi.org/10.1111/2041-210X.12613, 2016.
Hyde, K. D.: The numbers of fungi, Fungal Divers., 114, p. 1, https://doi.org/10.1007/s13225-022-00507-y, 2022.
Hyndman, R. J., Athanasopoulos, G., Bergmeir, C., Caceres, G., Chhay, L., O'Hara-Wild, M., Petropoulos, F., Razbash, S., and Wang, E.: Package “forecast”, https://github.com/robjhyndman/forecast (last access: 10 January 2022), 2020.
Jia, X., Dini-Andreote, F., and Falcão Salles, J.: Community Assembly Processes of the Microbial Rare Biosphere, Trends Microbiol., 26, 738–747, https://doi.org/10.1016/j.tim.2018.02.011, 2018.
Jiao, S. and Lu, Y.: Abundant fungi adapt to broader environmental gradients than rare fungi in agricultural fields, Glob. Change Biol., 26, 4506–4520, https://doi.org/10.1111/gcb.15130, 2020.
Jiao, S., Zhang, B., Zhang, G., Chen, W., and Wei, G.: Stochastic community assembly decreases soil fungal richness in arid ecosystems, Mol. Ecol., 30, 4338–4348, https://doi.org/10.1111/mec.16047, 2021.
Jolivet, C., Arrouays, D., Boulonne, L., Ratié, C., and Saby, N.: Le réseau de mesures de la qualité des sols de France (RMQS), Etat D'avancement Prem. Résultats Etude Gest. Sols, 13, 149–164, 2006.
Jolivet, C., Almeida Falcon, J.-L., Berché, P., Boulonne, L., Fontaine, M., Gouny, L., Lehmann, S., Maitre, B., Ratié, C., Schellenberger, E., and Soler-Dominguez, N.: French Soil Quality Monitoring Network Manual RMQS2: second metropolitan campaign 2016–2027, ISBN: 2-7380-1451-8, https://doi.org/10.17180/KC64-NY88, 2022.
Jousset, A., Bienhold, C., Chatzinotas, A., Gallien, L., Gobet, A., Kurm, V., Küsel, K., Rillig, M. C., Rivett, D. W., Salles, J. F., van der Heijden, M. G. A., Youssef, N. H., Zhang, X., Wei, Z., and Hol, W. H. G.: Where less may be more: how the rare biosphere pulls ecosystems strings, ISME J., 11, 853–862, https://doi.org/10.1038/ismej.2016.174, 2017.
Karimi, B., Maron, P. A., Chemidlin-Prevost Boure, N., Bernard, N., Gilbert, D., and Ranjard, L.: Microbial diversity and ecological networks as indicators of environmental quality, Environ. Chem. Lett., 15, 265–281, https://doi.org/10.1007/s10311-017-0614-6, 2017.
Karimi, B., Terrat, S., Dequiedt, S., Saby, N. P. A., Horrigue, W., Lelièvre, M., Nowak, V., Jolivet, C., Arrouays, D., Wincker, P., Cruaud, C., Bispo, A., Maron, P.-A., Bouré, N. C. P., and Ranjard, L.: Biogeography of soil bacteria and archaea across France, Sci. Adv., 4, eaat1808, https://doi.org/10.1126/sciadv.aat1808, 2018.
Karimi, B., Dequiedt, S., Terrat, S., Jolivet, C., Arrouays, D., Wincker, P., Cruaud, C., Bispo, A., Chemidlin Prévost-Bouré, N., and Ranjard, L.: Biogeography of Soil Bacterial Networks along a Gradient of Cropping Intensity, Sci. Rep., 9, 3812, https://doi.org/10.1038/s41598-019-40422-y, 2019.
Karimi, B., Villerd, J., Dequiedt, S., Terrat, S., Chemidlin-Prévost Bouré, N., Djemiel, C., Lelièvre, M., Tripied, J., Nowak, V., Saby, N. P. A., Bispo, A., Jolivet, C., Arrouays, D., Wincker, P., Cruaud, C., and Ranjard, L.: Biogeography of soil microbial habitats across France, Glob. Ecol. Biogeogr., 29, 1399–1411, https://doi.org/10.1111/geb.13118, 2020.
Karimi, B., Masson, V., Guilland, C., Leroy, E., Pellegrinelli, S., Giboulot, E., Maron, P.-A., and Ranjard, L.: Ecotoxicity of copper input and accumulation for soil biodiversity in vineyards, Environ. Chem. Lett., 19, 2013–2030, https://doi.org/10.1007/s10311-020-01155-x, 2021.
Khan, M. A., Khan, S., Khan, A., and Alam, M.: Soil contamination with cadmium, consequences and remediation using organic amendments, Sci. Total Environ., 601/602, 1591–1605, https://doi.org/10.1016/j.scitotenv.2017.06.030, 2017.
Komsta, L. and Komsta, M. L.: Package “outliers”, Med. Univ. Lub. Lub., https://cran.r-project.org/web/packages/outliers/index.html (last access: 26 March 2022), 2011.
Lark, R. M.: Modelling complex soil properties as contaminated regionalized variables, Geoderma, 106, 173–190, https://doi.org/10.1016/S0016-7061(01)00123-9, 2002.
Leckie, S. E., Prescott, C. E., Grayston, S. J., Neufeld, J. D., and Mohn, W. W.: Characterization of Humus Microbial Communities in Adjacent Forest Types That Differ in Nitrogen Availability, Microb. Ecol., 48, 29–40, https://doi.org/10.1007/s00248-003-1020-0, 2004.
Legendre, P.: Numerical ecology, Elsevier, 487–493, https://doi.org/10.1016/B978-0-12-409548-9.10595-0, 2018.
Lehmann, A., Zheng, W., Ryo, M., Soutschek, K., Roy, J., Rongstock, R., Maaß, S., and Rillig, M. C.: Fungal Traits Important for Soil Aggregation, Front. Microbiol., 10, 2904, https://doi.org/10.3389/fmicb.2019.02904, 2020.
Lentendu, G., Wubet, T., Chatzinotas, A., Wilhelm, C., Buscot, F., and Schlegel, M.: Effects of long-term differential fertilization on eukaryotic microbial communities in an arable soil: A multiple barcoding approach, Mol. Ecol., 23, 3341–3355, https://doi.org/10.1111/mec.12819, 2014.
Li, Y., Steenwyk, J. L., Chang, Y., Wang, Y., James, T. Y., Stajich, J. E., Spatafora, J. W., Groenewald, M., Dunn, C. W., Hittinger, C. T., Shen, X. X., and Rokas, A.: A genome-scale phylogeny of the kingdom Fungi, Curr. Biol., 31, 1653–1665, https://doi.org/10.1016/j.cub.2021.01.074, 2021.
Lienhard, P., Tivet, F., Chabanne, A., Dequiedt, S., Lelièvre, M., Sayphoummie, S., Leudphanane, B., Prévost-Bouré, N. C., Séguy, L., Maron, P.-A., and Ranjard, L.: No-till and cover crops shift soil microbial abundance and diversity in Laos tropical grasslands, Agron. Sustain. Dev., 33, 375–384, https://doi.org/10.1007/s13593-012-0099-4, 2013.
Loron, C. C., François, C., Rainbird, R. H., Turner, E. C., Borensztajn, S., and Javaux, E. J.: Early fungi from the Proterozoic era in Arctic Canada, Nature, 570, 232–235, https://doi.org/10.1038/s41586-019-1217-0, 2019.
Lumley, T. and Lumley, M. T.: Package “leaps”, Regres. Subset Sel. Thomas Lumley Based Fortran Code Alan Mill. Available Online HttpCRAN R-Proj. Orgpackage Leaps, https://cran.r-project.org/web/packages/leaps/index.html (last access: 16 January 2020), 2013.
Ma, B., Dai, Z., Wang, H., Dsouza, M., Liu, X., He, Y., Wu, J., Rodrigues, J. L. M., Gilbert, J. A., Brookes, P. C., and Xu, J.: Distinct Biogeographic Patterns for Archaea, Bacteria, and Fungi along the Vegetation Gradient at the Continental Scale in Eastern China, mSystems, 2, 10–128, https://doi.org/10.1128/mSystems.00174-16, 2017.
Maestre, F. T., Delgado-Baquerizo, M., Jeffries, T. C., Eldridge, D. J., Ochoa, V., Gozalo, B., Quero, J. L., García-Gómez, M., Gallardo, A., Ulrich, W., Bowker, M. A., Arredondo, T., Barraza-Zepeda, C., Bran, D., Florentino, A., Gaitán, J., Gutiérrez, J. R., Huber-Sannwald, E., Jankju, M., Mau, R. L., Miriti, M., Naseri, K., Ospina, A., Stavi, I., Wang, D., Woods, N. N., Yuan, X., Zaady, E., and Singh, B. K.: Increasing aridity reduces soil microbial diversity and abundance in global drylands, P. Natl. Acad. Sci. USA, 112, 15684–15689, https://doi.org/10.1073/pnas.1516684112, 2015.
Martin, G., Durand, J.-L., Duru, M., Gastal, F., Julier, B., Litrico, I., Louarn, G., Médiène, S., Moreau, D., Valentin-Morison, M., Novak, S., Parnaudeau, V., Paschalidou, F., Vertès, F., Voisin, A.-S., Cellier, P., and Jeuffroy, M.-H.: Role of ley pastures in tomorrow's cropping systems. A review, Agron. Sustain. Dev., 40, 25 pp., https://doi.org/10.1007/s13593-020-00620-9, 2020.
MetaOMIC-RMQS: Determinism of biogeographical patterns and network interactions of soil fungal diversity across France, Genoscope [data set], https://www.ebi.ac.uk/ena/browser/view/PRJEB57875, last access: 26 March 2024.
Minasny, B., McBratney, A. B., and Hartemink, A. E.: Global pedodiversity, taxonomic distance, and the World Reference Base, Geoderma, 155, 132–139, https://doi.org/10.1016/j.geoderma.2009.04.024, 2010.
Miyauchi, S., Kiss, E., Kuo, A., Drula, E., Kohler, A., Sánchez-García, M., Morin, E., Andreopoulos, B., Barry, K. W., Bonito, G., Buée, M., Carver, A., Chen, C., Cichocki, N., Clum, A., Culley, D., Crous, P. W., Fauchery, L., Girlanda, M., Hayes, R. D., Kéri, Z., LaButti, K., Lipzen, A., Lombard, V., Magnuson, J., Maillard, F., Murat, C., Nolan, M., Ohm, R. A., Pangilinan, J., Pereira, M. de F., Perotto, S., Peter, M., Pfister, S., Riley, R., Sitrit, Y., Stielow, J. B., Szöllősi, G., Žifčáková, L., Štursová, M., Spatafora, J. W., Tedersoo, L., Vaario, L.-M., Yamada, A., Yan, M., Wang, P., Xu, J., Bruns, T., Baldrian, P., Vilgalys, R., Dunand, C., Henrissat, B., Grigoriev, I. V., Hibbett, D., Nagy, L. G., and Martin, F. M.: Large-scale genome sequencing of mycorrhizal fungi provides insights into the early evolution of symbiotic traits, Nat. Commun., 11, 5125, https://doi.org/10.1038/s41467-020-18795-w, 2020.
Mo, Y., Zhang, W., Yang, J., Lin, Y., Yu, Z., and Lin, S.: Biogeographic patterns of abundant and rare bacterioplankton in three subtropical bays resulting from selective and neutral processes, ISME J., 12, 2198–2210, https://doi.org/10.1038/s41396-018-0153-6, 2018.
Möller, M. and Stukenbrock, E. H.: Evolution and genome architecture in fungal plant pathogens, Nat. Rev. Microbiol., 15, 756–771, https://doi.org/10.1038/nrmicro.2017.76, 2017.
Mora, C., Tittensor, D. P., Adl, S., Simpson, A. G. B., and Worm, B.: How many species are there on earth and in the ocean?, PLoS Biol., 9, e1001127, https://doi.org/10.1371/journal.pbio.1001127, 2011.
Naimi, B.: USDM: Uncertainty analysis for species distribution models, R package version 1.1–15, R Doc. Httpwww Rdocu-Mentation Orgpackagesusdm, https://github.com/babaknaimi/usdm (last access: 25 June 2017), 2015.
Naranjo-Ortiz, M. A. and Gabaldón, T.: Fungal evolution: major ecological adaptations and evolutionary transitions, Biol. Rev., 94, 1443–1476, https://doi.org/10.1111/brv.12510, 2019.
Nawrocki, E. P. and Eddy, S. R.: Infernal 1.1: 100-fold faster RNA homology searches, Bioinformatics, 29, 2933–2935, https://doi.org/10.1093/bioinformatics/btt509, 2013.
Nilsson, R. H., Tedersoo, L., Abarenkov, K., Ryberg, M., Kristiansson, E., Hartmann, M., Schoch, C. L., Nylander, J. A. A., Bergsten, J., Porter, T. M., Jumpponen, A., Vaishampayan, P., Ovaskainen, O., Hallenberg, N., Bengtsson-Palme, J., Eriksson, K. M., Larsson, K.-H., Larsson, E., and Kõljalg, U.: Five simple guidelines for establishing basic authenticity and reliability of newly generated fungal ITS sequences, MycoKeys, 4, 37–63, https://doi.org/10.3897/mycokeys.4.3606, 2012.
Nilsson, R. H., Wurzbacher, C., Bahram, M., R. M. Coimbra, V., Larsson, E., Tedersoo, L., Eriksson, J., Duarte, C., Svantesson, S., Sánchez-García, M., Ryberg, M. K., Kristiansson, E., and Abarenkov, K.: Top 50 most wanted fungi, MycoKeys, 12, 29–40, https://doi.org/10.3897/mycokeys.12.7553, 2016.
Oksanen, J., Blanchet, F. G., Kindt, R., Legendre, P., Minchin, P. R., and O'Hara, R. B.: Package “vegan”, Community ecology package, version, 2, 1–295, https://github.com/vegandevs/vegan (last access: 11 October 2022), 2013.
Pärtel, M., Öpik, M., Moora, M., Tedersoo, L., Szava-Kovats, R., Rosendahl, S., Rillig, M. C., Lekberg, Y., Kreft, H., Helgason, T., Eriksson, O., Davison, J., Bello, F., Caruso, T., and Zobel, M.: Historical biome distribution and recent human disturbance shape the diversity of arbuscular mycorrhizal fungi, New Phytol., 216, 227–238, https://doi.org/10.1111/nph.14695, 2017.
Pauvert, C., Buée, M., Laval, V., Edel-Hermann, V., Fauchery, L., Gautier, A., Lesur, I., Vallance, J., and Vacher, C.: Bioinformatics matters: The accuracy of plant and soil fungal community data is highly dependent on the metabarcoding pipeline, Fungal Ecol., 41, 23–33, https://doi.org/10.1016/j.funeco.2019.03.005, 2019.
Peng, Y., Li, S. J., Yan, J., Tang, Y., Cheng, J. P., Gao, A. J., Yao, X., Ruan, J. J., and Xu, B. L.: Research Progress on Phytopathogenic Fungi and Their Role as Biocontrol Agents, Front. Microbiol., 12, 670135, https://doi.org/10.3389/fmicb.2021.670135, 2021.
Phukhamsakda, C., Nilsson, R. H., Bhunjun, C. S., de Farias, A. R. G., Sun, Y.-R., Wijesinghe, S. N., Raza, M., Bao, D.-F., Lu, L., Tibpromma, S., Dong, W., Tennakoon, D. S., Tian, X.-G., Xiong, Y.-R., Karunarathna, S. C., Cai, L., Luo, Z.-L., Wang, Y., Manawasinghe, I. S., Camporesi, E., Kirk, P. M., Promputtha, I., Kuo, C.-H., Su, H.-Y., Doilom, M., Li, Y., Fu, Y.-P., and Hyde, K. D.: The numbers of fungi: contributions from traditional taxonomic studies and challenges of metabarcoding, Fungal Divers., 114, 327–386, https://doi.org/10.1007/s13225-022-00502-3, 2022.
Quiquerez, A., Garcia, J.-P., Dequiedt, S., Djemiel, C., Terrat, S., Mathieu, O., Sassi, A., and Ranjard, L.: Legacy of land-cover changes on soil microbiology in Burgundy vineyards (Pernand-Vergelesses, France), OENO One, 56, 223–237, https://doi.org/10.20870/oeno-one.2022.56.2.5432, 2022.
Ranjard, L., Dequiedt, S., Chemidlin Prévost-Bouré, N., Thioulouse, J., Saby, N. P. A., Lelievre, M., Maron, P. A., Morin, F. E. R., Bispo, A., Jolivet, C., Arrouays, D., and Lemanceau, P.: Turnover of soil bacterial diversity driven by wide-scale environmental heterogeneity, Nat. Commun., 4, 1434, https://doi.org/10.1038/ncomms2431, 2013.
Rivett, D. W. and Bell, T.: Abundance determines the functional role of bacterial phylotypes in complex communities, Nat. Microbiol., 3, 767–772, https://doi.org/10.1038/s41564-018-0180-0, 2018.
Roswell, M., Dushoff, J., and Winfree, R.: A conceptual guide to measuring species diversity, Oikos, 130, 321–338, https://doi.org/10.1111/oik.07202, 2021.
Rousk, J., Bååth, E., Brookes, P. C., Lauber, C. L., Lozupone, C., Caporaso, J. G., Knight, R., and Fierer, N.: Soil bacterial and fungal communities across a pH gradient in an arable soil., ISME J., 4, 1340–51, https://doi.org/10.1038/ismej.2010.58, 2010.
Sadet-Bourgeteau, S., Houot, S., Karimi, B., Mathieu, O., Mercier, V., Montenach, D., Morvan, T., Sappin-Didier, V., Watteau, F., Nowak, V., Dequiedt, S., and Maron, P. A.: Microbial communities from different soil types respond differently to organic waste input, Appl. Soil Ecol., 143, 70–79, https://doi.org/10.1016/j.apsoil.2019.05.026, 2019.
Shannon, P., Markiel, A., Ozier, O., Baliga, N. S., Wang, J. T., Ramage, D., Amin, N., Schwikowski, B., and Ideker, T.: Cytoscape: A Software Environment for Integrated Models of Biomolecular Interaction Networks, Genome Res., 13, 2498–2504, https://doi.org/10.1101/gr.1239303, 2003.
Shi, L., Dossa, G. G. O., Paudel, E., Zang, H., Xu, J., and Harrison, R. D.: Changes in fungal communities across a forest disturbance gradient, Appl. Environ. Microbiol., 85, e00080-19, https://doi.org/10.1128/AEM.00080-19, 2019.
Sommermann, L., Geistlinger, J., Wibberg, D., Deubel, A., Zwanzig, J., Babin, D., Schlüter, A., and Schellenberg, I.: Fungal community profiles in agricultural soils of a long-term field trial under different tillage, fertilization and crop rotation conditions analyzed by high-throughput ITS-amplicon sequencing, PLOS ONE, 13, e0195345, https://doi.org/10.1371/journal.pone.0195345, 2018.
Spake, R., Ezard, T. H. G., Martin, P. A., Newton, A. C., and Doncaster, C. P.: A meta-analysis of functional group responses to forest recovery outside of the tropics, Conserv. Biol., 29, 1695–1703, https://doi.org/10.1111/cobi.12548, 2015.
Stefan, L., Hartmann, M., Engbersen, N., Six, J., and Schöb, C.: Positive Effects of Crop Diversity on Productivity Driven by Changes in Soil Microbial Composition, Front. Microbiol., 12, 660749, https://doi.org/10.3389/fmicb.2021.660749, 2021.
Sun, H., Shao, C., Jin, Q., Li, M., Zhang, Z., Liang, H., Lei, H., Qian, J., and Zhang, Y.: Effects of cadmium contamination on bacterial and fungal communities in Panax ginseng-growing soil, BMC Microbiol., 22, 77, https://doi.org/10.1186/s12866-022-02488-z, 2022.
Szoboszlay, M., Dohrmann, A. B., Poeplau, C., Don, A., and Tebbe, C. C.: Impact of land-use change and soil organic carbon quality on microbial diversity in soils across Europe, FEMS Microbiol. Ecol., 93, fix146, https://doi.org/10.1093/femsec/fix146, 2017.
Taylor, D. L., Hollingsworth, T. N., McFarland, J. W., Lennon, N. J., Nusbaum, C., and Ruess, R. W.: A first comprehensive census of fungi in soil reveals both hyperdiversity and fine-scale niche partitioning, Ecol. Monogr., 84, 3–20, https://doi.org/10.1890/12-1693.1, 2014.
Tecon, R. and Or, D.: Biophysical processes supporting the diversity of microbial life in soil, FEMS Microbiol. Rev., 41, 599–623, https://doi.org/10.1093/femsre/fux039, 2017.
Tedersoo, L., Bahram, M., Põlme, S., Kõljalg, U., Yorou, N. S., Wijesundera, R., Ruiz, L. V., Vasco-Palacios, A. M., Thu, P. Q., Suija, A., Smith, M. E., Sharp, C., Saluveer, E., Saitta, A., Rosas, M., Riit, T., Ratkowsky, D., Pritsch, K., Põldmaa, K., Piepenbring, M., Phosri, C., Peterson, M., Parts, K., Pärtel, K., Otsing, E., Nouhra, E., Njouonkou, A. L., Nilsson, R. H., Morgado, L. N., Mayor, J., May, T. W., Majuakim, L., Lodge, D. J., Lee, S. S., Larsson, K.-H., Kohout, P., Hosaka, K., Hiiesalu, I., Henkel, T. W., Harend, H., Guo, L., Greslebin, A., Grelet, G., Geml, J., Gates, G., Dunstan, W., Dunk, C., Drenkhan, R., Dearnaley, J., De Kesel, A., Dang, T., Chen, X., Buegger, F., Brearley, F. Q., Bonito, G., Anslan, S., Abell, S., and Abarenkov, K.: Global diversity and geography of soil fungi, Science, 346, 1256688, https://doi.org/10.1126/science.1256688, 2014.
Tedersoo, L., Bahram, M., Cajthaml, T., Põlme, S., Hiiesalu, I., Anslan, S., Harend, H., Buegger, F., Pritsch, K., Koricheva, J., and Abarenkov, K.: Tree diversity and species identity effects on soil fungi, protists and animals are context dependent, ISME J., 10, 346–362, https://doi.org/10.1038/ismej.2015.116, 2016.
Tedersoo, L., Anslan, S., Bahram, M., Drenkhan, R., Pritsch, K., Buegger, F., Padari, A., Hagh-Doust, N., Mikryukov, V., Gohar, D., Amiri, R., Hiiesalu, I., Lutter, R., Rosenvald, R., Rähn, E., Adamson, K., Drenkhan, T., Tullus, H., Jürimaa, K., Sibul, I., Otsing, E., Põlme, S., Metslaid, M., Loit, K., Agan, A., Puusepp, R., Varik, I., Kõljalg, U., and Abarenkov, K.: Regional-Scale In-Depth Analysis of Soil Fungal Diversity Reveals Strong pH and Plant Species Effects in Northern Europe, Front. Microbiol., 11, 1953, https://doi.org/10.3389/fmicb.2020.01953, 2020.
Tedersoo, L., Mikryukov, V., Anslan, S., Bahram, M., Khalid, A. N., Corrales, A., Agan, A., Vasco-Palacios, A.-M., Saitta, A., Antonelli, A., Rinaldi, A. C., Verbeken, A., Sulistyo, B. P., Tamgnoue, B., Furneaux, B., Ritter, C. D., Nyamukondiwa, C., Sharp, C., Marín, C., Dai, D. Q., Gohar, D., Sharmah, D., Biersma, E. M., Cameron, E. K., De Crop, E., Otsing, E., Davydov, E. A., Albornoz, F. E., Brearley, F. Q., Buegger, F., Gates, G., Zahn, G., Bonito, G., Hiiesalu, I., Hiiesalu, I., Zettur, I., Barrio, I. C., Pärn, J., Heilmann-Clausen, J., Ankuda, J., Kupagme, J. Y., Sarapuu, J., Maciá-Vicente, J. G., Fovo, J. D., Geml, J., Alatalo, J. M., Alvarez-Manjarrez, J., Monkai, J., Põldmaa, K., Runnel, K., Adamson, K., Bråthen, K. A., Pritsch, K., Tchan, K. I., Armolaitis, K., Hyde, K. D., Newsham, K. K., Panksep, K., Adebola, L. A., Lamit, L. J., Saba, M., Da Silva Cáceres, M. E., Tuomi, M., Gryzenhout, M., Bauters, M., Bálint, M., Wijayawardene, N., Hagh-Doust, N., Yorou, N. S., Kurina, O., Mortimer, P. E., Meidl, P., Nilsson, R. H., Puusepp, R., Casique-Valdés, R., Drenkhan, R., Garibay-Orijel, R., Godoy, R., Alfarraj, S., Rahimlou, S., Põlme, S., Dudov, S. V., Mundra, S., Ahmed, T., Netherway, T., Henkel, T. W., Roslin, T., Fedosov, V. E., Onipchenko, V. G., Yasanthika, W. A. E., Lim, Y. W., Piepenbring, M., Klavina, D., Kõljalg, U., and Abarenkov, K.: The Global Soil Mycobiome consortium dataset for boosting fungal diversity research, Fungal Divers., 111, 573–588, https://doi.org/10.1007/s13225-021-00493-7, 2021.
Terrat, S., Christen, R., Dequiedt, S., Lelièvre, M., Nowak, V., Regnier, T., Bachar, D., Plassart, P., Wincker, P., Jolivet, C., Bispo, A., Lemanceau, P., Maron, P.-A., Mougel, C., and Ranjard, L.: Molecular biomass and MetaTaxogenomic assessment of soil microbial communities as influenced by soil DNA extraction procedure., Microb. Biotechnol., 5, 135–41, https://doi.org/10.1111/j.1751-7915.2011.00307.x, 2012.
Terrat, S., Plassart, P., Bourgeois, E., Ferreira, S., Dequiedt, S., Adele-Dit-De-Renseville, N., Lemanceau, P., Bispo, A., Chabbi, A., Maron, P. A., and Ranjard, L.: Meta-barcoded evaluation of the ISO standard 11063 DNA extraction procedure to characterize soil bacterial and fungal community diversity and composition, Microb. Biotechnol., 8, 131–142, https://doi.org/10.1111/1751-7915.12162, 2015.
Terrat, S., Horrigue, W., Dequietd, S., Saby, N. P. A., Lelièvre, M., Nowak, V., Tripied, J., Régnier, T., Jolivet, C., Arrouays, D., Wincker, P., Cruaud, C., Karimi, B., Bispo, A., Maron, P. A., Prévost-Bouré, N. C., and Ranjard, L.: Mapping and predictive variations of soil bacterial richness across France, PLoS ONE, 12, 5–8, https://doi.org/10.1371/journal.pone.0186766, 2017.
Terrat, S., Djemiel, C., Journay, C., Karimi, B., Dequiedt, S., Horrigue, W., Maron, P., Chemidlin Prévost-Bouré, N., and Ranjard, L.: ReClustOR: a re-clustering tool using an open-reference method that improves operational taxonomic unit definition, Methods Ecol. Evol., 11, 168–180, https://doi.org/10.1111/2041-210X.13316, 2019.
Thomson, B. C., Tisserant, E., Plassart, P., Uroz, S., Griffiths, R. I., Hannula, S. E., Buée, M., Mougel, C., Ranjard, L., Van Veen, J. A., Martin, F., Bailey, M. J., and Lemanceau, P.: Soil conditions and land use intensification effects on soil microbial communities across a range of European field sites, Soil Biol. Biochem., 88, 403–413, https://doi.org/10.1016/j.soilbio.2015.06.012, 2015.
Treseder, K. K. and Lennon, J. T.: Fungal Traits That Drive Ecosystem Dynamics on Land, Microbiol. Mol. Biol. Rev., 79, 243–262, https://doi.org/10.1128/MMBR.00001-15, 2015.
Tsiafouli, M. A., Thébault, E., Sgardelis, S. P., de Ruiter, P. C., van der Putten, W. H., Birkhofer, K., Hemerik, L., de Vries, F. T., Bardgett, R. D., Brady, M. V., Bjornlund, L., Jørgensen, H. B., Christensen, S., Hertefeldt, T. D., Hotes, S., Gera Hol, W. H., Frouz, J., Liiri, M., Mortimer, S. R., Setälä, H., Tzanopoulos, J., Uteseny, K., Pižl, V., Stary, J., Wolters, V., and Hedlund, K.: Intensive agriculture reduces soil biodiversity across Europe, Glob. Change Biol., 21, 973–985, https://doi.org/10.1111/gcb.12752, 2015.
Vazquez, C., Goede, R. G. M., Korthals, G. W., Rutgers, M., Schouten, A. J., and Creamer, R.: The effects of increasing land use intensity on soil nematodes: A turn towards specialism, Funct. Ecol., 33, 2003–2016, https://doi.org/10.1111/1365-2435.13417, 2019.
Větrovský, T., Kohout, P., Kopecký, M., Machac, A., Man, M., Bahnmann, B. D., Brabcová, V., Choi, J., Meszárošová, L., Human, Z. R., Lepinay, C., Lladó, S., López-Mondéjar, R., Martinović, T., Mašínová, T., Morais, D., Navrátilová, D., Odriozola, I., Štursová, M., Švec, K., Tláskal, V., Urbanová, M., Wan, J., Žifčáková, L., Howe, A., Ladau, J., Peay, K. G., Storch, D., Wild, J., and Baldrian, P.: A meta-analysis of global fungal distribution reveals climate-driven patterns, Nat. Commun., 10, 5142, https://doi.org/10.1038/s41467-019-13164-8, 2019.
Wang, D., Rui, Y., Ding, K., Cui, X., Hao, Y., Tang, L., Pang, Z., Zhang, B., Zhou, S., Wang, K., and Wang, Y.: Precipitation drives the biogeographic distribution of soil fungal community in Inner Mongolian temperate grasslands, J. Soil. Sediment., 18, 222–228, https://doi.org/10.1007/s11368-017-1727-z, 2018.
Wang, J.-T., Shen, J.-P., Zhang, L.-M., Singh, B. K., Delgado-Baquerizo, M., Hu, H.-W., Han, L.-L., Wei, W.-X., Fang, Y.-T., and He, J.-Z.: Generalist Taxa Shape Fungal Community Structure in Cropping Ecosystems, Front. Microbiol., 12, 678290, https://doi.org/10.3389/fmicb.2021.678290, 2021.
Ward, E. B., Duguid, M. C., Kuebbing, S. E., Lendemer, J. C., and Bradford, M. A.: The functional role of ericoid mycorrhizal plants and fungi on carbon and nitrogen dynamics in forests, New Phytol., 235, 1701–1718, https://doi.org/10.1111/nph.18307, 2022.
Wardle, D. A., Bardgett, R. D., Klironomos, J. N., Setälä, H., Van Der Putten, W. H., and Wall, D. H.: Ecological linkages between aboveground and belowground biota, Science, 304, 1629–1633, https://doi.org/10.1126/science.1094875, 2004.
Wilkinson, D. M.: The Disturbing History of Intermediate Disturbance, Oikos, 84, 145–147, https://doi.org/10.2307/3546874, 1999.
Witzgall, K., Vidal, A., Schubert, D. I., Höschen, C., Schweizer, S. A., Buegger, F., Pouteau, V., Chenu, C., and Mueller, C. W.: Particulate organic matter as a functional soil component for persistent soil organic carbon, Nat. Commun., 12, 4115, https://doi.org/10.1038/s41467-021-24192-8, 2021.
Wu, B., Hussain, M., Zhang, W., Stadler, M., Liu, X., and Xiang, M.: Current insights into fungal species diversity and perspective on naming the environmental DNA sequences of fungi, Mycology, 10, 127–140, https://doi.org/10.1080/21501203.2019.1614106, 2019.
Xu, M., Li, X., Cai, X., Li, X., Christie, P., and Zhang, J.: Land use alters arbuscular mycorrhizal fungal communities and their potential role in carbon sequestration on the Tibetan Plateau, Sci. Rep., 7, 3067, https://doi.org/10.1038/s41598-017-03248-0, 2017.
Xu, Q., Vandenkoornhuyse, P., Li, L., Guo, J., Zhu, C., Guo, S., Ling, N., and Shen, Q.: Microbial generalists and specialists differently contribute to the community diversity in farmland soils, J. Adv. Res., 40, 17–27, https://doi.org/10.1016/j.jare.2021.12.003, 2022a.
Xu, Q., Ling, N., Quaiser, A., Guo, J., Ruan, J., Guo, S., Shen, Q., and Vandenkoornhuyse, P.: Rare Bacteria Assembly in Soils Is Mainly Driven by Deterministic Processes, Microb. Ecol., 83, 137–150, https://doi.org/10.1007/s00248-021-01741-8, 2022b.
Xue, P., Minasny, B., and McBratney, A. B.: Land-use affects soil microbial co-occurrence networks and their putative functions, Appl. Soil Ecol., 169, 104184, https://doi.org/10.1016/j.apsoil.2021.104184, 2022.
Yang, T., Tedersoo, L., Soltis, P. S., Soltis, D. E., Gilbert, J. A., Sun, M., Shi, Y., Wang, H., Li, Y., Zhang, J., Chen, Z., Lin, H., Zhao, Y., Fu, C., and Chu, H.: Phylogenetic imprint of woody plants on the soil mycobiome in natural mountain forests of eastern China, ISME J., 13, 686–697, https://doi.org/10.1038/s41396-018-0303-x, 2019.
Zhang, T., Liu, Y., Sui, X., Frey, B., and Song, F.: Effects of Land Conversion on Soil Microbial Community Structure and Diversity in Songnen Plain, Northeast China, Sustain. Switz., 14, 10767, https://doi.org/10.3390/su141710767, 2022.
Zhao, Z., Ma, Y., Feng, T., Kong, X., Wang, Z., Zheng, W., and Zhai, B.: Assembly processes of abundant and rare microbial communities in orchard soil under a cover crop at different periods, Geoderma, 406, 115543, https://doi.org/10.1016/j.geoderma.2021.115543, 2022.