the Creative Commons Attribution 4.0 License.
the Creative Commons Attribution 4.0 License.
 | 12 Mar 2024
Model-based analysis of erosion-induced microplastic delivery from arable land to the stream network of a mesoscale catchment
Raphael Rehm
Peter Fiener
Soils are generally accepted as sinks for microplastics (MPs) but at the same time might be an MP source for inland waters. However, little is known regarding the potential MP delivery from soils to aquatic systems via surface runoff and erosion. This study provides, for the first time, an estimate of the extent of soil-erosion-induced MP delivery from an arable-dominated mesoscale catchment (390 km2) to its river network within a typical arable region of southern Germany. To do this, a soil erosion model was used and combined with the potential particular MP load of arable land from different sources (sewage sludge, compost, atmospheric deposition, and tyre wear) from 1950 onwards. The modelling resulted in an annual mean MP flux into the stream network of 6.33 kg MP a−1 in 2020, which was dominated by tyre wear (80 %). Overall, 0.11 %–0.17 % of the MPs applied to arable soils between 1950 and 2020 were transported into the stream network. In terms of mass, this small proportion was in the same range as the MP inputs from wastewater treatment plants within the test catchment. More MP (0.5 %–1 % of input between 1950 and 2020) was deposited in the grassland areas along the stream network, and this could be an additional source of MP during flood events. Most (5 % of the MP applied between 1950 and 2020) of the MP translocated by tillage and water erosion was buried under the plough layer. Thus, the main part of the MP added to arable land remained in the topsoil and is available for long-term soil erosion. This can be illustrated based on a “stop MP input in 2020” scenario, indicating that MP delivery to the stream network until 2100 would only be reduced by 14 %. Overall, arable land at risk of soil erosion represents a long-term MP sink but also a long-term MP source for inland waters.
- Article
(5396 KB) - Full-text XML
- BibTeX
- EndNote


The global microplastic (MP) contamination of different environmental compartments is currently the focus of different research fields (Zhang et al., 2022; Tian et al., 2022; Nasseri and Azizi, 2022). Among these, MPs in soils have increasingly received scientific attention (Sajjad et al., 2022; Chia et al., 2021; Zhou et al., 2020). Microplastics are mostly referred to as plastic particles or fibres in a size range of 1 to 5000 µm, originating from the breakdown of larger plastic items or from manufacturing at this scale for various purposes (Kim et al., 2021; Frias and Nash, 2019). Many MP sources have been identified for soil systems. Next to tyre wear (TW), stated as the main source (Knight et al., 2020; Sommer et al., 2018), littering (Scheurer and Bigalke, 2018) and atmospheric deposition (Brahney et al., 2020) also serve as MP input pathways. Arable soils, in particular, often experience additional MP inputs associated with agricultural soil management (Brandes, 2020). Mulch films (Ng et al., 2020), the use of compost and sewage sludge as organic fertilizers (Braun et al., 2021; Liu et al., 2014; Zhang et al., 2020), irrigation with contaminated (waste)water (Pérez-Reverón et al., 2022), and MP associated with coated fertilizer and seeds (Accinelli et al., 2021; Lian et al., 2021) have proven to be the main input paths. MP enters the soil system mostly via the surface and is mixed into the soil column via bioturbation (Heinze et al., 2022; Li et al., 2021) and, in the case of small particles, via infiltration (Li et al., 2021). In arable land, it is actively mixed into the plough layer via tillage operations (Weber et al., 2022; Zhao et al., 2022; Zubris and Richards, 2005). Depending on the tillage technique, the MP is worked into the soil at different depths and is more or less homogenized after repeated processing (Fiener et al., 2018; Weber et al., 2022). Moreover, tillage potentially leads to mechanical fragmentation of macroplastic but also reduces photochemical decomposition at the soil surface and reduces MP transport via water and wind (Colin et al., 1981; Corcoran, 2022; Feuilloley et al., 2005).
Despite the known pathways into the soil, knowledge of the fate of MP particles once they enter the soil system is limited (Guo et al., 2020; Hurley and Nizzetto, 2018; Tian et al., 2022). However, the question arises as to whether the terrestrial MP sink releases relevant amounts of MP for waterbodies via water erosion. If so, the soils, as an MP sink, could represent an important MP source for waterbodies. Besides very slow, not very well determined processes of plastic fragmentation (Corcoran, 2022), there is also only a small number of studies analysing vertical MP transport due to bioturbation (Heinze et al., 2022; Li et al., 2021) and leaching (Chia et al., 2021; Viaroli et al., 2022) within the soil column or lateral losses to other ecosystems via erosion processes (Borthakur et al., 2022; Bullard et al., 2021; Rehm et al., 2021).
The potential lateral transport via (water) erosion processes might be analysed using existing modelling techniques. Such approaches face two major challenges: require modelling approaches are required which allow the cumulative loss of MP to adjacent ecosystems to be determined while taking spatial differences in MP contamination and site-specific erosion into account. Moreover, the long-term change in MP concentrations in the plough layer should be considered, following mixing with subsoil at erosional sites or burial of MP below the plough layer at depositional sites.
In general, there are different water erosion modelling approaches available, ranging from physically oriented models (e.g. EROSION 3D, Schmidt et al., 1999; MCST, Fiener et al., 2008), which might be suitable for dealing with the specific particle size and density of MP during transport in the case of individual erosion events, to conceptual approaches, e.g. WaTEM/SEDEM (Van Oost et al., 2000; Van Rompaey et al., 2001), which are able to consider long-term cumulative MP soil contamination and the associated long-term soil and MP erosion, transport, and deposition. In general, models of the first type are very parameter and input data intensive and are mostly applied in small catchments, while the second type of model needs less detailed data and is often used for mesoscale catchments (Nunes et al., 2018). Following the requirements outlined above, conceptual, long-term approaches that account for spatial variability in MP soil contamination and erosion processes seemed to be more appropriate than process-oriented models to simulate the magnitude of erosion-induced MP delivery to the stream network of mesoscale catchments. As MP loss below the plough layer might be also important in reducing topsoil MP contamination, such a model approach should simulate not only water erosion but also tillage erosion processes leading to a reduction in the MP concentration at erosional sites and MP burial below the plough layer at depositional sites. One of the few models simulating long-term water and tillage erosion in a spatial context that updates the soil properties within the soil profile is the SPEROS-C model (Fiener et al., 2015; Van Oost et al., 2005a). The water and tillage erosion components of the model, originating from the WaTEM/SEDEM model (Van Oost et al., 2000; Van Rompaey et al., 2001), were tested in several micro- and mesoscale catchments (Krasa et al., 2005; Verstraeten and Prosser, 2008).
The general objective of this study is to investigate MP transport from arable land to the stream network in an example mesoscale (390 km2) arable catchment in southern Germany. Therefore, the model SPEROS-C was adjusted to study the importance of water and tillage erosion processes for particular MP transport. Specifically, this study focuses on the following areas: (i) quantifying the importance of the water erosion pathway for MP input to the stream network in an example mesoscale catchment while taking into account the large uncertainties, particularly in estimates of MP input to soil; (ii) determining the importance of different erosion processes in changing the MP concentration in the plough layer and burying MP below the plough layer; and (iii) using scenarios to determine future pathways of diffuse MP delivery into the stream network.
2.1 Test catchment
The catchment was chosen for two main reasons: (i) it represents an intensively used arable landscape in southern Germany with hilly terrain and highly productive, loess-burden soils, and (ii) the Bavarian State Office for Environment has monitored discharge and sediment delivery at the outlet since 1968, which allows the erosion component of the model to be tested. The mesoscale Glonn catchment (48°22′ N, 11°24′ E) covers 390 km2, and its altitude ranges from 578 m a.s.l. in the southwest to 447 m a.s.l. at its outlet in the northeast (Fig. 1). The mean annual temperature and mean precipitation of the region are 7.5 °C and 876 mm respectively, with the most intense rainfall events being associated with convective rainfall in summer. The hilly landscape (4.7 ± 3.7° main slope) is characterized by loamy Cambisols (WRB, 2015) on the elevated terrain and loamy Gleysols (WRB, 2015) in the valleys. Land cover in this area is dominated by arable land (54 %), followed by forest (21 %), grassland (14 %), and settlements (11 %) (Fig. 1). The main crops are arranged in a corn–grain rotation. Due to the rolling topography and the erosion-prone soils, a potential long-term mean soil erosion of 5.9 t ha−1 a−1 (based on the German version of the Universal Soil Loss Equation ABAG) could be calculated for arable land within the catchment (Bayerische Landesanstalt für Landwirtschaft, LfL, 2023), with potential erosion rates up to 10 t ha−1 a−1 (Fig. 1).
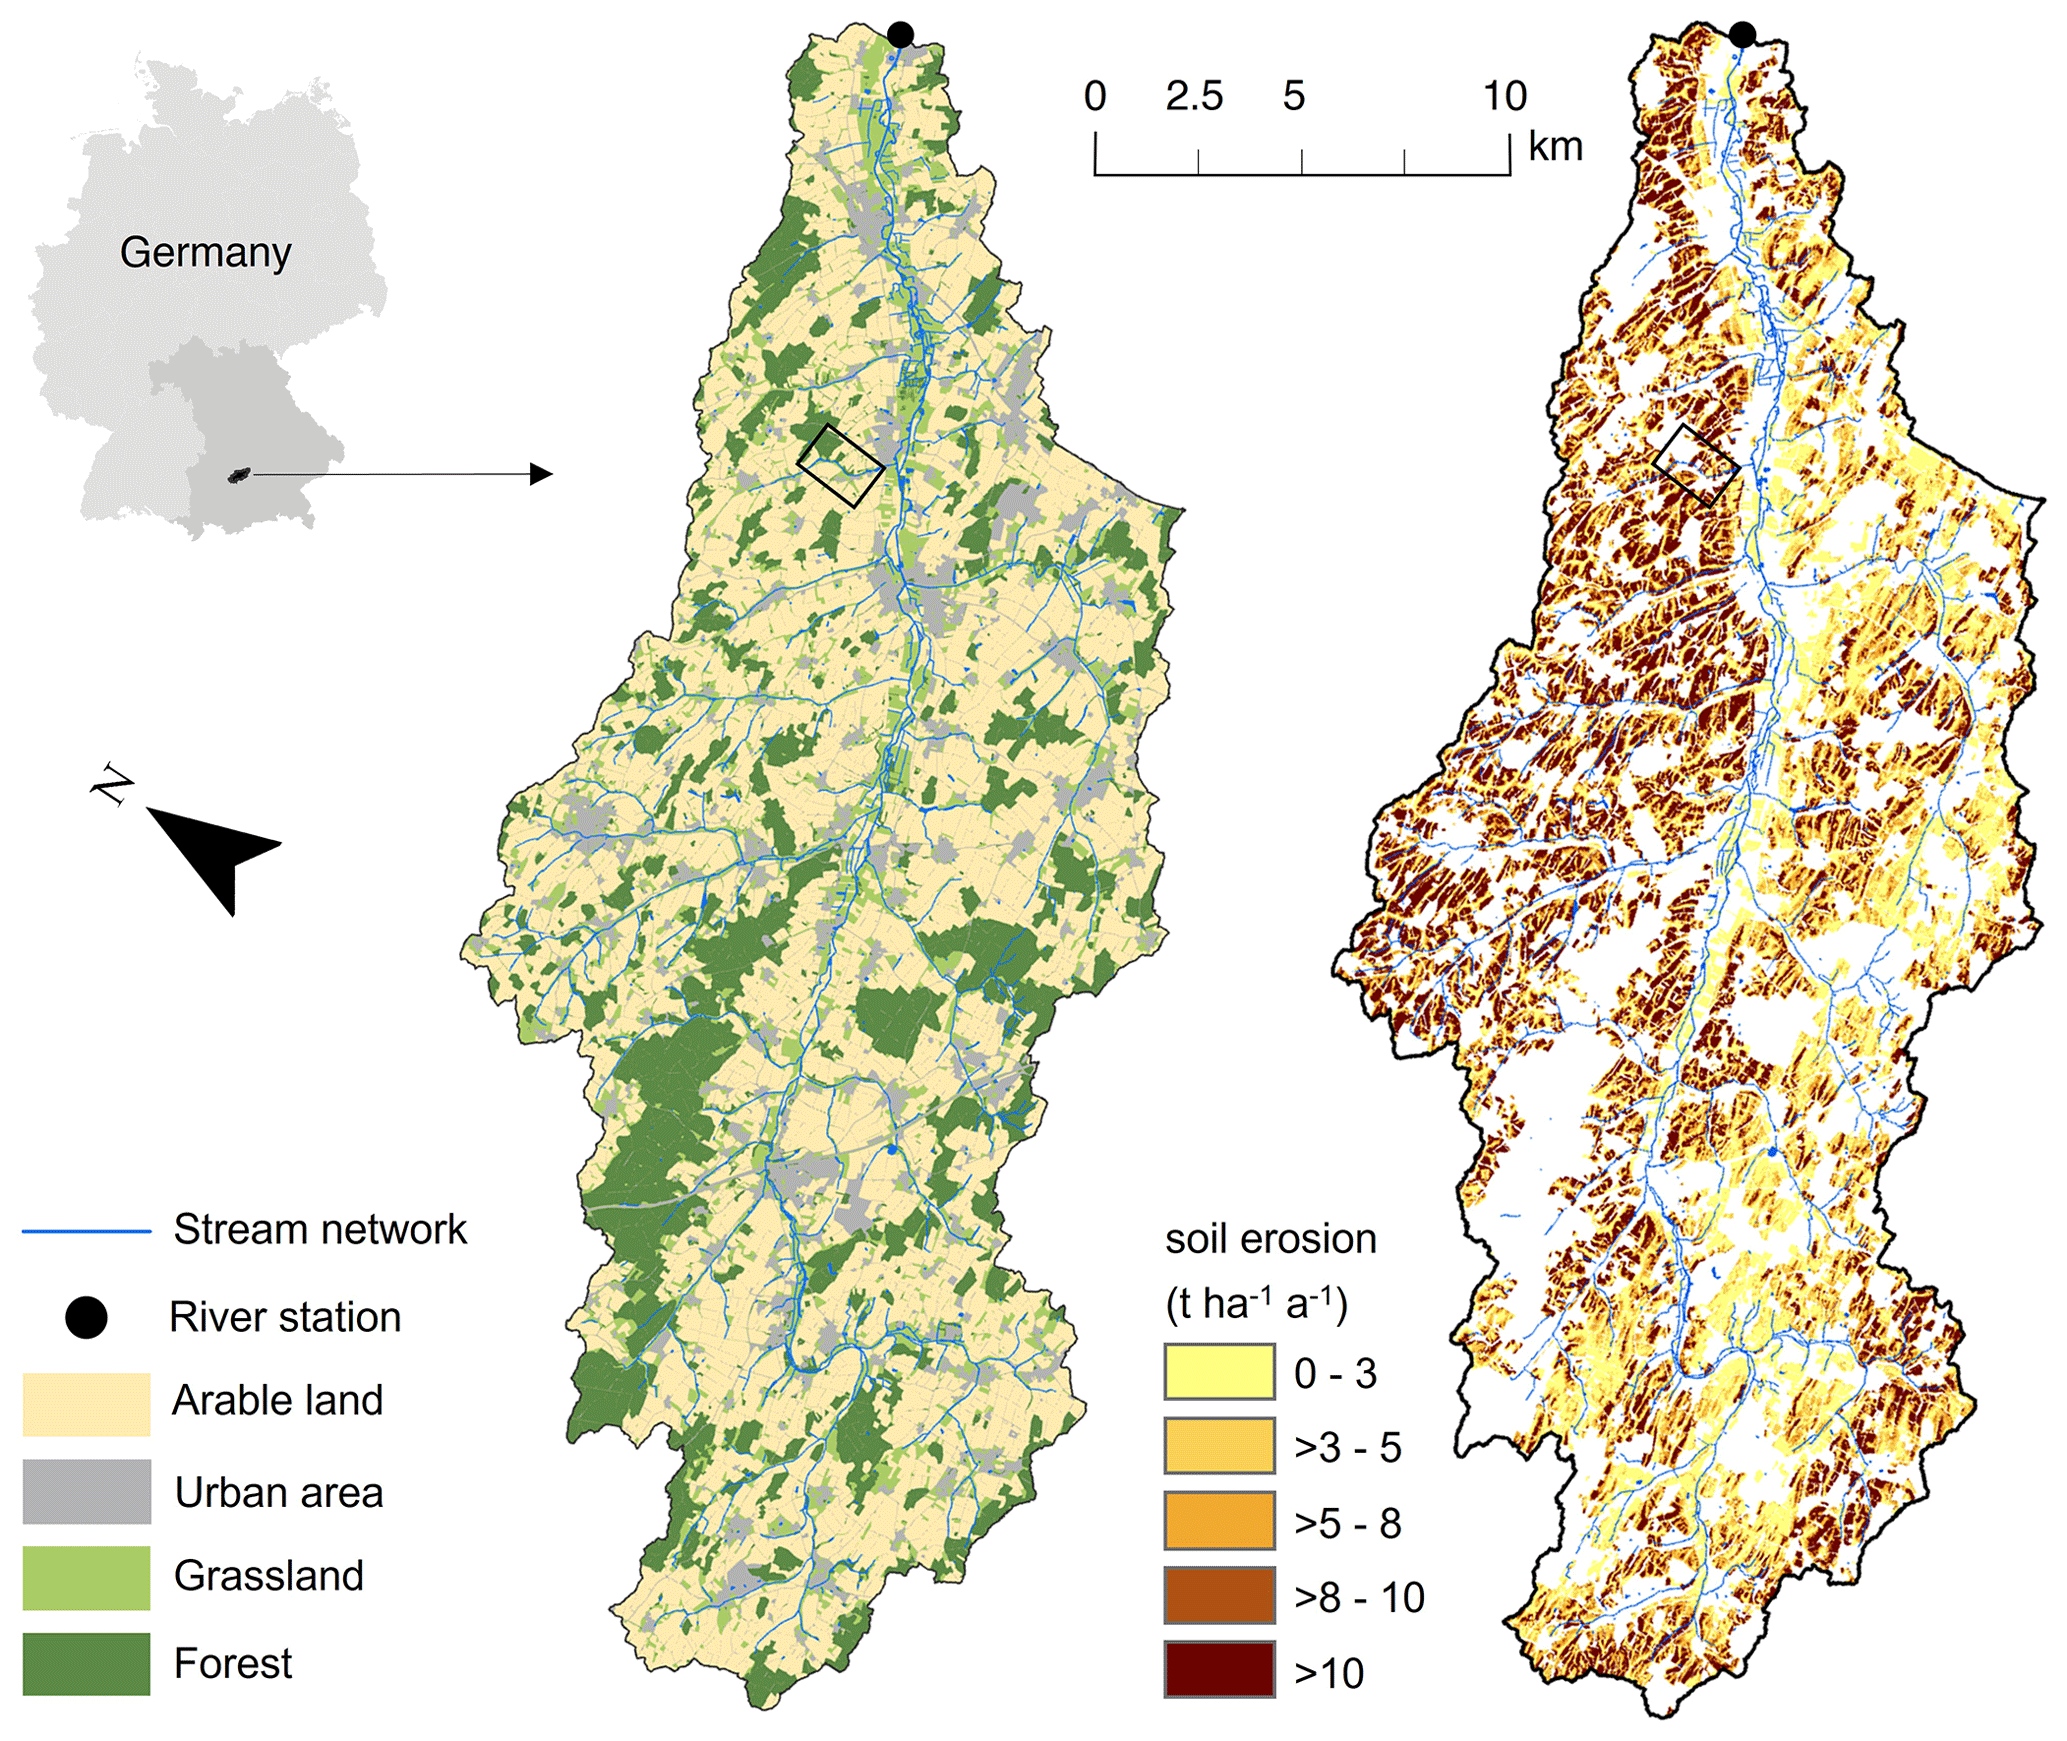
Figure 1The Glonn catchment (390 km2), representing a typical intensively used arable landscape in southern Germany. The left and right maps show the land use and the soil erosion within the catchment (with a potential long-term mean soil erosion of 5.9 t ha−1 a−1) respectively. The black rectangle in the catchment marks the section of the detailed maps in Fig. 6.
2.2 Model
The erosion and MP transport are modelled based on a modified version of the spatially distributed water and tillage erosion and carbon (C) turnover model SPEROS-C (Van Oost et al., 2005b; Fiener et al., 2015). SPEROS-C was deliberately selected as (i) it allows the spatially explicit integration of yearly MP inputs (1950–2020); (ii) it routes sediment and MP through the landscape while including deposition of both; and (iii) it includes water and tillage erosion, as well as a yearly soil profile update (10 layers of 10 cm thickness) accounting for changes in MP allocation following erosion or deposition. Both the modelled deposition and the MP soil profile update allow us to analyse potential MP landscape sinks either in space (e.g. in grassed areas) or in depths below the plough layer, where MP is not affected by water erosion anymore.
The model was originally developed to analyse the long-term effect of soil erosion on landscape-scale carbon balance (e.g. Nadeu et al., 2015), whereas the erosion components are based on the erosion and sediment transport model WaTEM/SEDEM, which was extensively tested and validated in different regions of the world (Krasa et al., 2005; Van Oost et al., 2000; Van Rompaey et al., 2001; Verstraeten and Prosser, 2008). The most important model components for this study are (i) the water erosion and sediment transport component, (ii) the tillage erosion component, and (iii) the lateral redistribution and the vertical mixing of MP in the soil profile following erosion and deposition processes. The model component responsible for C turnover was not used and focuses exclusively on the erosion, transport, and deposition of C as MP, taking into account the spatially differently distributed MP inputs from different MP sources. As a result of these changes, the model is referred to as SPEROS-MP for the purposes of this study. Based on the model structure, it cannot account for particle size-specific selective erosion; hence, the model does not consider preferential erosion of plastic particles depending on the size, shape, density, etc. of different polymers. However, the model can account for different transport pathways of different MP input sources, e.g. routing tyre wear from fields along streets throughout the catchment to the stream network.
2.2.1 Water erosion component
The water erosion component of SPEROS-MP consists of two main parts. First, the erosion potential of each raster cell (5 m × 5 m) is estimated based on the German version of the Universal Soil Loss Equation ABAG (Schwertmann et al., 1987). The major advantage of this well-tested approach is that the input data to calculate the different USLE (ABAG) factors are available from the Bavarian State Office of Agriculture (Bayerische Landesanstalt für Landwirtschaft; LfL) and are regularly updated by the state office administration. Sediment transport per raster cell, and hence deposition if transport capacity is smaller than sediment influx, is calculated using Eq. (1):
where Tc is the transport capacity (kg m−1 a−1); ktc (m) is the transport coefficient; R (N h−1 a−1), C (−), K (kg h m−2 N−1), and P (−) are the rainfall erosivity, soil cover, soil erodibility, and management factors of the USLE calculated for Bavaria following the approach of Fiener et al. (2020). LS2D is a grid-cell-specific topographic combined slope gradient and length factor calculated following Desmet and Govers (1996) using the digital elevation model (DEM) with a resolution of 5 m × 5 m.
2.2.2 Tillage erosion component
Tillage erosion is calculated based on a diffusion-type equation adopted from Govers et al. (1994), which generally assumes that tillage erosion is proportional to slope gradient (Van Oost et al., 2006):
where Qtil is the soil flux (in kg m−1 a−1), Δh is the elevation difference in metres, Δx is the horizontal distance in metres, and ktil is the tillage transport coefficient (in kg m−1 yr−1).
It is important to note that tillage erosion has no direct effect on sediment or MP delivery into the stream network, but over time it modifies the MP concentration in the plough layer of different raster cells, leading to a decrease in MP delivery because, at erosional sites, subsoil with little potential MP is mixed into the plough layer, while MP at depositional sites is buried below the plough layer.
2.2.3 MP redistribution and vertical mixing
It is generally assumed that MP enters the soil via its surface and is immediately mixed into the plough layer (upper 0.2 m). The MP input to arable land is estimated at field level (see input estimate below). For MP erosion, the concentration in the plough layer of each 5 m × 5 m raster cell was multiplied with the bulk soil erosion of this raster cell to calculate the MP outflux to neighbouring cells. The MP concentration of the transported sediment is analogously used to calculate potential MP deposition. After each year of modelling water and tillage erosion, the soil profile is updated assuming a tillage operation to a constant depth of 0.2 m. Consequently, MP-free subsoil is mixed into the plough layer at erosional sites, decreasing the topsoil MP concentration, while at depositional sites, the deposited MP is mixed with the underlying old plough layer, creating a new topsoil MP concentration and some MP in the layer no longer reached by the plough. Over the years this creates a steadily increasing variability in MP concentration within fields and transports MP into soils of other land uses (e.g. grassland and forest sites) assumed not to get other MP inputs.
2.3 Data
2.3.1 Soil erosion model inputs and parameters
For the study area, the LfL provided a digital elevation model (DEM, raster 5 m × 5 m), land use data (field based), and a soil map (1:25 000), as well as most USLE factors (Table 1). For the sake of simplicity and because long-term data on soil management were missing, only the rainfall erosivity (R factor of the USLE) was calculated yearly. Therefore, we followed the approach of Schwertmann et al. (1987) using a relation between annual rainfall erosivity and mean annual precipitation. Based on annual precipitation available at a 1 km × 1 km grid resolution from the German Weather Service (DWD, 2020), yearly R-factor maps were created as model input. It is therefore important to note that the variation in model sediment fluxes is solely a result of varying the annual rainfall erosivity, while changes in land management (affecting the C factor of the USLE) are not considered. However, the primary focus of the study was to showcase the potential magnitude and variation of MP delivery, also affected by varying MP input in space and time from 1950. We assumed a corn–grain crop rotation (with a mixture of small grain crops and a proportion of row crops of 25 %) typically found in the region and used the USLE calculator developed by Brandhuber et al. (2018), resulting in a C factor of 0.15, which is constantly used for all arable land in the catchment (Table 1). Routing sediments from arable land to the stream network requires sediment transport through other land uses, like forest, grassland, or paved surfaces. Therefore, these land uses need to be part of the erosion modelling and hence also require a C factor. For forest and grassland, a low C factor of 0.004 was applied, and for paved surfaces, a C factor of 0.001 was applied (Brandhuber et al., 2018). A K-factor map was provided by the LfL (derived from the soil properties given by the soil overview map of Bavaria at a scale of 1:25 000) based on the calculation in Schwertmann et al. (1987). The LS2D factor was derived from the 5 m × 5 m DEM, following the approach of Desmet and Govers (1996). Assuming some soil conservation methods to be in place, e.g. partial contour ploughing, the P factor was set to 0.85 (Fiener et al., 2020).
The values of the transport capacity coefficient ktc (m) for different land use types must generally be determined through calibration or must be taken from calibrated literature values (Dlugoß et al., 2012). Based on an extensive study by Van Oost et al. (2003), who tested the sensitivity of the transport capacity coefficient for different arable lands and different raster resolutions, an optimum value in the case of a 5 m × 5 m grid resolution of ktc=150 m was determined, which is used in this study. Van Rompaey et al. (2001) identified favourable ktc values ranging between 0 and 60 for non-erosive landscapes at a 20 m × 20 m grid, with an optimum at 42. Given our use of a finer 5 m × 5 m grid resolution, scaled down by a factor of 4, a ktc value of 10 was estimated for forest and grassland.
The tillage transport coefficient ktil depends on the tillage implement, tillage speed, tillage depths, bulk density, texture, and soil moisture at the time of tillage (Van Oost et al., 2006). For the tillage erosion modelled, a constant ktil value of 350 kg m−1 a−1 for all fields was assumed (Table 1), which is a conservative estimate of a mixture of mouldboard and chisel ploughing (Van Oost et al., 2006).
2.3.2 MP contamination of soils
Because sampling and sample analysis would be extremely time-consuming and costly, it is not possible to determine the actual MP concentrations in a 390 km2 catchment where estimates from MP inputs suggest large spatial heterogeneity. Hence, the potential soil–MP contamination needs to be estimated from the potential MP input from different sources. As soil erosion is dominant in arable land, an MP input estimate was solely performed for arable land. However, it is important to emphasize that, except for tyre wear, estimates are based on regional means for the whole of Bavaria and that, in general, estimates of the MP accumulated in the catchment soils since the 1950s need a number of assumptions and simplifications, resulting in large uncertainties regarding the MP concentrations in soils. To account for these uncertainties in the model outputs and to arrive at a robust indication of the potential contribution of soil erosion as a source of MP in the stream network, we estimated the potential yearly mean, minimum, and maximum soil–MP inputs for each input pathway (see below) and did separate (for each source) and combined (for the sum of all sources) modelling runs for the different contamination estimates. As mentioned earlier, mean MP inputs from sewage sludge, compost, and atmospheric deposition were estimated from means for all arable land in Bavaria, while the input of tyre wear was derived using catchment-specific road data and road-specific traffic data as far as possible. These represent the typical sources in the agricultural landscape of southern Germany, along with MP, applicable for SPEROS-MP. Other potential MP input pathways, for instance from plastic used in agricultural management (e.g. mulch films) or from littering, were not considered for two main reasons: (i) in Bavaria, mulch films are mostly associated with certain regions where specific crops or vegetables are grown, especially asparagus. For our test site, this is not the case, and using the average area of mulch cover in Bavaria to estimate the potential mean input in the catchment would have resulted in very small input amounts, not comparable with other regions in the world, where mulch films can be a very important source of MP (Li et al., 2022; Liu et al., 2014). (ii) Larger macroplastic fragments from mulch films and littering should only be transported with severe rill and ephemeral gully erosion, which are not the dominant erosion processes in the region.
2.3.3 Sewage sludge and compost
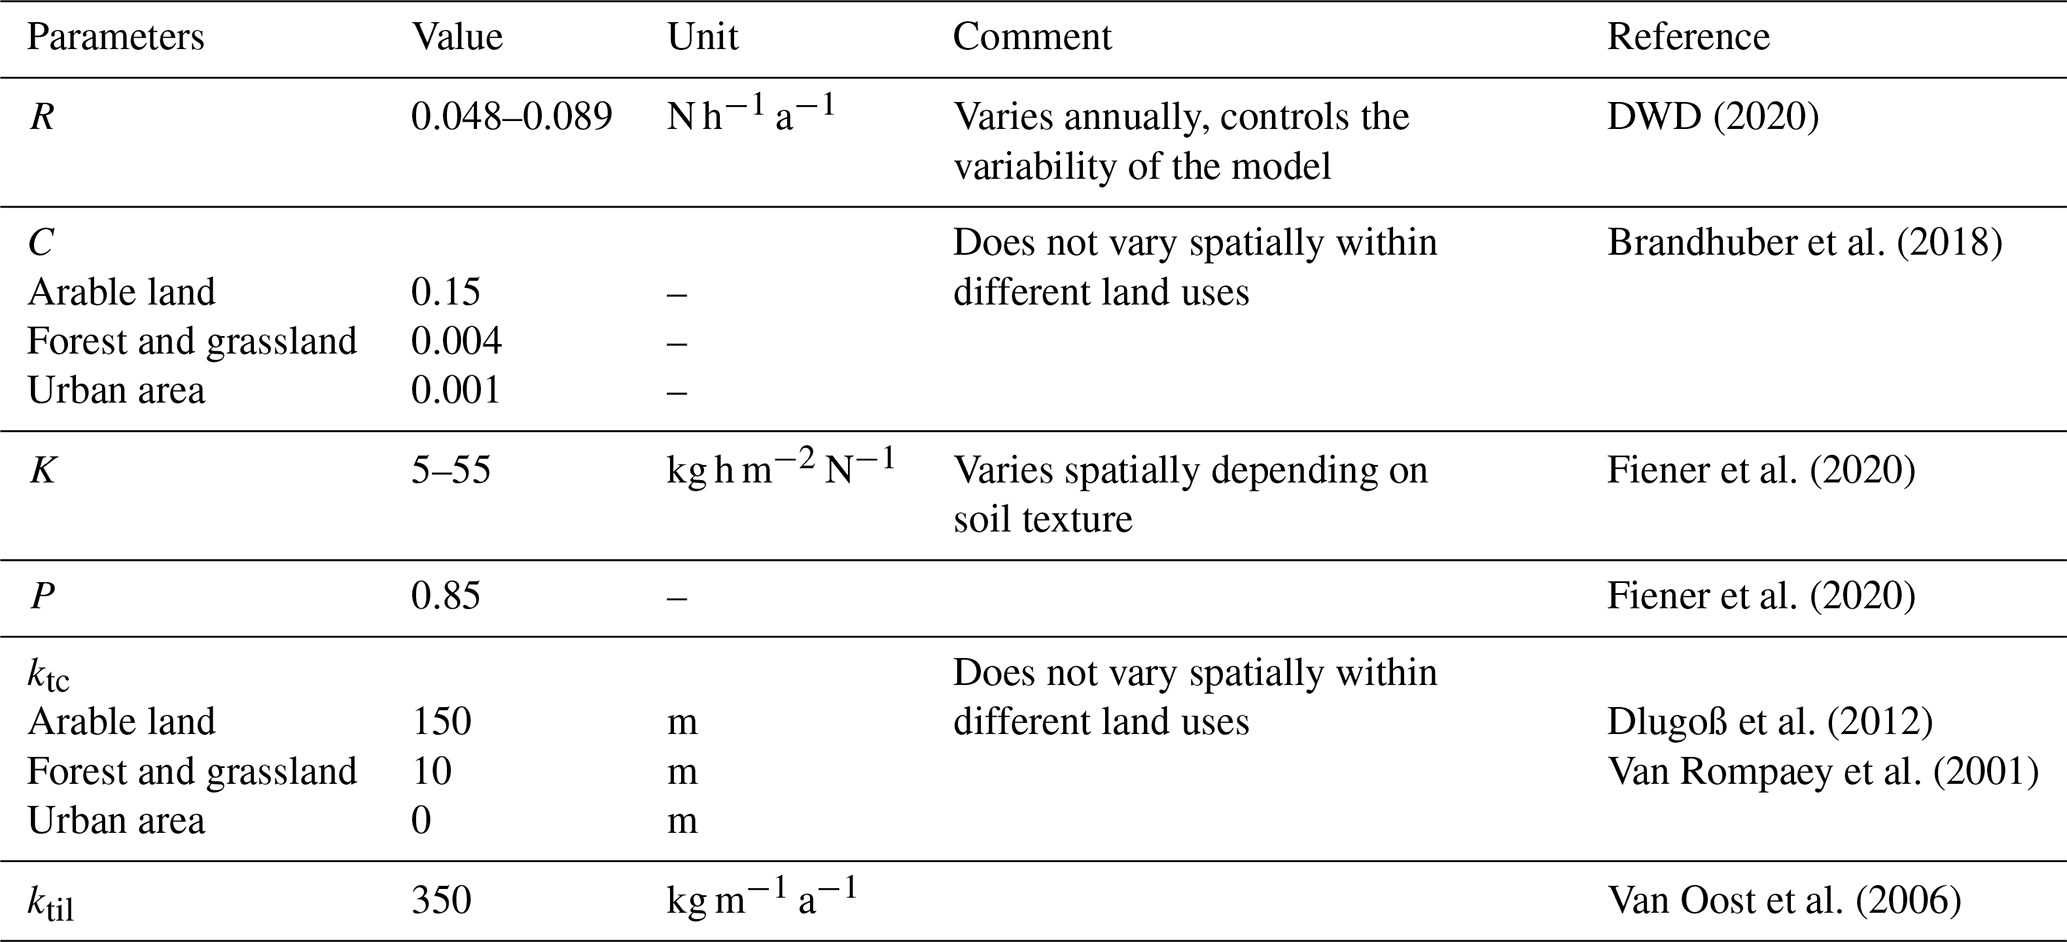
Sewage sludge and compost as soil amendments (organic fertilizers) contain different quantities of microplastics and, in the case of compost, small macroplastics. The first step was to estimate the amount of sewage sludge and compost applied to Bavarian agricultural soils since 1950. Bavarian waste reports (LfU, 2023) allowed us to determine the mean annual input on arable land for the time period 1990–2020. Historical application rates of compost were determined based on a linear relationship between application rates and population numbers between 1990 and 2020 (the variability was continued at random) (LfStaD, 2022) (Fig. 2b, c). In the case of sewage sludge, the number of residents connected to the sewage system was taken into account (Schleypen, 2017). The gaps between historical individual values were interpolated. The development of plant technology and the use of sewage sludge between 1945 and 1990 were considered, as described by Schleypen (2017). While compost was constantly used as an organic fertilizer, the use of sewage sludge was quite variable over time (Fig. 2c). From 1970 onwards, new wastewater treatment plant (WWTP) technology meant that the sewage sludge was no longer allowed to accumulate as dry but rather as wet sludge (Schleypen, 2017). This led to a sharp drop in the use of sewage sludge as a fertilizer, and it was not until the 1990s that it become popular again (Fig. 2c). Since 2017, the application of sewage sludge has been largely banned in Bavaria (Schleypen, 2017).
The second step was to estimate the MP concentrations in sewage sludge and compost. To do this, current literature values were used to estimate the MP concentrations for 2020. Minimum, mean, and maximum MP concentrations were always considered, based on the range of values from literature. For sewage sludge, data from Edo et al. (2020) were used; this is, to our knowledge, one of the few studies providing a mass balance of MP for a WWTP by specifying the total wastewater volume and the total amount of sewage sludge per day. The sum of the MP particles filtered out (contained in sewage sludge) and the delivered MP from the WWTP effluent results in the number of MPs detected in the WWTP input. Edo et al. (2020) consider size classes of 25–104, 104–375, and 375–5000 µm, and their data show that 95 % of the MP in the WWTP is retained in the sewage sludge, which is consistent with other publications giving ranges of 93 %–98 % (Habib et al., 2020; Tang and Hadibarata, 2021; Unice et al., 2019). For compost, data from Braun et al. (2021) were used, which contain all essential data on MP in compost from Germany. They examined MP in the size ranges <1000, 1000–5000, and >5000 µm. For the mass calculation of the MP in compost, macroplastics are also included.
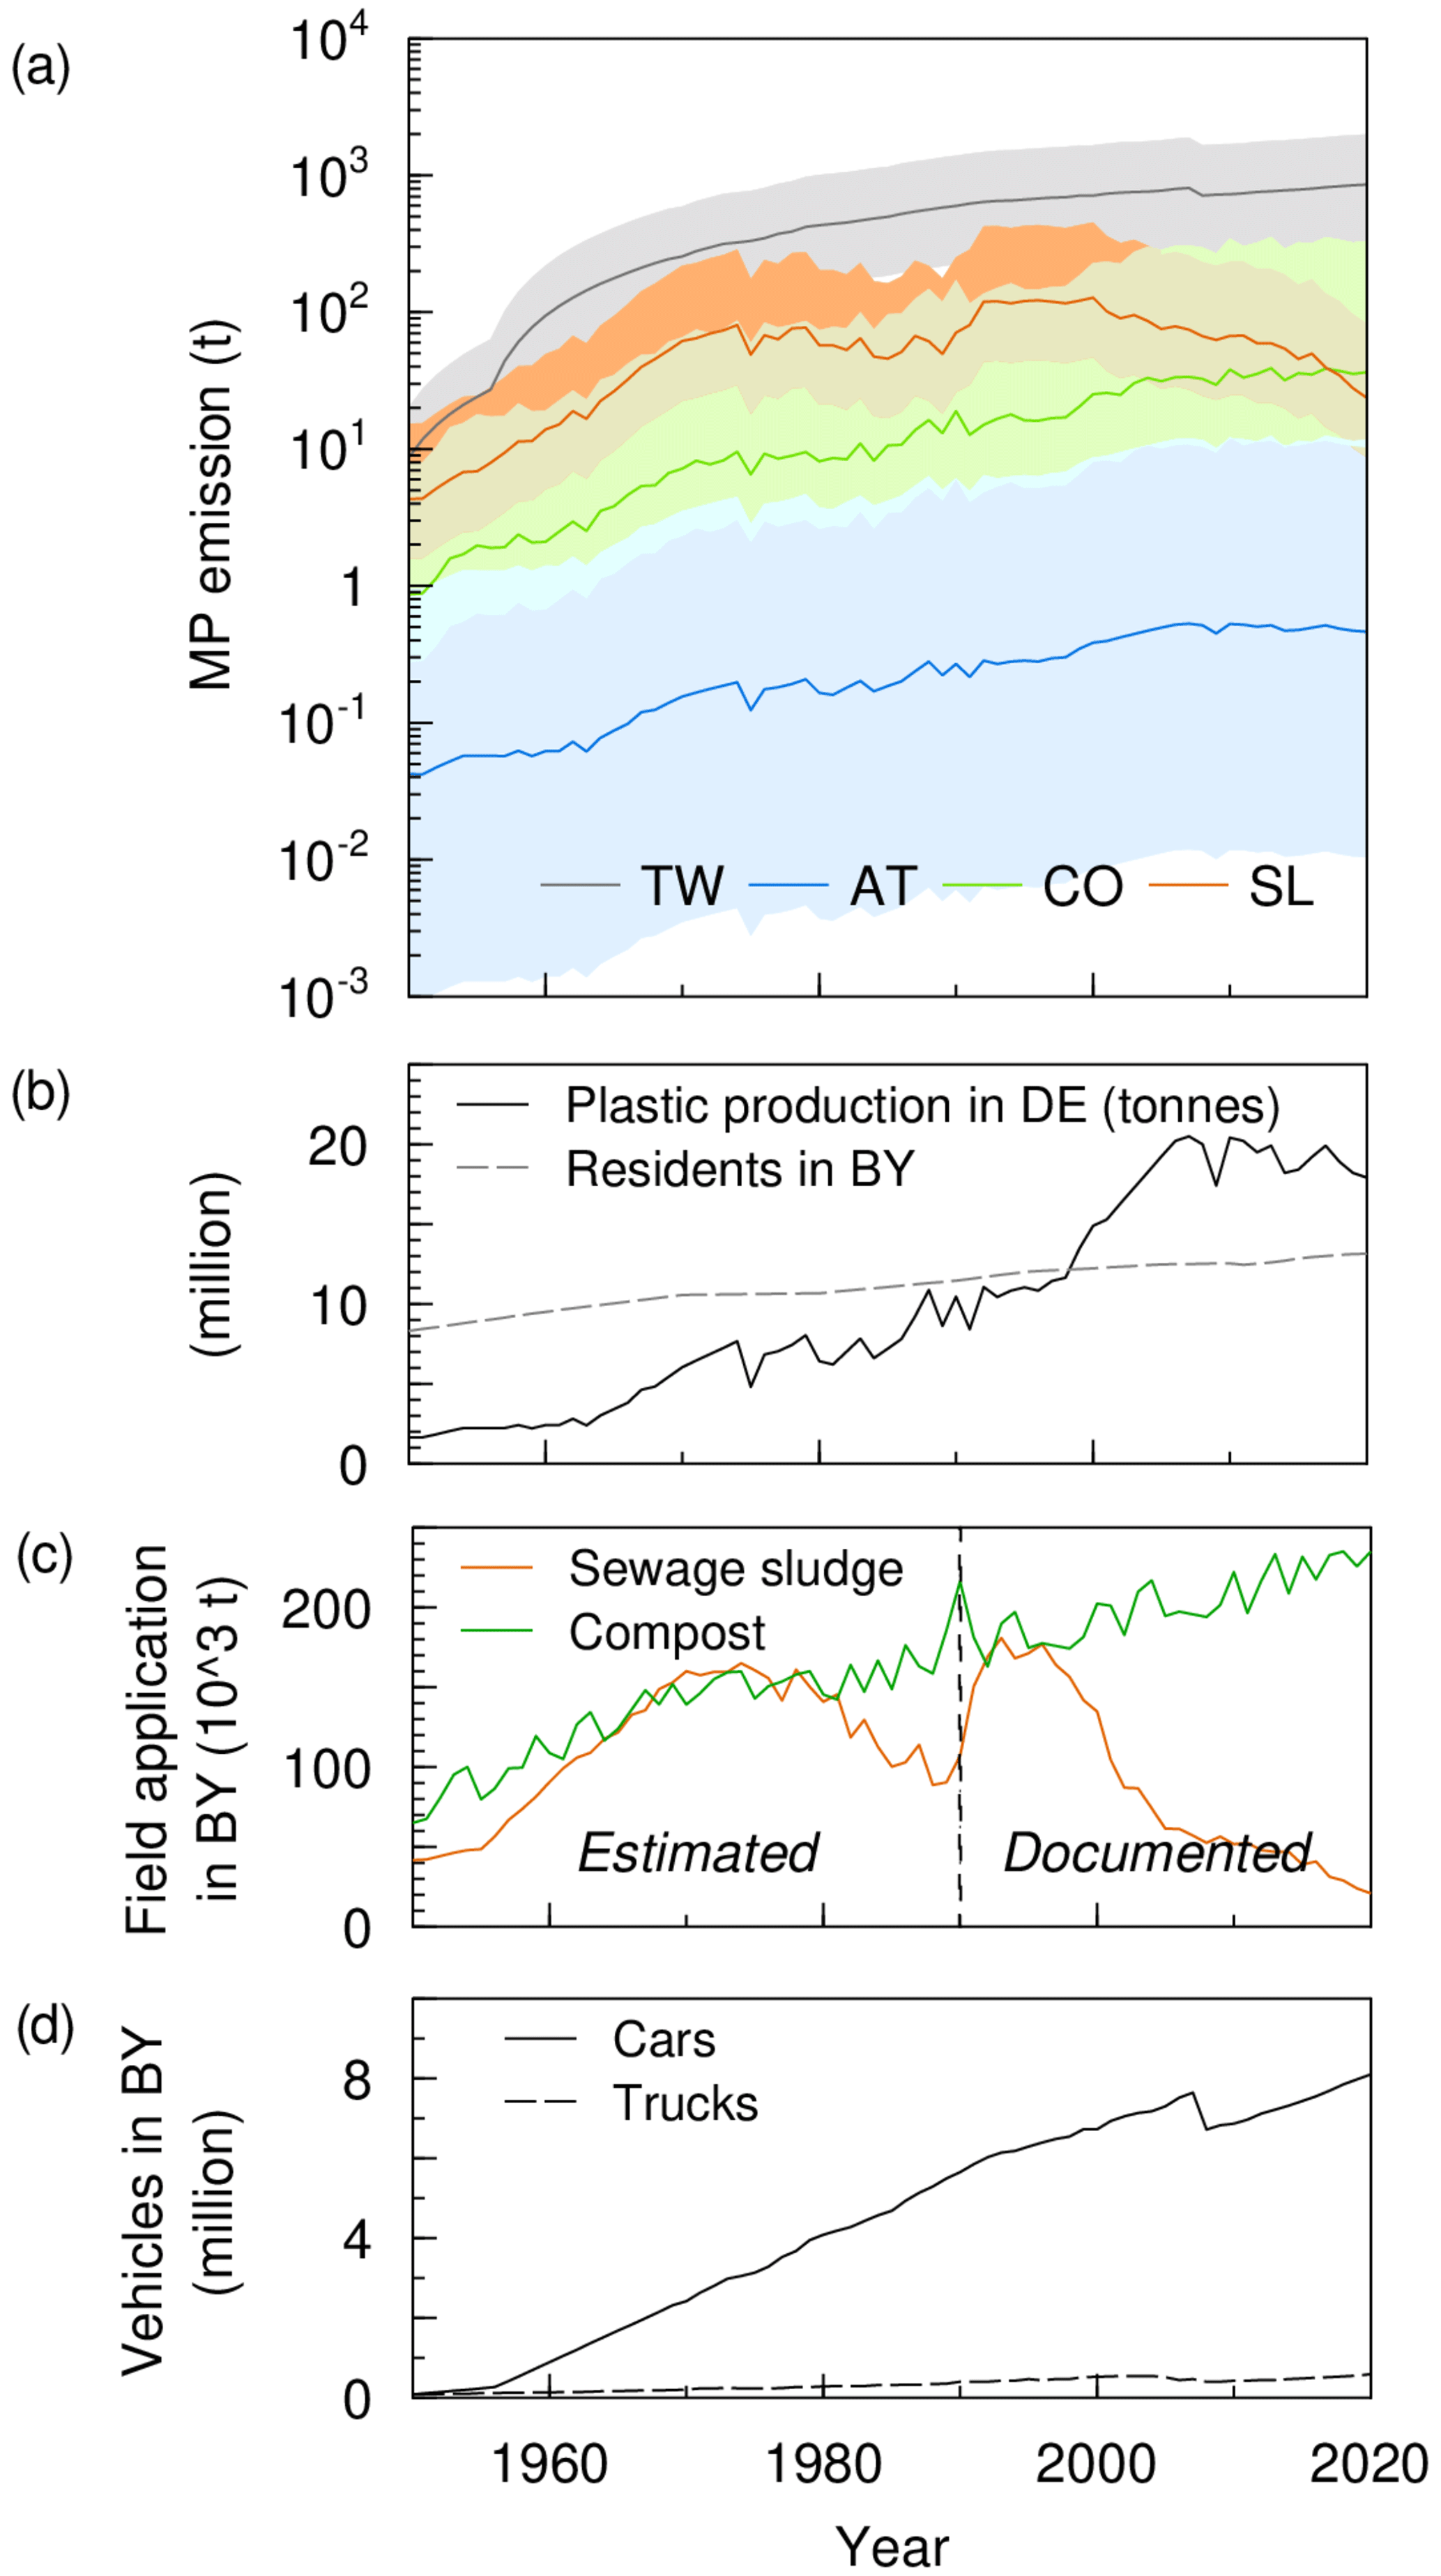
Figure 2(a) The MP emissions for arable land in Bavaria from the different sources, namely tyre wear (TW), sewage sludge (SL), compost (CO), and atmospheric deposition (AT), from 1950 to 2020. (b) The development of plastic production in Germany and the population of Bavaria since 1950. (c) Amount of application of sewage sludge and compost as fertilizer to Bavarian arable land. (d) The number of registered cars and trucks in Bavaria since 1950.
Both publications, Edo et al. (2020) and Braun et al. (2021), provide information on the size distribution of the detected MP particles. This enabled the most accurate conversion possible between mass and particle number. When converting, the particle size, size distribution, and shape were taken into account. While a spherical shape was assumed for sewage sludge, for compost the most realistic possible volume for each detected particle was calculated (individual dimensions have been provided by the authors of Braun et al. (2021)). Based on the type of plastic detected, an average density of 1 was assumed for all particles. Average MP loads of 1.14 g MP kg−1 dry matter of sewage sludge (min: 0.42 g, max: 4.04 g) and 0.15 g MP kg−1 dry matter of compost (min: 0.05 g, max: 1.36 g) were assumed.
Based on the known amounts of sewage sludge and compost applied, it was possible to calculate the corresponding amount of MP that ends up on Bavarian agricultural soils (kg m−2). When calculating the MP concentration back to 1950, the amount of plastic produced in Germany was considered for each year as the MP concentration depends on the level of production (Fig. 2a, b). The annual amount of MP was then evenly distributed across all agricultural fields in Bavaria since spatial allocation within the study area was not possible. Due to the lack of parcel-specific information before 2015 for sewage sludge, we estimated MP inputs using average values per field, similarly to compost. However, the primary aim in this modelling exercise was not to precisely replicate MP delivery in the Glonn catchment. Instead, the aim was to demonstrate the model's use in a system analysis, acknowledging limitations in historical data availability.
Between 1950 and 2020, 7.26×10⁶ t of sewage sludge and 11.7×10⁶ t of compost were added as organic fertilizer to agricultural fields in Bavaria. Hence it can be estimated that 4090 t (min: 1510 t, max: 14 500 t) and 1110 t (min: 358 t, max: 10 100 t) of MP from sewage sludge and compost respectively were dumped on arable land in Bavaria. From that, average inputs to the arable land in the Glonn River catchment of 42 100 kg MP from sewage sludge (min: 15 500 kg, max: 149 000 kg) and 11 500 kg MP from compost (min: 3660 kg, max: 104 000 kg) were calculated. For the arable land in the Glonn River catchment, this means an average annual MP application of 240 kg MP from sewage sludge (min: 90 kg, max: 860 kg) and 370 kg from compost (min: 120 kg, max: 3390 kg) in 2020 (Table 2). This results in a current entry rate of 1.14 mg MP m−2 a−1 (min: 0.42 mg, 4.04 mg) from sewage sludge and 1.75 mg MP m−2 a−1 (min: 0.56 mg, max: 15.8 mg) from compost.
2.3.4 Atmospheric deposition
For the atmospheric deposition of MP, the data from four bulk deposition measurements (precipitation and dust deposition) in Bavaria (Witzig et al., 2021) were combined with the development of plastic production in Germany since the 1950s. Historically, the calculation of MP load relied on the assumption that increased plastic production corresponds to higher emissions (Fig. 2a), although this approach is notably simplified. This results in a mean cumulative atmospheric MP input on arable land in Bavaria of 18 t of MP (min: 0.41 t, max: 407 t). Between 1950 and 2020, the arable land in the Glonn River catchment was loaded with a total of 186 kg of MP (min: 4.20 kg, max: 4200 kg). For 2020, an average annual MP emission of 4.76 kg (min: 0.11 kg, max: 107 kg) or 0.02 mg MP m−2 a−1 (min: 0.0005 mg, max: 0.5 mg) via atmospheric deposition was calculated (Table 2).
2.3.5 Tyre wear
To determine the tyre wear particle input in the Glonn catchment, we used existing traffic-counting data from 2005, 2010, and 2015 for the main roads (motorways, federal roads, state roads, and district roads) available from the Bavarian Road Information System (BAYSIS, 2015). Traffic volume for smaller roads (except farm roads) in rural areas was derived from a 1 km × 1 km population density grid following Gehrke et al. (2021). Based on these data, the traffic volume (number of vehicles per kilometre) for each paved road in the Glonn catchment could be estimated for the years 2005, 2010, and 2015. This was done separately for passenger cars (cars), heavy-duty vehicles (trucks), and motorcycles. For all other years, the traffic volume (number of vehicles per kilometre) per road was linearly extrapolated based on the traffic volume in Bavaria and the number of registered cars and trucks in Bavaria (LfStaD, 2022) (Fig. 2d). No emissions from unpaved roads and agricultural machinery were considered.
Minimum, medium, and maximum scenarios were considered based on the quantity of released tyre particles specified in the literature. A mean tyre wear emission factor of 90 mg TW km−1 (min: 53 mg, max: 200 mg) was assumed for cars (a motorcycle represents half a car), and a factor of 700 mg TW km−1 (min: 105 mg, max: mg) was assumed for trucks based on the reviews of Hillenbrand et al. (2005) and Wagner et al. (2018). Based on the length (km) and traffic volume (number of cars, motorbikes, and trucks), the released TW was calculated for each section of road.
The transport of TW from roads into the surrounding soil systems was estimated based on literature information, assuming that the TW concentration exponentially declines with increasing distance from the road (Fig. 3). However, we could only identify one study (Müller et al., 2022) that directly measured TW contamination of soils with distance from the road, while most other studies (Motto et al., 1970; Werkenthin et al., 2014; Wheeler and Rolfe, 1979; Wik and Dave, 2009) used chemical markers and the distance from the road to estimate TW distribution. From all these different approaches, we calculated a median behaviour (Fig. 3). As the modelling is performed in a 5 m × 5 m grid, the land use map may not show all grass or vegetation strips often found along roads, which might lead to an overestimation of TW input to arable land. Hence, we decided to use a conservative estimate, assuming that at least a 3 m wide grass strip can be found on both sides of any road. Consequently, about 85 % of the TW produced on any road (Fig. 3) cannot reach arable fields. The remaining 15 % of TW that could potentially reach arable land mostly settles within a 50 m distance from the road, whereas background MP concentrations are reached at a distance of about 130 m (Fig. 3).
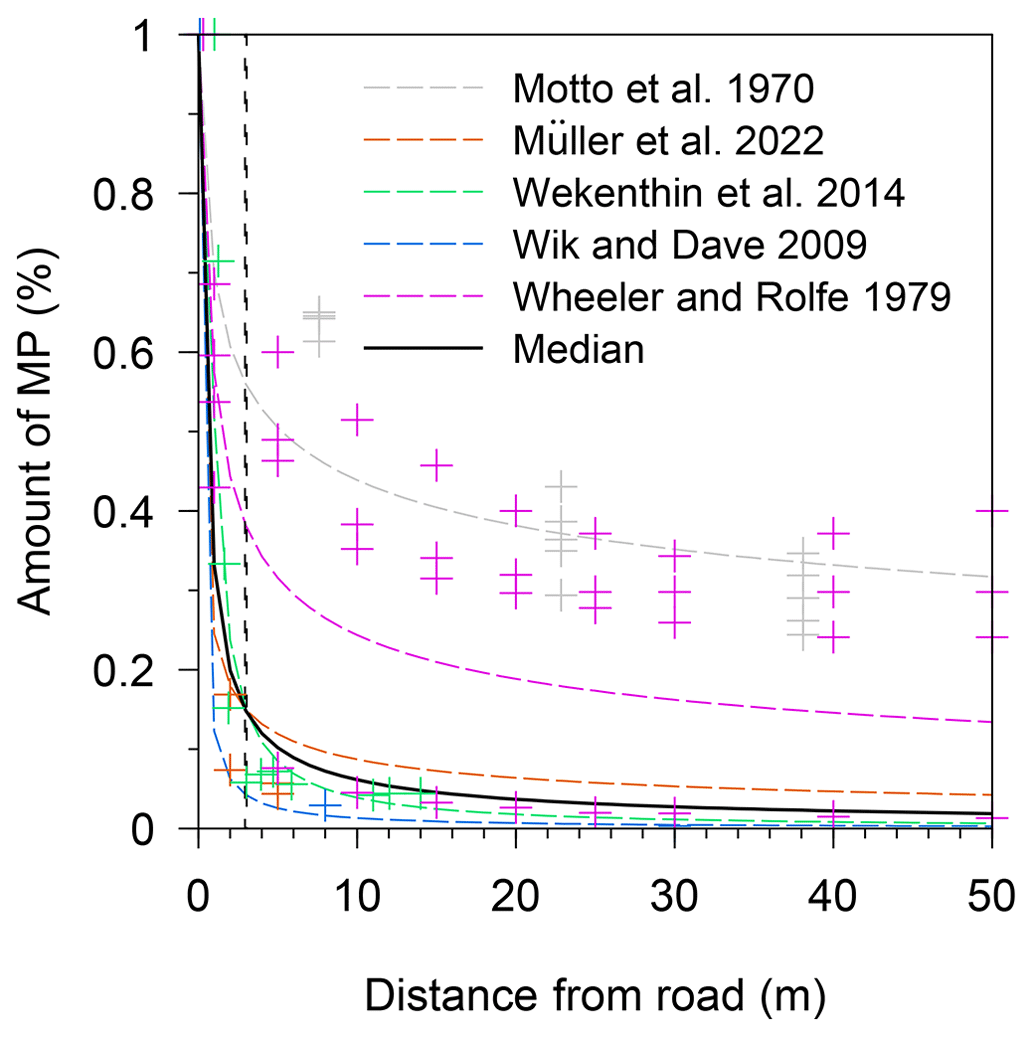
Figure 3The distribution of tyre wear in the soil relative to the distance from the road. Literature values are based on direct detection of tyre wear (Müller et al., 2022) or on the estimated concentrations of tyre wear particles based on chemical markers (Motto et al., 1970; Wheeler and Dave, 2009; Wik and Dave, 2009; Werkenthin et al., 2014). The markers show the individual values, and the dashed lines show the mean of the respective reference. The black line represents the median of all literature values used for modelling in this study.
In comparison to the other MP sources considered (sewage sludge, compost, and atmospheric deposition), the estimate for TW was calculated on a field-by-field basis. To identify all agricultural fields affected by road-borne TW deposits within a distance of 130 m, a land use map was overlaid on the road network. For each field, the area share of the associated road section and the distance to the road were considered when calculating the TW load. The only limitation is that, for fields affected by TW, in the model, the amount of TW was then distributed evenly over the entire field and not just on the affected field section near the road (within 130 m).
Between 1950 and 2020, 120 × 103 kg tyre wear (min: 44 × 103 kg, max: 289 × 103 kg) ended up on arable land in the Glonn catchment (Table 2). In 2020, the average annual MP application amounted to 3.1 × 10³ kg of tyre wear (min: 1.1 × 10³ kg, max: 7.5 × 10³ kg) (Table 2). The load from TW in 2020 can reach maximum concentrations of 2.5 × 10³ mg TW m−2 a−1. on roads with heavy traffic use; the average over all affected fields in the Glonn catchment area is 19.7 mg TW m−2 a−1 (Table 2).
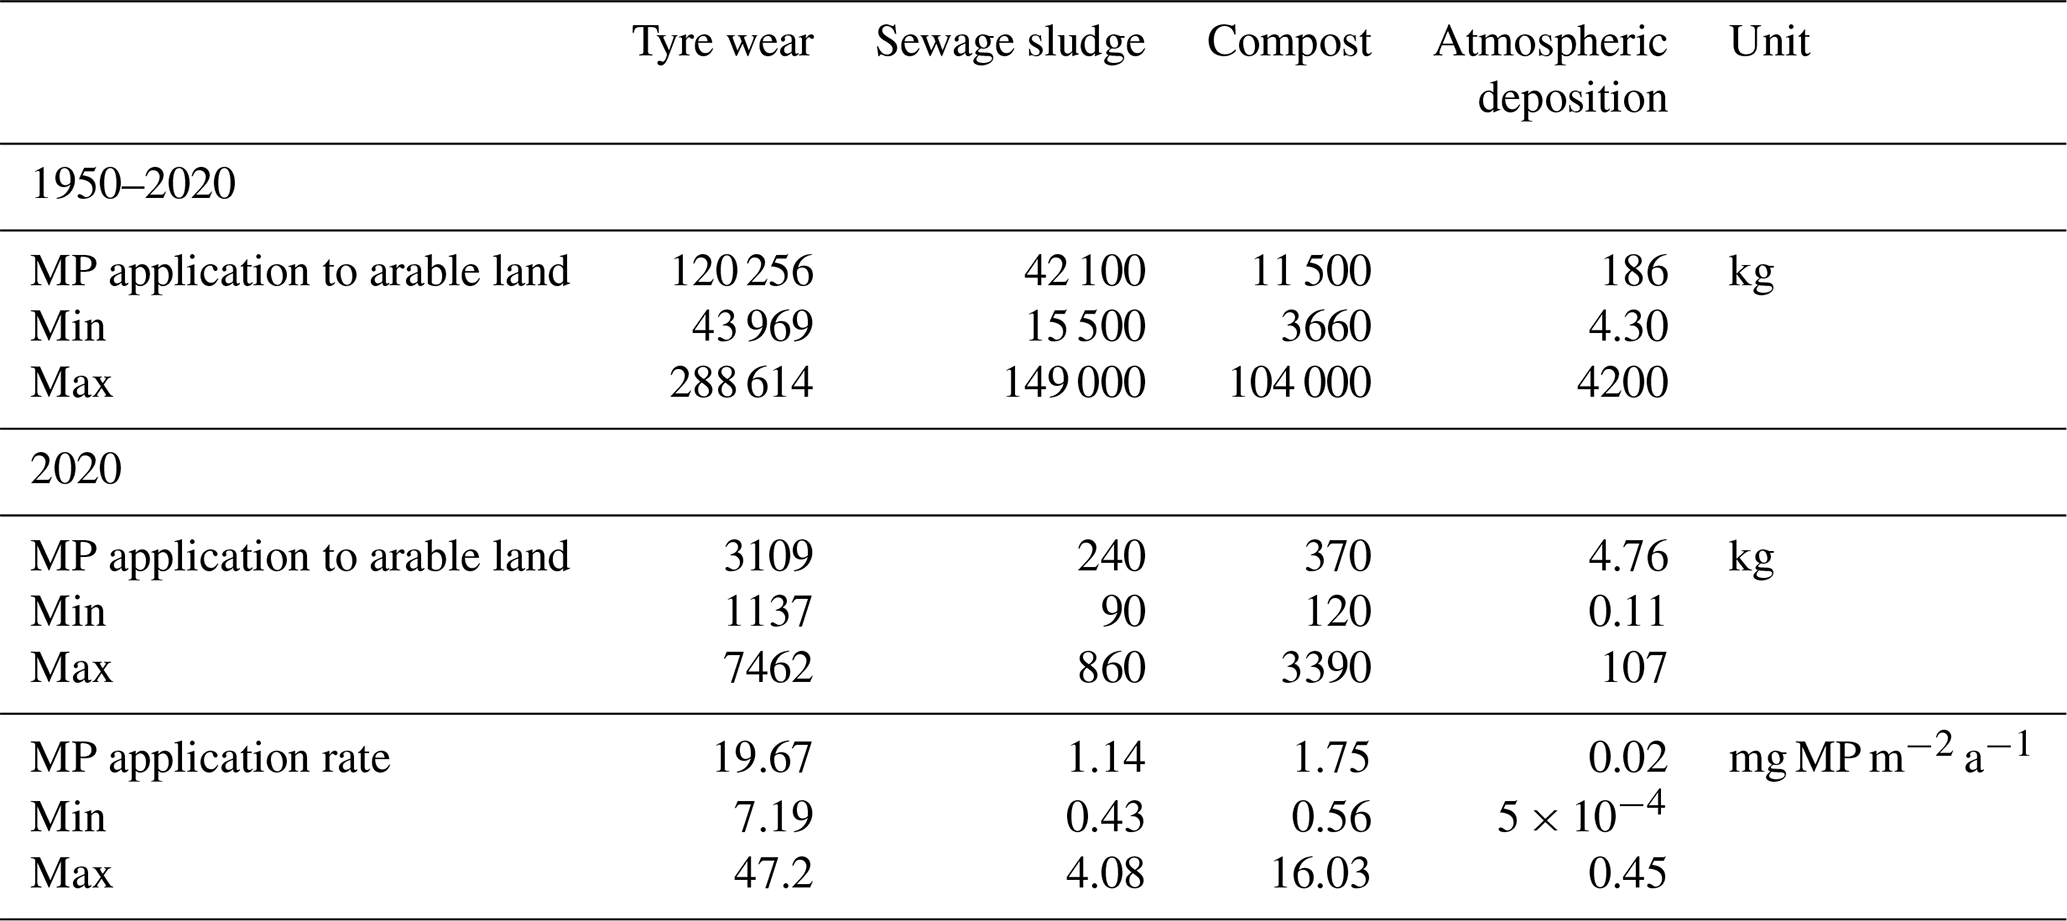
Table 2MP inputs into arable soils within the test catchment, separated by different sources. All values are listed for the modelled time span 1950–2020 and separately for the year 2020.
2.4 Model validation
It is obviously impossible to validate the modelled MP delivery to the stream network against measured MP loads as this would call for a continuous monitoring of MP delivery for several years at least. However, the modelled sediment delivery can be validated against measured data from the Bavarian State Office for Environment (Bayerisches Landesamt für Umwelt, LfU), which operated a discharge and sediment monitoring gauge in Hohenkammer (Fig. 1) between 1968 and 2020. At this gauge with a defined river cross-section, daily discharge was derived from continuous runoff depth measurements in combination with a stage discharge rating curve, while the stationarity of this rating curve at the measuring cross-section was randomly checked once or twice every year. At the gauging station a weekly water sample was collected (1968–2020), and its sediment concentration was determined in the laboratory. From 2011 onwards a turbidity probe (Solitax ts-line, Hach Lange GmbH, Germany) was installed and regularly calibrated against the samples taken by hand. Based on the continuous discharge and the weekly to continuous sediment concentration measurements, the LfU provided daily sediment load data for the time span 1968 to 2020, which were aggregated to yearly values for this study.
2.5 Modelled scenarios
Apart from modelling and analysing the MP delivery to the stream network via the erosion pathway for the period from 1950 to 2020, we also modelled three scenarios (S1 to S3) to discuss potential future pathways up to 2100.
2.5.1 Scenario S1 – business-as-usual scenario
In this scenario, it is assumed that the MP input to arable land continues until 2100 with the same input rates estimated for 2020. Given the ongoing increase in plastic production (Chia et al., 2021; Lwanga et al., 2022) and rising traffic numbers (StMB, 2023), this may even be a conservative estimate of a business-as-usual scenario pathway.
2.5.2 Scenario S2 – spatially targeted application of soil amendments
This scenario addresses two aspects: (i) a potential reduction in MP delivery to the stream network due to a targeted application of soil amendments, keeping a distance of at least 100 m from the stream network in the case of compost and sewage sludge application, and (ii) more generally illustrating the sensitivity of MP delivery to the stream network in the case of non-homogenous MP inputs in the catchment. For the latter, soil amendments were solely applied in the vicinity of the stream network (max distance of 100 m).
2.5.3 Scenario S3 – stop MP input
This scenario is set up to determine the extent to which soils function as a long-term source for MP with regard to soil erosion, assuming the MP applied before 2020 remains stable in the soil until 2100. Therefore, a potential decline in MP concentration in the plough layer either results from a lateral loss to neighbouring land uses (grassland or forest) or the stream network or is buried below the plough layer due to deposition processes (here deposition due to water and tillage erosion).
3.1 Sediment delivery
Without any calibration, the model satisfactorily reproduced the measured long-term mean sediment delivery of the Glonn outlet (Fig. 4). The modelled sediment deliveries resulted in a mean of 145 ± 18 kg ha−1, and the measured mean contained 149 ± 63 kg ha−1 kg ha−1 (Fig. 4). The model was obviously not able to capture the full variability in the measured yearly sediment delivery (R2=0.51; Fig. 4). It underestimates years with high erosion rates, while it overestimates years with low erosion rates. However, we conclude that the model performance (especially in reproducing the long-term mean) gives a solid basis for modelling lateral MP fluxes due to erosion processes. Here, it is important to note that our modelling approach aims to estimate the magnitude of the MP erosion transport pathway, which was not analysed in earlier studies, and that the estimated MP inputs contribute significantly to model uncertainty.
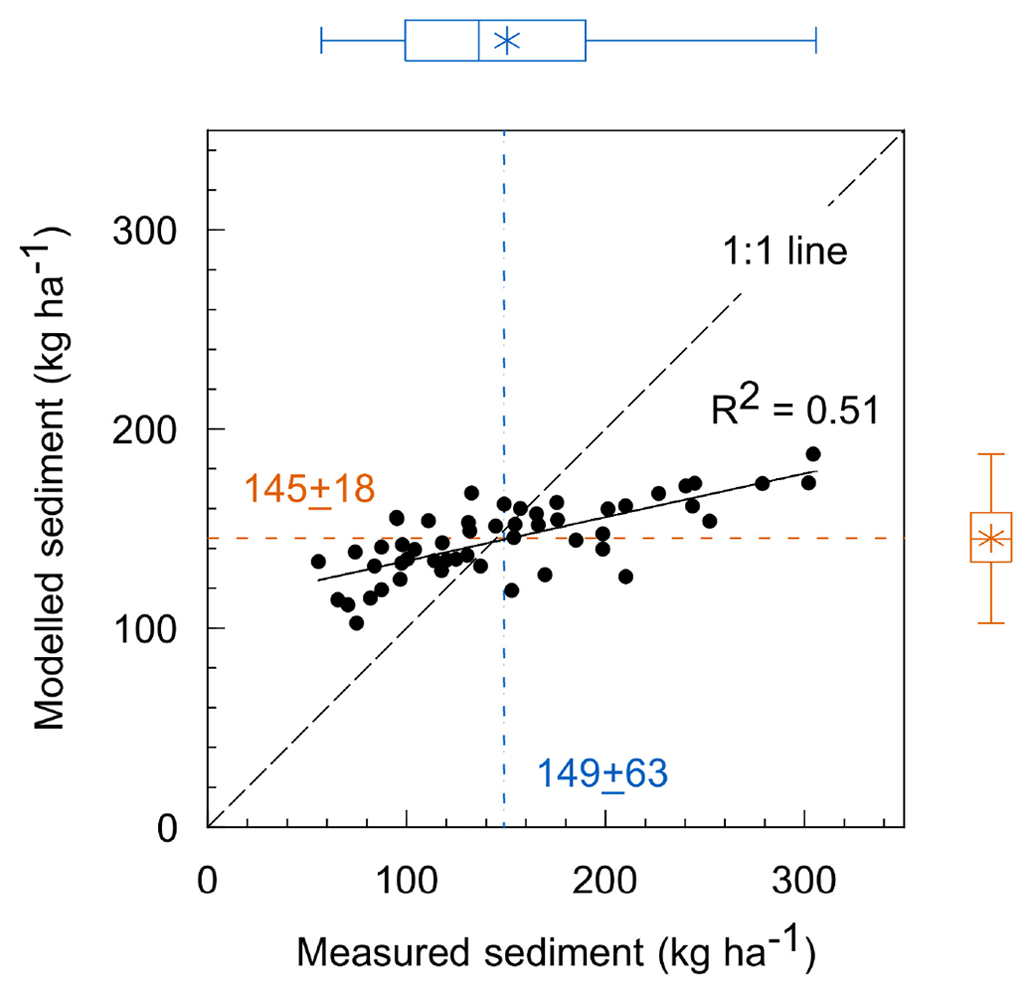
Figure 4Measured and modelled sediment delivery (1968 to 2020) at the outlet of the Glonn catchment. The blue and orange lines represent the measured and modelled means respectively. The boxplots show the variability of the data. They show the median (line) and mean (star) and the first and third quartiles; whiskers give the minimum and maximum.
3.2 MP erosion and delivery to stream network
The constantly rising MP input to arable soils from different sources (Fig. 2) since 1950 is reflected in the steadily increasing, erosion-induced MP delivery into the stream network (Fig. 5a). Due to the long-term fertilization of arable land with sewage sludge, on average, 0.51 kg MP a−1 entered the Glonn stream network in 2020 (Table 3). For compost, it is 0.77 kg MP a−1, with 0.01 kg MP a−1 from atmospheric deposition (Table 3, Fig. 5a). With compost, sewage sludge, and atmospheric deposition as potential MP inputs to arable land, SPEROS-MP generated a total MP input into the stream network of 1.29 kg MP via the soil erosion pathway in 2020. Deliveries to the stream network have also steadily increased in terms of TW (Fig. 5a), with an average of 5.04 kg MP a−1 delivered to the stream network in 2020 (Table 3).
Table 3Soil erosion-induced MP delivery to the Glonn stream network, as well as redistribution to grassland and forest. The MP vertical loss below the plough layer is also given. All values are listed for the modelled time span 1950–2020 and separately for the year 2020.
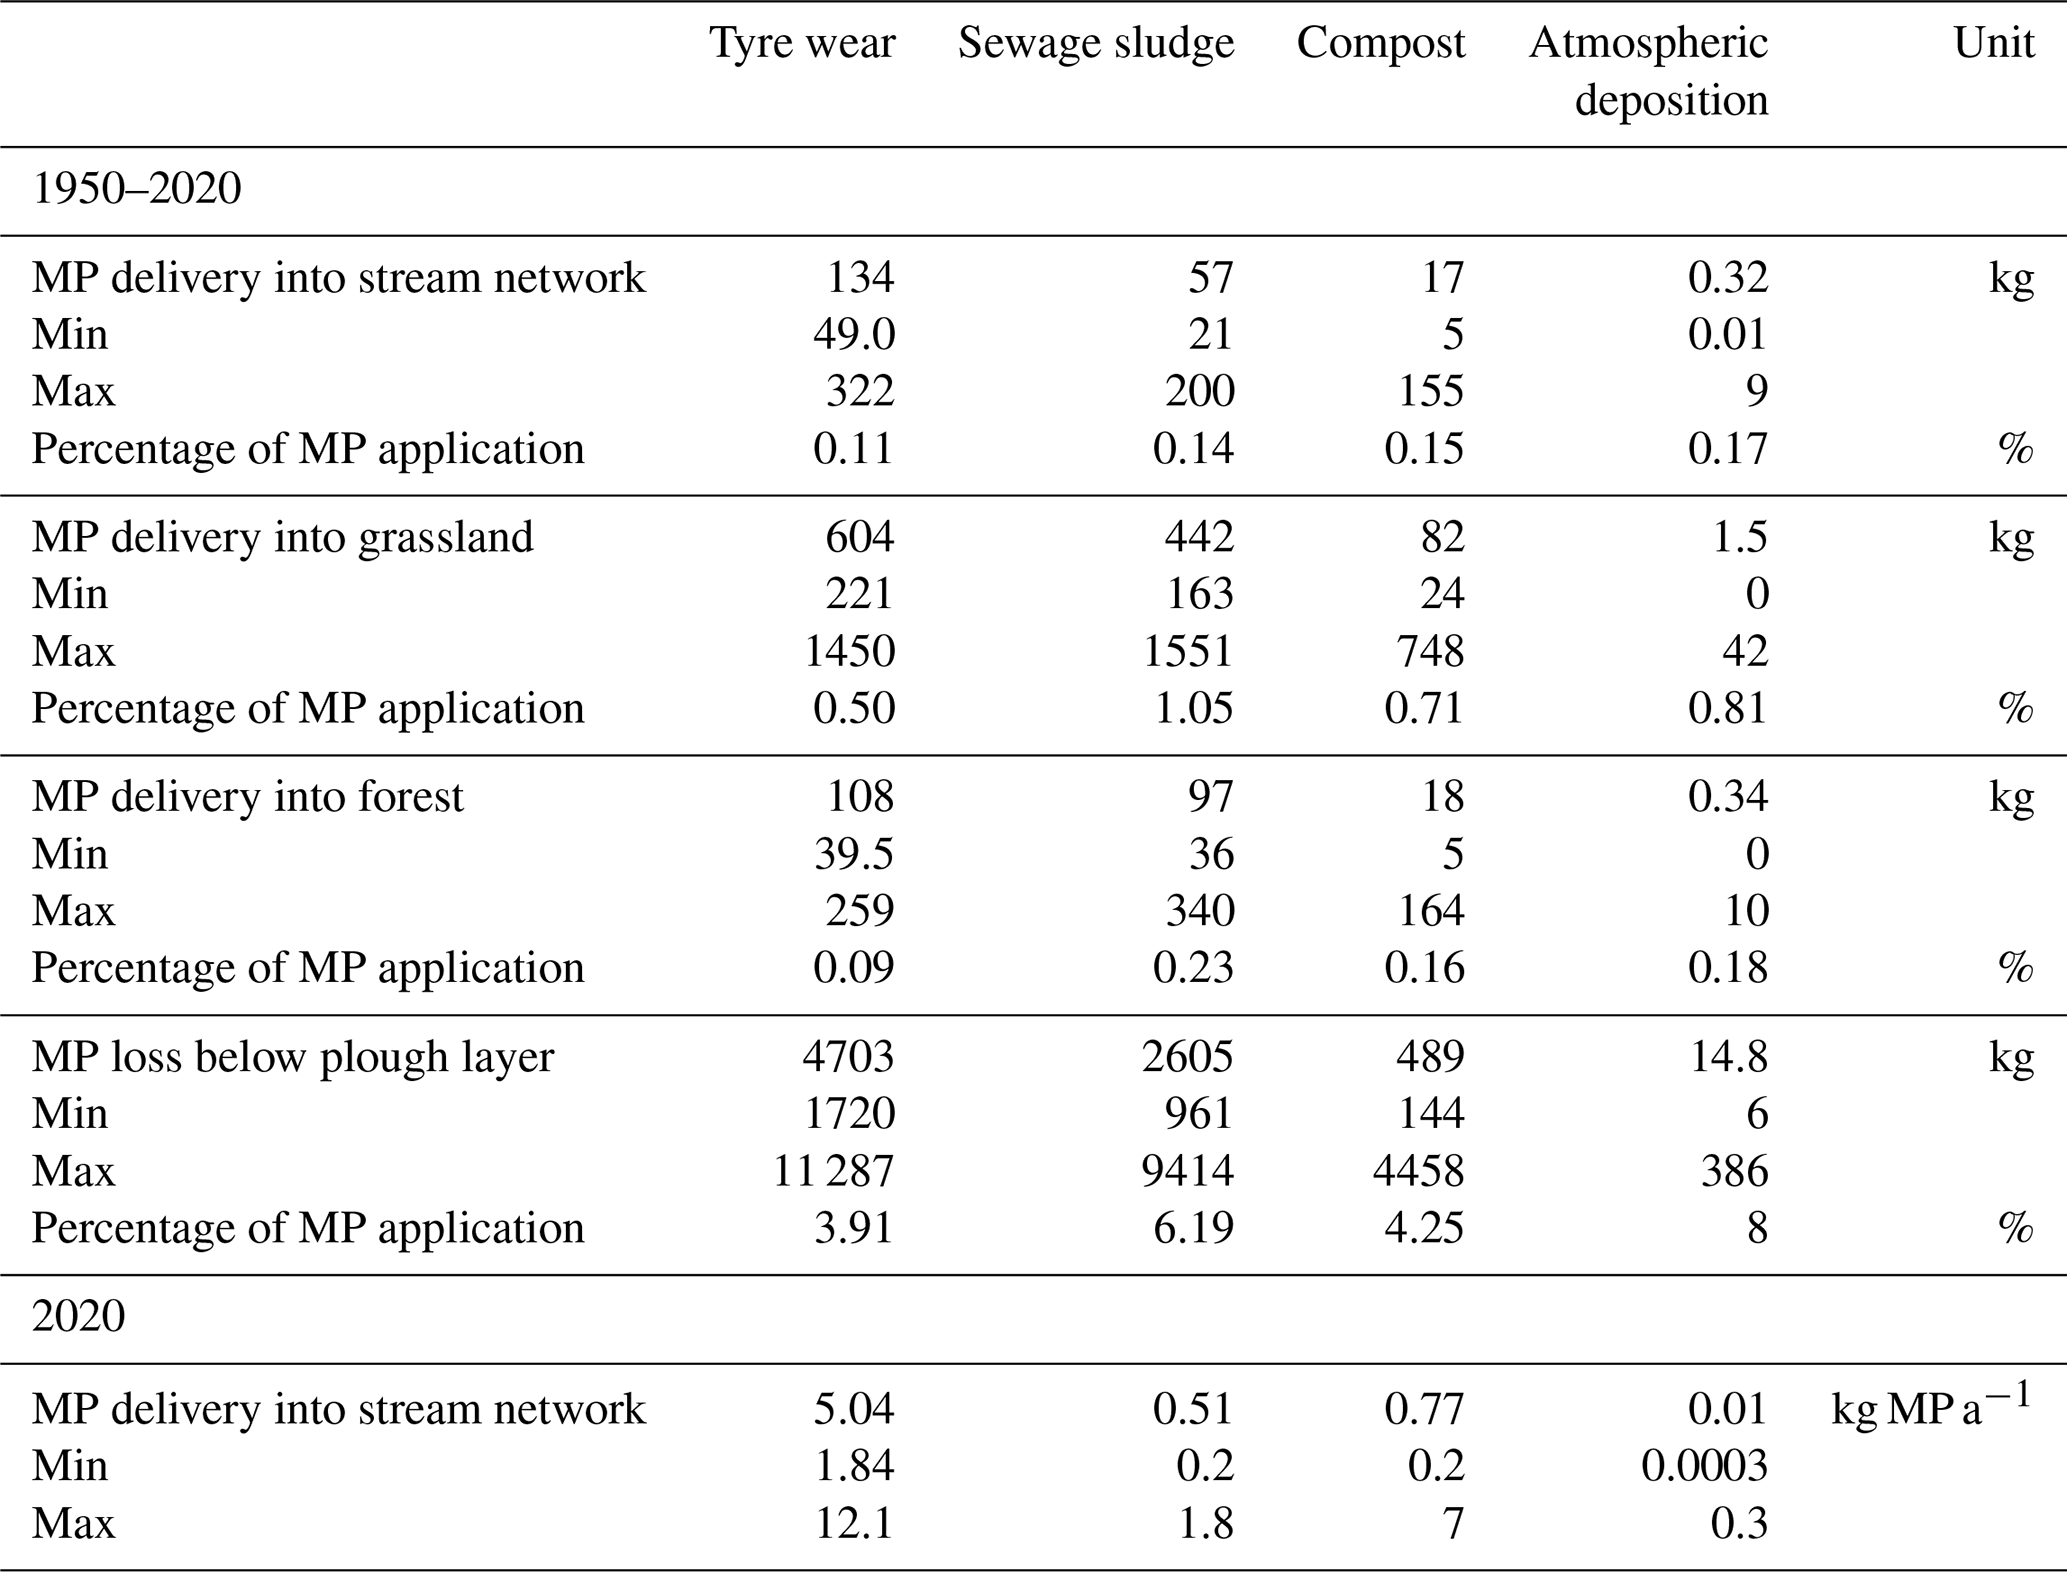
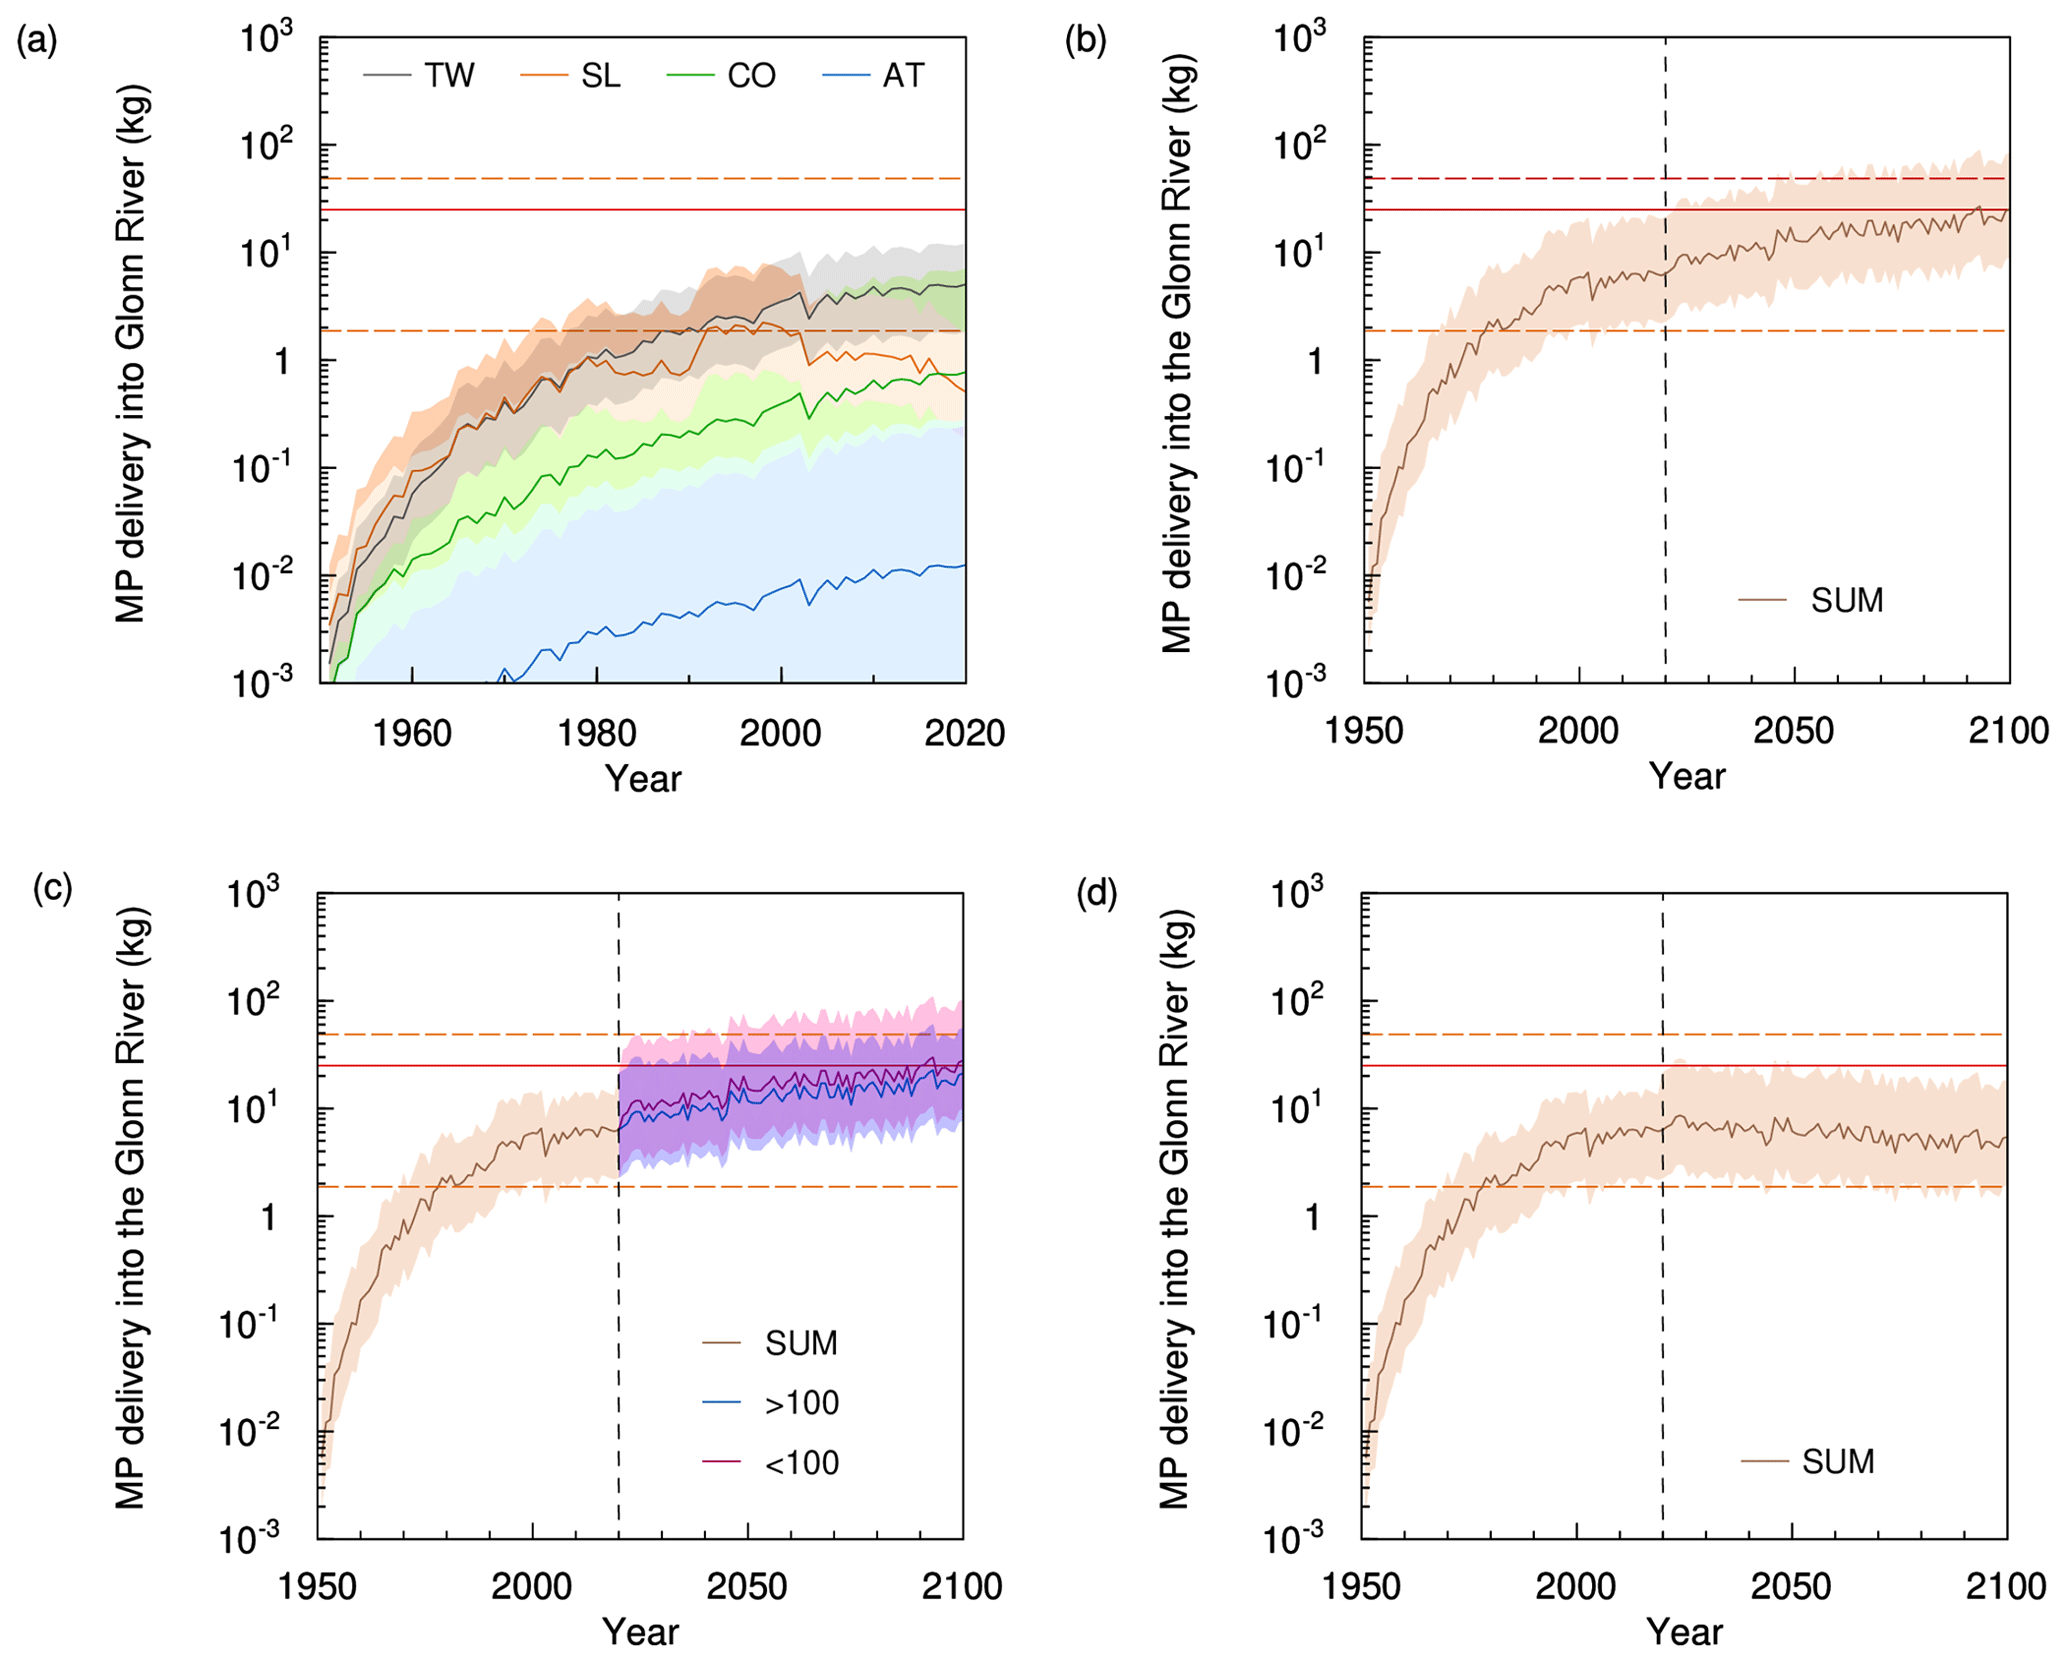
Figure 5MP delivery into the Glonn shown individually for tyre wear (TW), sewage sludge (SL), compost (CO), and atmospheric deposition (AT) or the sum of TW, SL, CO, and AT (SUM). The dashed vertical line gives the year 2020 as the starting point for different scenarios. For comparison, the amount of MP delivery through wastewater treatment plants (WWTPs) in 2020 is shown as a red line (min and max as dashed orange lines). (a) MP delivery into the Glonn river between 1950 and 2020. (b) Result of scenario S1 with the assumption that the MP input will continue as in 2020. (c) Result of scenario S2. Compost and sewage sludge are applied to arable land at a distance of >100 m and <100 m from water streams. (d) Result of scenario S3 with no MP input at all from 2020 onwards.
Between 1950 and 2020, 208.3 kg of MP (134 kg TW, 57 kg sewage sludge, 17 kg compost, and 0.32 kg atmospheric deposition) entered the Glonn stream network (Table 3), while, overall, a sediment load of 3.0 × 10⁸ kg was delivered to the catchment outlet. TW was the main MP source, accounting for 64.3 %, followed by sewage sludge with 27.4 %, compost with 8.2 %, and atmospheric deposition with 0.1 %. Taking into account the MP delivery relative to the MP input (i.e. total amount of MP input into soil in 1950–2020 vs. total MP delivery into the stream network from 1950 to 2020), only 0.14 % of the MP released to arable land was transported into the Glonn stream network. This differs slightly for the different MP sources, ranging from 0.17 % for atmospheric deposition to 0.11 % for tyre wear (Table 3).
The spatially distributed model also allowed us to quantify the relocation of MP between different land uses (an example is shown in Fig. 6f). The amount of MP delivered between 1950 and 2020 from arable land to grassland and forest is 1.1 × 10³ and 0.2 × 10³ kg respectively (Table 3). The larger delivery to grasslands is particularly interesting as these are mostly located along the stream network (see Discussion section).
SPEROS-MP does not only give information about the MP relocation between arable land and other land uses. The model also determines the amount of MP buried beneath the plough layer (and thus out of reach of water erosion) at depositional sites (an example is shown in Fig. 6e). Between 1950 and 2020, 3.9 % of the TW supplied to arable land was buried below the plough layer (Table 3). This corresponds to 4.7 × 10³ kg MP or 35 times the amount reaching the stream network via water erosion. For sewage sludge, it is 6.19 % (2.6 × 10³ kg), for compost it is 4.25 % (489 kg), and for atmospheric deposition it is 8 % (14.8 kg). Consequently, much more MP was buried in the subsoil than what was transported into the Glonn. This burial into the subsoil was caused by sedimentation via water erosion (48.5 %) and tillage erosion (51.5 %). Conversely, up to 95 % of the MP applied to arable soil over the past 70 years remains in the plough layer (leaching and bioturbation excluded).
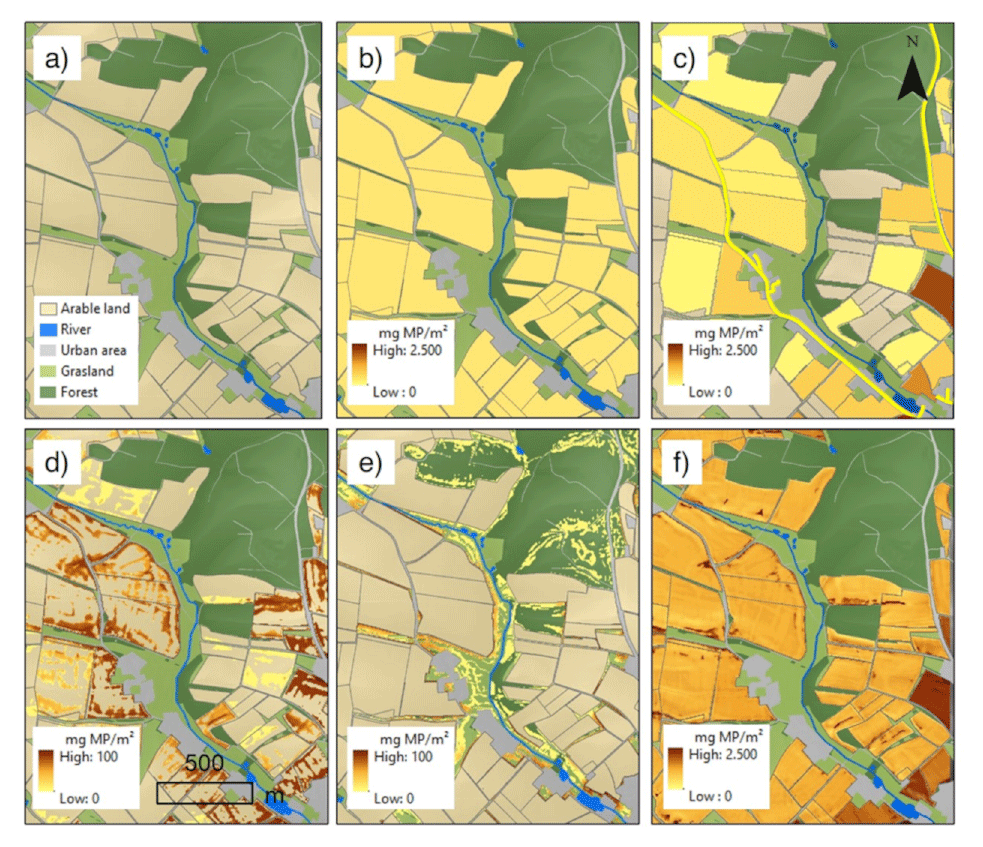
Figure 6Example of catchment segment (for location see Fig. 1) illustrating microplastic (MP) input into arable land and results of erosion modelling between 1950 and 2020. The maps show the situation in 2020. (a) Field-based land use. (b) Total MP input from sewage sludge, compost, and atmospheric input (without TW) as mean value over all arable land. (c) MP input from TW, spatially distributed to individual arable fields. (d) MP concentration below plough layer. (e) MP transported to other land uses via soil erosion. (f) MP distribution after water and tillage erosion on arable land (DEM: Bayerische Vermessungsverwaltung).
3.3 Scenario S1 – business as usual
If arable soils continue to be loaded with MP to the same degree as in 2020, the annual MP delivery rate into the Glonn stream network will increase by a factor of 4 by 2100. In 2100, 25.2 kg MP a−1 (min: 9.03 kg, max: 84.1 kg) through TW, compost, sewage sludge, and atmospheric deposition would end up in the stream network (Fig. 5b). Between 1950 and 2100, this would make a total MP input of 1.32 × 10³ kg (min: 511 kg, max: 4.7 × 10³ kg) into the stream network.
3.4 Scenario S2 – spatially targeted application of soil amendments
In S2, MP inputs from atmospheric deposition and TW accumulation continued like in S1. However, the location where the organic fertilizer (sewage sludge and compost) was applied in the catchment was changed. All organic fertilizers were applied either at a distance of at least 100 m from the stream network or within a distance smaller than 100 m along the stream network.
With an application at a distance of >100 m, the MP delivery in the stream network would be reduced to a total of 21.2 kg (min: 7.72 kg, max: 55.9 kg) in 2100 (Fig. 5c). That would correspond to a reduction of 16 % compared to S1. In the case of application at a distance of <100 m, on the other hand, it would be 27.9 kg (min: 10 kg, max: 102 kg) in 2100, thus showing an increase of 10.7 % compared to S1 (Fig. 5c).
The result becomes clearer if we consider TW and the organic fertilizers separately. If the distance is >100 m, the annual MP delivery rate from organic fertilizer (sewage sludge and compost) without TW is 1.1 kg MP a−1 (min: 0.4 kg, max: 7.8 kg) in 2100 (Fig. 7). For 2100, this would result in a 78 % reduction in the annual MP delivery rate from organic fertilizer into waterbodies compared to S1. In total, from 1950 to 2100, 173 kg MP (min: 60 kg, max: 1.0 × 10³ kg), or 46 % less MP from organic fertilizer, would end up in the stream network by 2100 (the effect of atmospheric input is negligible).
If organic fertilizer is applied along the stream network (max distance <100 m), a MP delivery of 7.8 kg a−1 (min: 2.6 kg, max: 54 kg) is modelled in 2100 (Fig. 7). Between 1950 and 2100, a total of 493 kg MP (min: 168 kg, max: 3.25 × 10³ kg) would be delivered to the river system by organic fertilizer (without TW).
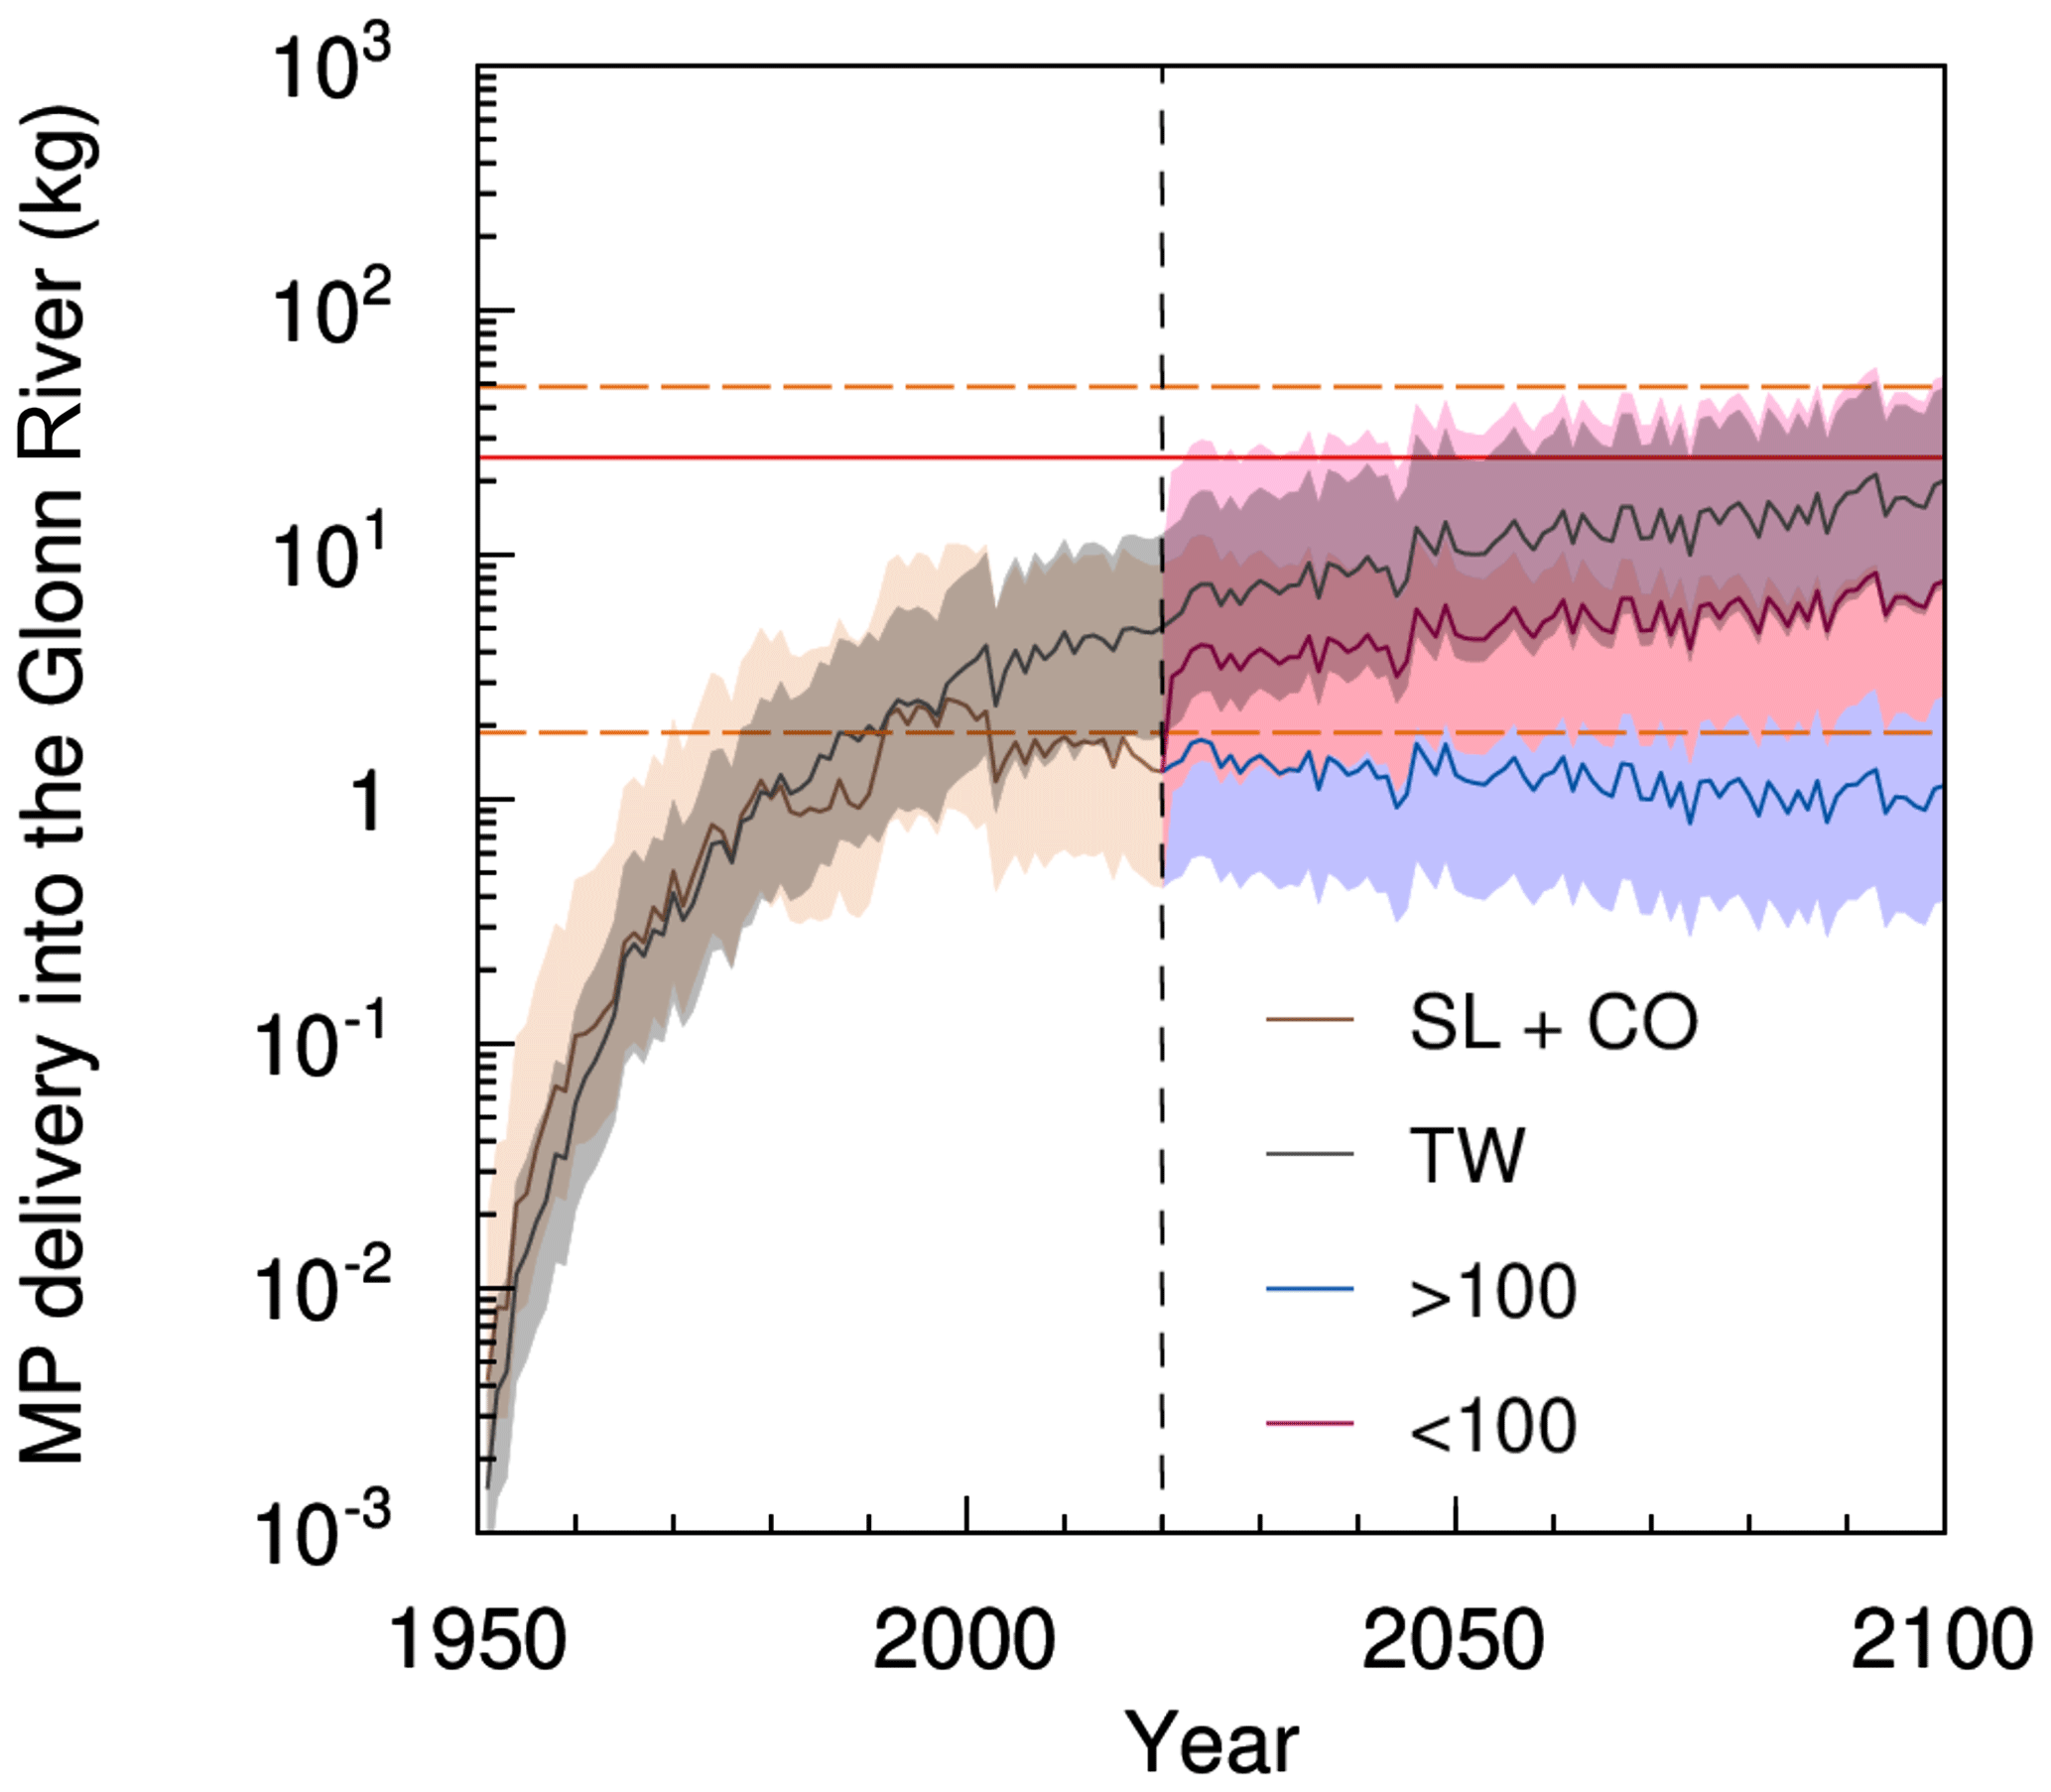
Figure 7Results of scenario S2 individually shown for tyre wear (TW) and for sewage sludge (SL) plus compost (CO) as organic fertilizer applied to arable land at a distance of >100 m and <100 m from water streams. For comparison, the amount of MP delivery through wastewater treatment plants (WWTPs) in 2020 is represented as red lines (min and max as dashed lines).
3.5 Scenario S3 – stop MP input
In scenario S3, MP input stops from 2020 onwards. This abrupt stop in plastic emission is not reflected in the MP delivery rates after 2020 (Fig. 5d). However, in the year 2100, 5.43 kg MP a−1 (min: 1.98 kg, max: 18.2 kg) would still end up in the stream network from arable land due to soil erosion (Fig. 5d). This corresponds to a decrease in the annual MP delivery rate of 14 % between 2020 and 2100, with 80 MP-free years (since 2020). Since 1950, a total of 684 kg MP (min: 246 kg, max: 2 × 10³ kg) would have ended up in the Glonn stream network.
4.1 Modelled erosion rates (sediment delivery)
The modelling approach used, with a yearly time step and the missing temporal and spatial variability of most model input data (especially the constant crop cover factor), while only varying yearly rainfall erosivity, leads to model outputs that do not capture the full temporal dynamics of the measured yearly sediment delivery. Averaging the model input variables led to an overestimation of years with low sediment delivery and an underestimation of years with high sediment delivery (Fig. 4). It is well documented that averaging model input variables over space and time generally leads to the overestimation of years with low sediment delivery and the underestimation of years with high sediment delivery (Keller et al., 2021; Meinen and Robinson, 2021). The reduced temporal variability in modelled sediment delivery is expected for two main reasons: (1) the annual model time step averages out years where individual extreme events dominate the yearly sediment delivery, and (2) varying only the annual rainfall erosivity while all other input parameters (especially cropping dynamics) are kept constant cannot capture the temporal dynamics. However, without any model calibration, the model is able to reflect the long-term mean sediment delivery between 1968 and 2020 (Fig. 4), explaining 51 % of the variability in the measured data. Hence, we conclude that SPEROS-MP is robust enough for this modelling study, which focuses on MP delivery to the stream network in the Glonn catchment, especially as uncertainties associated with the erosion modelling are, in any case, smaller than the uncertainties associated with estimates of MP emissions to the arable soils in the catchment.
4.2 Plausibility of MP soil input estimates
Estimating the cumulative MP–soil emissions from different sources for a period starting from 1950 is, of course, associated with large uncertainties. To account for these uncertainties, we deliberately used large ranges of possible inputs in our semi-virtual catchment approach; in the following discussion, these ranges are compared with literature values for Germany or Bavaria as a whole.
4.2.1 MP from sewage sludge, compost, and atmospheric deposition
Brandes et al. (2021) calculated mean MP inputs into agricultural soils in Germany for compost (1990–2016) and for sewage sludge (1983–2016). For Bavaria, their calculation results in compost–MP input rates of between 15 and 80 mg MP m−2 a−1 and sewage sludge–MP input rates between 0 and 190 mg MP m−2 a−1. Bertling et al. (2021) also determined MP emissions (TW excluded) to agricultural soils in Germany, resulting in much higher input rates for 2021 for compost and sewage sludge, with up to 702 and 2.1 × 10³ mg MP m−2 a−1 respectively. In contrast to the first authors, Braun et al. (2021) calculate the possible MP load for the legally permissible amount of compost applied to fields in Germany. This maximum permissible amount of compost application results in maximum possible entry rates – ranging from 34 to 4.7 × 10³ mg MP m−2 a−1 – into agricultural soils via compost.
For this study, MP emissions to arable soils between 0.42 and 4 mg MP m−2 a−1 for sewage sludge and between 0.56 and 15.8 mg MP m−3 a−1 for compost were calculated for Bavaria. Our values are not based on the maximum possible limits but rather on the most realistic estimates possible. Therefore, our MP loads remain well below the literature values. Nevertheless, the MP input from compost is likely to be underestimated based on optical detection of MP > 1 mm (Blasing and Amelung, 2018; Braun et al., 2021; Weithmann et al., 2018). Currently, much more compost (21 × 107 t in 2020) is spread on fields in Bavaria than sewage sludge (24 × 104 t in 2020), causing higher MP emissions from compost (Fig. 2a). This results from the reduction in sewage sludge application, which has been largely banned in Bavaria since 2017 (Schleypen, 2017) (Fig. 2c). However, regional policy strategies regarding the use of sewage sludge differ substantially within Germany, making comparisons within the country somewhat difficult (Brandes et al., 2021).
For atmospheric deposition, an average of 771 and 395 MP particles m−2 d−1 were measured at rural locations in London and Hamburg (Klein and Fischer, 2019; Wright et al., 2020). Brahney et al. (2020) show that airborne microplastic particles accumulate at minimum concentrations of 48 ± 7 MP particles m−2 d−1 even in the most isolated areas of the United States (national parks and national wilderness areas). Even in Antarctic snow, up to 29 MP particles per melted litre were found (Aves et al., 2022). In this study, the values of Witzig et al. (2021) were used to estimate the MP contribution via atmospheric deposition. They made MP measurements at different locations in Bavaria, ranging from 74 ± 19 to 109 ± 16 MP particles m−2 d−1. Even if the transfer of such particle numbers to mass inputs is associated with additional uncertainties, these amounts are orders of magnitude smaller than the inputs from sewage sludge and compost. In general, taking the considerable uncertainty in the data on MP inputs via the atmosphere into account, the results show that this magnitude is negligible compared to other sources investigated. This finding is important in a scientific context as it provides a better understanding of the magnitude of these inputs. The modelling analysis clearly shows that, in comparison to other MP sources, the atmospheric inputs are of minimal importance.
4.2.2 Tyre wear
The large MP mass resulting from tyre wear is noticeable in both the TW input data and the TW delivery rates into the stream network via erosion from arable land. With modelled mean TW delivery of 5 kg MP a−1 in 2020 into the river system, the equivalent of half a car tyre ends up as MP in the Glonn (flow length of 50 km) each year. However, the calculated mean TW input to the Glonn catchment of 200 mg MP m−2 in 2020 is in same the range as the estimates in other studies. For example, annual values of between 180 and 370 mg TW m−2 were reported for Germany (Baensch-Baltruschat et al., 2020; Kocher et al., 2010; Wagner et al., 2018). The modelled MP input (see Fig. 3) to arable land in the Glonn catchment was substantially smaller, with a mean of 19.7 mg TW m−2.
Most of the TW remains on the roads or in the immediate vicinity. Some of the TW is expected to be transported directly into surface waters via runoff from the road. Baensch-Baltruschat et al. (2020) estimated that 12 %–20 % of the tyre wear released on German roads ends up in surface water via road runoff. The hydrological model estimates of Unice et al. (2019) indicated that 18 % of released tyre wear was transported to freshwater in the Seine River catchment. In comparison, when focusing on the erosion of MPs mixed into the plough layer, only 0.11 % of the TW applied to arable soils from 1950 to 2020 reached the river system. While TW represents the largest entry source in our study, the overall MP flow to the stream network is an underestimation given the simplified approach. This mostly results from our assumption that all roads are surrounded by a 3 m grass buffer strip (even if this was not shown in the 5 m × 5 m land use raster map used), always trapping at least 85 % of the TW emissions (Fig. 3). Yet, even this conservative assumption is associated with high uncertainties. The width of the grass strip between the road and the field has an enormous impact on the MP emission. A 2 m wide buffer strip would still retain approximately 80 % of the TW emission, and a 1 m wide buffer strip would still retain approximately 65 % of the TW emission (Fig. 3). Without any assumed grass buffer strips, the MP emission from TW would be 8 times higher. Ultimately, the spatially distributed tyre wear is still associated with uncertainties. The level of TW emissions into the environment (not just arable land) makes other MP sources almost negligible, especially in terms of MP-saving strategies.
Overall, it can be concluded that our estimates of MP input to the Glonn catchment are on the same order of magnitude or somewhat smaller compared to most other studies and hence should be more or less reasonable, even if any estimates are associated with large uncertainties (e.g. extrapolating back to 1950, the small number of studies available for estimating MP concentrations in sewage sludge and compost, and errors when transferring particle numbers in particle mass). However, an error in modelling the MP delivery into the stream network of the test catchment most likely results from the fact that mean application rates (sewage sludge, compost) for the whole of Bavaria were used (Fig. 6b), while only TW input was calculated on a catchment-specific basis (Fig. 6c). Again, it is important to note that the Glonn catchment was used as an example to address and discuss the potential magnitude of the MP–soil erosion pathway in such mesoscale catchments determined by arable land use.
It should be noted that TW as a non-agriculture MP source is of paramount importance compared to other MP sources, especially with respect to MP reduction measures, not only for soil but also for waterbodies and probably all other environmental compartments. Measures to prevent MP in soil will have little noticeable effect if TW remains unchanged. This problem should be given more consideration in future studies and interpretations of results (Knight et al., 2020; Mennekes and Nowack, 2022).
4.3 The modelled fate of MP
As a mass-balanced model, SPEROS-MP calculates the MP input in mass (kg m2) and not in particle numbers. Hence, the model does not consider the type, shape, density, size, or chemical properties of the MP particles from different MP sources. It thus treats the erodibility of MP from all input pathways equally. However, it can be assumed that particle properties play a decisive role in the erosion-induced lateral transport, as well as in the potential vertical transport. Small MP particles should be translocated faster below the plough layer due to bioturbation and maybe infiltration (Li et al., 2021; Rehm et al., 2021; Waldschläger and Schüttrumpf, 2020). A subsequent reduction in MP concentration in the plough layer will also reduce MP erosion. On the other hand, smaller MP particles might interact more strongly with soil organic or mineral particles or might even be included in soil aggregates and hence are more likely transported as bulk soil. For example, Rehm et al. (2021) were able to demonstrate in a long-term plot experiment that smaller PE particles (53–100 µm) are less strongly enriched in delivered sediments compared to larger PE particles (250–300 µm). Such behaviour might change again with increasing particle size because, if particles transported with sheet flow are larger than the flow depths (mostly < 1 mm), transport in suspension is no longer possible.
In general, the potential decrease in topsoil MP concentration due to infiltration and bioturbation is not accounted for in SPEROS-MP. Vertical MP transport via infiltration and bioturbation has been widely discussed and partially observed in earlier studies (e.g. Rillig et al., 2017), while earthworms play an especially important role in directly transporting MP via digestion and excretion (Huerta Lwanga et al., 2018) or in preparing preferential flow pathways for MP leaching (Yu et al., 2019). Ignoring these processes of vertical movement below the plough layer will potentially lead to a slight overestimation of the topsoil MP concentration in the modelling approach presented here.
SPEROS-MP not only delivers MP into the stream network but also redistributes MP within the catchment and within the soil profile. Since arable land in the catchment is mostly found on the upper slopes and since grassland is mostly found in the flood plains, large amounts of MP are transported from arable land to grassland (Table 3). No tillage takes place in grasslands, leading to high MP concentrations in the topsoil. Along the main river in particular, grassland contaminated with MP (example shown in Fig. 6f) offers a high potential for MP loss during flood events. In the flood plains, the groundwater level is regularly close to the surface; hence, the chance of MP leaching to the groundwater increases (Chia et al., 2021; Singh and Bhagwat, 2022; Viaroli et al., 2022).
This analysis not only sheds light on the model's impact on MP distribution in varied landscape contexts but also underscores the potential environmental repercussions. The study significantly advances scientific understanding and practical relevance by emphasizing long-term field experiments and mesoscale model analyses. Nevertheless, gaps persist in MP research, particularly concerning standardized detection methods and quantification of terrestrial MP pollution. Addressing these gaps requires extensive additional research to comprehensively grasp the scope of MP pollution across diverse environmental media and the entirety of the MP cycle. Substantial measurements and fundamental research in this domain are imperative to enhance process comprehension and refine model applications.
4.4 Soil erosion as a potential MP source for inland waters
Comparing the annual MP input to arable land and the annual MP loss through soil erosion indicates that only a very small proportion (≤0.17 % since 1950) is delivered to the stream network. The loss rate of TW (0.11 %) was the smallest compared to sewage sludge, compost, and atmospheric deposition (Table 3). This is because the TW was not applied to all fields but only to the fields next to a road. The low percentage of input lost to the streams should not lead to the fallacy that MP transport via soil erosion is negligibly small (Schell et al., 2022; Weber et al., 2022). This becomes clearer when comparing the MP input from soil erosion with the MP input from wastewater treatment plants (WWTPs) in the study area (Fig. 5). Based on the known number and size of the WWTPs in the study area and MP loads in German WWTPs as in the literature (Mintenig et al., 2014), the MP delivery into the Glonn through WWTP outlets can be estimated at an average of 25 kg MP a−1 (min: 1.9 kg, max: 49 kg) in 2020 (Fig. 5). These values represent a maximum scenario since the calculations were based on the possible full capacities of the WWTPs. Within the test catchment, the MP delivery into the stream network was 6.3 kg MP a−1 (min: 2.2 kg, max: 21 kg) in 2020 but (S1, Fig. 5b) could reach 25.2 kg MP a−1 (min: 9 kg, max: 84.3 kg) by the end of the century (Fig. 5b).
Rehm et al. (2021) have shown that, due to its low density, MP is preferentially eroded and is enriched by up to a factor of 4 in delivered sediments. These potential enrichment effects were not included in SPEROS-MP. In addition, other MP input sources such as plastic used in agriculture (e.g. mulch films) and littering were not considered in this study. In this regard, the modelled MP delivery is therefore an underestimation. Overall, our results are in line with other larger-scale model estimates for the Bavarian section of the Danube catchment, showing that the MP input via soil erosion into waterbodies in rural areas outweighs the MP input of WWTP outlets (Witzig et al., 2021). It should therefore not be claimed that soil erosion for MP transport is negligible (Schell et al., 2022) while wastewater treatment plants are treated as a major MP source for inland waters (Cai et al., 2022; Eibes and Gabel, 2022; Murphy et al., 2016).
4.5 The MP sink function of soil results in a long-term MP source
Today's MP pollution of arable land represents a long-term MP source for inland waters. With the model scenarios S1 and S3, this study was able to show that the MP discharge from arable soils into inland waters via soil erosion will still affect many generations to come, even if MP entry into the terrestrial environment could be avoided. Because of low MP loss rates (≤0.17 %) via soil erosion and the stability of conventional plastic materials over centuries (Ng et al., 2018), the MP particles accumulate in the soil over the years. As most of the MP stays in the plough layer (Table 3), it is made available to surface runoff and erosion processes on a regular basis. After 80 years without MP input in S3, MP delivery from the soil decreased only by 14 %. The MP concentration in the topsoil of arable land decreases over time due to lateral MP loss into the stream network or into neighbouring grassland and forest areas (example shown in Fig. 6f). The MP concentration in the topsoil also decreases since erosion and tillage incorporate MP-free subsoil and, on the other hand, MP gets below the plough layer at depositional sites (outside the range of water erosion). It is important to note that tillage erosion plays an important role as it supports the burial of MP below the plough layer (example shown in Fig. 6e).
S3 is reminiscent of other well-known environmental problems of long-term diffuse pollution, e.g. with phosphorus (Daneshgar et al., 2018; Vaccari, 2009), where a pollutant accumulates in soils but slowly find its way into inland waters through soil erosion. In this respect, it is important to note that it will be easier to reduce MP inputs to stream networks coming from point sources, e.g. WWTPs, whereas the diffuse input will continue for centuries.
4.6 Targeted application of MP-laden organic fertilizer
The predicted increase in plastic production means that more MP inputs into the environment can be expected in the future (Borrelle et al., 2020; Horton, 2022). Because of this, it is necessary to consider what measures can be taken to reduce or avoid the entry of MP into the various environmental compartments. The results of S2 have shown that the application of organic fertilizer (without TW) containing MP at a distance of more than 100 m from the stream network can reduce MP entry into surface waters via soil erosion by up to 46 % compared to S1 (Fig. 7). By contrast, (unplanned) application of MP-laden soil amendments in the proximity of the stream network increases MP supply (by 53 % in our scenario).
This highlights the potential impact of optimized landscape management taking into account the location of any agricultural management activity. It also shows that, in addition to soil conservation in the field to prevent soil erosion, general changes in catchment management affecting hydrological and sedimentological connectivity have important implications for the transport of sediments and pollutants. Therefore, the location of soil additives, which are usually used to close production cycles, should be considered for future use. This consideration can have a significant influence on the subsequent erosion transport and redistribution of, for example, MP within a whole river catchment.
In this study, the transport of MP eroded from arable land was modelled across a mesoscale landscape. Sewage sludge, compost, atmospheric deposition, and tyre wear were considered to be MP sources. Not only did tyre wear represent the largest MP input to arable land. It also generated the largest MP delivery rates to the stream network, although tyre wear is not widespread on arable land, only occurring on fields near the roads. In percentage terms, only a small fraction (<0.2 %) of all MP applied to arable land ended up directly in the stream network via soil erosion. However, the MP mass delivered into the stream network represented a serious amount of MP input. The modelled MP delivery into the stream network was in the same range as potential MP inputs from wastewater treatment plants from this rural area.
In addition, it was shown that most of the MP applied to arable soils remains in the topsoil (0–20 cm) for decades. Tillage produces a regular homogenization, and the MP stays available for surface runoff and water erosion in the long term. Based on a series of scenarios modelled up to 2100 with no more MP input from 2020 onwards, similar MP delivery rates (compared to 2020) could still be identified. This implies that arable land represents an MP sink on the one hand and a long-term MP source for inland waters on the other.
Using the soil profile update component included in the SPEROS-MP model, the MP concentrations along the soil profile could be determined to a depth of 1 m. It was modelled that 5 % of the MP applied to arable land is translocated into the subsoil (>20 cm) by tillage and water erosion. Located below the plough horizon, the MP is out of reach for future lateral surface runoff erosion processes. Based on the spatially distributed erosion model, it was also demonstrated that most of the eroded MP leaving arable land is deposited in grassland (1 % of applied MP). Especially in areas of the river valleys, these accumulations could represent a concentrated MP entry into the stream network in the event of a flood.
The most effective protection for arable land would probably be to limit or ban the application of MP-contaminated organic fertilizers. The following measures would be conceivable to protect waterbodies from MP inputs through soil erosion. Our model scenario showed that the targeted application of MP-contaminated organic fertilizer at a distance of at least 100 m from the waterbody led to a significantly lower MP delivery rate from this MP source. The deliberate creation of grass strips in the landscape to protect against erosion would also be an option. However, it is important to consider that all calculated and modelled cases were dominated by tyre wear, which is difficult to manage, especially in regions with a high population and dense road network. Therefore, in order to preserve soil as a valuable resource, as well as to protect the terrestrial and aquatic ecosystem from MP pollution and its effects, we should focus on limiting MP emissions to the environment in general as much as possible.
All raw data can be provided by the corresponding authors upon request.
RR: writing – original draft, data curation, analysis, investigation, visualization, methodology. PF: conceptualization, supervision, resources, analysis, validation, writing – review and editing, funding acquisition.
At least one of the (co-)authors is a member of the editorial board of SOIL. The peer-review process was guided by an independent editor, and the authors also have no other competing interests to declare.
Publisher’s note: Copernicus Publications remains neutral with regard to jurisdictional claims made in the text, published maps, institutional affiliations, or any other geographical representation in this paper. While Copernicus Publications makes every effort to include appropriate place names, the final responsibility lies with the authors.
We would like to thank the Bavarian State Office of Agriculture (LfL) and the Bavarian State Office for Environment (LfU) for providing and accessing Bavaria-wide data, as well as for providing the modelling data for the Glonn catchment area. Finally, special thanks go to the members of the Soil and Water Resources Research Group in Augsburg for supporting this work.
This work was supported by the Federal Ministry of Education and Research as part of the initiative Plastics in the Environment (grant no. 02WPL1447A-G).
This paper was edited by Jan Vanderborght and reviewed by two anonymous referees.
Accinelli, C., Abbas, H. K., Bruno, V., Vicari, A., Little, N. S., Ebelhar, M. W., and Shier, W. T.: Minimizing abrasion losses from film-coated corn seeds, J. Crop Improv., 35, 666–678, https://doi.org/10.1080/15427528.2020.1861156, 2021.
Aves, A. R., Revell, L. E., Gaw, S., Ruffell, H., Schuddeboom, A., Wotherspoon, N. E., LaRue, M., and McDonald, A. J.: First evidence of microplastics in Antarctic snow, The Cryosphere, 16, 2127–2145, https://doi.org/10.5194/tc-16-2127-2022, 2022.
Baensch-Baltruschat, B., Kocher, B., Kochleus, C., Stock, F., and Reifferscheid, G.: Tyre and road wear particles-A calculation of generation, transport and release to water and soil with special regard to German roads, Sci. Total. Environ., 752, 141939, https://doi.org/10.1016/j.scitotenv.2020.141939, 2020.
BAYSIS: Straßenverkehrszählungen (SVZ), [data set], https://www.baysis.bayern.de (last access: 9 December 2023), 2015.
Bertling, J., Zimmermann, T., and Rödig, L.: Kunststoffe in der Umwelt: Emissionen in landwirtschaftlich genutzte Böden, Fraunhofer UMSICHT, Oberhausen, 220, https://doi.org/10.24406/umsicht-n-633611, 2021.
Blasing, M. and Amelung, W.: Plastics in soil: Analytical methods and possible sources, Sci. Total. Environ., 612, 422–435, https://doi.org/10.1016/j.scitotenv.2017.08.086, 2018.
Borrelle, S. B., Ringma, J., Law, K. L., Monnahan, C. C., Lebreton, L., McGivern, A., Murphy, E., Jambeck, J., Leonard, G. H., Hilleary, M. A., Eriksen, M., Possingham, H. P., De Frond, H., Gerber, L. R., Polidoro, B., Tahir, A., Bernard, M., Mallos, N., Barnes, M., and Rochman, C. M.: Predicted growth in plastic waste exceeds efforts to mitigate plastic pollution, Science, 369, 1515–1518, https://doi.org/10.1126/science.aba3656, 2020.
Borthakur, A., Leonard, J., Koutnik, V. S., Ravi, S., and Mohanty, S. K.: Inhalation risks of wind-blown dust from biosolid-applied agricultural lands: Are they enriched with microplastics and PFAS?, Curr. Opin. Environ. Sci. Health., 25, 100309, https://doi.org/10.1016/j.coesh.2021.100309, 2022.
Brahney, J., Hallerud, M., Heim, E., Hahnenberger, M., and Sukumaran, S.: Plastic rain in protected areas of the United States, Science, 368, 1257–1260, https://doi.org/10.1126/science.aaz5819, 2020.
Brandes, E.: Die Rolle der Landwirtschaft bei der (Mikro-) Plastik-Belastung in Böden und Oberflächengewässern, Mitt Umwetlchen Ökotox, 4, 111–114, 2020.
Brandes, E., Henseler, M., and Kreins, P.: Identifying hot-spots for microplastic contamination in agricultural soils – a spatial modelling approach for Germany, Environ. Res. Lett., 16, 104041, https://doi.org/10.1088/1748-9326/ac21e6, 2021.
Brandhuber, R., Auerswald, K., Lang, R., Müller, A., and Treisch, M.: ABAG interaktiv, Version 2.0. Bayerische Landesanstalt für Landwirtschaft, Freising, https://abag.lfl.bayern.de/ (last access: 21 January 2024), 2018.
Braun, M., Mail, M., Heyse, R., and Amelung, W.: Plastic in compost: Prevalence and potential input into agricultural and horticultural soils, Sci. Total Environ., 760, 143335, https://doi.org/10.1016/j.scitotenv.2020.143335, 2021.
Bullard, J. E., Ockelford, A., O'Brien, P., and Neuman, C. M.: Preferential transport of microplastics by wind, Atmos. Environ., 245, 118038, https://doi.org/10.1016/j.atmosenv.2020.118038, 2021.
Cai, Y., Wu, J., Lu, J., Wang, J., and Zhang, C.: Fate of microplastics in a coastal wastewater treatment plant: Microfibers could partially break through the integrated membrane system, Front. Environ. Sci. Eng., 16, 1–10, https://doi.org/10.1007/s11783-021-1517-0, 2022.
Chia, R. W., Lee, J.-Y., Kim, H., and Jang, J.: Microplastic pollution in soil and groundwater: a review, Environ. Chem. Lett., 19, 4211–4224, https://doi.org/10.1007/s10311-021-01297-6, 2021.
Colin, G., Cooney, J., Carlsson, D., and Wiles, D.: Deterioration of plastic films under soil burial conditions, J. Appl. Polym. Sci., 26, 509–519, https://doi.org/10.1002/app.1981.070260211, 1981.
Corcoran, P. L.: Degradation of microplastics in the environment, in: Handbook of Microplastics in the Environment, edited by: Mouneyrac, C., Springer, Cham, 531–542, https://doi.org/10.1007/978-3-030-39041-9_10, 2022.
Daneshgar, S., Callegari, A., Capodaglio, A. G., and Vaccari, D.: The potential phosphorus crisis: resource conservation and possible escape technologies: a review, Resources, 7, 37, https://doi.org/10.3390/resources7020037, 2018.
Desmet, P. and Govers, G.: A GIS procedure for automatically calculating the USLE LS factor on topographically complex landscape units, J. Soil. Water. Conserv., 51, 427–433, https://www.jswconline.org/content/51/5/427 (last access: 29 February 2024), 1996.
Dlugoß, V., Fiener, P., Van Oost, K., and Schneider, K.: Model based analysis of lateral and vertical soil carbon fluxes induced by soil redistribution processes in a small agricultural catchment, Earth Surf. Proc. Land., 37, 193–208, https://doi.org/10.1002/esp.2246, 2012.
DWD: Klimadaten direkt zum Download, 3. Rasterfelder für Deutschland, https://www.dwd.de/DE/leistungen/cdc/cdc_ueberblick-klimadaten.html (last access: 9 December 2023), 2020.
Edo, C., González-Pleiter, M., Leganés, F., Fernández-Piñas, F., and Rosal, R.: Fate of microplastics in wastewater treatment plants and their environmental dispersion with effluent and sludge, Environ. Pollut., 259, 113837, https://doi.org/10.1016/j.envpol.2019.113837, 2020.
Eibes, P. M. and Gabel, F.: Floating microplastic debris in a rural river in Germany: Distribution, types and potential sources and sinks, Sci. Total Environ., 816, 151641, https://doi.org/10.1016/j.scitotenv.2021.151641, 2022.
Feuilloley, P., César, G., Benguigui, L., Grohens, Y., Pillin, I., Bewa, H., Lefaux, S., and Jamal, M.: Degradation of polyethylene designed for agricultural purposes, J. Polym. Environ., 13, 349–355, https://doi.org/10.1007/s10924-005-5529-9, 2005.
Fiener, P., Dlugoß, V., and Van Oost, K.: Erosion-induced carbon redistribution, burial and mineralisation – Is the episodic nature of erosion processes important?, Catena, 133, 282–292, https://doi.org/10.1016/j.catena.2015.05.027, 2015.
Fiener, P., Govers, G., and Van Oost, K.: Evaluation of a dynamic multi-class sediment transport model in a catchment under soil-conservation agriculture, Earth Surf. Proc. Land., 33, 1639–1660, https://doi.org/10.1002/esp.1634, 2008.
Fiener, P., Dostál, T., Krása, J., Schmaltz, E., Strauss, P., and Wilken, F.: Operational USLE-Based Modelling of Soil Erosion in Czech Republic, Austria, and Bavaria – Differences in Model Adaptation, Parametrization, and Data Availability, Appl. Sci., 10, 3647, https://doi.org/10.3390/app10103647, 2020.
Fiener, P., Wilken, F., Aldana-Jague, E., Deumlich, D., Gómez, J., Guzmán, G., Hardy, R., Quinton, J., Sommer, M., and Van Oost, K.: Uncertainties in assessing tillage erosion–how appropriate are our measuring techniques?, Geomorphology, 304, 214–225, https://doi.org/10.1016/j.geomorph.2017.12.031, 2018.
Frias, J. and Nash, R.: Microplastics: Finding a consensus on the definition, Mar. Pollut. Bull., 138, 145–147, 10.1016/j.marpolbul.2018.11.022, 2019.
Gehrke, I., Dresen, B., Blömer, J., Sommer, H., Lindow, F., and Röckle, R.: TyreWearMapping, Digitales Planungs-und Entscheidungsinstrument zur Verteilung, Ausbreitung und Quantifizierung von Reifenabrieb in Deutschland, Fraunhofer UMSICHT, Oberhausen, https://doi.org/10.24406/publica-fhg-301286, 2021.
Govers, G., Vandaele, K., Desmet, P., Poesen, J., and Bunte, K.: The role of tillage in soil redistribution on hillslopes, Eur. J. Soil Sci., 45, 469–478, https://doi.org/10.1111/j.1365-2389.1994.tb00532.x, 1994.
Guo, J. J., Huang, X. P., Xiang, L., Wang, Y. Z., Li, Y. W., Li, H., Cai, Q. Y., Mo, C. H., and Wong, M. H.: Source, migration and toxicology of microplastics in soil, Environ. Int., 137, 105263, https://doi.org/10.1016/j.envint.2019.105263, 2020.
Habib, R. Z., Thiemann, T., and Al Kendi, R.: Microplastics and wastewater treatment plants – a review, J. Water Res. Prot., 12, 1–35, https://doi.org/10.4236/jwarp.2020.121001, 2020.
Heinze, W. M., Mitrano, D. M., and Cornelis, G.: Bioturbation-driven transport of microplastic fibres in soil, EGU General Assembly 2022, Vienna, Austria, 23–27 May 2022, EGU22-7987, https://doi.org/10.5194/egusphere-egu22-7987, 2022.
Hillenbrand, T., Toussaint, D., Boehm, E., Fuchs, S., Scherer, U., Rudolphi, A., and Hoffmann, M.: Discharges of copper, zinc and lead to water and soil, Analysis of the emission pathways and possible emission reduction measures; Eintraege von Kuper, Zink und Blei in Gewaesser und Boeden, Analyse der Emissionspfade und moeglicher Emissionsminderungsmassnahmen, Technical Report, Umweltbundesamt, Dessau, Germany, 329 pp., 2005.
Horton, A. A.: Plastic pollution: When do we know enough?, J. Hazard. Mater., 422, 126885, https://doi.org/10.1016/j.jhazmat.2021.126885, 2022.
Huerta Lwanga, E., Thapa, B., Yang, X., Gertsen, H., Salanki, T., Geissen, V., and Garbeva, P.: Decay of low-density polyethylene by bacteria extracted from earthworm's guts: A potential for soil restoration, Sci. Total Environ., 624, 753–757, https://doi.org/10.1016/j.scitotenv.2017.12.144, 2018.
Hurley, R. R. and Nizzetto, L.: Fate and occurrence of micro(nano)plastics in soils: Knowledge gaps and possible risks, Curr. Opin. Environ. Sci. Health., 1, 6–11, https://doi.org/10.1016/j.coesh.2017.10.006, 2018.
Keller, B., Centeri, C., Szabó, J. A., Szalai, Z., and Jakab, G.: Comparison of the applicability of different soil erosion models to predict soil erodibility factor and event soil losses on loess slopes in Hungary, Water, 13, 3517, https://doi.org/10.3390/w13243517, 2021.
Kim, Y.-N., Yoon, J.-H., and Kim, K.-H. J.: Microplastic contamination in soil environment – a review, Soil Sci. Ann., 71, 300–308, https://doi.org/10.37501/soilsa/131646, 2021.
Klein, M. and Fischer, E. K.: Microplastic abundance in atmospheric deposition within the Metropolitan area of Hamburg, Germany, Sci. Total Environ., 685, 96–103, https://doi.org/10.1016/j.scitotenv.2019.05.405, 2019.
Knight, L. J., Parker-Jurd, F. N. F., Al-Sid-Cheikh, M., and Thompson, R. C.: Tyre wear particles: an abundant yet widely unreported microplastic?, Environ. Sci. Pollut. Res. Int., 27, 18345–18354, https://doi.org/10.1007/s11356-020-08187-4, 2020.
Kocher, B., Brose, S., Feix, J., Görg, C., Peters, A., and Schenker, K.: Stoffeinträge in den Straßenseitenraum-Reifenabrieb, Bundesanstalt für Straßenwesen, Bergisch Gladbach, Germany, 33 pp., 2010.
Krasa, J., Dostal, T., Van Rompaey, A., Vaska, J., and Vrana, K.: Reservoirs' siltation measurments and sediment transport assessment in the Czech Republic, the Vrchlice catchment study, Catena, 64, 348–362, https://doi.org/10.1016/j.catena.2005.08.015, 2005.
LfL: Erosionsatlas Bayern, https://www.lfl.bayern.de/iab/boden/029288/index.php (last access: 9 December 2023), 2023.
LfStaD: Statistisches Jahrbuch für Bayern, https://www.statistik.bayern.de/produkte/jahrbuch/index.html (last access: 9 December 2023), 2022.
LfU: Abfallbilanz Hausmüll in Bayern, https://www.lfu.bayern.de/abfall/abfallbilanz/index.htm (last access: 9 December 2023), 2023.
Li, H., Lu, X., Wang, S., Zheng, B., and Xu, Y.: Vertical migration of microplastics along soil profile under different crop root systems, Environ. Pollut., 278, 116833, https://doi.org/10.1016/j.envpol.2021.116833, 2021.
Li, S., Ding, F., Flury, M., Wang, Z., Xu, L., Li, S., Jones, D. L., and Wang, J.: Macro- and microplastic accumulation in soil after 32 years of plastic film mulching, Environ. Pollut., 300, 118945, https://doi.org/10.1016/j.envpol.2022.118945, 2022.
Lian, J., Liu, W., Meng, L., Wu, J., Zeb, A., Cheng, L., Lian, Y., and Sun, H.: Effects of microplastics derived from polymer-coated fertilizer on maize growth, rhizosphere, and soil properties, J. Clean. Prod., 318, 128571, https://doi.org/10.1016/j.jclepro.2021.128571, 2021.
Liu, E. K., He, W. Q., and Yan, C. R.: “White revolution” to “white pollution” – agricultural plastic film mulch in China, Environ. Res. Lett., 9, 091001, https://doi.org/10.1088/1748-9326/9/9/091001, 2014.
Lwanga, E. H., Beriot, N., Corradini, F., Silva, V., Yang, X., Baartman, J., Rezaei, M., van Schaik, L., Riksen, M., and Geissen, V.: Review of microplastic sources, transport pathways and correlations with other soil stressors: a journey from agricultural sites into the environment, Chem. Biol. Technol., 9, 1–20, https://doi.org/10.1186/s40538-021-00278-9, 2022.
Meinen, B. U. and Robinson, D. T.: Agricultural erosion modelling: Evaluating USLE and WEPP field-scale erosion estimates using UAV time-series data, Environ. Model. Softw., 137, 104962, https://doi.org/10.1016/j.envsoft.2021.104962, 2021.
Mennekes, D. and Nowack, B.: Tire wear particle emissions: Measurement data where are you?, Sci. Total Environ., 830, 154655, 10.1016/j.scitotenv.2022.154655, 2022.
Mintenig, S., Int-Veen, I., Löder, M., and Gerdts, G.: Mikroplastik in ausgewählten Kläranlagen des Oldenburgisch-Ostfriesischen Wasserverbandes (OOWV) in Niedersachsen, Alfred-Wegener-Institut, Helgoland, Germany, 41 pp., 2014.
Motto, H. L., Daines, R. H., Chilko, D. M., and Motto, C. K.: Lead in soils and plants: its relation to traffic volume and proximity to highways, Environ. Sci. Tech., 4, 231-237, https://doi.org/10.1021/es60038a009, 1970.
Müller, A., Kocher, B., Altmann, K., and Braun, U.: Determination of tire wear markers in soil samples and their distribution in a roadside soil, Chemosphere, 294, 133653, https://doi.org/10.1016/j.chemosphere.2022.133653, 2022.
Murphy, F., Ewins, C., Carbonnier, F., and Quinn, B.: Wastewater Treatment Works (WwTW) as a Source of Microplastics in the Aquatic Environment, Environ. Sci. Technol., 50, 5800–5808, https://doi.org/10.1021/acs.est.5b05416, 2016.
Nadeu, E., Gobin, A., Fiener, P., Van Wesemael, B., and Van Oost, K.: Modelling the impact of agricultural management on soil carbon stocks at the regional scale: the role of lateral fluxes, Glob. Chang. Biol., 21, 3181–3192, https://doi.org/10.1111/gcb.12889, 2015.
Nasseri, S. and Azizi, N.: Occurrence and Fate of Microplastics in Freshwater Resources, in: Microplastic Pollution, Emerging Contaminants and Associated Treatment Technologies, edited by: Hashmi, M. Z., Springer, Cham, Germany, 187–200, https://doi.org/10.1007/978-3-030-89220-3_, 2022.
Ng, E. L., Huerta Lwanga, E., Eldridge, S. M., Johnston, P., Hu, H. W., Geissen, V., and Chen, D.: An overview of microplastic and nanoplastic pollution in agroecosystems, Sci. Total Environ., 627, 1377–1388, https://doi.org/10.1016/j.scitotenv.2018.01.341, 2018.
Ng, E.-L., Lwanga, E. H., Eldridge, S. M., Johnston, P., Hu, H.-W., Geissen, V., and Chen, D.: An overview of microplastic and nanoplastic pollution in agroecosystems, Sci. Total Environ., 627, 1377–1388, https://doi.org/10.1016/j.scitotenv.2018.01.341, 2020.
Nunes, J. P., Wainwright, J., Bielders, C. L., Darboux, F., Fiener, P., Finger, D., and Turnbull, L.: Better models are more effectively connected models, Earth Surf. Proc. Land., 43, 1355–1360, https://doi.org/10.1002/esp.4323, 2018.
Pérez-Reverón, R., González-Sálamo, J., Hernández-Sánchez, C., González-Pleiter, M., Hernández-Borges, J., and Díaz-Peña, F. J.: Recycled wastewater as a potential source of microplastics in irrigated soils from an arid-insular territory (Fuerteventura, Spain), Sci. Total Environ., 817, 152830, https://doi.org/10.1016/j.scitotenv.2021.152830, 2022.
Rehm, R., Zeyer, T., Schmidt, A., and Fiener, P.: Soil erosion as transport pathway of microplastic from agriculture soils to aquatic ecosystems, Sci. Total Environ., 795, 148774, https://doi.org/10.1016/j.scitotenv.2021.148774, 2021.
Rillig, M. C., Ziersch, L., and Hempel, S.: Microplastic transport in soil by earthworms, Sci. Rep., 7, 1362, 10.1038/s41598-017-01594-7, 2017.
Sajjad, M., Huang, Q., Khan, S., Khan, M. A., Yin, L., Wang, J., Lian, F., Wang, Q., and Guo, G.: Microplastics in the soil environment: A critical review, Environ. Technol., 27, 102408, https://doi.org/10.1016/j.eti.2022.102408, 2022.
Schell, T., Hurley, R., Buenaventura, N. T., Mauri, P. V., Nizzetto, L., Rico, A., and Vighi, M.: Fate of microplastics in agricultural soils amended with sewage sludge: Is surface water runoff a relevant environmental pathway?, Environ. Pollut., 293, 118520, https://doi.org/10.1016/j.envpol.2021.118520, 2022.
Scheurer, M. and Bigalke, M.: Microplastics in Swiss Floodplain Soils, Environ. Sci. Technol., 52, 3591–3598, https://doi.org/10.1021/acs.est.7b06003, 2018.
Schleypen, P.: Abwasserbehandlung (nach 1945), Historisches Lexikon Bayerns, https://www.historisches-lexikon-bayerns.de/Lexikon/Abwasserbehandlung_(nach_1945) (last access: 21 January 2024), 2017.
Schmidt, J., v. Werner, M., and Michael, A.: Application of the EROSION 3D model to the CATSOP watershed, The Nederlands, Catena, 37, 449–456, https://doi.org/10.1016/S0341-8162(99)00032-6, 1999.
Schwertmann, U., Vogl, W., and Kainz, M.: Bodenerosion durch Wasser, Ulmer Verlag, Stuttgart, 64 pp., ISBN 978-3-8001-3088-7, 1987.
Singh, S. and Bhagwat, A.: Microplastics: A potential threat to groundwater resources, Groundw. Sustain. Dev., 19, 100852, https://doi.org/10.1016/j.gsd.2022.100852, 2022.
Sommer, F., Dietze, V., Baum, A., Sauer, J., Gilge, S., Maschowski, C., and Gieré, R.: Tire abrasion as a major source of microplastics in the environment, Aerosol Air Qual. Res., 18, 2014–2028, https://doi.org/10.4209/aaqr.2018.03.0099, 2018.
StMB: Verkehrsentwicklung, https://www.stmb.bayern.de/vum/handlungsfelder/verkehrsinfrastruktur/verkehrsentwicklung/index.php (last access: 9 December 2023), 2023.
Tang, K. H. D. and Hadibarata, T.: Microplastics removal through water treatment plants: Its feasibility, efficiency, future prospects and enhancement by proper waste management, Environ. Chall., 5, 100264, https://doi.org/10.1016/j.envc.2021.100264, 2021.
Tian, L., Jinjin, C., Ji, R., Ma, Y., and Yu, X.: Microplastics in agricultural soils: sources, effects, and their fate, Curr. Opin. Environ. Sci. Health., 25, 100311, https://doi.org/10.1016/j.coesh.2021.100311, 2022.
Unice, K. M., Weeber, M. P., Abramson, M. M., Reid, R. C. D., van Gils, J. A. G., Markus, A. A., Vethaak, A. D., and Panko, J. M.: Characterizing export of land-based microplastics to the estuary – Part I: Application of integrated geospatial microplastic transport models to assess tire and road wear particles in the Seine watershed, Sci. Total Environ., 646, 1639–1649, https://doi.org/10.1016/j.scitotenv.2018.07.368, 2019.
Vaccari, D. A.: Phosphorus: a looming crisis, Sci. Am., 300, 54–59, https://doi.org/10.1038/scientificamerican0609-54, 2009.
Van Oost, K., Govers, G., and Desmet, P.: Evaluating the effects of changes in landscape structure on soil erosion by water and tillage, Landsc. Ecol., 15, 577-589, https://doi.org/10.1023/A:1008198215674, 2000.
Van Oost, K., Govers, G., and Van Muysen, W.: A process-based conversion model for caesium-137 derived erosion rates on agricultural land: An integrated spatial approach, Earth Surf. Proc. Land., 28, 187–207, https://doi.org/10.1002/esp.446, 2003.
Van Oost, K., Govers, G., De Alba, S., and Quine, T.: Tillage erosion: a review of controlling factors and implications for soil quality, Prog. Phys. Geogr., 30, 443–466, https://doi.org/10.1191/0309133306pp487ra, 2006.
Van Oost, K., Quine, T., Govers, G., and Heckrath, G.: Modeling soil erosion induced carbon fluxes between soil and atmosphere on agricultural land using SPEROS-C, in: Advances in soil science. Soil erosion and carbon dynamics, edited by: Roose, E. J., Lal, R., Feller, C., Barthes, B., and Stewart, B. A., CRC Press, Boca Raton, 37–51, 2005a.
Van Oost, K., Govers, G., Quine, T. A., Heckrath, G., Olesen, J. E., De Gryze, S., and Merckx, R.: Landscape-scale modeling of carbon cycling under the impact of soil redistribution: The role of tillage erosion, Global Biogeochem. Cy., 19, 1–13, https://doi.org/10.1029/2005GB002471, 2005b.
Van Rompaey, A. J., Verstraeten, G., Van Oost, K., Govers, G., and Poesen, J.: Modelling mean annual sediment yield using a distributed approach, Earth Surf. Proc. Land., 26, 1221–1236, https://doi.org/10.1002/esp.275, 2001.
Verstraeten, G. and Prosser, I. P.: Modelling the impact of land-use change and farm dam construction on hillslope sediment delivery to rivers at the regional scale, Geomorphology, 98, 199–212, https://doi.org/10.1016/j.geomorph.2006.12.026, 2008.
Viaroli, S., Lancia, M., and Re, V.: Microplastics contamination of groundwater: Current evidence and future perspectives, A review, Sci. Total Environ., 824, 153851, https://doi.org/10.1016/j.scitotenv.2022.153851, 2022.
Wagner, S., Huffer, T., Klockner, P., Wehrhahn, M., Hofmann, T., and Reemtsma, T.: Tire wear particles in the aquatic environment – A review on generation, analysis, occurrence, fate and effects, Water. Res., 139, 83–100, https://doi.org/10.1016/j.watres.2018.03.051, 2018.
Waldschläger, K. and Schüttrumpf, H.: Infiltration Behavior of Microplastic Particles with Different Densities, Sizes, and Shapes – From Glass Spheres to Natural Sediments, Environ. Sci. Tech., 54, 9366-9373, https://doi.org/10.1021/acs.est.0c01722, 2020.
Weber, C. J., Santowski, A., and Chifflard, P.: Investigating the dispersal of macro- and microplastics on agricultural fields 30 years after sewage sludge application, Sci. Rep., 12, 6401, https://doi.org/10.1038/s41598-022-10294-w, 2022.
Weithmann, N., Möller, J. N., Löder, M. G., Piehl, S., Laforsch, C., and Freitag, R.: Organic fertilizer as a vehicle for the entry of microplastic into the environment, Sci. Adv., 4, eaap8060, https://doi.org/10.1126/sciadv.aap8060, 2018.
Werkenthin, M., Kluge, B., and Wessolek, G.: Metals in European roadside soils and soil solution – A review, Environ. Pollut., 189, 98–110, https://doi.org/10.1016/j.envpol.2014.02.025, 2014.
Wheeler, G. and Rolfe, G.: The relationship between daily traffic volume and the distribution of lead in roadside soil and vegetation, Environ. Pollut., 18, 265–274, https://doi.org/10.1016/0013-9327(79)90022-3, 1979.
Wik, A. and Dave, G.: Occurrence and effects of tire wear particles in the environment – A critical review and an initial risk assessment, Environ. Pollut., 157, 1–11, https://doi.org/10.1016/j.envpol.2008.09.028, 2009.
Witzig, C., Wörle, K., Földi, C., Rehm, R., Reuwer, A.-K., Ellerbrake, K., Cieplik, S., Rehorek, A., Freier, K., Dierkes, G., Wick, A., Ternes, T., Fiener, P., Klasmeier, J., and Zumbülte, N.: Mikroplastik in Binnengewässern, Untersuchung und Modellierung des Eintrags und Verbleibs im Donaugebiet als Grundlage für Maßnahmenplanung, Technologiezentrum für Wasser, Karlsruhe, 190 pp., 2021.
WRB, I. W. G.: World reference base for soil resources 2014, Internation soil classification sstem for naming soils and creating legends for soil maps, Update 2025, Food and Agriculture Organization of the United Nations, Rome, Italy, 203 pp., ISBN 978-92-5-108369-7, 2015.
Wright, S. L., Ulke, J., Font, A., Chan, K. L. A., and Kelly, F. J.: Atmospheric microplastic deposition in an urban environment and an evaluation of transport, Environ. Int., 136, 105411, https://doi.org/10.1016/j.envint.2019.105411, 2020.
Zhang, L., Xie, Y., Liu, J., Zhong, S., Qian, Y., and Gao, P.: An overlooked entry pathway of microplastics into agricultural soils from application of sludge-based fertilizers, Environ. Sci. Tech., 54, 4248–4255, https://doi.org/10.1021/acs.est.9b07905, 2020.
Zhang, Y., Gao, T., Kang, S., Shi, H., Mai, L., Allen, D., and Allen, S.: Current status and future perspectives of microplastic pollution in typical cryospheric regions, Earth Sci. Rev., 226, 103924, https://doi.org/10.1016/j.earscirev.2022.103924, 2022.
Zhao, S., Zhang, Z., Chen, L., Cui, Q., Cui, Y., Song, D., and Fang, L.: Review on migration, transformation and ecological impacts of microplastics in soil, Appl. Soil Ecol., 176, 104486, https://doi.org/10.1016/j.apsoil.2022.104486, 2022.
Zhou, Y., Wang, J., Zou, M., Jia, Z., Zhou, S., and Li, Y.: Microplastics in soils: A review of methods, occurrence, fate, transport, ecological and environmental risks, Sci. Total Environ., 748, 141368, https://doi.org/10.1016/j.scitotenv.2020.141368, 2020.
Zubris, K. A. and Richards, B. K.: Synthetic fibers as an indicator of land application of sludge, Environ. Pollut., 138, 201–211, https://doi.org/10.1016/j.envpol.2005.04.013, 2005.