the Creative Commons Attribution 4.0 License.
the Creative Commons Attribution 4.0 License.
 | 05 Mar 2024
Reference soil groups map of Ethiopia based on legacy data and machine learning-technique: EthioSoilGrids 1.0
Ashenafi Ali
Teklu Erkossa
Kiflu Gudeta
Wuletawu Abera
Ephrem Mesfin
Terefe Mekete
Mitiku Haile
Wondwosen Haile
Assefa Abegaz
Demeke Tafesse
Gebeyhu Belay
Mekonen Getahun
Sheleme Beyene
Mohamed Assen
Alemayehu Regassa
Yihenew G. Selassie
Solomon Tadesse
Dawit Abebe
Yitbarek Wolde
Nesru Hussien
Abebe Yirdaw
Addisu Mera
Tesema Admas
Feyera Wakoya
Awgachew Legesse
Nigat Tessema
Ayele Abebe
Simret Gebremariam
Yismaw Aregaw
Bizuayehu Abebaw
Damtew Bekele
Eylachew Zewdie
Steffen Schulz
Lulseged Tamene
Eyasu Elias
Up-to-date digital soil resource information and its comprehensive understanding are crucial to supporting crop production and sustainable agricultural development. Generating such information through conventional approaches consumes time and resources, and is difficult for developing countries. In Ethiopia, the soil resource map that was in use is qualitative, dated (since 1984), and small scaled (1 : 2 M), which limit its practical applicability. Yet, a large legacy soil profile dataset accumulated over time and the emerging machine-learning modeling approaches can help in generating a high-quality quantitative digital soil map that can provide better soil information. Thus, a group of researchers formed a Coalition of the Willing for soil and agronomy data-sharing and collated about 20 000 soil profile data and stored them in a central database. The data were cleaned and harmonized using the latest soil profile data template and 14 681 profile data were prepared for modeling. Random forest was used to develop a continuous quantitative digital map of 18 World Reference Base (WRB) soil groups at 250 m resolution by integrating environmental covariates representing major soil-forming factors. The map was validated by experts through a rigorous process involving senior soil specialists or pedologists checking the map based on purposely selected district-level geographic windows across Ethiopia. The map is expected to be of tremendous value for soil management and other land-based development planning, given its improved spatial resolution and quantitative digital representation.
- Article
(10407 KB) - Full-text XML
- BibTeX
- EndNote


Soils are important resources that support the development and production of various economic, social, and ecosystem services, and are useful in climate change mitigation and adaptation (Baveye et al., 2016). Data on the physical and chemical characteristics of soils and their spatial distribution are needed to define and plan their functions over time and space, which are important steps toward sustainable use and management of soils (Elias, 2016; Hengl et al., 2017).
In Ethiopia, soil surveys and mapping have been conducted at various scales with varying scopes, approaches, methodologies, qualities, and levels of detail (Abayneh, 2001; Abayneh and Berhanu, 2007; Berhanu, 1994; Elias, 2016; Zewdie, 2013). The most recent countrywide digital soil mapping efforts focused primarily on soil characteristics (Ali et al., 2020; Iticha and Chalsissa, 2019; Tamene et al., 2017), although soil class maps are equally important for allocating a particular soil unit for specific use (Leenaars et al., 2020a; Wadoux et al., 2020). Many attempts have been made to improve digital soil information systems (Hengl et al., 2021, 2017, 2015; Poggio et al., 2021). However, the initiatives were based on limited and unevenly distributed soil profile data (e.g., 1.15 soil profiles per 1000 km2 for Ethiopia), which restricts the accuracy and applicability of the products.
In Ethiopia, thousands of soil profile data have been collected since the 1960s (Erkossa et al., 2022), but these data were scattered across different institutions and individuals (Ali et al., 2020). Furthermore, countrywide quantitative and gridded spatial soil-type information does not exist (Elias, 2016). The Ethiopian Soil Information System (EthioSIS) project attempted to develop a countrywide digital soil map focusing on topsoil characteristics, including plant nutrient content, but overlooked soil resource mapping (Ali et al., 2020; Elias, 2016), despite a strong need for a high-resolution soil resource map (Mulualem et al., 2018).
Ethiopia has an area of about 1.14×10⁶ km2 consisting of varied environments, making its soils extremely heterogeneous. Capturing the heterogeneity using conventional soil survey and mapping approaches is an expensive and time-consuming endeavor (Hounkpatin et al., 2018). This can be circumvented by using available legacy soil profile data accumulated over decades and by tapping into the potential of advanced analytical techniques to develop high-resolution digital soil maps (Hounkpatin et al., 2018; Kempen, 2012, 2009). Therefore, the objectives of this study were to (i) develop a national legacy soil profile dataset that can be used as an input for various digital soil mapping exercises, and (ii) generate an improved 250 m digital Reference Soil Groups (RSGs) map of Ethiopia.
2.1 The study area
The study area covered the entire area of Ethiopia (1.14×10⁶ km2) located between 3 and 15° N, and between 33 and 48° E (Fig. 1). The topography of the country is marked by a large altitudinal variation, ranging from 126 m below sea level at Dalol in the northeast to 4620 m at Ras Dashen Mountain in the northwest (Billi, 2015; Enyew and Steeneveld, 2014). Ethiopia's wide range of topography, climate, parent material, and land use types created conditions for the formation of different soil types (Abayneh, 2005; Berhanu and Ochtman, 1974; Donahue, 1972; Mesfin, 1998; Nyssen et al., 2019; Virgo and Munro, 1978; Zewdie, 2013, 1999). More than 33 % of the country is covered by the central, upper, and highland complex (Abegaz et al., 2022), which embraces Africa's most prominent mountain system (Hurni, 1998).
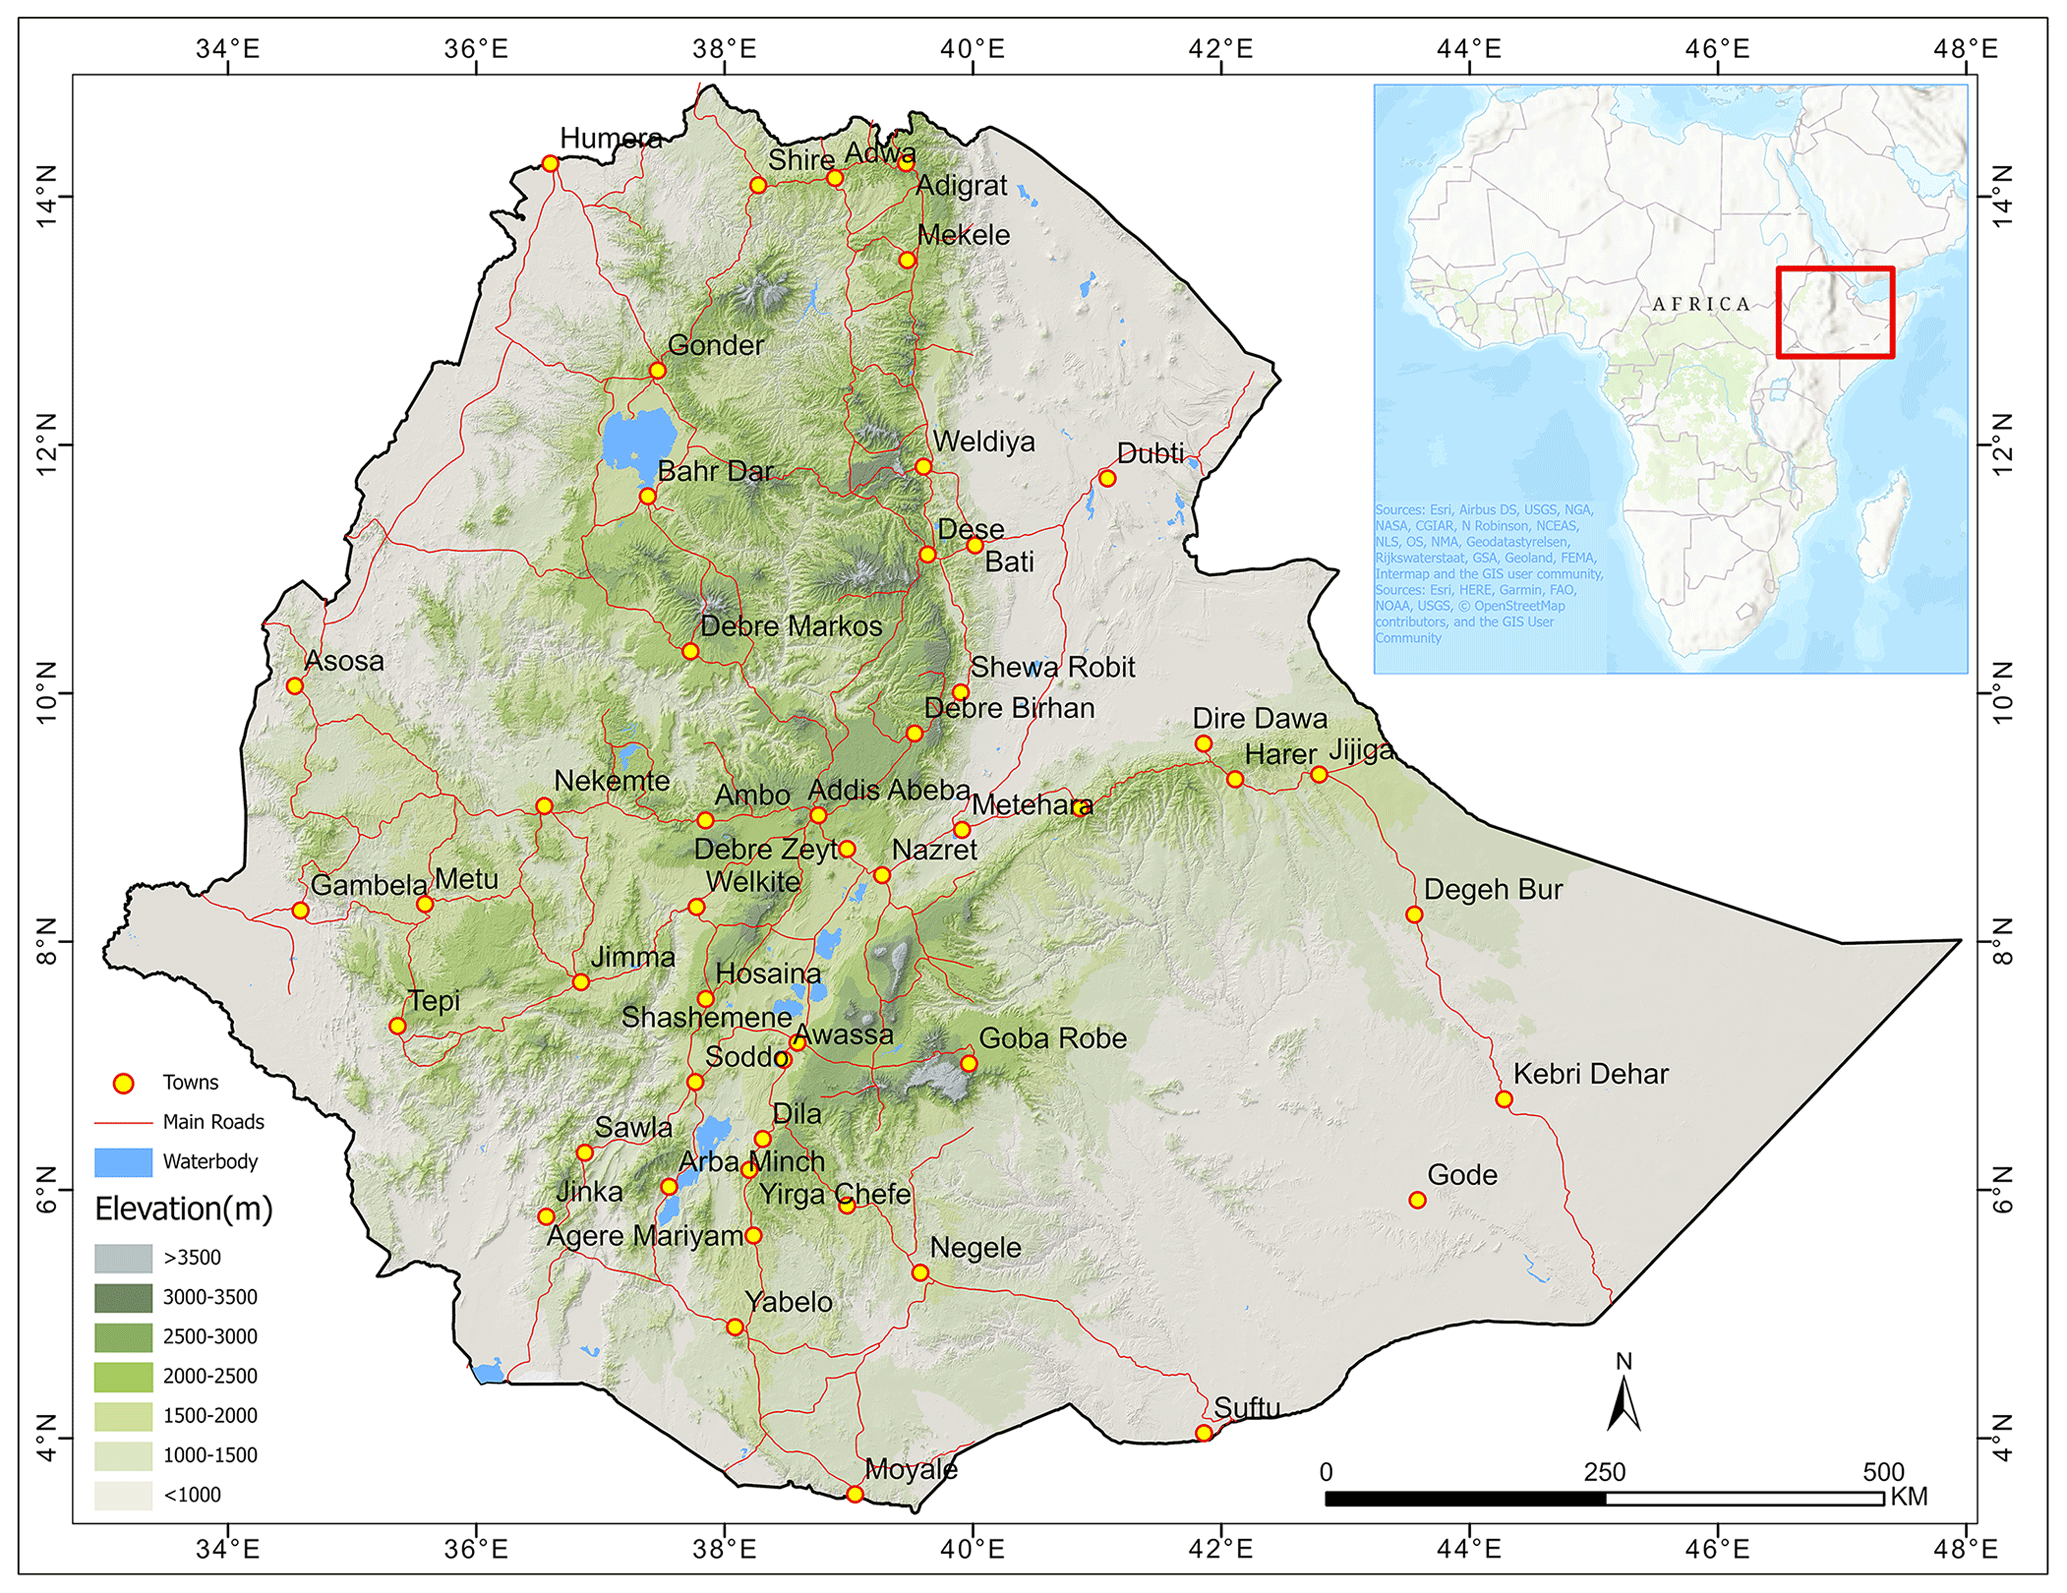
Figure 1Location map of Ethiopia (inset) and overview map of Esri World Topographic Map.
The country's complex topography strongly determines both rainfall and temperature patterns, by modifying the influence of the large-scale ocean–land–atmosphere pattern, thus creating diverse localized climates. Spatially, rainfall is characterized by a general decreasing trend in the direction from west to east, north, northeast, south and southeast. The lowlands in the southeast and northeast, covering approximately 55 % of the country's land area, are characterized by arid and semi-arid climates. Annual rainfall ranges from less than 300 mm in the southeastern and northwestern lowlands to over 2000 mm in the southwestern highlands (southern portion of the western highlands). The eastern lowlands get rain twice a year, in April–May and October–November, with two dry periods in between. The total annual precipitation in this region varies from less than 500 to 1000 mm. The driest of all regions is the Denakil Plain, which receives less than 500 mm of rain and sometimes none (Fazzini et al., 2015). Temperatures are also greatly influenced by the rapidly changing altitude, and the mean monthly values vary from ∼ 35 °C in the northeast lowlands to less than 7.5 °C over the north and central highlands.
The country is characterized by a wide variety of geological formations (Abyneh, 2005; Alemayehu et al., 2014; Elias, 2016; Zewdie, 2013). These include (i) recent and old volcanic activities; (ii) the highlands consisting of igneous rocks (mainly basalts); (iii) steep-sided valleys characterized by strong colluvial and alluvial deposits; (iv) metamorphic rocks exposed by denudation process; and (v) various sedimentary rocks such as limestone and sandstone in the relatively lower areas.
Diverse biophysical factors affecting the spatial distribution of vegetated land cover which in turn, both as single and combined factors, result in diverse soil types and properties across Ethiopia's landscapes (Hurni, 1998; Nyssen et al., 2019; WLRC-AAU, 2018). The spatiotemporal vegetation cover of the country has been characterized by a long history of land use and land cover changes (WLRC-AAU, 2018). In terms of the type and spatial coverage of major land use and land cover classes, woody vegetation (forest, woodland, and shrub and bush lands) covers about 57 % of the country in accordance with the national 2016 map (WLRC-AAU, 2018). This is followed by cultivated land (20 %) and grasslands (12 %). Barren lands are estimated to cover about 1/10 of the area of the country while other minor lands with ecological significance (i.e., wetlands, water bodies, and sub-afro-alpine and afro-alpine) cover about 1.2 % of the country's land mass.
2.2 Legacy soil profile data collation and preparation
The soil profile data generated over decades through various soil survey missions were kept in a variety of formats with limited accessibility. There has been no institution with a mandate to coordinate the generation, collation, harmonization, and sharing of soil profile data. This led to the formation of a group of individuals and institutions who were willing to exchange soil and agronomy data. Established in 2018, the group known as the Coalition of the Willing (CoW) was committed to addressing the challenges posed by the lack of soil and agronomy data access and sharing in the country (Tamene et al., 2021).
The CoW conducted a national soil and agronomy data ecosystem mapping which revealed that a plethora of legacy soil resource datasets exist across different institutions and individuals (Ali et al., 2020). The assessment also revealed that a sizable proportion of the data holders were willing to share the data in their custody, provided that some regulations were put in place to administer the data. The CoW developed and approved internal data-sharing guidelines (CoW, 2020), and facilitated data collation campaigns, which involved both formal and informal approaches to data holders.
Through a data collation campaign, soil profile data collected between the 1970s and 2021 were acquired from over 88 diverse sources (Ali et al., 2020; Tamene et al., 2021). Initially, 8000 profile data points were collated and subjected to improved modeling techniques to create a provisional WRB reference soil group map of Ethiopia. This was presented to various partners and data-holding institutions to demonstrate the power of data sharing. This created awareness and enabled us to mobilize and collate over 20 000 legacy soil profile data. These data were then added to the national data repository.
The data had varying levels of completeness in terms of soil field and environmental descriptions and laboratory analysis. These required a rigorous expert-based quality assessment and standardization before being compiled into a harmonized format. The expanded version of the Africa Soil Profile (AfSP) database (Leenaars et al., 2014) template was used for standardizing and harmonizing the data. Out of the collated soil profile data, 14 681 georeferenced data points were extracted based on completeness and cleanness for the purposes of modeling. The cleaned soil profile data set contained, at least, the reference soil group (RSG) nomenclature as outlined in the WRB legend. While the original soil profile records were set in different coordinate systems, all were projected into the adopted standard georeferencing system, namely, WGS84, decimal degrees in the QGIS (3.20.2) environment (QGIS Development Team, 2021). To verify their position, soil profile locations were plotted using a standard WGS84 coordinate system to verify that points matched the site description, geomorphological settings, and at the very least the source project boundary outline.
The accuracy of the data depends on the quality and reliability of the survey data themselves, which in turn requires expert knowledge and experience in soil description and classification (Leenaars et al., 2020a). In this study, data cleaning, validation, reclassification, and verification were carried out by a team of prominent national pedologists and soil surveyors, including those involved in the generation of some of the soil profile data themselves (Fig. 2).
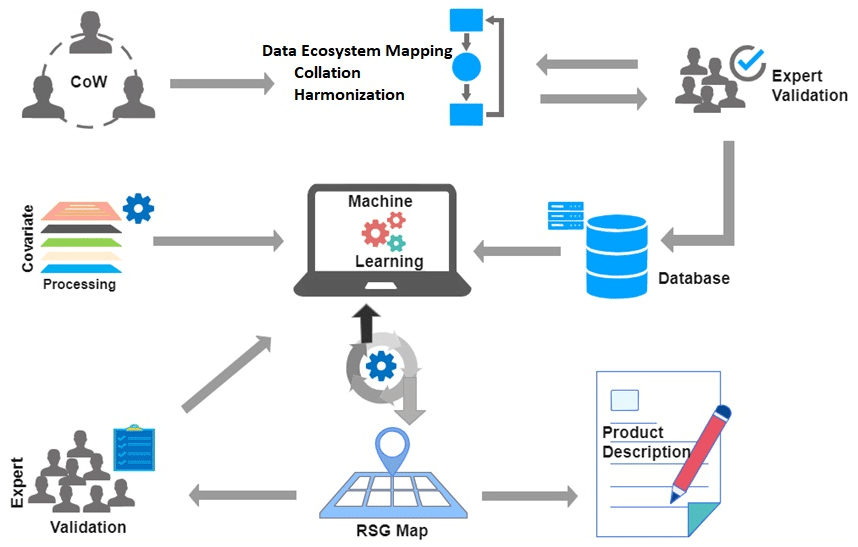
In addition, the Ministry of Agriculture (MoA) soil survey and mapping experts and other volunteers validated the legacy soil profile observations. This led to the reclassification of the soil types as deemed necessary. Such validation and reclassification involved re-examining the geomorphological setup of the soil profile locations using Google Earth as well as reviewing the site and soil descriptions and the corresponding laboratory data, and reviewing the proposed soil type. The harmonized datasets in the database were used as input soil profile data for modeling and mapping IUSS WRB reference soil groups.
2.3 Preparation and selection of environmental covariates
2.3.1 Covariate acquisition and preparation
In order to develop spatially continuous soil class and/or type maps, data on environmental covariates that represent directly or indirectly the soil-forming factors have to be integrated with soil profile data (Hengl and MacMillan, 2019). Environmental covariates are spatially explicit proxies of soil-forming factors based on the soil–environment relationship (McBratney et al., 2003; Shi et al., 2018). Acquisition and preparation of covariates represent a crucial step in digital soil mapping using machine-learning algorithms (McBratney et al., 2003). In this study, 68 potential candidate environmental variables representing soil-forming factors (climate, organisms, relief, parent material, and time) were derived from diverse remote sensing products and thematic maps (Hengl and MacMillan, 2019; McBratney et al., 2003).
Relief and topography-related covariates were derived from a 90 m Shuttle Radar Topography Mission (SRTM) digital elevation model (DEM) (Vågen, 2010). Climate-related variables including long-term mean, minimum, maximum, and standard deviation temperature as well as precipitation data for the period between 1983 and 2016 (Dinku et al., 2014) were acquired from Enhancing National Climate Services (ENACTS-NMA) initiatives with 4 km resolutions (Dinku et al., 2014). Moderate-resolution imaging spectroradiometer (MODIS) imagery raw bands and derived indices (Vågen, 2010) were downloaded from USGS EarthExplorer (https://earthexplorer.usgs.gov/, last access: 12 November 2021) to represent vegetation-related factors. National geological (Tefera et al., 1996) and land use and land cover (WLRC-AAU, 2018) thematic maps of Ethiopia were gathered to represent parent material and organisms, respectively.
Downscaling (disaggregating) or upscaling (aggregating) of rasters was also performed to match the target resolution. A 250 m spatial resolution was chosen to accommodate both the spatial resolution of the major covariate inputs and make it applicable for large-scale analysis. All layers were masked for buildings and water bodies by the national boundary of Ethiopia and a stacked layer was created using the raster package (R Core Team, 2020) to extract covariate values at the locations of soil profiles. One-hot encoding using the dummyVars function available in Caret package (Kuhn, 2008) was used to pre-process and convert categorical covariates into a binary vector. Each element of the binary vector represents the presence or absence of that category. One-hot encoding is beneficial because it enables machine-learning algorithms to interpret categorical variables as numerical features. The covariate pre-processing, visual inspection for inconsistencies, and resampling to a target grid of 250 m were conducted in QGIS [3.20.2] (QGIS Development Team, 2021), SAGA GIS [7.8.2] (Conrad et al., 2015) and R [version 4.05] (R Core Team, 2020) software packages. All input data were projected to a common Lambert azimuthal equal-area projection with the latitude of origin at 8.65 and center of meridian at 39.64, which is the center point for Ethiopia. This projection was selected since it is effective in minimizing area distortions over land. Each covariate was adjusted to have an identical spatial resolution, extent, and projection using two resampling methods. Continuous covariates were resampled using the bilinear spline method, whereas categorical covariates were resampled using the nearest neighbor method.
2.3.2 Covariate selection
Selecting an optimal set of covariates to effectively represent the soil–environment relationship is a key step in digital soil mapping (DSM) since improper selection of covariates will affect the quality of model outputs (Shi et al., 2018). In this study, near-zero variance assessment was conducted using the nearZeroVar function available in the R caret package (Kuhn, 2008) to identify and remove environmental variables that have little or no variance. In addition, preliminary random forest model training was performed to assess and identify covariates having high variable importance. After expert judgment, a total of 27 environmental variables (24 continuous and 3 categorical) were selected for modeling and predicting RSGs.
2.4 Modeling and mapping soil types or reference soil groups
2.4.1 Model tuning and quantitative evaluation
In digital soil mapping, machine-learning techniques have been extensively used to determine the relationship between soil types and environmental variables (McBratney et al., 2003). Many machine-learning models were developed in the past decades for digital soil mapping to spatially predict soil classes based on existing soil data and soil-forming environmental covariates (Heung et al., 2016). Random forest (RF), a tree-based ensemble method, is one of the most promising machine-learning techniques available for digital soil mapping (Breiman, 2001; Heung et al., 2016). RF has gained popularity due to its high overall accuracy and has been widely used in predictive soil mapping (Brungard et al., 2015; Hengl et al., 2018). Examples of the main strengths of the RF model are its ability to handle numerical and categorical data without any assumption of the probability distribution, and its robustness against nonlinearity and overfitting (Breiman, 2001; Svetnik et al., 2003). While building the RF model, data were split into training (80 %) and testing (20 %) components using random sampling for training the model and evaluating its performance, respectively (Kuhn, 2008). Hyper-parameter optimization and repeated cross-validation on the training dataset were performed for optimal model application using the ranger method of the Caret package. The three tuning parameters for ranger method are mtry, splitrule, and .min.node.size. Generally this function is used to tune the parameters in modeling in an automated fashion, as this will automatically check all the possible tuning parameters and return the optimized parameters on which the model gives the best accuracy. Model tuning was performed with a repeated 10-fold cross-validation procedure applying multiple combinations of hyper-parameters for the ranger method. This is a fast implementation of RF particularly suited for high-dimensional data (Wright and Ziegler, 2017). Then the number of covariates used for the splits (mtry), splitting rules (splitrule), and minimum node size (min.node.size) were optimized. The parameter ntree was adjusted to 1000 in the model, and mtry values (10, 15, 20), min.node.size values (5, 10, 15), and splitrule values (“variance”, “extratrees”, and “maxstat”) were fed for the optimization procedure. The accuracy of the testing dataset was related to the model performance for the new dataset, indicating the capacity of the model to predict at the unsampled location. A confusion matrix was also used to calculate a cross-tabulation of observed and predicted classes with associated statistics, i.e., producer's accuracy and user's accuracy.
2.4.2 Software and computational framework
In this study, various open-source software packages that provide a comprehensive set of tools and diverse capabilities were used for data preparation, analysis, and visualization. Data pre-processing and preparation were performed using QGIS (QGIS Development Team, 2021) and SAGA GIS (Conrad et al., 2015). For statistical analysis and machine-learning modeling, R (R Core Team, 2020) and relevant libraries were installed on a Windows server, 2016 standard with 250 GB of working memory, to handle the challenges associated with large-scale data processing and analysis.
2.4.3 Expert evaluation of spatial patterns of the beta-version soil map
Visual inspection of the DSM output over the terrain was used to identify abnormalities and assess how effectively it depicts landscape components (Rossiter et al., 2022). For this, we employed an expert-based qualitative assessment of the model output. This technique was used to complement model-based accuracy assessment and confirm agreement soil specialists or pedologists checking the map based on purposely selected district-level geographic windows across Ethiopia, representing different agro-ecological zones known to have diverse soil occurrences, and that were familiar to the panel of experts. Accordingly, an expert validation workshop was conducted using the first version of the reference soil groups (RSGs) map. About 45 multi-disciplinary scientists including soil surveyors, pedologists, geologists, and geomorphologists were drawn from national and international research, development, and higher-learning institutions to review the draft RSG map in plenary discussions. This was followed by breakout sessions where groups of experts evaluated the map based on their experience and knowledge of soil–landscape relations of the country and examined geographic windows.
Most importantly, disagreements regarding RSG occurrence and patterns of the modeling outputs across topo-sequences and contrasting soil-forming factor sequences were identified and discussed. Further, inferences on parts of the DSM framework that require improvement were recommended. After finalizing the evaluation at the group-level assessment, each group presented the results in the plenary followed by a discussion to get feedback from other participants. Following the plenary discussions, the participants created a group of six senior pedologists to work on the recommendations including changing the quality mask layer, validating the additional data obtained during the event, and assessing the re-modeling outputs.
After the second model was re-run, the group of senior pedologists together with geospatial experts re-evaluated the output using the selected districts based on the feedback from the first review, which was mainly on areas where there were “minor” and “major” concerns. Consequently, some improvements were made, e.g., in the areas where Vertisols, Fluvisols, and Leptosols were overestimated. Further, underestimated RSGs (Alisols, Solonetz, Planosols, Acrisols, Lixisols, Phaeozems, and Gleysols) showed a slight increase in area coverage and pattern improvements. However, the total area of Leptosols and Cambisols increased from the first run due to the partial exclusion of the mask layer used in the first round of modeling. The mask layer used in the first run was criticized for quality issues as it excluded significant soil areas and due to its weakness in capturing non-soil areas such as rock outcrops, salt flats, swamps, and sand dunes. Nevertheless, the spatial patterns of these soils occurring across previously considered “non-soil areas” were examined by the panel of experts. In parallel, geospatial and soil experts checked the raster map of the RSGs in the GIS environment to ensure areas with “no concern” before re-running the model are kept the same or changes are accepted by the panel of experts. The map from the second run is presented in this paper as EthioSoilGrids version 1.0 product.
3.1 Soil profile datasets
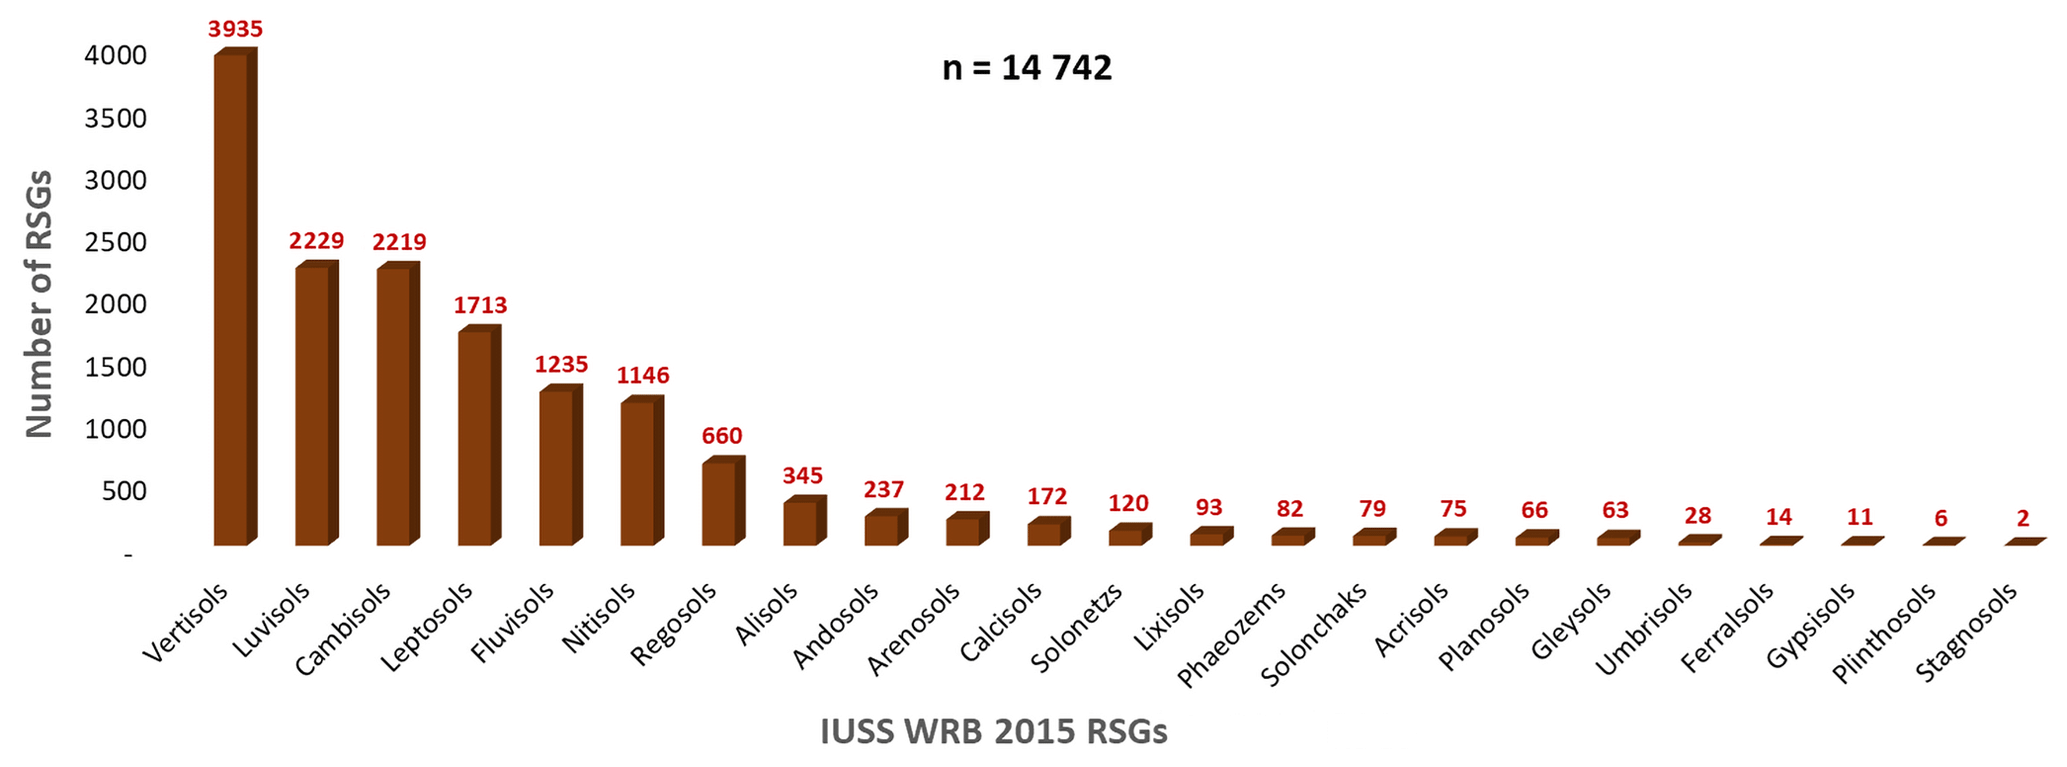
Using the IUSS WRB (2015), the preliminary identified 14 742 georeferenced legacy soil profiles were classified and/or reclassified into 23 RSGs. Nearly 90 % of the soil profile points represented Vertisols, followed by Luvisols, Cambisols, Leptosols, Fluvisols, and Nitisols, which were found to be the dominant soil types in Ethiopia (Fig. 3). The remaining 10 % represented the Regosols, Alisols, Andosols, Arenosols, Calcisols, Solonetz, Lixisols, Phaeozems, Solonchaks, Acrisols, Planosols, Gleysols, Umbrisols, Ferralsols, Gypsisols, Plinthosols, and Stagnosols.
According to this study, about 72 % of the IUSS WRB (2015) RSGs were confirmed to occur in Ethiopia. This reconfirms the characterization of Ethiopia as a land of soil diversity being endowed with a diverse range of soil types (Elias, 2016; Mishra et al., 2004). One of the limitations with legacy soil data in categorical mapping is the imbalanced soil samples, in that all classes are not equally represented (Wadoux et al., 2020). For this study, soil profiles with fewer than 30 observations were objectively excluded from the model after examining the accuracy and spatial distribution of each RSG. Five RSGs (Umbrisols, Ferralsols, Gypsisols, Plinthosols, and Stagnosols) were excluded from the model and the EthioSoilGrids version 1.0 map.
After excluding the built-up and water surface areas, the average soil profile density was 13.1 per 1000 km2 (Fig. 4), but the actual density varied across the different parts of the country. The variation tends to follow river basins, sub-basins, and agricultural land-use type-based studies from which most of the legacy data were pulled. For instance, in 30 intervention districts of the Capacity Building for Scaling up of Evidence-Based Best Practices in Agricultural Production in Ethiopia (CASCAPE) project, the average profile density was about 87 profiles per 1000 km2 for a total area of about 26 830 km2 (Leenaars et al., 2020a). Similarly, semi-detailed soil mapping missions in 15 districts conducted through the Bilateral Ethiopia–Netherlands Effort for Food, Income and Trade (BENEFIT)-REALISE project generated about 217 observations per 1000 km2 (Leenaars et al., 2020b).
A soil type and depth map compilation and updating mission at a 1 : 250 000 scale by the Water Land Resource Center (WLRC) of Addis Ababa University collated and used about 3949 legacy soil profiles for the entire country (Ali et al., 2020), which is approximately 3.5 profiles per 1000 km2. Although the distribution is not even and the eastern lowlands are sparsely represented, the number of data used in this study is 8.5 times higher than the 1712 legacy soil profiles data currently existing in the Africa soil profile database (Batjes et al., 2020; Leenaars et al., 2014).
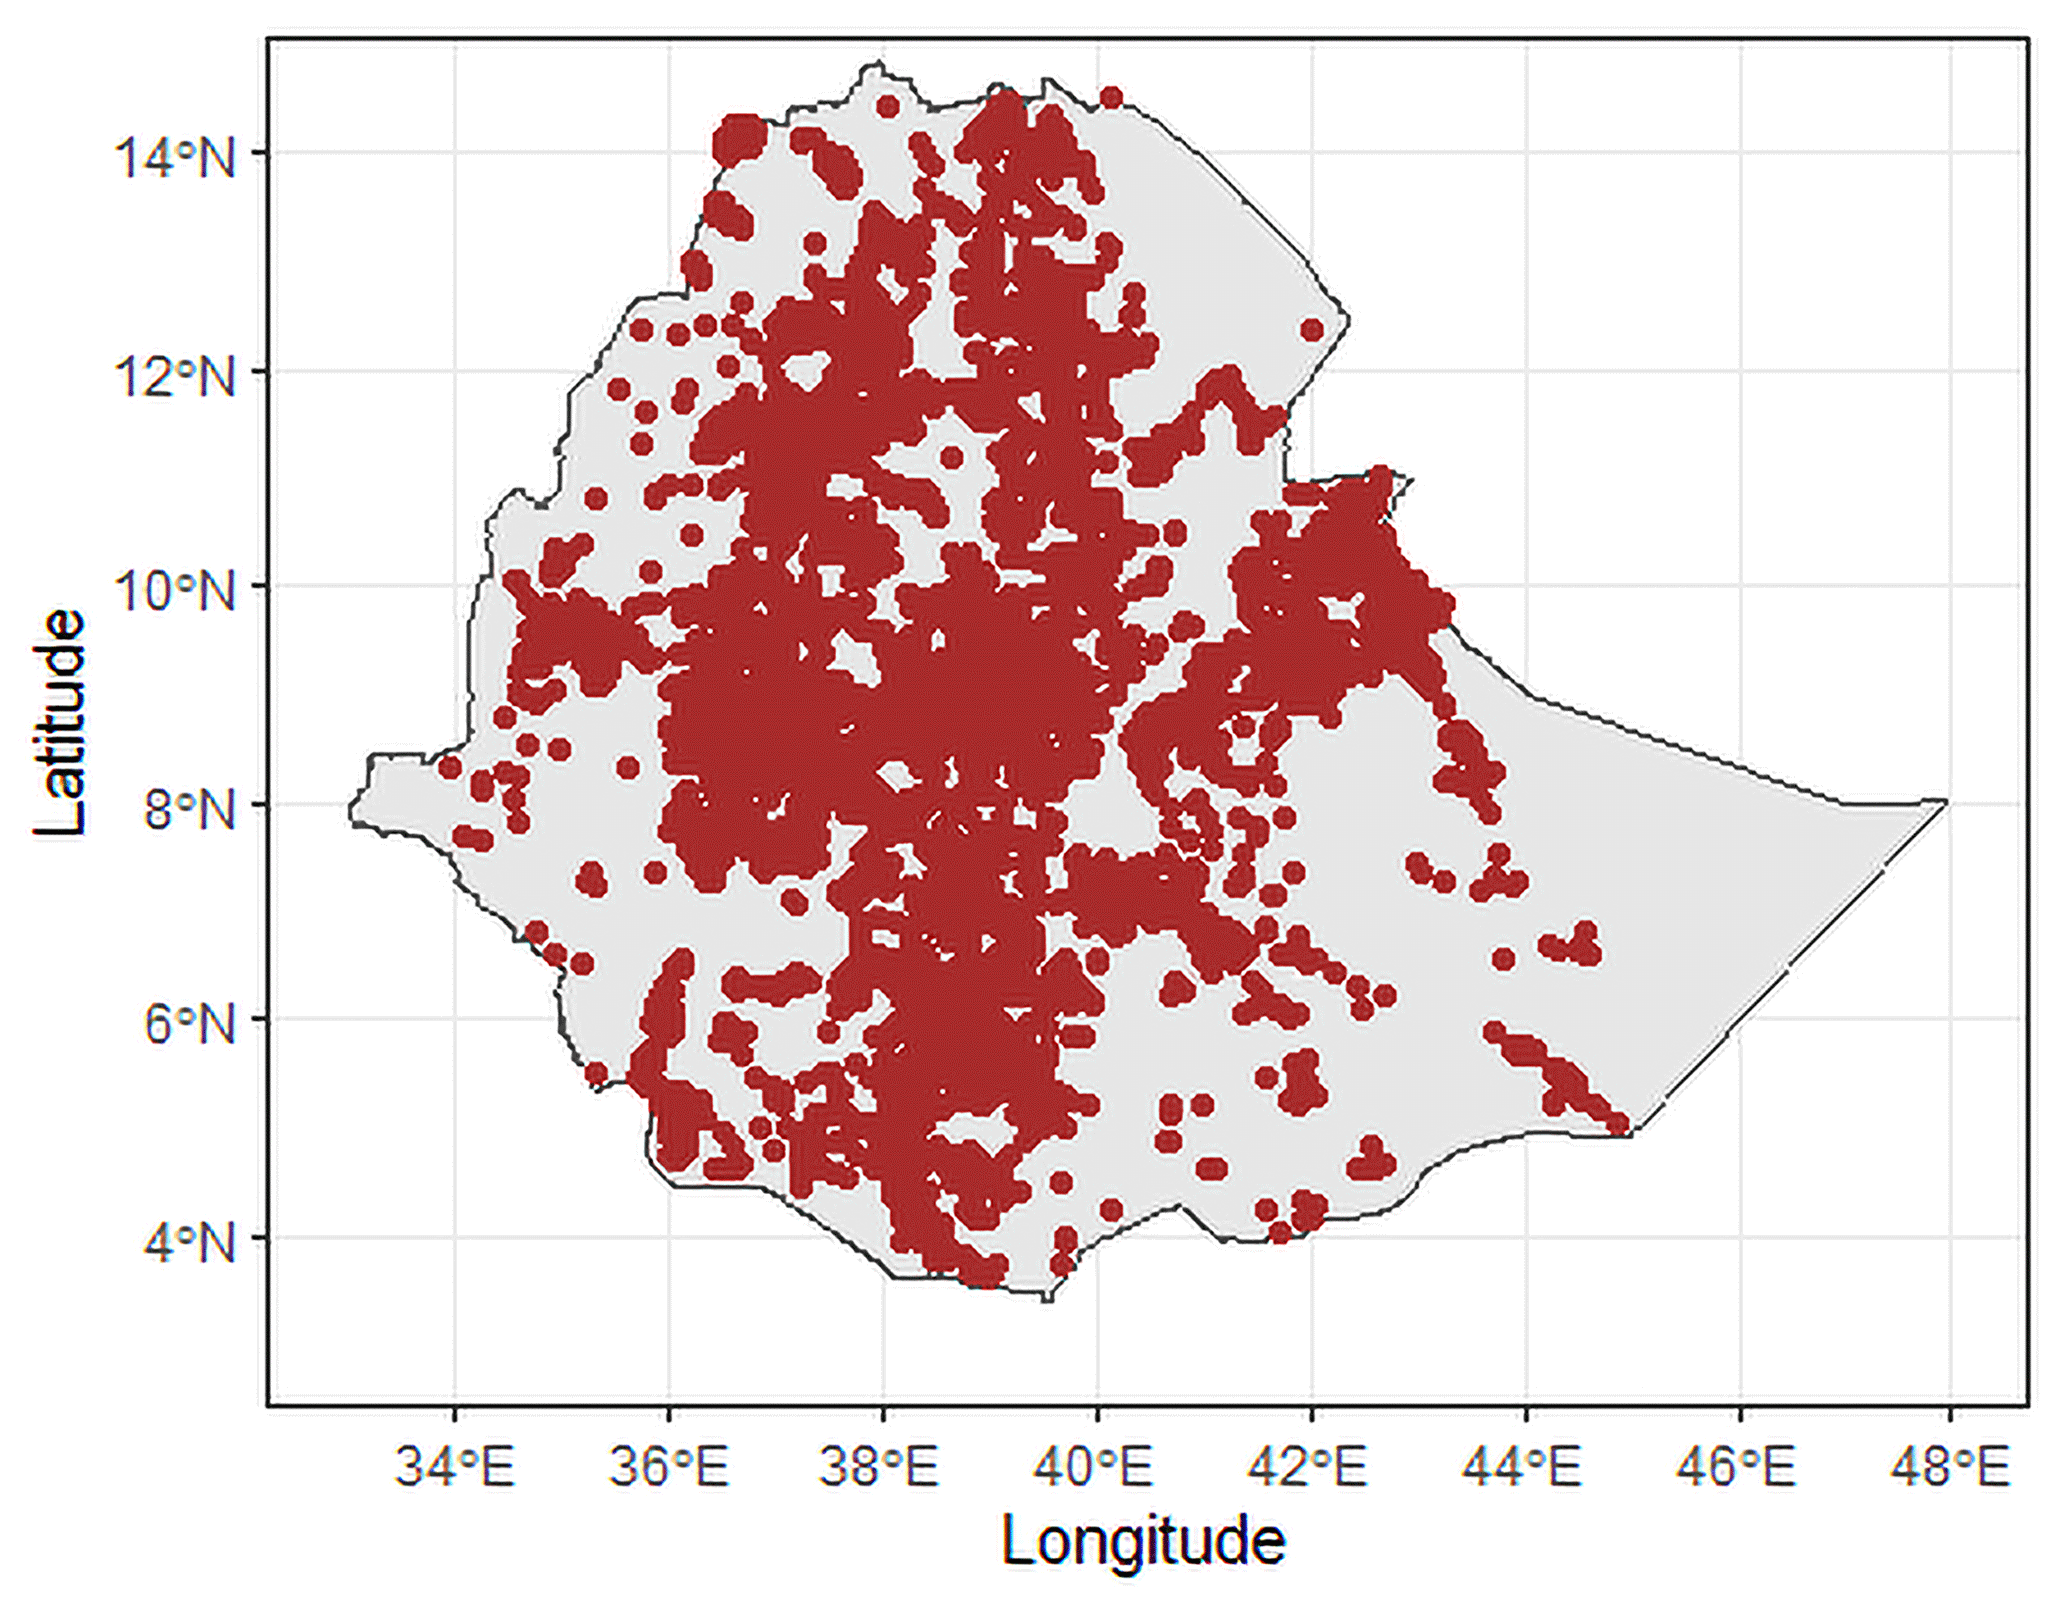
Figure 4Spatial distribution of collated legacy soil profile data.
The distribution of the soil profiles across the 32 agro-ecological zones (AEZ) of Ethiopia revealed that all, except two – tepid per-humid mid-highland (0.13 % landmass) and very cold sub-humid sub-afro-alpine to afro-alpine (0.03 % landmass) – were represented by soil profile observations. Furthermore, about 95 % of the profile observations represented 91 % of the AEZ aerial coverage (Appendix A). The distribution of legacy soil profiles varied across AEZs. In general, the top-ranked lowland AEZs with roughly 56 % area coverage were represented by 23 % of the total profile observations, whereas top-ranked highland AEZs with 20 % area coverage received 47 % of profile observations. For instance, warm desert, warm moist, hot arid, and warm sub-moist lowlands with area coverage of around 20 %, 15 %, 11 %, and 10 %, were represented roughly by 3 %, 11 %, 2 %, and 7 % of the total profiles, respectively. Tepid moist mid-highlands (8 % area coverage), tepid sub-humid mid-highlands (7 % area coverage), and tepid sub-moist mid-highlands (5 % area coverage) each were represented by 20 %, 15 %, and 12 % of the profiles, respectively.
3.2 Modeling and mapping
3.2.1 Variable importance
The RSG spatial pattern is primarily influenced by long-term average surface reflectance, flow-based DEM indices, and precipitation. Figure 5 shows variables of importance for determining RSG spatial prediction. The top-ranked variables were (i) long-term MODIS near-infrared (NIR) reflectance, (ii) multiresolution index of valley bottom flatness, (iii) long-term mean day–land surface temperature, (iv) long-term mean soil moisture, (v) standard deviation of long-term precipitation, (vi) long-term mean precipitation, and (vii) topographic wetness index.
MODIS long-term mean spectral signatures showed high relative importance. According to Hengl et al. (2017), accounting for seasonal vegetation fluctuation and inter-annual variations in surface reflectance, long-term temporal signatures of the soil surface, derived as monthly averages from long-term MODIS imagery, were more effective. Furthermore, Hengl and MacMillan (2019) explained that long-term average seasonal signatures of surface reflectance provide a better indication of soil characteristics compared with only a single snapshot of surface reflectance.
The multi-resolution valley bottom flatness index, a DEM-derived topography index, is the second top-ranked covariate driving soil variability across Ethiopia. This hydrological/soil removal and accumulation or deposition index is used to distinguish valley floor and ridgetop landscape positions (Soil Science Division Staff, 2017) greatly responsible for multiple soil-forming processes to operate over a particular landscape, resulting in a wide range of soil development. The influence of topography on spatial soil variation is manifested in every landscape of Ethiopia (Belay, 1997; Mesfin, 1998; Nyssen et al., 2019; Zewdie, 2013).
Long-term daily mean land surface temperature, mean soil moisture, rainfall standard deviation, and mean annual rainfall were among the top-ranked covariates for predicting the spatial variation of RSGs across the country. In Ethiopia, different soil genesis studies revealed that climate has a significant influence on soil development and properties and is, therefore, responsible for the existence of widely varying soils in the country (Abayneh, 2005; Abayneh et al., 2006; Fikru, 1988, 1980; Zewdie, 2013).
Among the most important covariates for predicting RSGs in the Ethiopian highlands are monthly average soil moisture for January (ranked third), long-term average soil moisture (ranked fourth), and monthly average soil moisture for August (ranked fifth) (Leenaars et al., 2020a). In the current study, soil moisture was among the 10 top-ranked covariates in modeling and explaining long-distance soil type variability across the country.
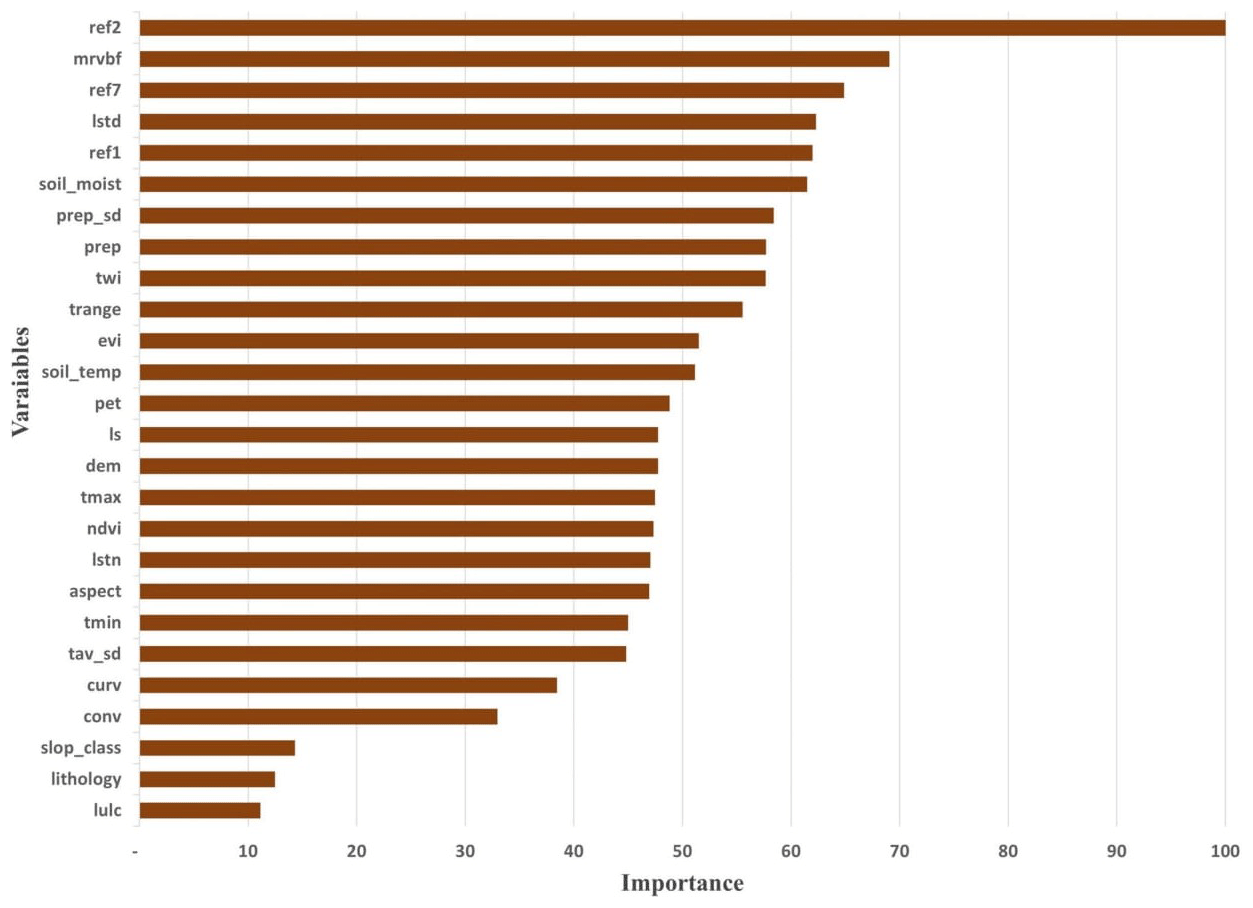
Figure 5Random forest covariate relative importance for modeling RSGs. Note: prep = precipitation; prep_sd = standard deviation of precipitation; tmax = maximum temperature; tmin = minimum temperature; trange = temperature range; tav_sd = standard deviation of average temperature; pet = potential evapotranspiration; lstd = land surface temperature–day; lstn = land surface temperature–night; soil_moist = soil moisture; soil_temp = soil temperature; DEM = digital elevation model (elevation); twi = topographic wetness index; aspect = topographic aspect; curv = topographic curvature; conv = topographic convergence index; ls = slope length and steepness factor (ls_factor); morph = terrain morphometry; mrvbf = multiresolution index of valley bottom flatness; slope = slope class (%); ndvi = normalized difference vegetation index (NDVI); evi = enhanced vegetation index (EVI); lulc = land use/land cover; lithology = geology; ref1 = red band; ref2 = near-infrared; ref7 = mid-infrared.
In this study, lithology showed a relatively low influence on soil variability that may be due to the use of a coarse-scale and less detailed lithology map, which may not sufficiently capture the spatial variability of the parent materials.
3.2.2 Model performance
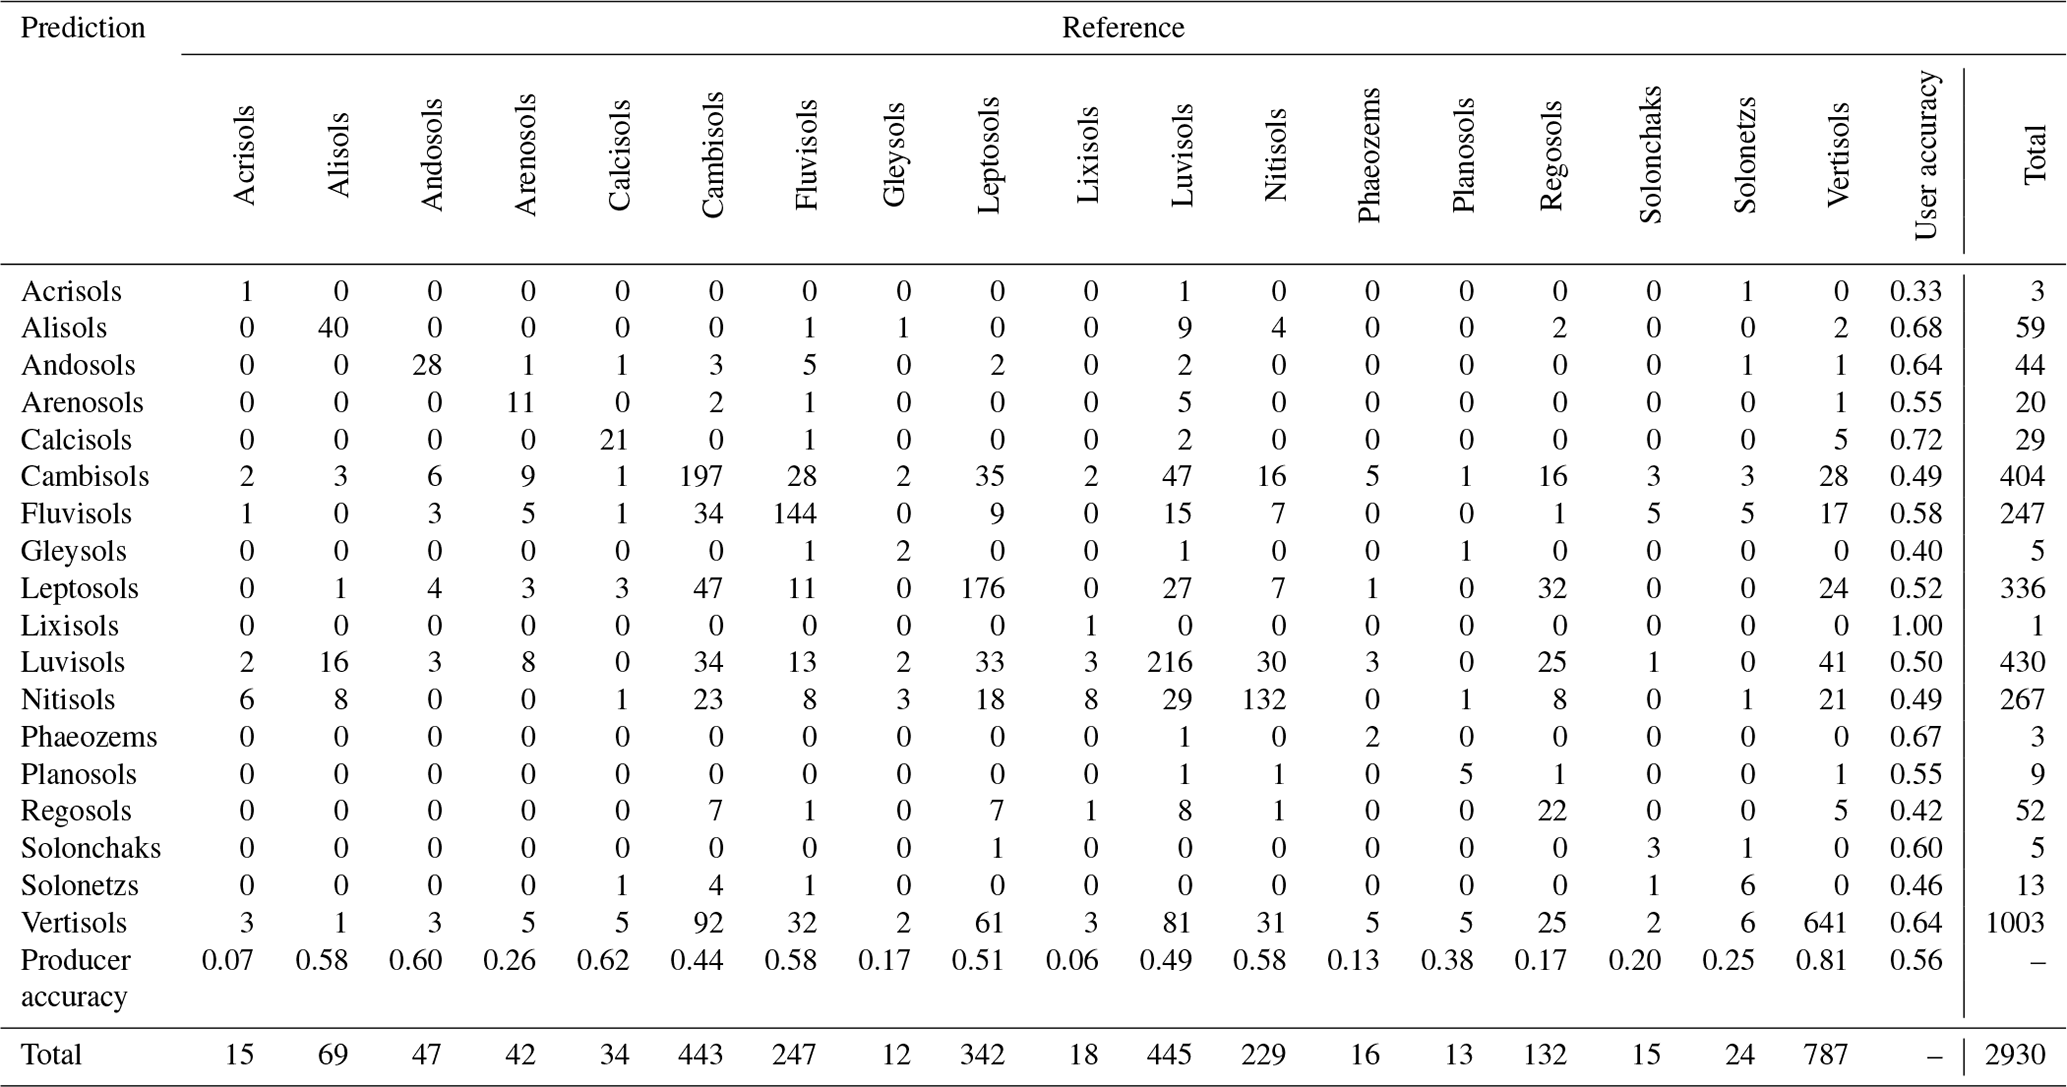
The parameter optimization process resulted in mtry = 20, split rule = extra trees and minimum node size = 5. The overall accuracy of the model was 56.24 % which ranged between 54.43 % and 58.1 % with a 95 % confidence interval. The kappa values based on the internal cross-validation and testing dataset showed that the overall model performance produced using 10-fold cross-validation with the repeated fitting was 48 %. Considering similar area-based digital soil class mapping efforts, the overall accuracy was in line with the accuracies that were typically reported for soil class maps developed with RF models (Leenaars et al., 2020a) and statistical methods (Heung et al., 2016). Table 1 shows the confusion matrix at validation/testing points, i.e., 20 % of the observation. Further, the matrix indicates the producer's accuracy (class representation of observed versus predicted) and user's accuracy were not similar for all RSGs. The map purity is in the order of Lixisols, Calcisols, Alisols, Phaeozems, Vertisols, Andosols, Solonchaks, Fluvisols, Arenosols, Leptosols, Luvisols, Nitisols, and Cambisols. However, Vertisols, Calcisols, and Andosols are the observed classes that are best represented by the map followed by Fluvisols, Alisols, Nitisols, Leptosols, Luvisols, and Cambisols.
Global soil grids at 250 m resolution used machine-learning algorithms to map the global WRB RSGs with map purity and weighted kappa of 28 % and 42 %, respectively (Hengl et al., 2017). The SoilGrids 250 m WRB soil groups/classes prediction output–spatial soil patterns were not evaluated based on expert knowledge while in this study we did an extensive back-and-forth qualitative assessment by a panel of pedologists. The quantitative accuracy in the present study (about 56 %) coupled with an expert-based qualitative evaluation of the predicted maps indicated the development and achievement of a substantially enhanced national product for users of spatial soil resource information. This finding is a step forward and acceptable considering that SoilGrids maps are not expected to be as accurate as locally produced maps and models that use many more local-point data and finer local variables (Mulder et al., 2016). Further, the data and findings in this study can help improve the soil maps of Africa as they partially address the concern by Hengl et al. (2017), who recognized that WRB RSGs modeling in the global SoilGrids 250 m is critically uncertain for parts of Africa. This is mainly attributed to limited access to more local point data by regional and global modeling initiatives, unlike the present study which accessed a large number of legacy soil profile datasets.
Table 1Confusion matrix of random forest RSG prediction (at validation/testing observations).
3.2.3 Modeling and mapping: EthioSoilGrids version 1.0
The study identified 18 RSGs in Ethiopia, mapped at 250 m resolution (Fig. 6). The model prediction showed that seven soil reference groups including Cambisols, Leptosols, Vertisols, Fluvisols, Nitisols, Luvisols, and Calcisols covered nearly 98 % of the total land area of the country (Fig. 7). Five soil reference groups (Solonchaks, Arenosols, Regosols, Andosols, and Alisols) were estimated to cover about 2 % of the land area, while trace coverages of Solonetz, Planosols, Acrisols, Lixisols, Phaeozems, and Gleysols were also found in some pocket areas.
In terms of spatial distribution, Nitisols and Luvisols dominated the northwestern and southwestern highlands while the southeastern lowlands were dominantly covered by Cambisols, Calcisols, and Fluvisols with some Solonchaks. The Vertisols extensively cover the north and southwestern lowlands along with the Ethiopia–Sudan border areas and central highland plateaus. The probability of occurrence of each RSG was mapped (Appendix C) in each modeling spatial window (i.e., the cell size of 250 m × 250 m). The dominant RSGs were aggregated based on the most probable RSGs in each spatial modeling window. There was high correspondence between the seven top-ranked prediction probabilities and observed soil types as confirmed visually by overlaying observed classes and prediction probabilities.
The overall occurrence and the relative position of each of the RSGs along the topo-sequence and its association with other RSGs agree with previous works (Abayneh et al., 2006; Ali et al., 2010; Abdenna et al., 2018; Asmamaw and Mohammed, 2012; Belay, 2000, 1998, 1997, 1996; Driessen et al., 2001; Elias, 2016; FAO, 1984a; Fikre, 2003; Mitiku, 1987; Mohammed and Belay, 2008; Mohammed and Solomon, 2012; Mulugeta et al., 2021; Nyssen et al., 2019; Sheleme, 2017; Shimeles et al., 2007; Tolossa, 2015; Zewdie, 2013). However, in some cases, the position of the RSGs along the topo-sequence and the association with other RSGs require further investigation. The disparities observed might be attributed to the positional accuracy of legacy point observations, the modeling approach, and most importantly the level of detail and scale/resolution of the environmental variables used in this study. We used the currently available coarse-resolution national geological map and hence soil parent material might be inadequately represented in the model, which probably resulted in irregular RSG sequences. For instance, the main driving factors to establish and explain the soil-landscape variability in the May-Leiba catchment of northern Ethiopia were geology (soil parent material) and different mass movements (Van de Wauw et al., 2008). These factors led to Cambisols–Vertisols catenas on basalt and Regosols–Cambisols–Vertisols catenas on limestone formations. Similar studies identified parent material strongly determines the soil type (e.g., Vertisol, Luvisol, Cambisol) (Nyssen et al., 2019). In general, in areas where there is complex soil diversity and distribution of soils, one of the most important parameters is to identify parent material including effective techniques to capture and delineate mass movement bodies, and human-induced soil erosion and deposition areas (Leenaars et al., 2020a; Nyssen et al., 2019; Van de Wauw et al., 2008).
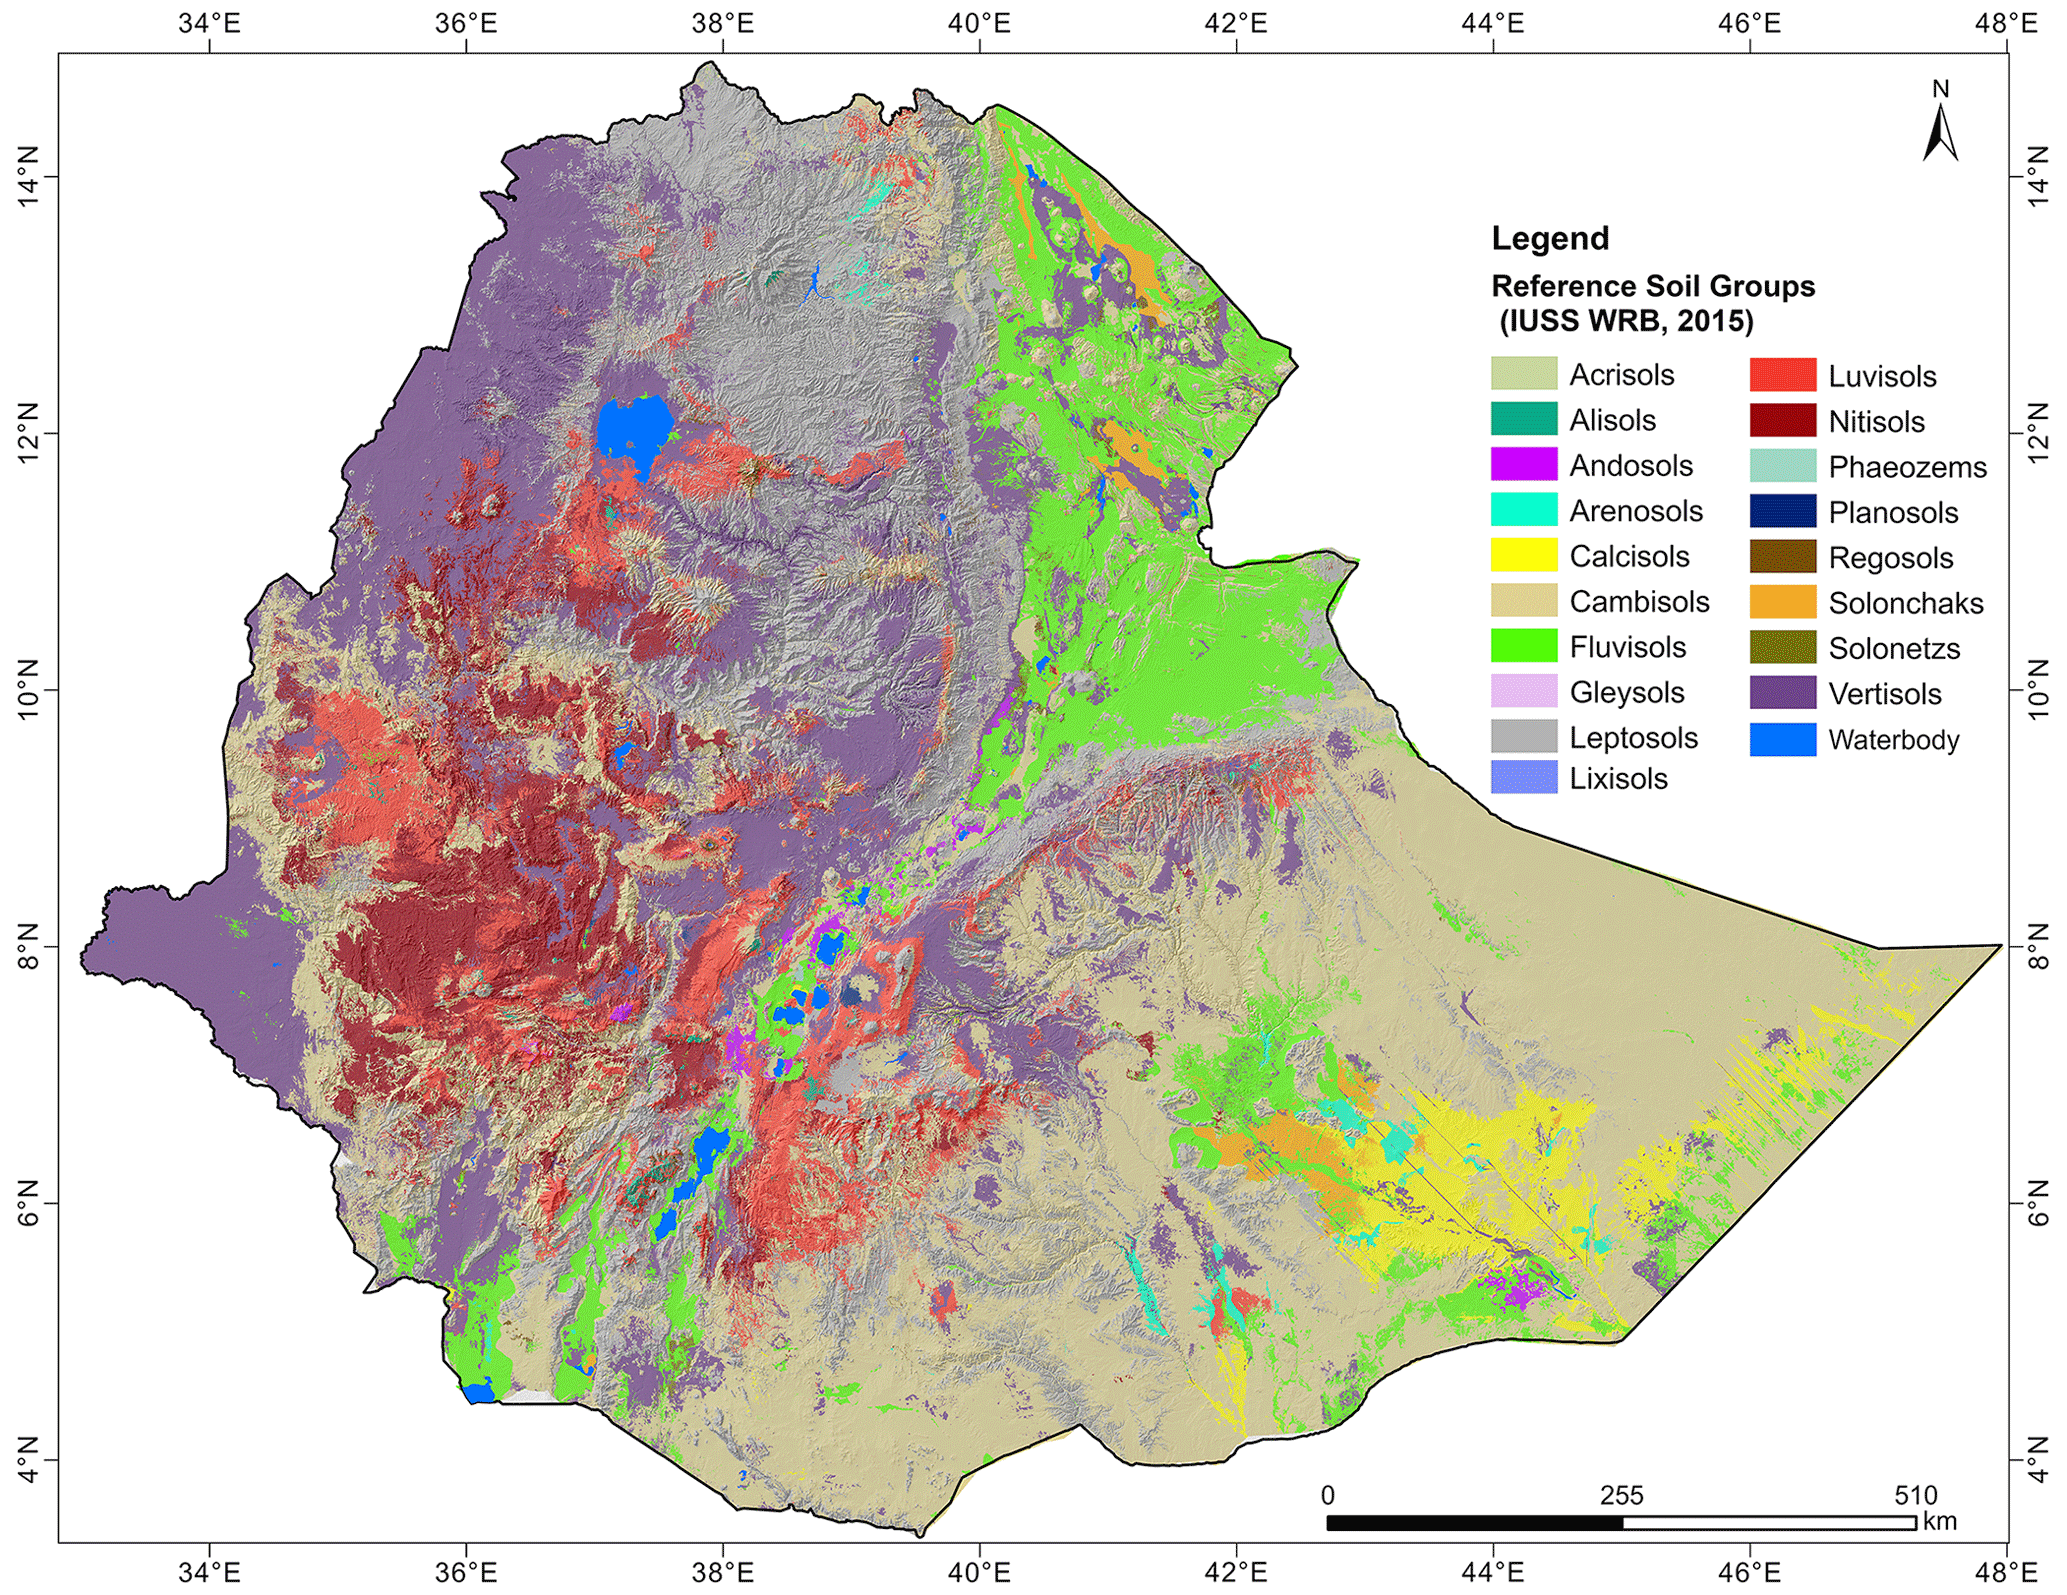
Figure 6Major reference soil groups of Ethiopia (EthioSoilGrid V1.0).
Considering the third position of Cambisols in the order of frequency of occurrence of RSGs per point observations (following Vertisols and Luvisols), these soils seem to be over-represented on the map (ranked first) apparently at the expense of Vertisols and Luvisols, and to some extent in places of Leptosols and other RSGs. This might be attributed to the fact that Cambisols create a geographical continuation with Vertisols and/or Luvisols at the lower slopes and Leptosols/Regosols at the higher slopes, suggesting the presence of some bordering soil qualities in respective transitional zones (Ali et al., 2010; Asmamaw and Mohammed, 2012; Sheleme, 2017; Zewdie, 2013).
The proportion of area mapped as Cambisols (34 %) revealed new insights compared with the information from the most cited spatial soil maps: Cambisols ranked second (21 %), second (16 %), fourth (9 %), and fourth (8 %) as reported by Berhanu (1980), FAO (1984b, 1998), and SoilGrids – Hengl et al. (2017), respectively. This might be due to (i) the number and distribution of profile observations, which is more extensive than the previous ones; (ii) the type and level of details of covariates considered; (iii) variations and rearrangements in the keys for classification of the RSGs among soil classification versions used in previous studies and misclassification/confusion of Vertisols with Vertic Cambisols, as legacy soil profile data come from diverse sources.
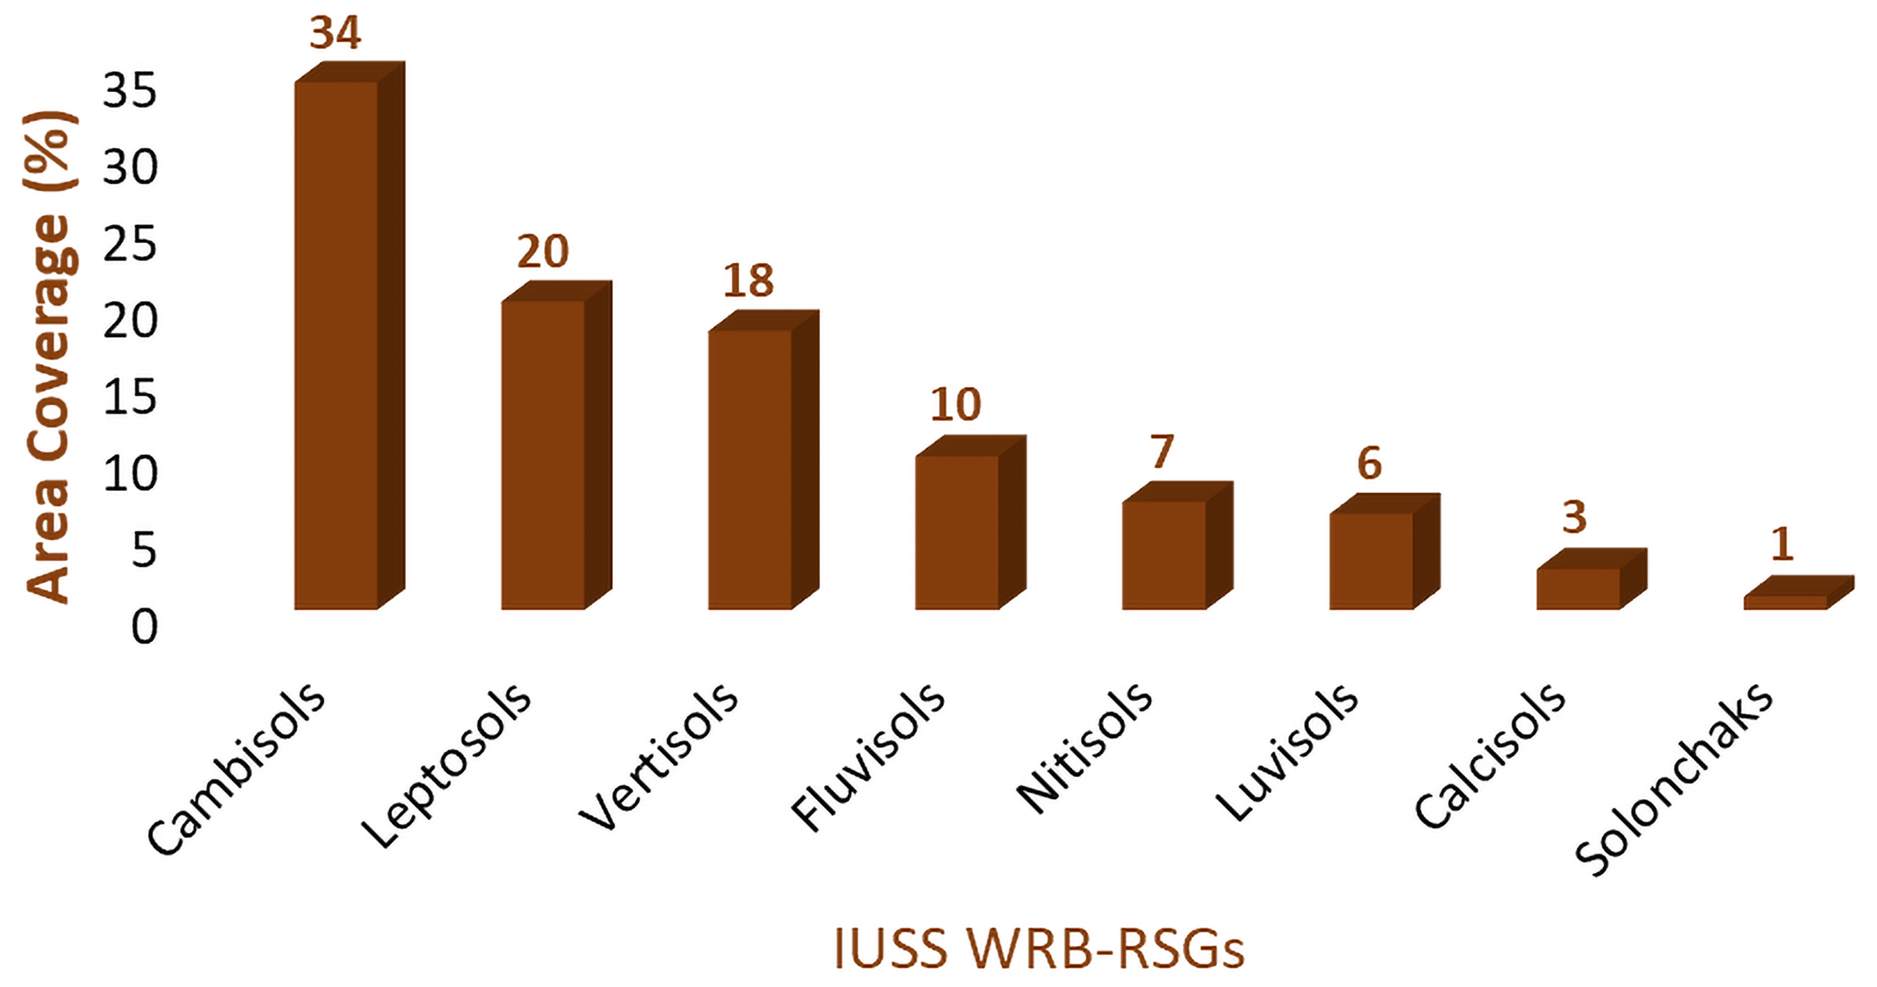
Figure 7The area coverage (in %) for the major WRB RSGs. Note: the remaining 10 RSGs-Arenosols (0.44 %), Regosols (0.35 %), Andosols (0.31 %), Alisols (0.16 %), Solonetzs (0.04 %), Planosols (0.04 %), Acrisols (0.02 %), Lixisols (0.02 %), Phaeozems (0.02 %), and Gleysols (0.01 %) were not plotted because of their relatively small area coverage.
3.3 Expert validation of the soil map
Expert knowledge of soil–landscape relations and soil distribution remains important for evaluating the predictive soil mapping results and assessing whether the predicted spatial patterns make sense from a pedological viewpoint (Hengl et al., 2017; Poggio et al., 2021; Rossiter et al., 2022). An important step in qualitative model evaluation is, therefore, expert assessment, whereby professionals with broad experience in soil survey and mapping can evaluate and improve the quality of the soil resource map. This can highlight areas of agreement or concern across the landscape (Rossiter et al., 2022). The expert validation workshop provided useful insights and tangible improvements to the development of the map. While the plenary discussion provided an overview of the approaches followed in developing the map, the group discussions helped to have an in-depth review of the selected polygons of the map assigned to them. Participants were split into five groups (with 8–10 members each) and chose up to 60 polygons representing areas with which at least one of the group members has sufficient information, including data sources. Overall, the groups checked a total of 126 polygons (Fig. 8), which were fairly evenly distributed across the country.
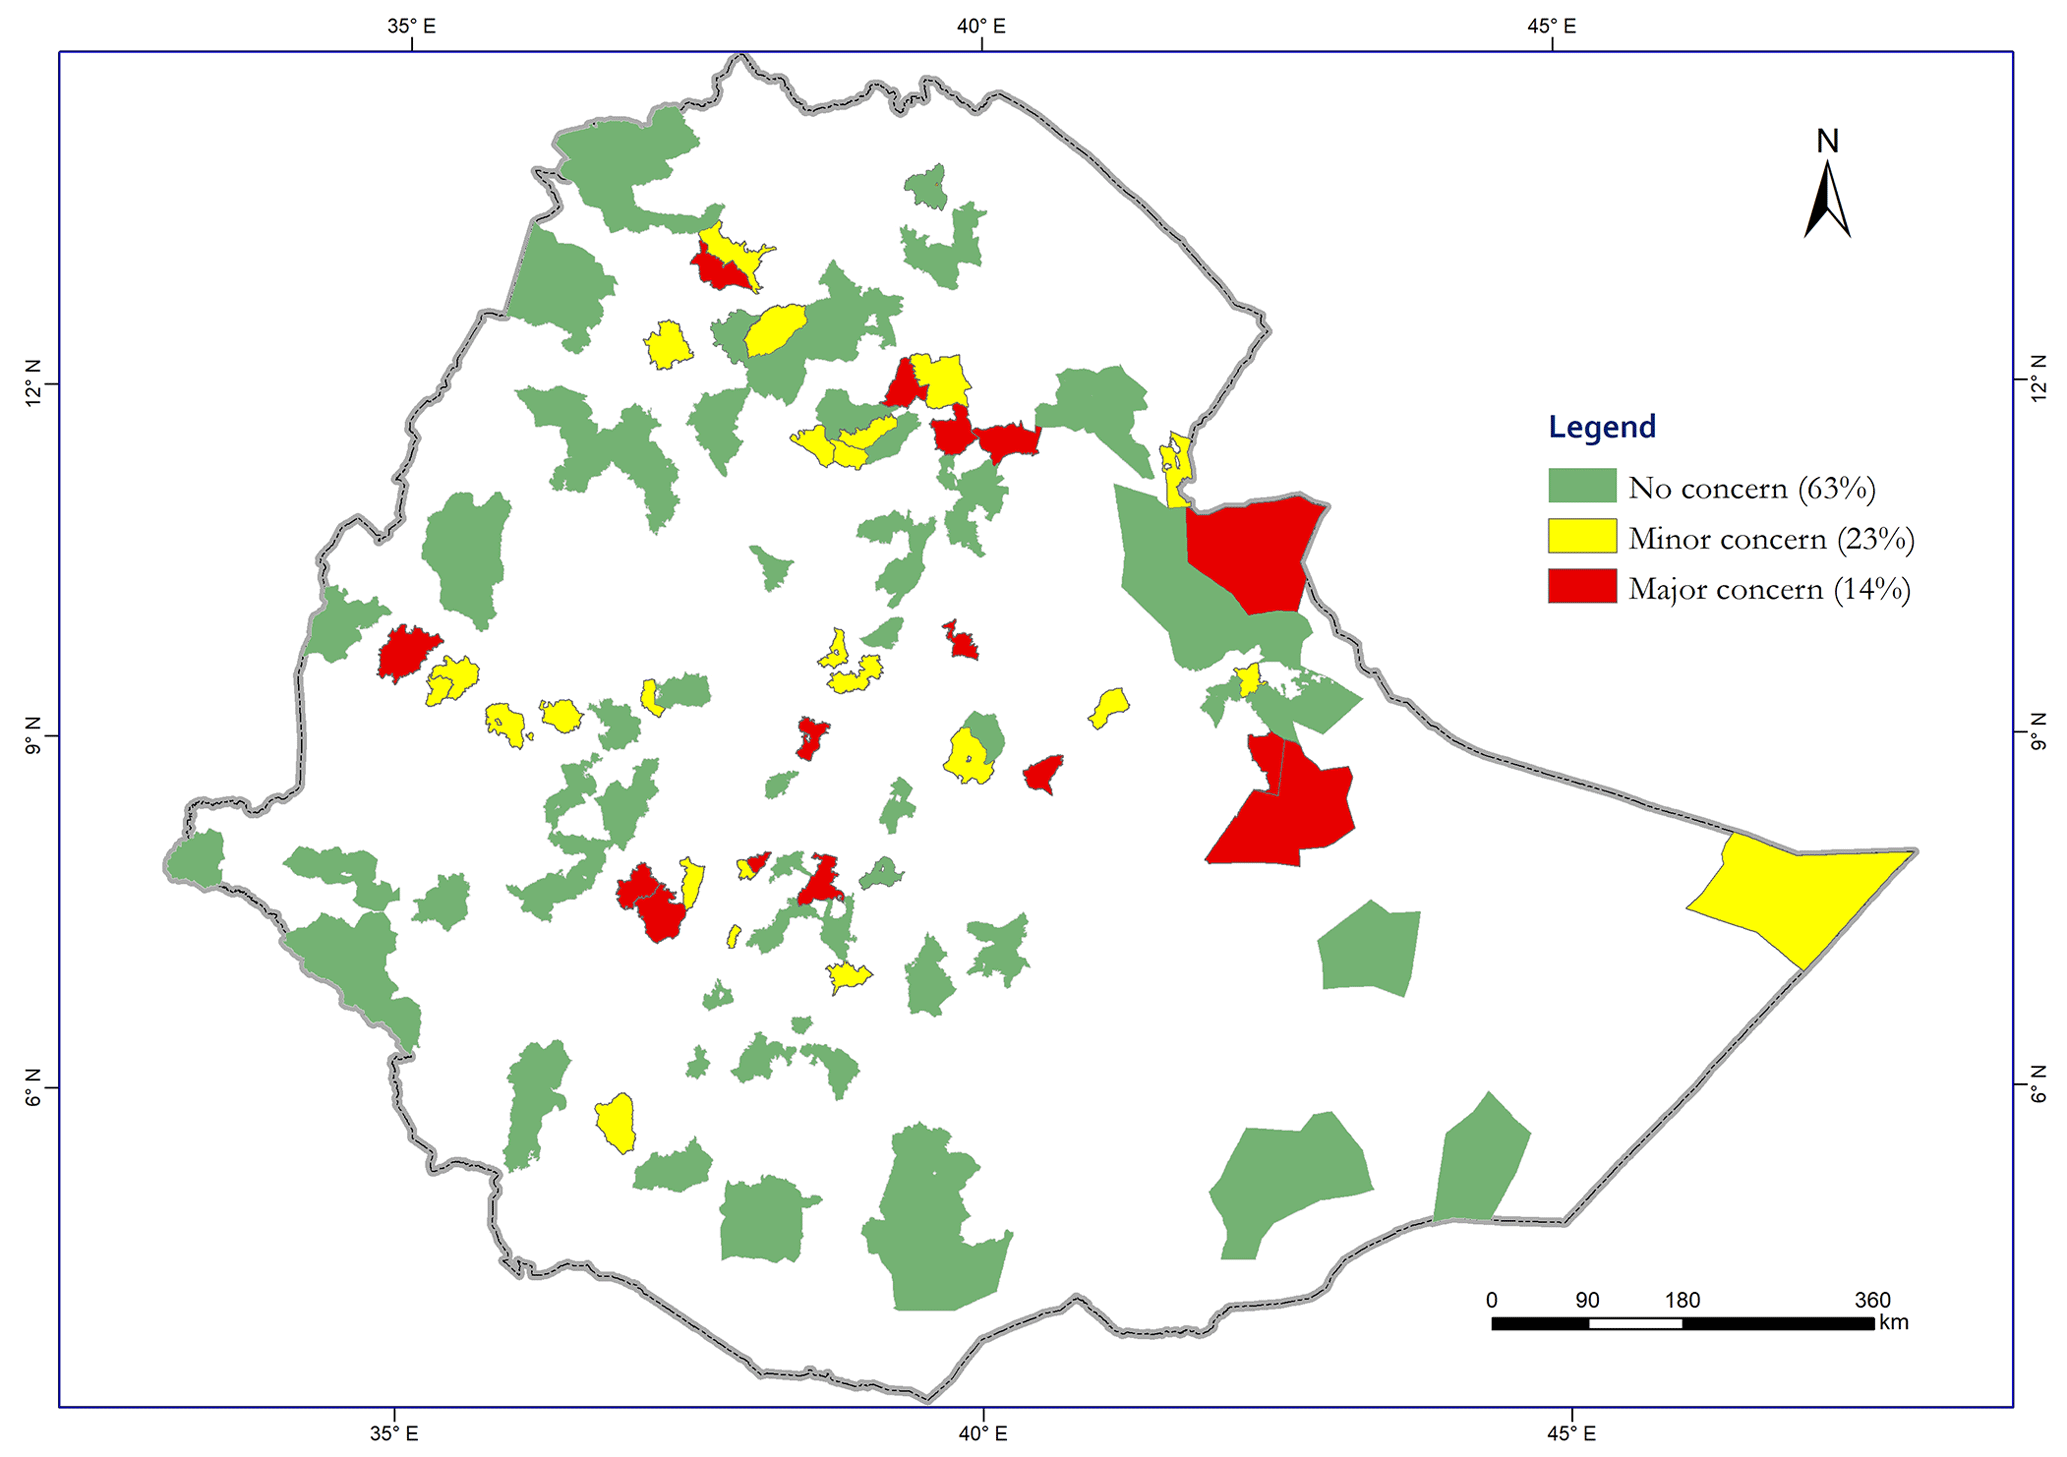
Figure 8The spatial distribution of districts validated by stakeholders and feedback categories according to the level of concerns raised.
The group members displayed the polygons one by one in a GIS environment and discussed the predicted dominant and associated soil RSGs and labeled them in one of three confirmation categories: (1) confirmed with “no concern”, (2) confirmed with “minor concern”, and (3) confirmed with “major concern”. Confirmation with “no concern” was made when all members of a group agreed on the types, the relative coverage, and the patterns of the predicted soils within the polygon. Confirmation with “minor concern” was made when all or some of the team members agreed on the predicted soil types within the polygons but did not agree on the order of abundance or the probability occurrence of one or two soils including observed spatial patterns. Confirmation with “major concern” was made when all members of the team did not agree on the predicted soil type, or when the presence of another soil type, other than the predicted types, was noted.
All three groups rated the accuracy of the map at 60+ %; of the 126 polygons, they expressed no concern for 63 %, minor concern for 23 %, and major concern for 14 % of the polygons. Furthermore, differences in the prevalence of RSGs and patterns of the modeling outputs across different soil-forming factor sequences, as well as inferences about which areas of the DSM framework still need work, were identified and elaborated on by the expert input and are presented in the subsequent sections.
3.4 Evaluation of results, limitations, and future direction
Up-to-date soil resource spatial information is critically missing at the required scale and extent in Ethiopia. As a result, resource management strategies miss their targets. Furthermore, the absence of such data at a required resolution and extent forced developers of decision support tools to pick and use the data they can access and afford. As a result, model outputs appear more site-specific or representation becomes homogeneous over the very heterogeneous landscapes that exist in reality. On the other hand, in large areas and complex landscapes such as Ethiopia, it is very difficult to address the demand for reasonably accurate and detailed soil-type maps using a conventional approach due to the costs involved and to the resources and time this requires. For instance, given the vastness of the country and the heterogeneous landscapes, a new conventional soil survey mission requires at least 170 000 profile point observations to map the entire terrestrial land mass of Ethiopia at a scale of 1 : 250 000 with at least one observation per square centimeter. Moreover, the soil profile data requirement definitely could have been much higher as we increase the scale of mapping and density of observations. In the present study, machine-learning techniques combined with expert input were implemented to produce a countrywide soil resource map of Ethiopia at reasonably higher accuracy and with less time and cost compared with conventional methods. In addition, rescue, compilations, and standardization of about 14 681 geo-referenced legacy soil profiles that can be included in the National Soil Information System (NSIS) of Ethiopia and the World Soil Information Center will support future national, regional, and global DSM efforts. The approach used here demonstrates the power of data and analytics to map the soil resources of Ethiopia, and the output is an exemplary use case for similar digital content development efforts in Ethiopia and beyond.
Moreover, in this study the quality-monitoring processes and methods were followed to filter dubious soil profiles as well as soil classification and harmonization protocols. Thereafter, the study followed a robust modeling framework and generated new insights into the relative area coverage of WRB RSGs of Ethiopia. In addition, the study provided coherent and up-to-date digital quantitative gridded spatial soil resource information to support the successful implementation of various digital agricultural solutions and decision support tools (DSTs).
The spatially explicit limitation of the present study is revealed by expert-based qualitative evaluation of spatial patterns across objectively selected geographic windows and prominent contrasting landscapes of Ethiopia. This qualitative assessment indicated areas of concern in terms of how well EthioSoilGrids version 1.0 represents soil geography across a mosaic of the country's landscapes. For instance, in the northeastern lowlands of Ethiopia, mainly along the “Denakil” depression, Fluvisols, Cambisols, and Vertisols were found on the map in areas where normally other soil types were expected to occur. In this area, the expected prediction and area coverage of Leptosols has probably been overshadowed by Fluvisols and Cambisols. Similarly, in some parts of western Ethiopia landscapes, the prediction of Vertisols overshadows other RSGs, which resulted in an underestimation of the area coverage of Fluvisols (along the “Akobo”, “Gilo”, and “Baro” rivers and their tributaries) and Alisols. Likewise, in the central parts of northwestern Ethiopia, the prediction of Nitisols was overshadowed by Vertisols and Luvisols, resulting in a likely underestimation of the Nitisols area coverage.
The relatively low model performance and some classification errors in some of the examined geographic windows (e.g., the Denakil depression, along Akobo, Baro, and Gilo rivers and the Somali region) are probably due to the paucity of samples from those areas (Fig. 4), the inadequacy of the dataset by RSGs, and over-representation of the dataset by some RSGs, such as Vertisols, Luvisols, and Cambisols. Balanced datasets are ideal to allow decision tree algorithms to produce better classification but for datasets with uneven class size, the generated classification model might be biased toward the majority class (Hounkpatin et al., 2018; Wadoux et al., 2020). In addition, uncertainty around the quality of the covariates included, not the covariates considered in the modeling process including management, use of validation methods that do not sufficiently control the effect of clustered samples, and small sample size for some RSGs could have possibly biased the modeling results in some geographic areas.
To improve the modeling performance, future studies could explore (i) adding data for under-represented geographic areas, land uses, and covariate spaces; (ii) opportunities to include other covariates (parent material and management) that could capture the variability of the country's heterogeneous landscapes; (iii) dimension reduction of covariates; (iv) use of remedial measures for imbalances in sample sizes; (v) comparing different cross-validation methods; (vi) use of an ensemble modeling approach and/or robust modeling technique that accommodates neighborhood size and connectivity analyses; (vii) use of a better-resolution/quality mask layer to segregate non-soil areas (rock outcrops, salt flats, sand dunes, and water bodies) from mapping areas; and (viii) implementation of quantitative and qualitative comparisons of national, regional, and global legacy soil maps/soil grids with new DSM products in terms of how well DSM products represent soil geography. In addition, future digital soil mapping strategies in Ethiopia may require consideration of new soil sampling missions in under-represented areas; adoption of standard soil sampling, description guidelines, and soil classification systems including soil physicochemical and mineralogical analysis; and a combination of local soil nomenclature/classification systems with RSGs and development of a map of RSGs with qualifiers. At the moment the under-sampled and under-represented areas are the Somali region, the Denakil, and the western and northwestern border areas of Ethiopia (Fig. 4). Despite these limitations, and to the best of our knowledge, the EthioSoilGrids v1.0 product provides the most complete soil information available for Ethiopia.
Coherent and up-to-date countrywide digital soil information is essential to support digital agricultural transformation efforts. This study involved collation, cleaning, harmonization, and validation of the legacy soil profile datasets, involving soil scientists with different backgrounds individually and in groups. To develop the 250 m digital soil resource map, a machine-learning modeling approach and expert validation were applied to the harmonized soil database and environmental covariates affecting soil-forming processes. Accordingly, about 20 000 soil profile data were collated, out of which about 14 681 were used for the modeling and mapping of 18 RSGs out of the 23 RSGs identified. Although unevenly distributed, the legacy soil profile data used in the modeling covered most of the agro-ecologies of the country.
Among the 18 RSGs mapped, the highest number of observed (3935) profiles represent Vertisols, followed by Luvisols, Cambisols, and Leptosols, while Gleysols were represented with the lowest number (63) of profiles. The modeling revealed that the most important covariates for predicting RSGs in Ethiopia are MODIS long-term reflectance, multiresolution index of valley bottom flatness, land surface temperature, soil moisture, long-term mean annual rainfall, and wetness index of the landscape.
Our 10-fold spatial cross-validation result showed an overall accuracy of about 56 % with varying accuracy levels among RSGs. The modeling result revealed that seven major soil reference groups including Cambisols (34 %), Leptosols (20 %), Vertisols (18 %), Fluvisols (10 %) Nitisols (7 %), Luvisols (6 %), and Calcisols (3 %) covered nearly 98 % of the total land area of the country, while minor coverage of other RSGs (Solonchaks, Arenosols, Regosols, Andosols, Alisols, Solonetzs, Planosols, Acrisols, Lixisols, Phaeozems, and Gleysols) was also detected in some areas. Compared with the existing soil resource map, the coverage of the first three major soil groups has substantially increased, which is related to the increased availability of soil profile data covering larger areas of the country, implying that these soils were previously underestimated. Cambisols and Vertisols which together represent nearly half of the total land area are relatively young with inherent fertility, suggesting a high agricultural potential for the country. However, given their limitations, these and the other soil types require the implementation of suitable land, water, and crop management techniques to sustainably exploit their potential.
The EthioSoilGrids version 1.0 product from this first countrywide RSGs modeling effort requires complementary activities. These include modeling and mapping that should go beyond RSGs and need to include second-level classifications including principal and supplementary qualifiers. Furthermore, a soil atlas of Ethiopia with details of the soil physicochemical properties needs to be prepared together with the map, which the authors and/or others responsible need to prioritize in their future research endeavors.
Table A1Distribution of legacy soil profile data by agroecology zones.
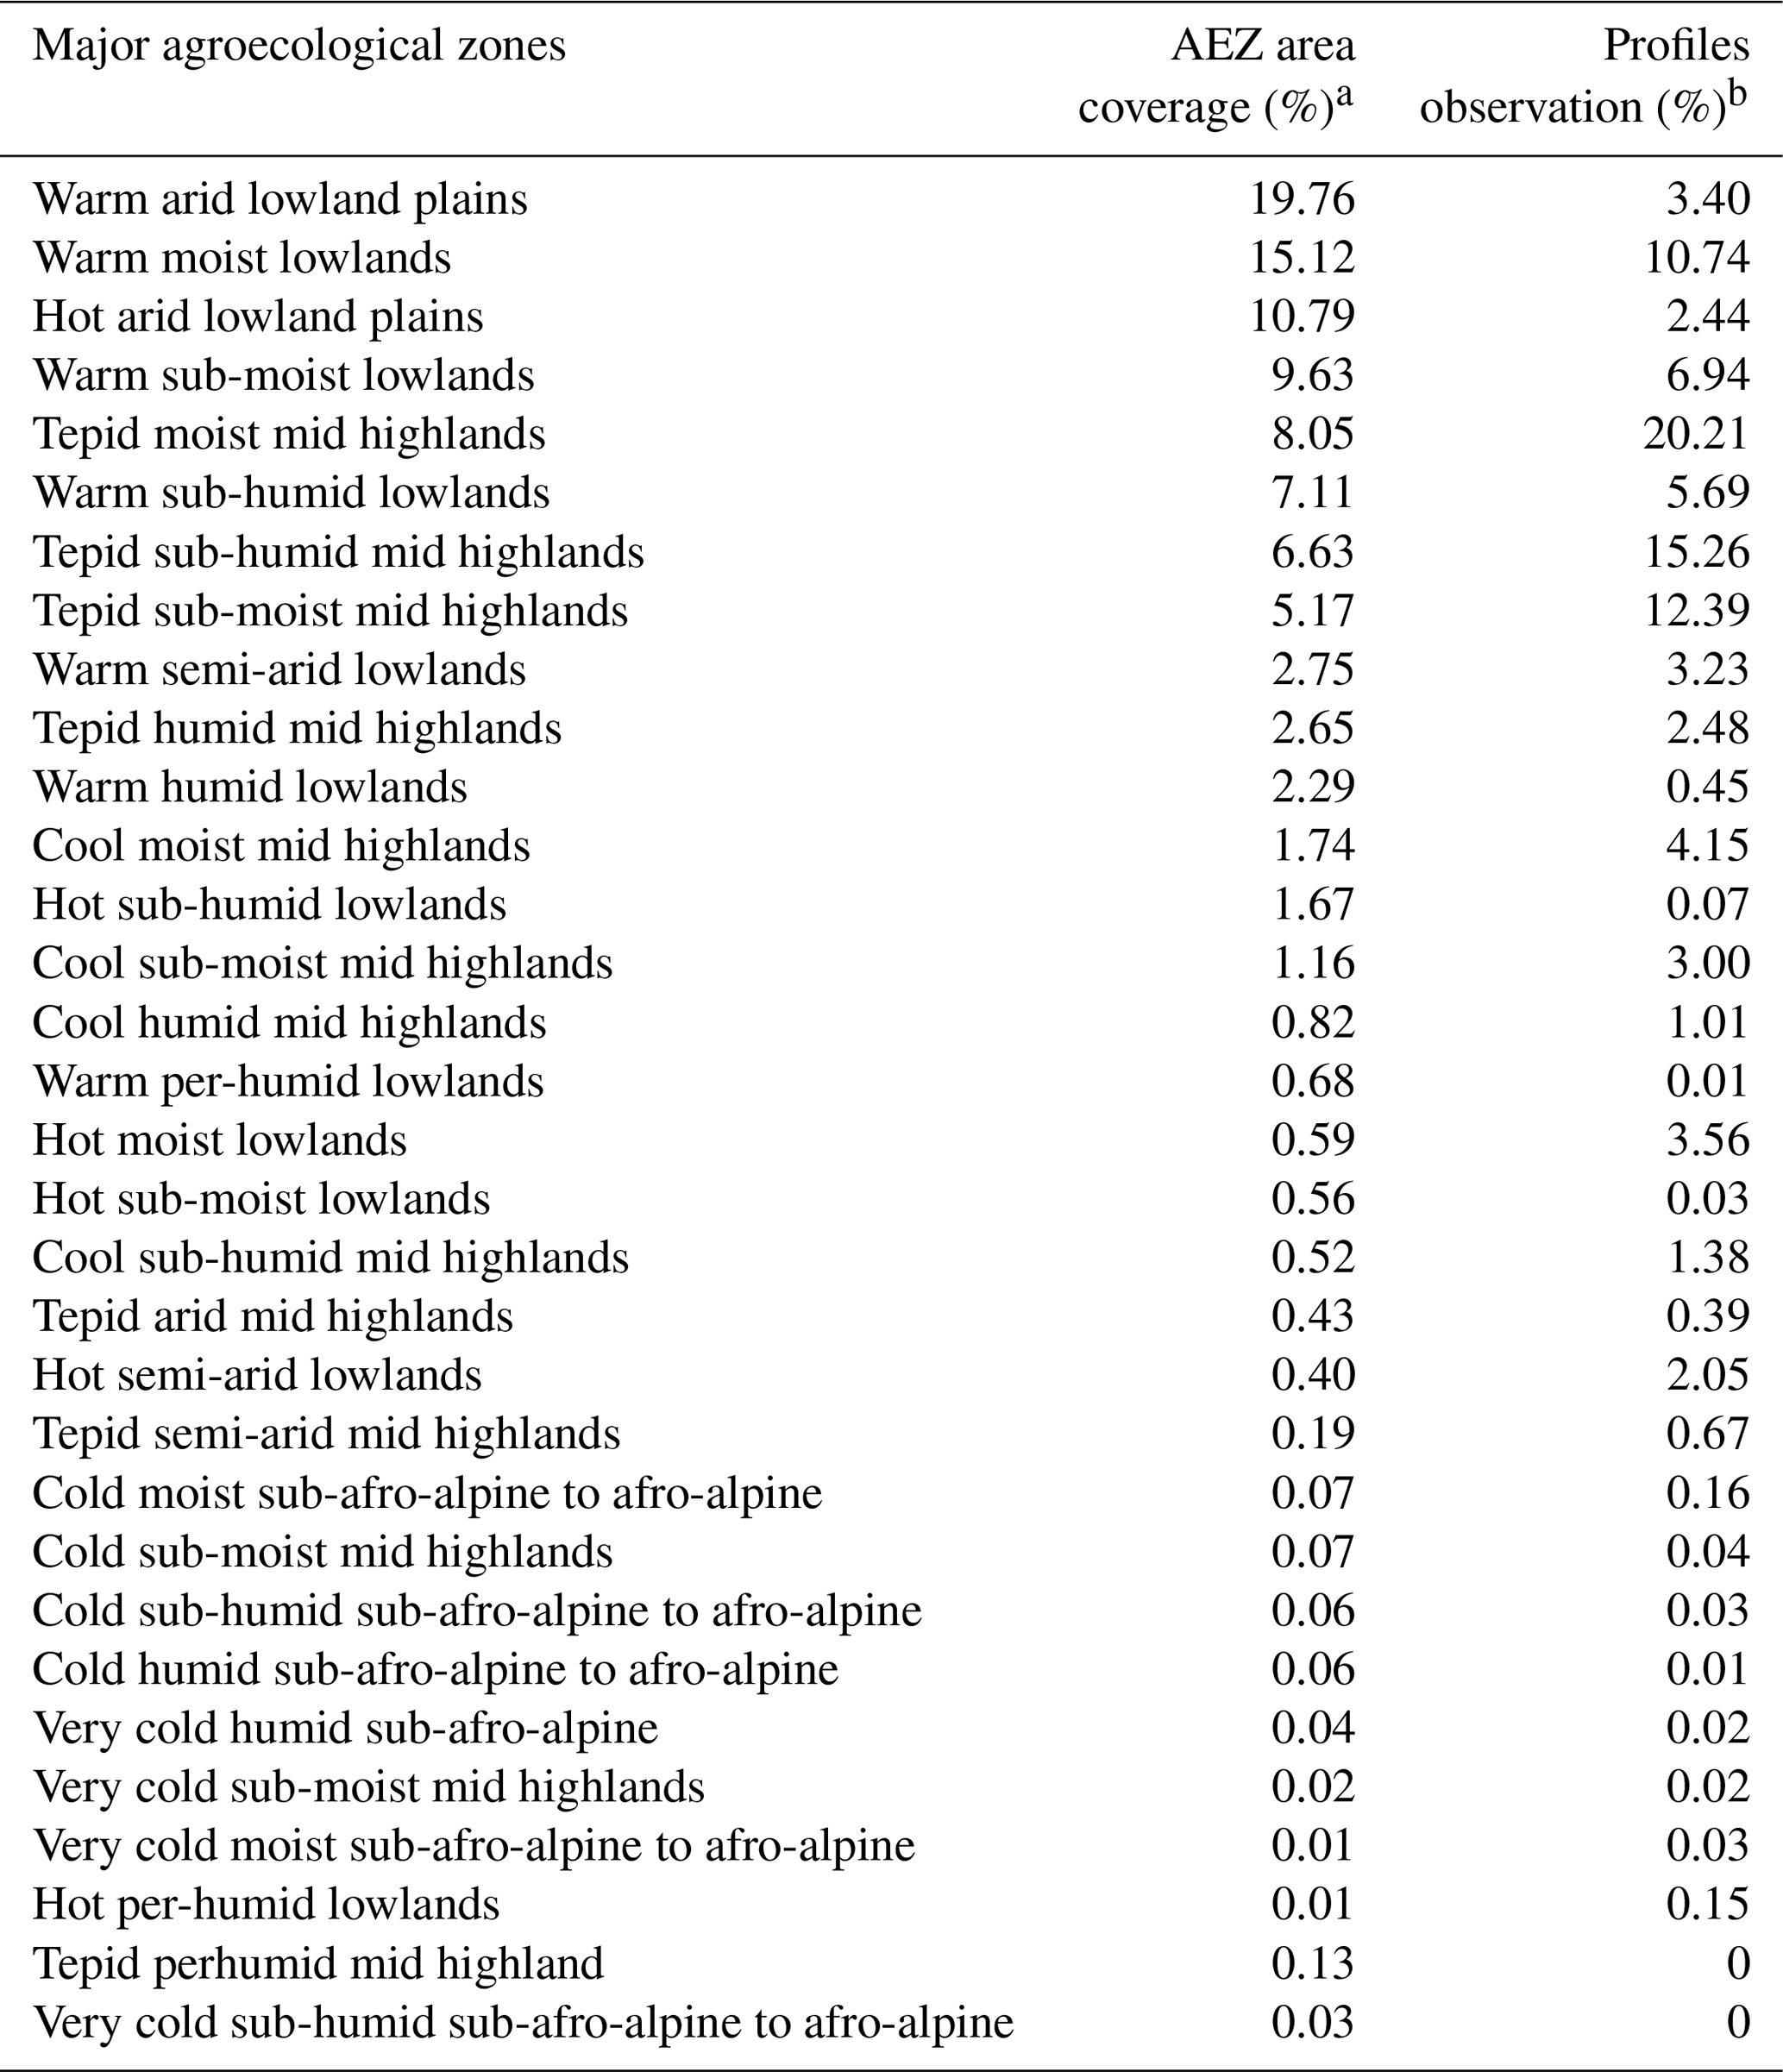
Note: a total area of Ethiopia 1.14×10⁶ km2; b total number of profiles 14 681.
Table B1List, description, spatial and temporal extent, and source of covariates used in modeling the reference soil groups.
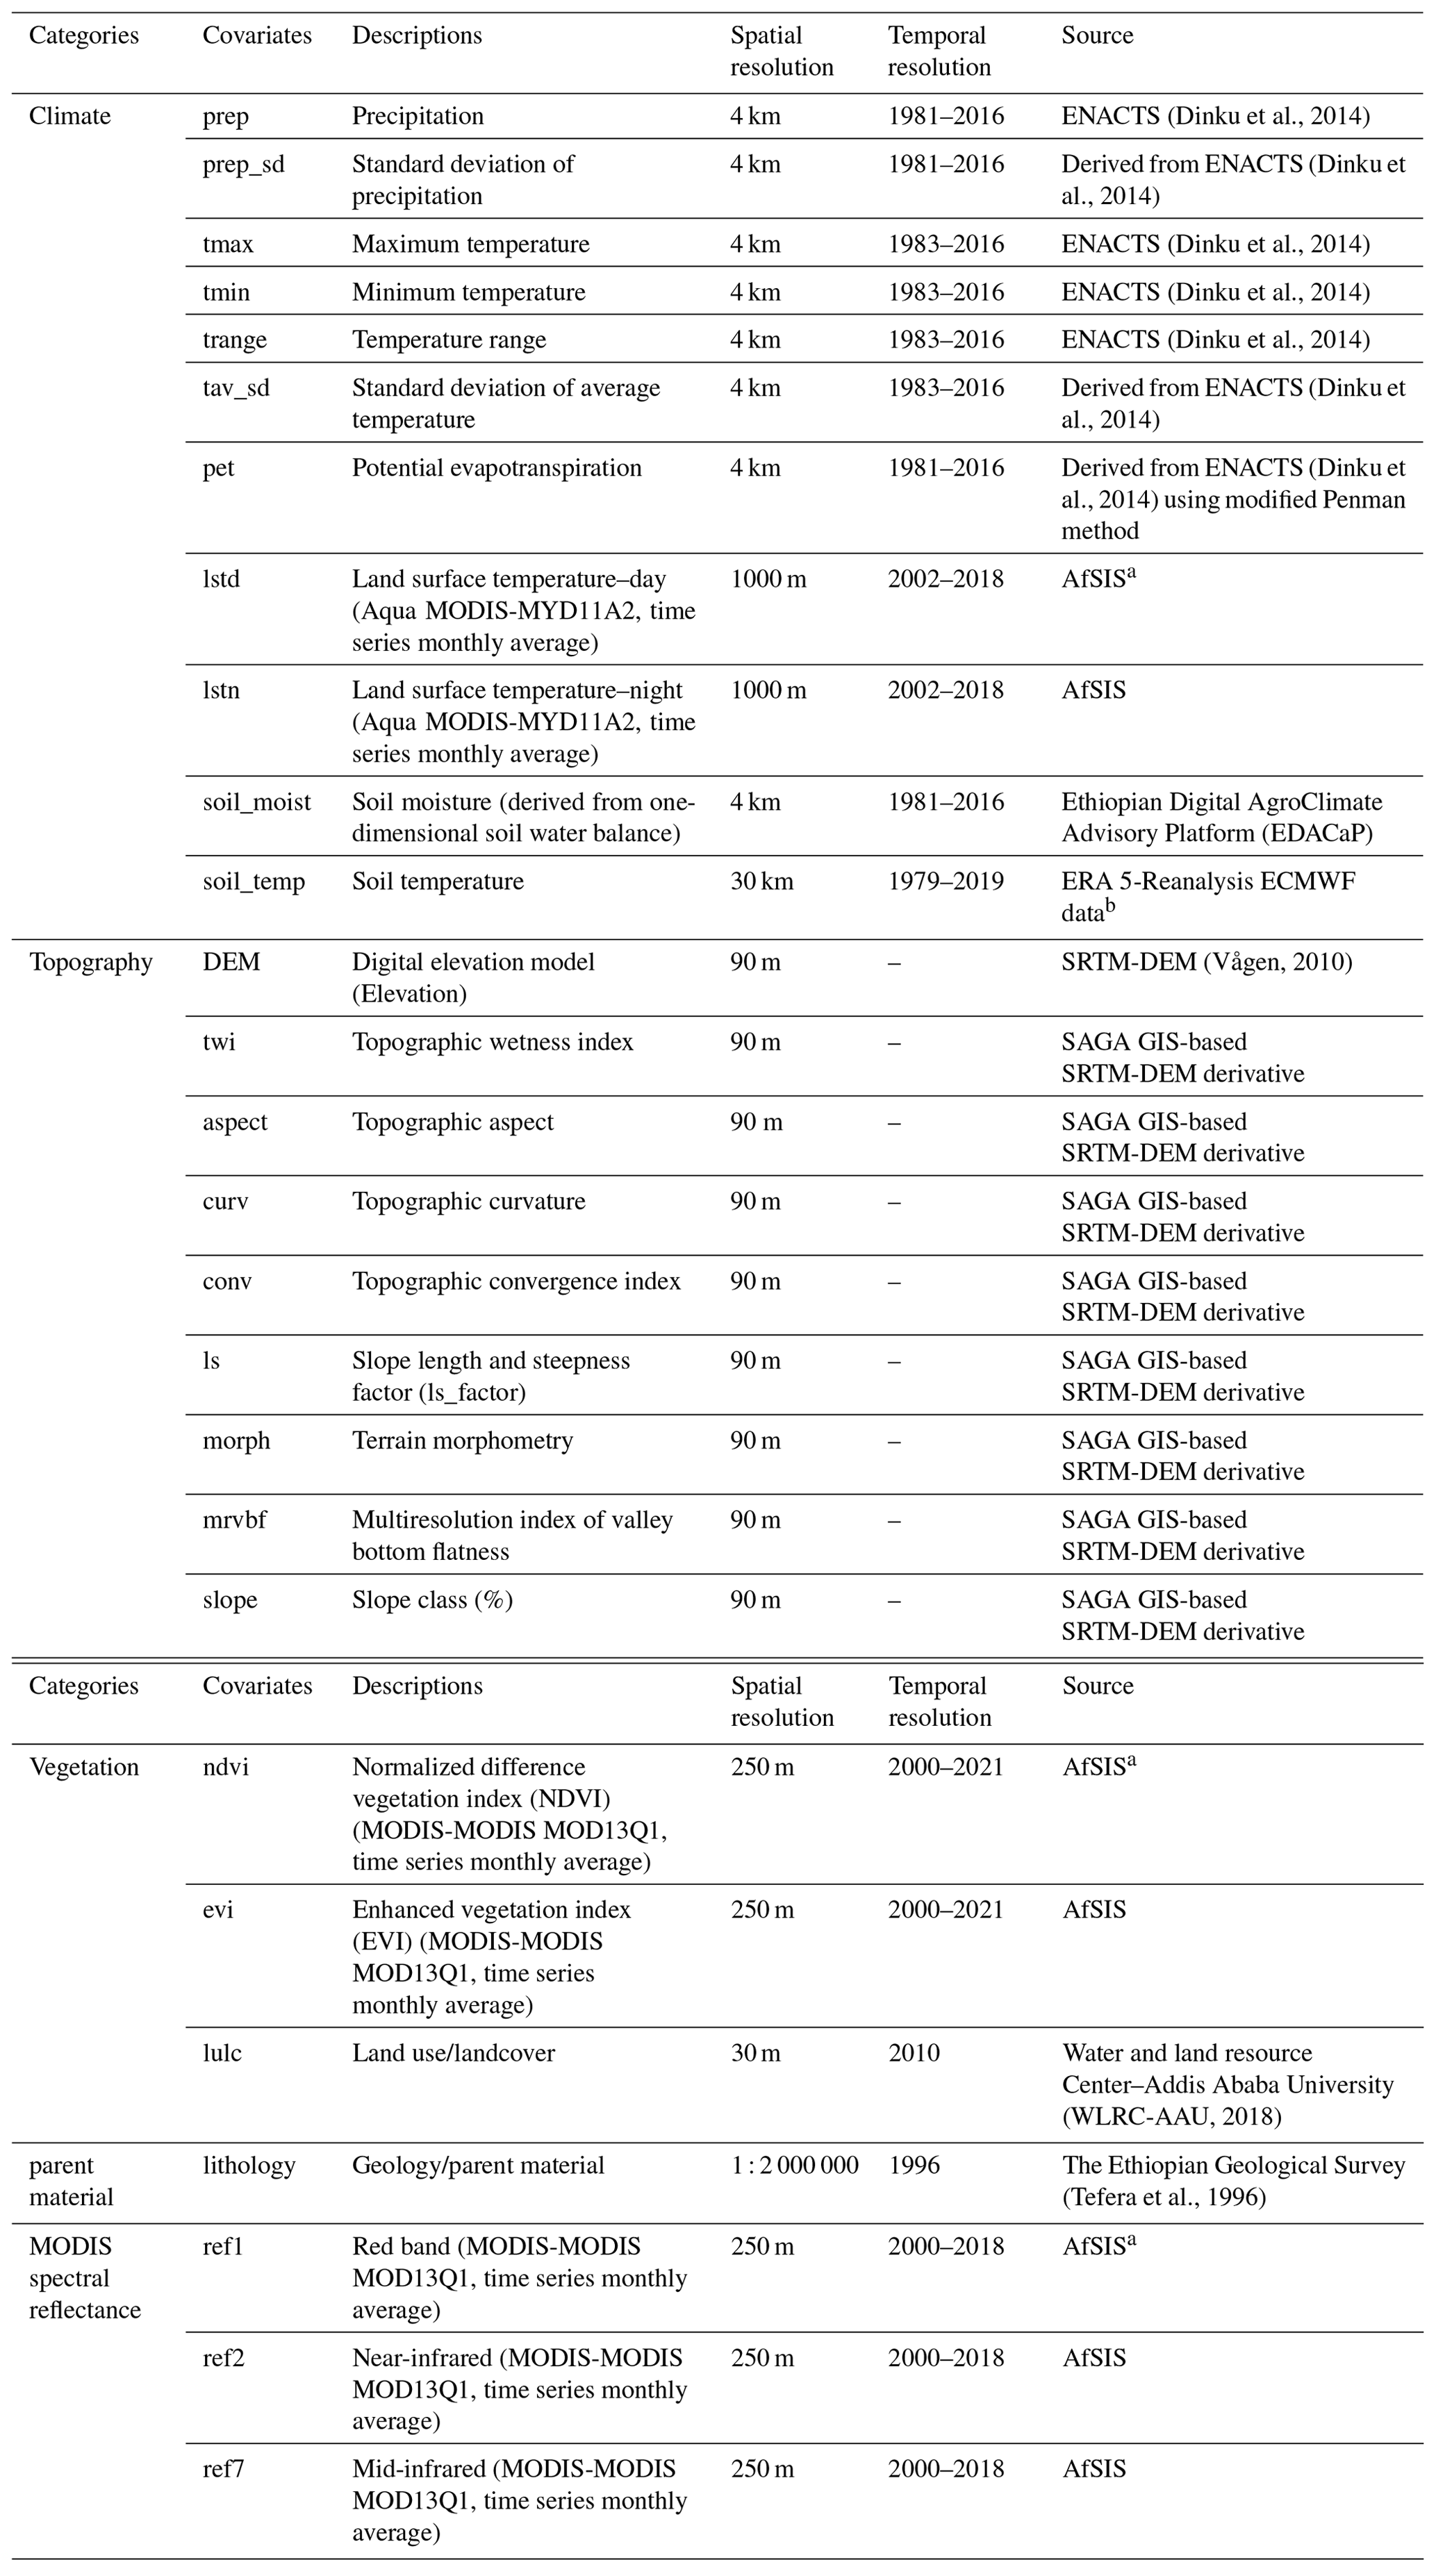
a Africa Soil Information Service (AfSIS). b Fifth generation European Centre for Medium-Range Weather Forecasts (ECMWF) atmospheric reanalysis of the global climate.
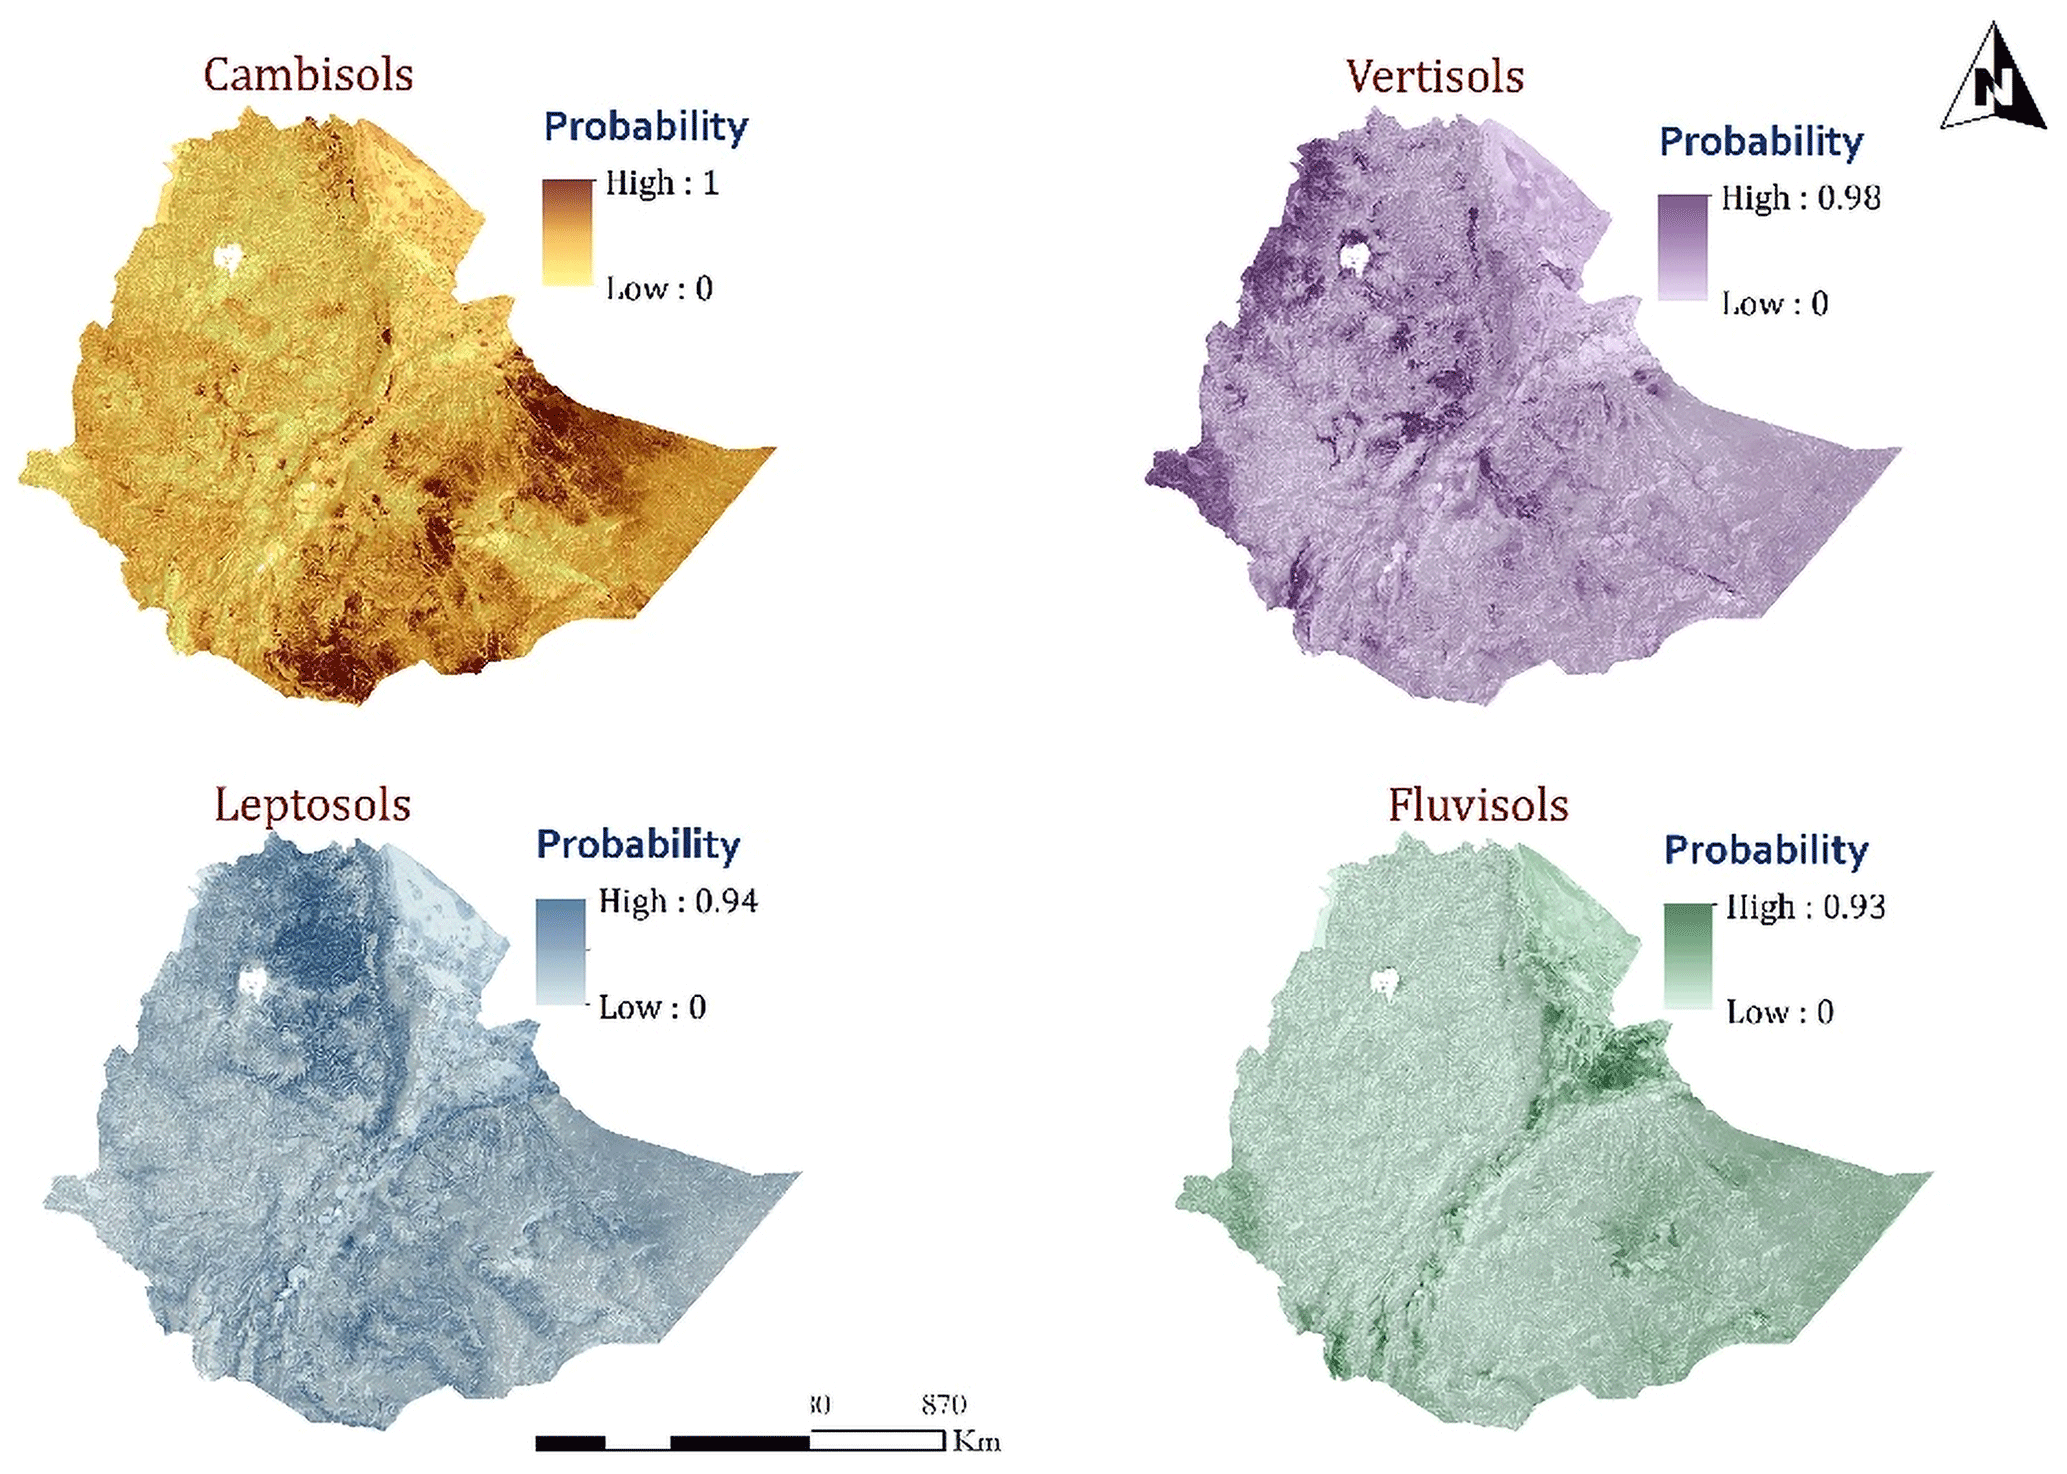
Figure C1Occurrence probability maps of Cambisols, Leptosols, Vertisols, and Fluvisols.
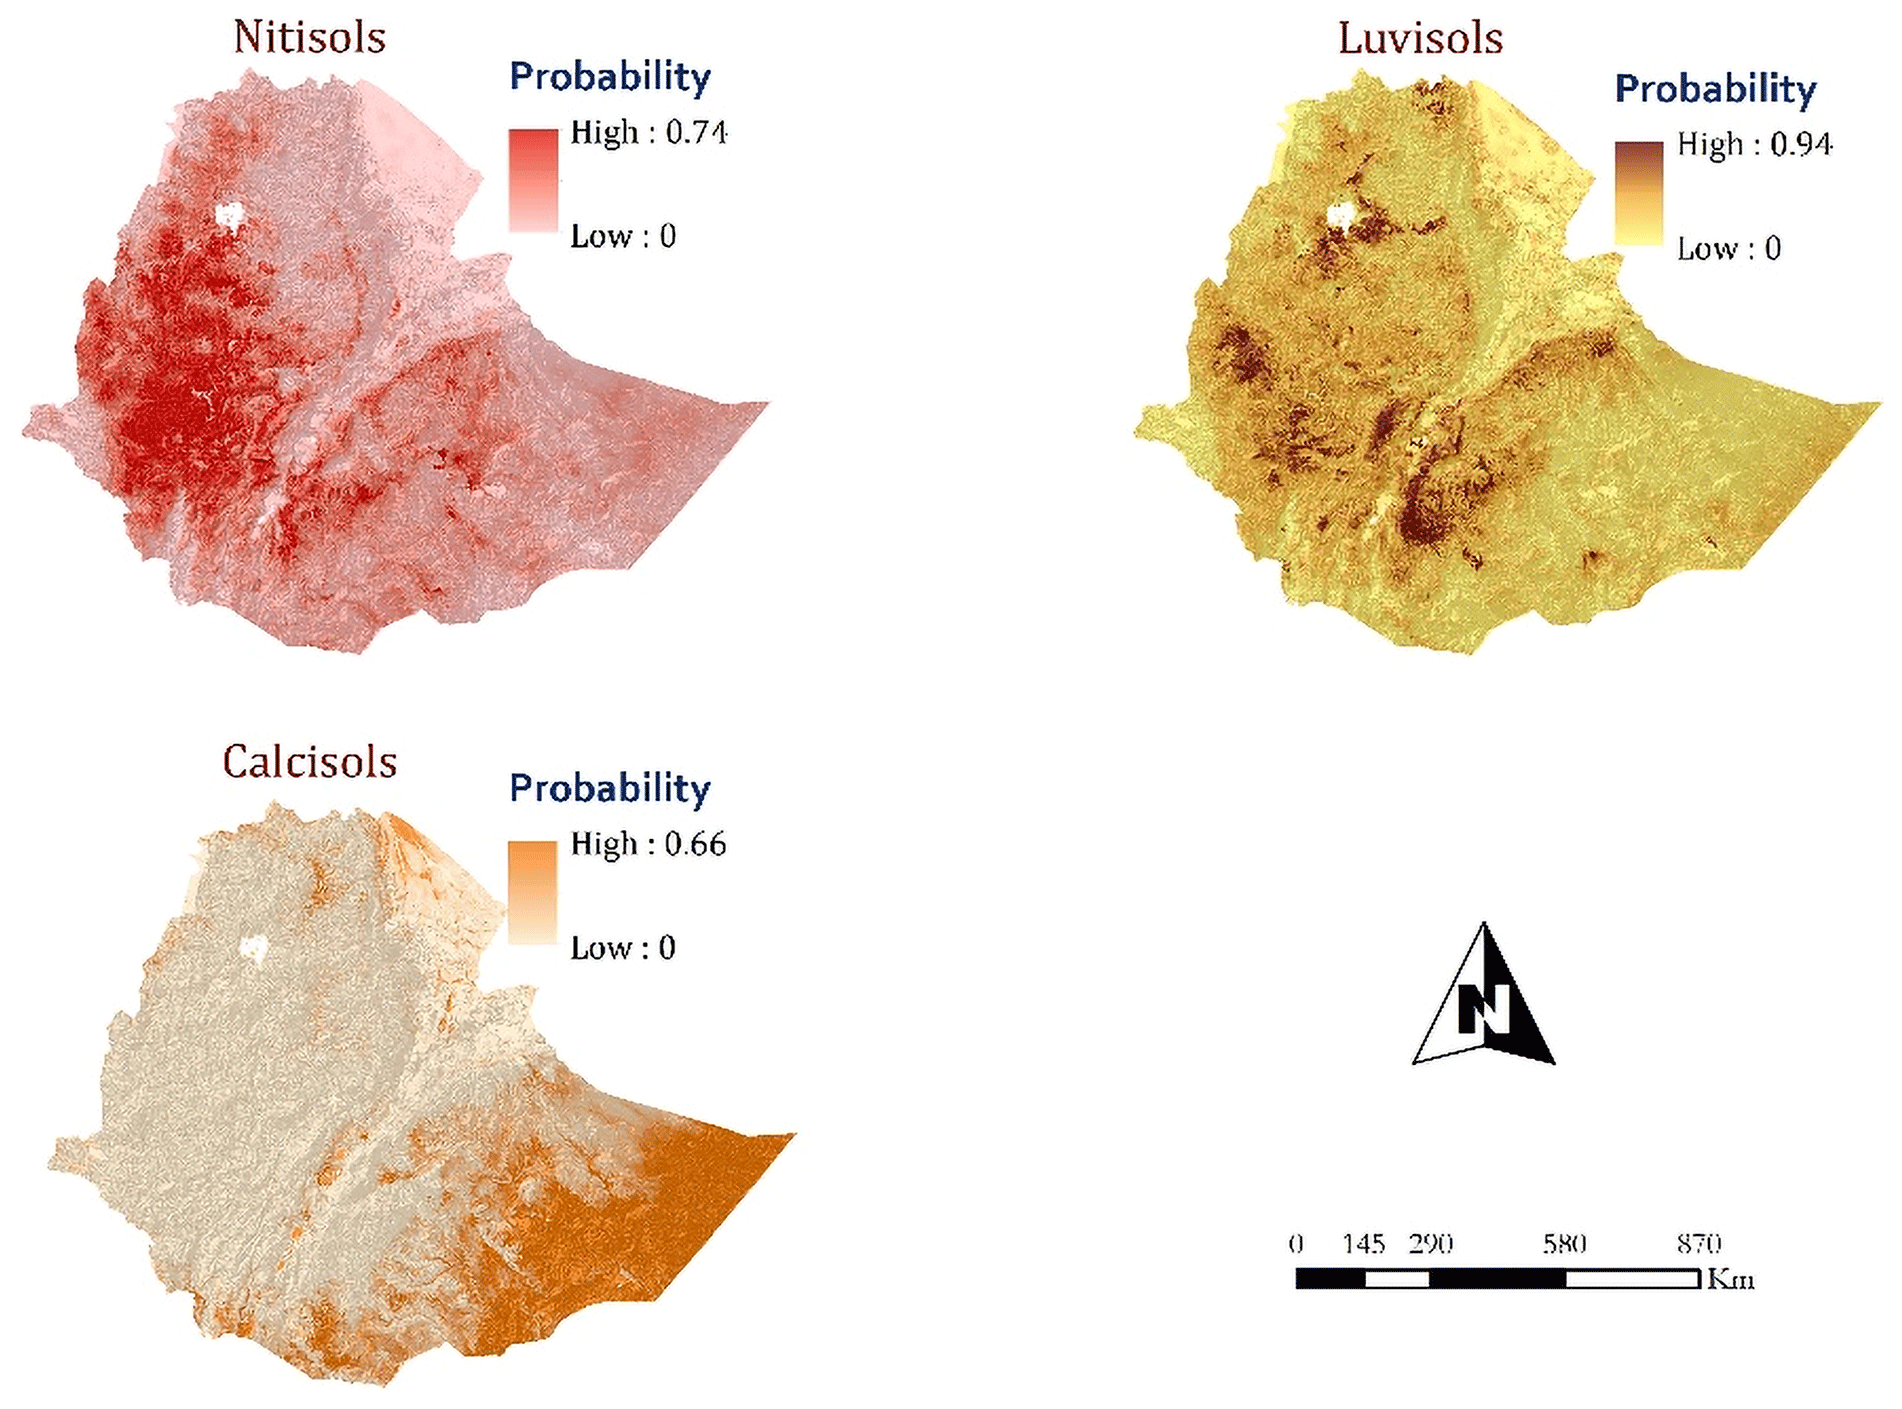
Figure C2Occurrence probability maps of Nitisols, Luvisols, and Calcisols.
Full data will be available upon request based on the CoW guideline (CoW, 2020; https://ethioagridata.com/, last access: 7 November 2023) and the MoA “Soil and Agronomy Data Management, Use and Sharing” directive No. 974/2023 Ethiopia (https://nsis.moa.gov.et/, last access: 7 November 2023).
AshA, TE, KG, WA, and LT conceived and designed the study, performed the analysis and wrote the first draft with substantial input and feedback from all authors. EM, TM, NH, AY, AM, TA, FW, AL, NT, AyeA, SG, YA, and BA contributed to input data preparation, data encoding, and harmonization. Legacy data validation and review of subsequent versions of the paper were performed by MH, WH, AssA, DT, GB, MG, SB, MA, AR, YGS, ST, DA, YW, DB, EZ, SS, and EE.
The contact author has declared that none of the authors has any competing interests.
Publisher’s note: Copernicus Publications remains neutral with regard to jurisdictional claims made in the text, published maps, institutional affiliations, or any other geographical representation in this paper. While Copernicus Publications makes every effort to include appropriate place names, the final responsibility lies with the authors.
We sincerely appreciate the Coalition of the Willing (CoW) members who are instrumental in providing, collating, cleaning, standardizing, and harmonizing the legacy soil profile data used in generating the soil resource map of Ethiopia at 250 m resolution. The CoW team also deserves credit for inspiring many to share data and develop an integrated national database related to agronomy and soil profile data. The leadership of the Natural Resource Development Sector and Soil Resource Information and Mapping Directorate of the Ministry of Agriculture (MoA) played a crucial role. This includes assigning experts from the ministry and other organizations who worked on collating, encoding, harmonizing, and processing the soil survey legacy data; and modeling and prediction of reference soil groups using robust machine-learning algorithms and high-performance computing servers are the foundation for the soil resource map. Various institutions, as well as the late and current soil surveyors and pedologists, deserve special recognition for their contributions to the generation and sharing of soil profile data. We owe a debt of gratitude to ISRIC and the bilateral Ethiopia–Netherlands projects (cascape and BENEFIT-REALISE) funded by the Directorate-General for International Cooperation (DGIS) of the Netherlands Ministry of Foreign Affairs through the Netherlands Embassy in Ethiopia, which have been crucial in providing capacity building to the MoA, and national soil and geospatial experts. Many thanks are due to Eyasu Elias, Arie van Kekem, Tewodros Tefera, Mulugeta Diro, Johan Leenaars, Bas Kempen, Stephan Mantel, and Maria Ruiperez Gonzalez who have been organizing and providing training on soil classifications and digital soil mapping to the MoA, as well as national soil and geospatial experts, during the Ethiopia–Netherlands bilateral projects period. The senior pedologists and soil surveyors who provided invaluable support to check and harmonize thousands of soil profiles and laboratory results are sincerely appreciated. They worked very hard with positive energy, for which we are very grateful. In addition, the same group of experts and additional experts who supported the validation of the preliminary soil resource map deserve credit for their commitment to contributing their expertise. We thank Degefe Tebebe, Sileshi Gudeta, and Neil Munro for support in the extraction of climate covariates as well as for providing critical technical support and comments that helped improve the paper. Our sincere appreciation also goes to the continued and persistent support of GIZ-Ethiopia mainly through the project Supporting Soil Health Interventions in Ethiopia (SSHI), which supported and facilitated the activities of the CoW. The Alliance of Bioversity and CIAT is greatly acknowledged for coordinating CoW and its efforts and for supporting the implementation of activities that are of high national importance. We would also like to sincerely thank the Excellence in Agronomy (EiA) CGIAR Initiative, which has made huge contributions to this project in terms of funding and building skills of the various teams. The Water, Land and Ecosystems (WLE) and Climate Change, Agriculture and Food Security (CCAFS) programs of the CGIAR also provided support in various forms. Recently, our work has benefited from the Accelerating Impacts of CGIAR Climate Research in Africa (AICCRA) project supported by the World Bank in terms of data, analytics, and resources to support data linkage and integration.
This work is financially supported by the Deutsche Gesellschaft für Internationale Zusammenarbeit (GIZ) through the project “Supporting Soil Health Interventions in Ethiopia,” funded by the Bill & Melinda Gates Foundation. This work was supported, in whole or in part, by the Bill & Melinda Gates Foundation (INV-005460). Under the grant conditions of the Foundation, a Creative Commons Attribution 4.0 Generic License has already been assigned to the Author Accepted Manuscript version that might arise from this submission.
This paper was edited by Kristof Van Oost and reviewed by Skye Wills and one anonymous referee.
Abayneh, E.: Application of Geographic Information System (GIS) for soil resource study in Ethiopia, in: Proceedings of the National Sensitization Workshop on Agro metrology and GIS, 17–18 December 2001, Addis Ababa, Ethiopia, 162–169, 2001.
Abayneh, E.: Characteristics, Genesis and Classification of Reddish Soils from Sidamo Region of Ethiopia, PhD thesis, Universiti Putra Malaysia, 2005.
Abayneh, E. and Berhanu, D.: Soil Survey in Ethiopia: Past, Present and the Future, in: Proceedings of the 8th Conference of the Ethiopian Society of Soil Science, Soils for sustainable development, 27–28 April, 2006, Addis Ababa, Ethiopia, 2007.
Abayneh, E., Zauyah, S., Hanafi, M. M., and Rosenani, A. B.: Genesis and classification of sesquioxidic soils from volcanic rocks in sub-humid tropical highlands of Ethiopia, Geoderma, 136, 682–695, https://doi.org/10.1016/j.geoderma.2006.05.006, 2006.
Abdenna, D., Yli-Halla, M., Mohamed, M., and Wogi, L.: Soil classification of humid Western Ethiopia: A transect study along a toposequence in Didessa watershed, Catena, 163, 184–195, https://doi.org/10.1016/j.catena.2017.12.020, 2018.
Abegaz, A., Ashenafi, A., Tamene, L., Abera, W., and Smith, J. U.: Modeling long-term attainable soil organic carbon sequestration across the highlands of Ethiopia, Environ. Dev. Sustain., 24, 131–5162, https://doi.org/10.1007/s10668-021-01653-0, 2022.
Alemayehu, R., Van Daele, K., De Paepe, P., Dumon, M., Deckers, J., Asfawossen, A., and Van Ranst, E.: Characterizing weathering intensity and trends of geological materials in the Gilgel Gibe catchment, southwestern Ethiopia, J. Afr. Earth Sci., 99, 568–580, https://doi.org/10.1016/j.jafrearsci.2014.05.012, 2014.
Ali, A., Abayneh, E., and Sheleme, B.: Characterizing soils of Delbo Wegene watershed, J. Soil Sci. Environ. Manage., 1, 184–199, 2010.
Ali, A., Tamene, L., and Erkossa, T.: Identifying, Cataloguing, and Mapping Soil and Agronomic Data in Ethiopia, CIAT Publication No. 506, International Center for Tropical Agriculture (CIAT), Addis Ababa, Ethiopia, https://hdl.handle.net/10568/110868 (last access: 21 November 2021), 2020.
Asmamaw, L. and Mohammed, A.: Characteristics and classification of the soils of Gerado catchment, Northeastern Ethiopia, Ethiopian Journal of Natural Resources, 12, 1–22, 2012.
Batjes, N. H., Ribeiro, E., and van Oostrum, A.: Standardised soil profile data to support global mapping and modelling (WoSIS snapshot 2019), Earth Syst. Sci. Data, 12, 299–320, https://doi.org/10.5194/essd-12-299-2020, 2020.
Baveye, P. C., Jacques, B., and John, G.: Soil “Ecosystem” Services and Natural Capital: Critical Appraisal of Research on Uncertain Ground, Front. Environ. Sci., 4, 41, https://doi.org/10.3389/fenvs.2016.00041, 2016.
Belay, T.: Characteristics and Landscape relationships of Vertisols and Vertic Luvisols of Melbe, Tigray, Ethiopia, SINET, 19, 93–115, 1996.
Belay, T.: Variabilities of Soil Catena on Degraded Hill Slopes of Wtiya Catchment, Wello, Ethiopia, SINET, 20, 151–175, 1997.
Belay, T.: Pedogenesis and soil-geomorphic relationships on the Piedmont slopes of Wurgo Valley, South Welo, Ethiopia, SINET, 21, 91–111, 1998.
Belay, T.: Characteristics and classification of soils of Gora Daget forest, South welo highlands, Ethiopia, SINET, 23, 35–51, 2000.
Berhanu, D.: A survey of studies conducted about soil resources appraisal and evaluation for rural development in Ethiopia, Institute of Agricultural Research, Addis Ababa, Ethiopia, 1980.
Berhanu, D.: The soils of Ethiopia: Annotated bibliography, Regional Soil Conservation Unit (RSCU), Swedish International Development Authority (SIDA), Tech. handbook no. 9, 1994.
Berhanu, D. and Ochtman, L.: Soil resource appraisal and evaluation studies for rural development in Ethiopia, meeting of the east African sub-committee for soil correlation and land evaluation, Nairobi, Kenya, FAO World Soil Resources Rep. 46, 63–70, 1974.
Billi, P.: Geomorphological landscapes of Ethiopia, in: Landscapes and Landforms of Ethiopia, World Geomorphological Landscapes, Springer, Dordrecht, 3–32, https://doi.org/10.1007/978-94-017-8026-1_1, 2015.
Breiman, L.: RandomForests, Mach. Learn., 45, 5–32, https://doi.org/10.1023/A:1010933404324, 2001.
Brungard, C. W., Boettinger, J. J., Duniway, M. C., Wills, S. A., and Edwards, W. T. C.: Machine learning for predicting soil classes in three semi-arid landscapes, Geoderma, 239–240, 68–83, https://doi.org/10.1016/j.geoderma.2014.09.019, 2015.
CoW (Coalition of the Willing): Coalition of the Willing for soil and agronomy data access, management and sharing, Data Sharing Guidelines, Ethiopian Institute of Agricultural Research (EIAR), Addis Ababa, Ethiopia, 28 pp., https://hdl.handle.net/10568/107988 (last access: 5 December 2021), 2020.
Conrad, O., Bechtel, B., Bock, M., Dietrich, H., Fischer, E., Gerlitz, L., Wehberg, J., Wichmann, V., and Böhner, J.: System for Automated Geoscientific Analyses (SAGA) v. 2.1.4, Geosci. Model Dev., 8, 1991–2007, https://doi.org/10.5194/gmd-8-1991-2015, 2015.
Dinku, T., Block, P., Sharoff, J., Hailemariam, K., Osgood, D., del Corral, J., Rémi Cousin, R., and Thomson, M. C.: Bridging critical gaps in climate services and applications in Africa, Earth Perspectives, 1, 1–13, https://doi.org/10.1186/2194-6434-1-15, 2014.
Donahue, R. L.: Ethiopia: Taxonomy, cartography and ecology of soils, Michigan State Univ., African Stud. Center and Inst. Int. Agric., Comm., Ethiopian Stud., Occasional Papers Series, Monograph 1, 1972.
Driessen, P. M., Deckers, J., Spaargaren, O., and Nachtergaele, F.: Lecture notes on the major soils of the world, world soil resources reports No. 94, FAO, Rome, https://edepot.wur.nl/82729 (last access: 12 December 2021), 2001.
Elias, E.: Soils of the Ethiopian Highlands: Geomorphology and Properties, CASCAPE Project, ALTERRA, Wageningen UR, the Netherlands, https://library.wur.nl/WebQuery/isric/2259099 (last access: 11 November 2021), 2016.
Enyew, B. D. and Steeneveld, G. J.: Analysing the impact of topography on precipitation and flooding on the Ethiopian highlands, J. Geol. Geosci., 3, https://gert-jan.steeneveld.wur.nl/enyewsteeneveld2014.pdf (last access: 13 August 2021), 2014.
Erkossa, T., Laekemariam, F., Abera, W., and Tamene, L.: Evolution of soil fertility research and development in Ethiopia: From reconnaissance to data-mining approaches, Exp. Agr., 58, E4, https://doi.org/10.1017/S0014479721000235, 2022.
FAO: Assistance to Land Use-Planning, Ethiopia: Provisional Soil Association Map of Ethiopia, Field document No. 6, The United Nations Development Programme and Food and Agriculture Organization, FAO, Rome, https://www.fao.org/3/ar767e/ar767e.pdf (last access: 5 July 2021), 1984a.
FAO: Assistance to Land Use-Planning, Ethiopia: Geomorphology and soils, Field Document AG DP/ETH/78/003, The United Nations Development Programme and FAO, FAO, Rome, 1984b.
FAO: The Soil and Terrain Database for north-eastern Africa, Crop production systems zones of the GAD sub region, Land and water digital media series no. 2, FAO, Rome, Italy, 1998.
FAO: Guideline for Soil Description, 4th Edn., FAO, Rome, Italy, https://www.fao.org/publications/card/en/c/903943c7-f56a-521a-8d32-459e7e0cdae9/ (last access: 23 February 2021), 2006.
Fazzini, M., Bisci, C., and Billi, P.: The Climate of Ethiopia, in: Landscapes and Landforms of Ethiopia, World Geomorphological Landscapes, edited by: Billi, P., Springer, Dordrecht, the Netherlands, 65–87, https://doi.org/10.1007/978-94-017-8026-1_3, 2015.
Fikre, M.: Pedogenesis of major volcanic soils of the southern central Rift Valley region, Ethiopia, MSc Thesis, 270 pp., University of Saskatchewan, Saskatoon, Canada, 2003.
Fikru, A.: Soil resources of Ethiopia, in: Natural Resources Degradation a Challenge to Ethiopia, First Natural Resources Conservation Conference, Institute of Agricultural Research (IAR), 7–8 February 1980, Addis Ababa, Ethiopia, 1980.
Fikru, A.: Need for Soil Survey Studies, in: Proceedings of the first soils science research review workshop, 11–14 February 1987, Addis Ababa, Ethiopia, 1988.
Hengl, T. and MacMillan, R. A.: Predictive Soil Mapping with R, OpenGeoHub foundation, Wageningen, the Netherlands, https://soilmapper.org/ (last access: 14 September 2021), ISBN 978-0-359-30635-0, 2019.
Hengl, T., Heuvelink, G. B. M., Kempen, B., Leenaars, J. G. B., Walsh, M. G., Shepherd, K. D., Sila, A., MacMillan, R. A., Mendes de Jesus, J., Tamene, L., and Tondoh, J. E.: Mapping soil properties of Africa at 250 m resolution: random forest significantly improve current predictions, PLoS ONE, 10, e0125814, https://doi.org/10.1371/journal.pone.0125814, 2015.
Hengl, T., Mendes de Jesus, J., Heuvelink, G. B., Ruiperez Gonzalez, M., Kilibarda, M., Blagotić, A., Shangguan, W., Wright, M. N., Geng, X., Bauer-Marschallinger, B., Guevara, M. A., Vargas, R., MacMillan, R. A., Batjes, N. H., Leenaars, J. G., Ribeiro, E., Wheeler, I., Mantel, S., and Kempen, B.: SoilGrids250m: Global gridded soil information based on machine learning, PloS one, 12, e0169748, https://doi.org/10.1371/journal.pone.0169748, 2017.
Hengl, T., Nussbaum, M., Wright, M. N., Heuvelink, G. B. M., and Gräler, B.: Random forest as a generic framework for predictive modeling of spatial and spatio-temporal variables, PeerJ, 6, e5518, https://doi.org/10.7717/peerj.5518, 2018.
Hengl, T., Miller, M., Križan, J., Shepherd, K. D., Sila, A., Kilibarda, M., Antonijevi´c, O., Glušica, L., Dobermann, A., Haefele, S. M., McGrath, S. P., Acquah, G. E., Collinson, J., Parente, L., Sheykhmousa, M., Saito, K., Johnson, J. M., Chamberlin, J., Silatsa, F., Yemefack, M., Wendt, J., MacMillan, R. A., Wheeler, I., and Crouch, J.: African soil properties and nutrients mapped at 30 m spatial resolution using two-scale ensemble machine learning, Sci. Rep., 11, 6130, https://doi.org/10.1038/s41598-021-85639-y, 2021.
Heung, B., Hung, C. H., Zhang, J., Knudby, A., Bulmer, C. E., and Schmidt, M. G.: An overview and comparison of machine-learning techniques for classification purposes in digital soil mapping, Geoderma, 265, 62–77, 2016.
Hounkpatin, K. O. L., Schmidt, K., Stumpf, F., Forkuor, G., Behrens, T., Scholten, T., Amelung, W., and Welp, G.: Predicting reference soil groups using legacy data: A data pruning and Random Forest approach for tropical environment (Dano catchment, Burkina Faso), Sci. Rep., 8, 9959, https://doi.org/10.1038/s41598-018-28244-w, 2018.
Hurni, H.: Agro-ecological Belts of Ethiopia: Explanatory Notes on three maps at a scale of 1 : 1,000,000, Soil Cons. Res. Pro., University of Bern, (Switzerland) in Association with the Ministry of Agriculture, Addis Ababa, https://edepot.wur.nl/484855 (last access: 6 June 2021), 1998.
Iticha, B. and Chalsissa, T.: Digital soil mapping for site-specific management of soils, Geoderma, 351, 85–91, https://doi.org/10.1016/j.geoderma.2019.05.026, 2019.
IUSS WRB (IUSS Working Group): World Reference Base for Soil Resources 2014, update 2015 International soil classification system for naming soils and creating legends for soil maps, World Soil Resources Reports No. 106, FAO, Rome, https://www.fao.org/3/i3794en/I3794en.pdf (last access: 11 February 2019), 2015.
Kempen, B., Brus, D. J., Heuvelink, G. B. M., and Stoorvogel, J. J.: Updating the 1 : 50,000 Dutch soil map using legacy soil data: A multinomial logistic regression approach, Geoderma, 151, 311–326, https://doi.org/10.1016/j.geoderma.2009.04.023, 2009.
Kempen, B., Brus, D. J., Stoorvogel, J. J., Heuvelink, G. B. M., and de Vries, F.: Efficiency comparison of conventional and digital soil mapping for updating soil maps, Soil Sci. Soc. Am. J., 76, 2097–2115, https://doi.org/10.2136/sssaj2011.0424, 2012.
Kuhn, M.: Building predictive Models in R using the caret package, J. Stat. Softw., 28, 1–26, https://doi.org/10.18637/jss.v028.i05, 2008.
Leenaars, J. G. B., van Oostrum, A. J. M., and Ruiperez, G. M.: Africa Soil Profiles Database, Version 1.2. A compilation of georeferenced and standardised legacy soil profile data for Sub-Saharan Africa (with dataset), ISRIC Report 2014/01, Africa Soil Information Service (AfSIS) project and ISRIC – World Soil Information, Wageningen, https://library.wur.nl/WebQuery/isric/2259472 (last access: 7 August 2023), 2014.
Leenaars, J. G. B., Elias, E., Wösten, J. H. M., Ruiperez-González, M., and Kempen, B.: Mapping the major soil-landscape resources of the Ethiopian Highlands using random forest, Geoderma, 361, 114067, https://doi.org/10.1016/j.geoderma.2019.114067, 2020a.
Leenaars, J. G. B., Ruiperez, M., González, M., Kempen, B., and Mantel, S.: Semi-detailed soil resource survey and mapping of REALISE woredas in Ethiopia, Project report to the BENEFIT-REALISE programme, December 2020, ISRIC – World Soil Information, Wageningen, The Netherlands, https://www.isric.org/projects/realise-survey-and-mapping-soil-resources (last access: 18 October 2021), 2020b.
McBratney, A. B., Santos, M. M., and Minasny, B.: On digital soil mapping, Geoderma, 117, 3–52, 2003.
Mesfin, A.: Nature and Management of Ethiopian Soils, 272 pp., Alamaya University of Agriculture, Alamaya, Ethiopia, 1998.
Mishra, B. B., Gebrekidan, H., and Kibret, K.: Soils of Ethiopia: Perception, appraisal and constraints in relation to food security, International journal of food, agriculture and environment, 2, 269–279, 2004.
Mitiku, H.: Genesis, characteristic and classification of the Central Highland soils of Ethiopia, PhD Thesis, 399 pp., State University of Ghent, Belgium, 1987.
Mohammed, A. and Belay, T.: Characteristics and classification of the soils of the Plateau of Simen Mountains National Park (SMNP), Ethiopia, SINET, 31, 89–102, 2008.
Mohammed, A. and Solomon, T.: Characteristics and fertility quality of the irrigated soils of Sheneka, Ethiopia, Ethiopian Journal of Natural Resources, 12, 1–22, 2012.
Mulder, V. L., Lacoste, M., Richer de Forges, A. C., and Arrouays, D.: GlobalSoilMap France: high resolution spatial modelling the soils of France up to two meter depth, Sci. Total Environ., 573, 1352–1369, 2016.
Mulualem, A., Gobezie, T. B., Kasahun, B., and Demese, M.: Recent Developments in Soil Fertility Mapping and Fertilizer Advisory Services in Ethiopia, A Position Paper, https://www.researchgate.net/publication/327764748/ (last access: 7 October 2021), 2018.
Mulugeta, T., Seid, A., Kefyialew, T., Mulugeta, F., and Tadla, G.: Characterization and Classification of Soils of Askate Subwatershed, Northeastern Ethiopia, Agri. For. Fisheries, 10, 112–122, https://doi.org/10.11648/j.aff.20211003.13, 2021.
Nyssen, J., Tielens, S., Tesfamichael, G., Tigist, A., Kassa, T., Wauw, J., Degeyndt, K., Descheemaeker, K., Kassa, A., Mitiku, H., and Amanuel, Z.: Understanding spatial patterns of soils for sustainable agriculture in northern Ethiopia's tropical mountains, PLoS ONE, 14, e0224041, https://doi.org/10.1371/journal.pone.0224041, 2019.
Poggio, L., de Sousa, L. M., Batjes, N. H., Heuvelink, G. B. M., Kempen, B., Ribeiro, E., and Rossiter, D.: SoilGrids 2.0: producing soil information for the globe with quantified spatial uncertainty, SOIL, 7, 217–240, https://doi.org/10.5194/soil-7-217-2021, 2021.
QGIS Development Team: QGIS Geographic Information System, Open Source Geospatial Foundation Project, https://qgis.org/en/site/ (last access: 17 August 2021), 2021.
R Core Team: R: A Language and Environment for Statistical Computing, R Foundation for Statistical Computing, Vienna, http://www.R-project.org/ (last access: 14 September 2021), 2020.
Rossiter, D. G., Poggio, L., Beaudette, D., and Libohova, Z.: How well does digital soil mapping represent soil geography? An investigation from the USA, SOIL, 8, 559–586, https://doi.org/10.5194/soil-8-559-2022, 2022.
Sheleme, B.: Topographic positions and land use impacted soil properties along Humbo Larena-Ofa Sere toposequence, Southern Ethiopia, Journal of Soil Science and Environmental Management, 8, 135–147, https://doi.org/10.5897/JSSEM2017.0643, 2017.
Shi, J., Yang, L., Zhu, A.-X., Qin, C., Liang, P., Zeng, C., and Pei, T.: Machine-Learning Variables at Different Scales vs. Knowledge-based Variables for Mapping Multiple Soil Properties, Soil Sci. Soc. Am. J., 82, 645–656, https://doi.org/10.2136/sssaj2017.11.0392, 2018.
Shimeles, D., Mohamed, A., and Abayneh, E.: Characteristics and classification of the soils of Tenocha Wenchacher Micro catchment, South west Shewa, Ethiopia, Ethiopian Journal of Natural Resources, 9, 37–62, 2007.
Soil Science Division Staff: Soil survey manual, edited by: Ditzler, C., Scheffe, K., and Monger, H. C., USDA Handbook 18, Government Printing Office, Washington, D.C., USA, https://www.nrcs.usda.gov/sites/default/files/2022-09/The-Soil-Survey-Manual.pdf (last access: 6 October 2020), 2017.
Svetnik, V., Liaw, A., Tong, C., Culberson, J. C., Sheridan, R. P., and Feuston, B. P.: Random forest: a classification and regression tool for compound classification and QSAR modeling, J. Chem. Inf. Comp. Sci., 43, 1947–1958, https://doi.org/10.1021/ci034160g, 2003.
Tamene, L., Erkossa, T., Tafesse, T., Abera, W., and Schultz, S.: A coalition of the willing powering data-driven solutions for Ethiopian agriculture, CIAT Publication No. 518, CIAT, Addis Ababa, Ethiopia, 2021.
Tamene, L. D., Amede, T., Kihara, J., Tibebe, D., and Schulz, S.: A review of soil fertility management and crop response to fertilizer application in Ethiopia: towards development of site- and context-specific fertilizer recommendation, CIAT Publication No. 443, International Center for Tropical Agriculture (CIAT), Addis Ababa, Ethiopia, https://hdl.handle.net/10568/82996 (last access: 17 July 2021), 2017.
Tefera, M., Chernet, T., and Workineh, H.: Geological Map of Ethiopia, Addis Ababa, Ethiopia: Federal Democratic Republic of Ethiopia, Ministry of Mines and Energy, Ethiopian Institute of Geological Surveys, Addis Ababa, Ethiopia, 1996.
Tolossa, A. R.: Vertic Planosols in the Highlands of South-Western Ethiopia: Genesis, Characteristics and Use, Ghent University, Faculty of Sciences, Ghent, Belgium, http://hdl.handle.net/1854/LU-5991501 (last access: 23 June 2021), 2015.
Vågen, T. G.: Africa Soil Information Service: Hydrologically Corrected/Adjusted SRTM DEM (AfrHySRTM), International Center for Tropical Agriculture – Tropical Soil Biology and Fertility Institute (CIAT-TSBF), World Agroforestry Centre (ICRAF), Center for International Earth Science Information Network (CIESIN), Columbia University, https://cmr.earthdata.nasa.gov/search/concepts/C1214155420-SCIOPS (last access: 18 February 2021), 2010.
Van de Wauw, J., Baert, G., Moeyersons, J., Nyssen, J., De Geyndt, K., Nurhussen, T., Amanauel, A., Poesen, J., and Deckers, J.: Soil-landscape relationships in the basalt-dominated highlands of Tigay, Ethiopia, Catena, 75, 117–127, 2008.
Virgo, K. J. and Munro, R. N.: Soil and erosion features of the Central Plateau region of Tigrai, Ethiopia, Geoderma, 20, 131–157, 1978.
Wadoux, A. M. J. C., Minasny, B., and McBratney, A. B.: Machine learning for digital soil mapping: Applications, challenges and suggested solutions, Earth Sci. Rev., 210, 103359, https://doi.org/10.31223/osf.io/8eq6s, 2020.
Westphal, E.: Agricultural Systems in Ethiopia, Agricultural Research Report 826, https://edepot.wur.nl/361350 (last access: 19 March 2021), 1975.
WLRC-AAU (Water and Land Resource Centre-Addis Ababa University): Land use/land cover mapping, change detection and characterization of Ethiopia, Water Land Resource Centre, Addis Ababa University, Addis Ababa, Ethiopia, 2018.
Wright, M. N. and Ziegler, A.: Ranger: A fast implementation of random forests for high dimensional data in C and R, J. Stat. Softw., 77, 1–17, https://doi.org/10.18637/jss.v077.i01, 2017.
Zwedie, E.: Selected physical, chemical, and mineralogical characteristics of major soils occurring in Chercher highlands, Eastern Ethiopia, Ethiopian Journal of Natural Resources, 1, 173–185, 1999.
Zewdie, E.: Properties of major Agricultural Soils of Ethiopia, Lambert Academic Publishing, Germany, 2013.
- Abstract
- Introduction
- Methods
- Results and discussion
- Conclusions
- Appendix A: Legacy soil profile data distribution
- Appendix B: Environmental covariates
- Appendix C: Probability of occurrence of reference soil groups
- Data availability
- Author contributions
- Competing interests
- Disclaimer
- Acknowledgements
- Financial support
- Review statement
- References