the Creative Commons Attribution 4.0 License.
the Creative Commons Attribution 4.0 License.
 | 22 Feb 2024
Mineral dust and pedogenesis in the alpine critical zone
Abigail A. Santis
Elsa J. Soderstrom
Michael J. Tappa
Ann M. Bauer
The influence of mineral dust deposition on soil formation in the mountain critical zone was evaluated at six sites in southwestern North America. Passive samplers collected dust for 2 years, and representative soil and rock were gathered in the vicinity of each dust sampler. All materials (dust, soil, and rock) were analyzed to determine their mineralogy (with X-ray diffraction), geochemistry (with inductively coupled plasma mass spectrometry (ICP-MS)), and radiogenic isotope fingerprint ( and εNd). In addition, the grain size distribution of dust and soil samples was determined with laser scattering, and standard soil fertility analysis was conducted on the soil samples. Results reveal that minerals present in the dust but absent in the local bedrock are detectable in the soil. Similarly, the geochemistry and isotopic fingerprint of soil samples are more similar to dust than to local bedrock. End-member mixing models evaluating soil as a mixture of dust and rock suggest that the fine fractions of the sampled soils are dominated by dust deposition, with dust contents approaching 100 %. Dust content is somewhat higher in soils compared to bedrock types more resistant to weathering. These results emphasize the dominant control that mineral dust deposition can exert on pedogenesis in the mountain critical zone.
- Article
(9684 KB) - Full-text XML
-
Supplement
(1051 KB) - BibTeX
- EndNote


Soils are the foundation of high-mountain ecosystems. Knowledge of the factors that contribute to soil formation is, therefore, important to understanding the geo-ecology of mountain environments, particularly in a time of rapid climate change (Hagedorn et al., 2010; Singh et al., 2023; Tito et al., 2020). In the standard factorial model of soil formation (Jenny, 1983; Huggett, 1975), a key variable contributing to the properties of a soil is the nature of the soil parent material. Given their location on isolated topographic highs, alpine soils are systems in which the array of possible mineral parent materials can be simplified to two options: local bedrock and mineral dust delivered by eolian processes (Derry and Chadwick, 2007). In periglacial mountain environments with low mean annual temperatures, rates of chemical weathering are reduced even though physical weathering through frost shattering may be enhanced (Dixon and Thorn, 2005). As a result, in settings where the local bedrock is relatively resistant to weathering, mineral dust deposition exerts a correspondingly larger influence on the accumulation of fine material and the enhancement of fertility that accompany soil formation (Arvin et al., 2017).
The southwestern United States is a significant dust emitter due to its arid climate and sparse vegetative cover (Duniway et al., 2019). Dust derived from lowland landscapes is transported downwind toward mountain environments, where field studies have evaluated the significance of dust deposition. For example, work in mountains surrounded by the Mojave Desert has illuminated the role of dust-influenced soils in regional biogeochemical cycling (Hirmas and Graham, 2011). In the San Juan Mountains of southwestern Colorado, comparison of dust and soil chemistry has demonstrated that dust is an important control on vegetation, soil, and surface water chemistry and supported the conclusion that dust comprises as much of 40 % of the total mass of the mountain soils in this region (Lawrence et al., 2011, 2013). In central Colorado, mineralogical and geochemical analyses of mountain soils have further emphasized the importance of dust as a soil parent material (Muhs and Benedict, 2006; Litaor, 1987). Similarly, in northern Utah, soil profiles developed over siliciclastic bedrock were found to contain 50 % to 80 % dust, which has altered the physical properties of the soil and enhanced soil fertility through the addition of base cations (Munroe et al., 2020).
Collectively, these studies, along with others from locations around the world (e.g., Peer et al., 2022; Küfmann, 2003; Greilinger and Kasper-Giebl, 2021; Johnston, 2001; Arvin et al., 2017; Soderberg and Compton, 2007; Stres et al., 2013), emphasize how dust deposition impacts the mountain critical zone (CZ), defined as the “dynamic interface between the solid Earth and its fluid envelopes” (Brantley et al., 2007) and underscore the importance of dust to soil development (Simonson, 1995). However, previous studies focused on single localities, understandably constrained by the complexity inherent in documenting a ubiquitous process like dust deposition across a broad region. This narrow spatial scope diminishes the utility of prior work for supporting broader conclusions, obviates inferences about the role of dust deposition in different settings, and obscures the potential role of lithology as a regulator of the balance between local rock weathering and dust deposition in alpine pedogenesis. Accordingly, this study was designed to develop a comprehensive understanding of the effects of long-term dust deposition on pedogenesis in the mountain CZ across a range of lithologies in the southwestern United States.
This research is centered on a network of six passive dust collectors (designated DUST-11 through DUST-16) deployed on mountain summits and high ridgelines with varying bedrock lithologies throughout the southwestern United States (Fig. 1, Table 1). All sites display abundant geomorphic evidence of Pleistocene glaciation; however, all but one of them are devoid of glaciers today (Osborn and Bevis, 2001). Recent work has quantified the modern dust flux to these sites and determined that much of the dust is derived from lowland landscapes in the surrounding region (Munroe et al., 2023). Dust collectors were intentionally positioned in windswept locations in alpine settings above the Pleistocene glacier limit. The interpolated 800 m resolution PRISM climate dataset (PRISM Climate Group, 2020) was used to describe mean annual temperature (Tmean) and precipitation (Pmean), as well as the ratio of winter to total summer + winter precipitation (fwin) at each site because direct climate data are not available.
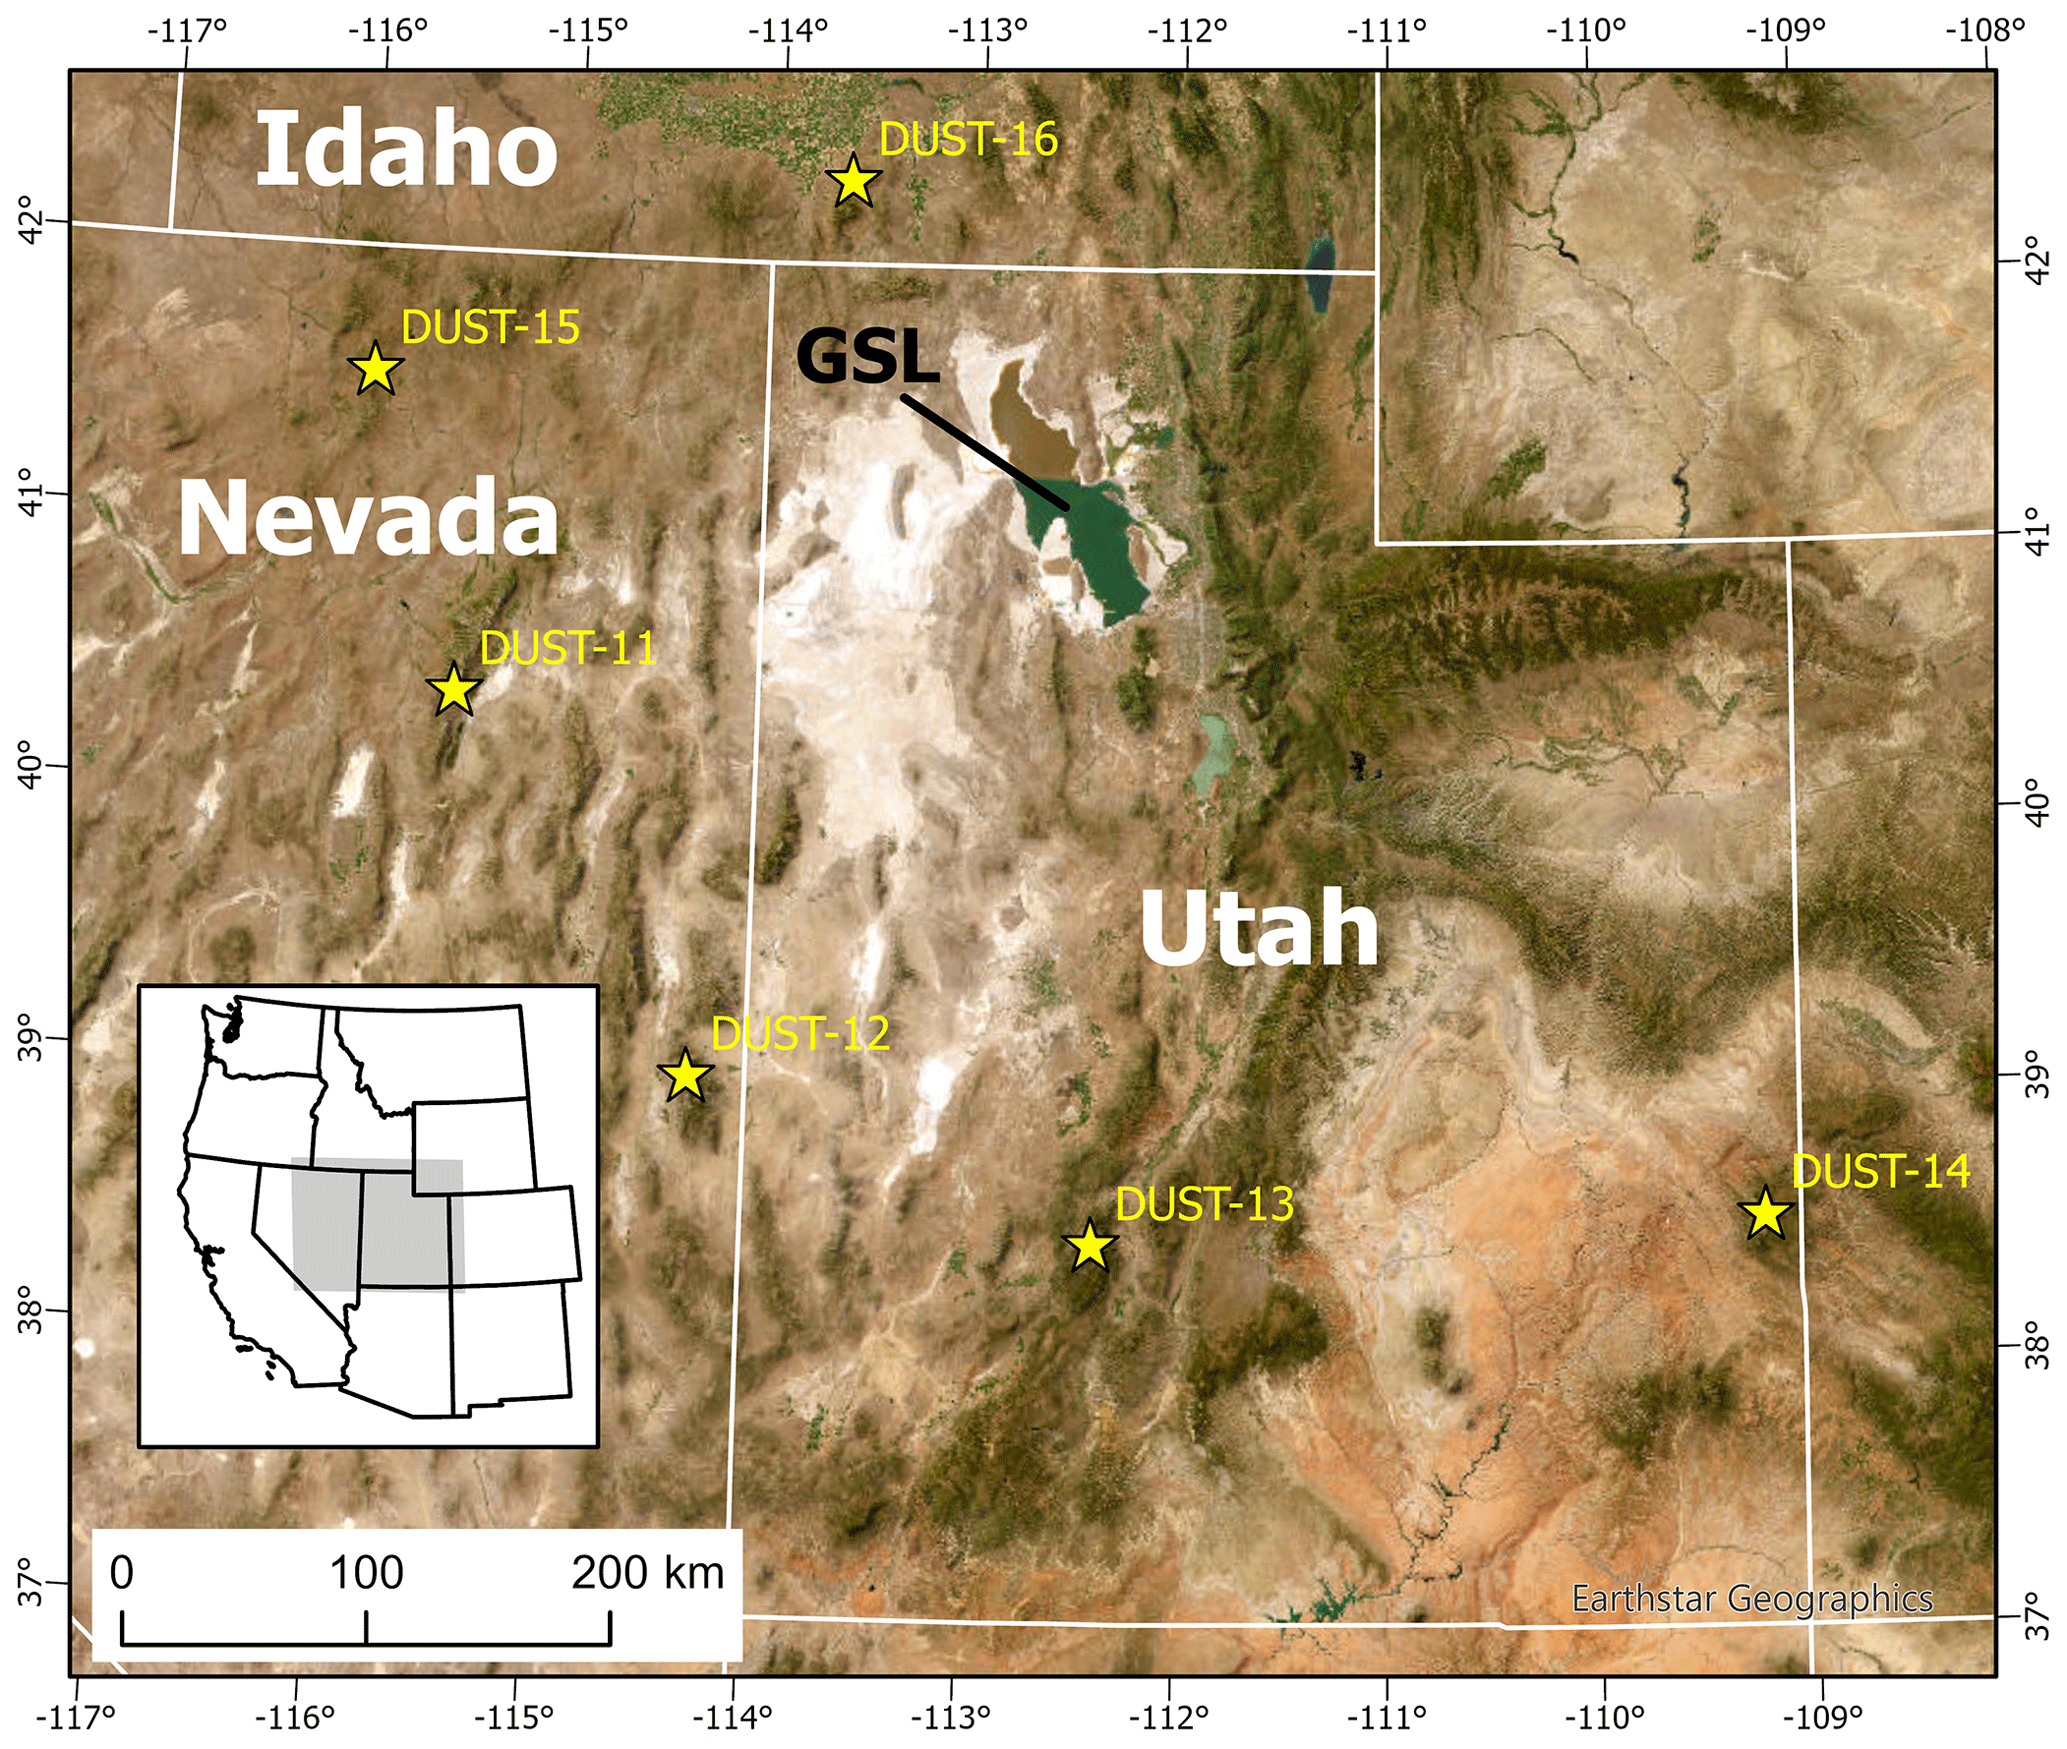
Figure 1Map presenting the locations of the six passive dust collectors utilized in this study (yellow stars). Background is a true-color satellite image from Earthstar Geographics (World Imagery – Overview, 2023). Inset shows the location of the main map (gray rectangle) in the western United States. The states of Utah, Nevada, and Idaho are identified. GSL denotes the Great Salt Lake in northern Utah.
Table 1Locations of dust collectors, dates of deployment, and climate data.
a WGS 84. b .
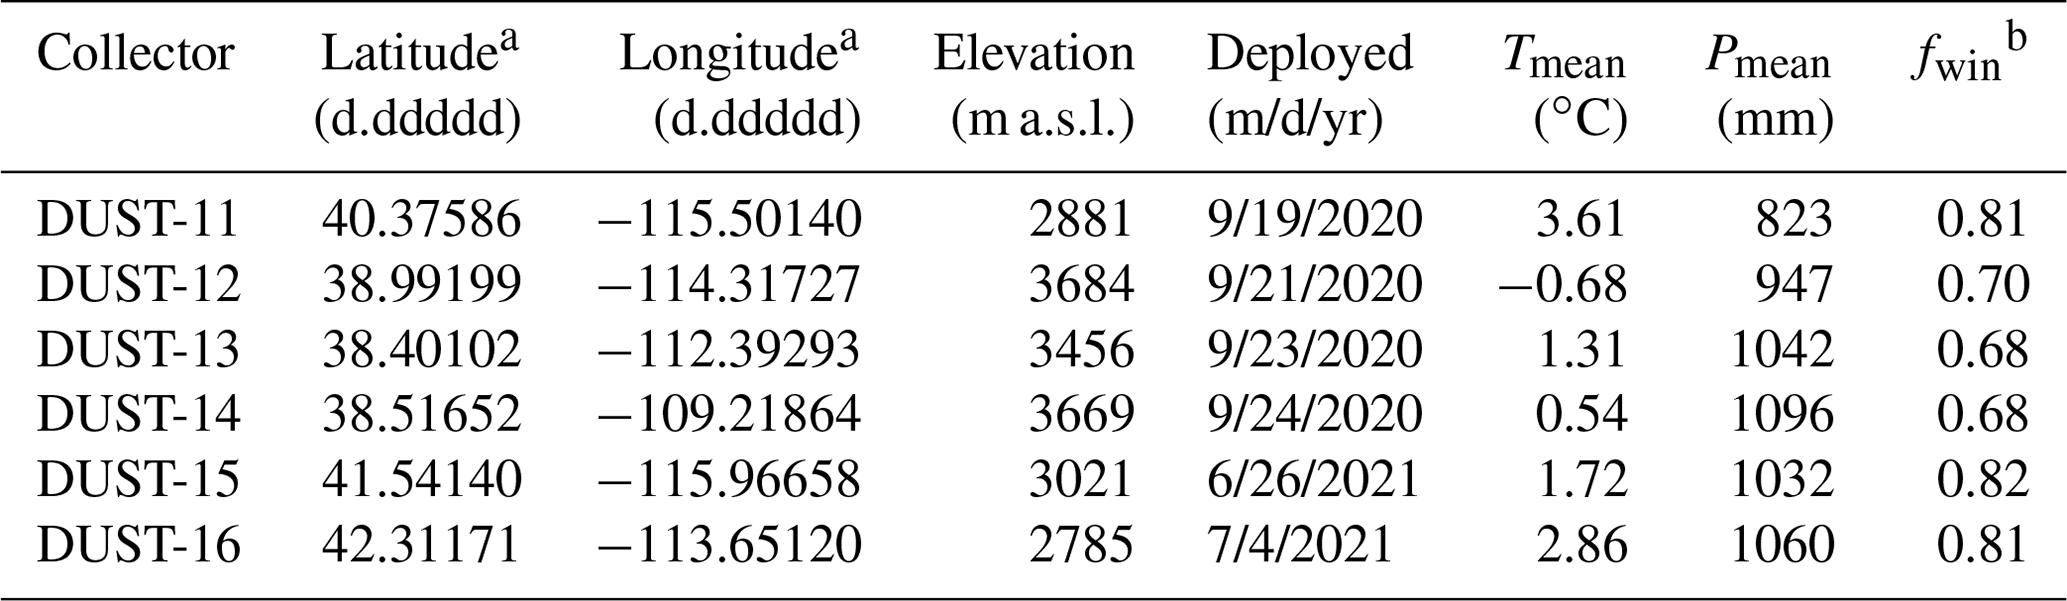
The easternmost collector, DUST-14, is located in the La Sal Mountains of eastern Utah, on the Colorado Plateau (Figs. 1 and 2). These mountains are comprised of three topographically distinct laccolithic masses of igneous rock that intruded sedimentary rocks during the Laramide Orogeny in the Oligocene (Hunt and Waters, 1958). Culminating with Mount Peale at 3877 m, the La Sal Mountains are the second highest mountain range in Utah. The DUST-14 collector is situated at an elevation of 3669 m atop hornblende plagioclase trachyte (Ross et al., 1998) in a turf-covered saddle to the northeast of Manns Peak. The area around DUST-14 is denoted as rubble land on the United States Department of Agriculture (USDA) soil map. Tmean for this location is 0.54 ∘C, Pmean is 1096 mm, and fwin is 0.68 (Table 1).
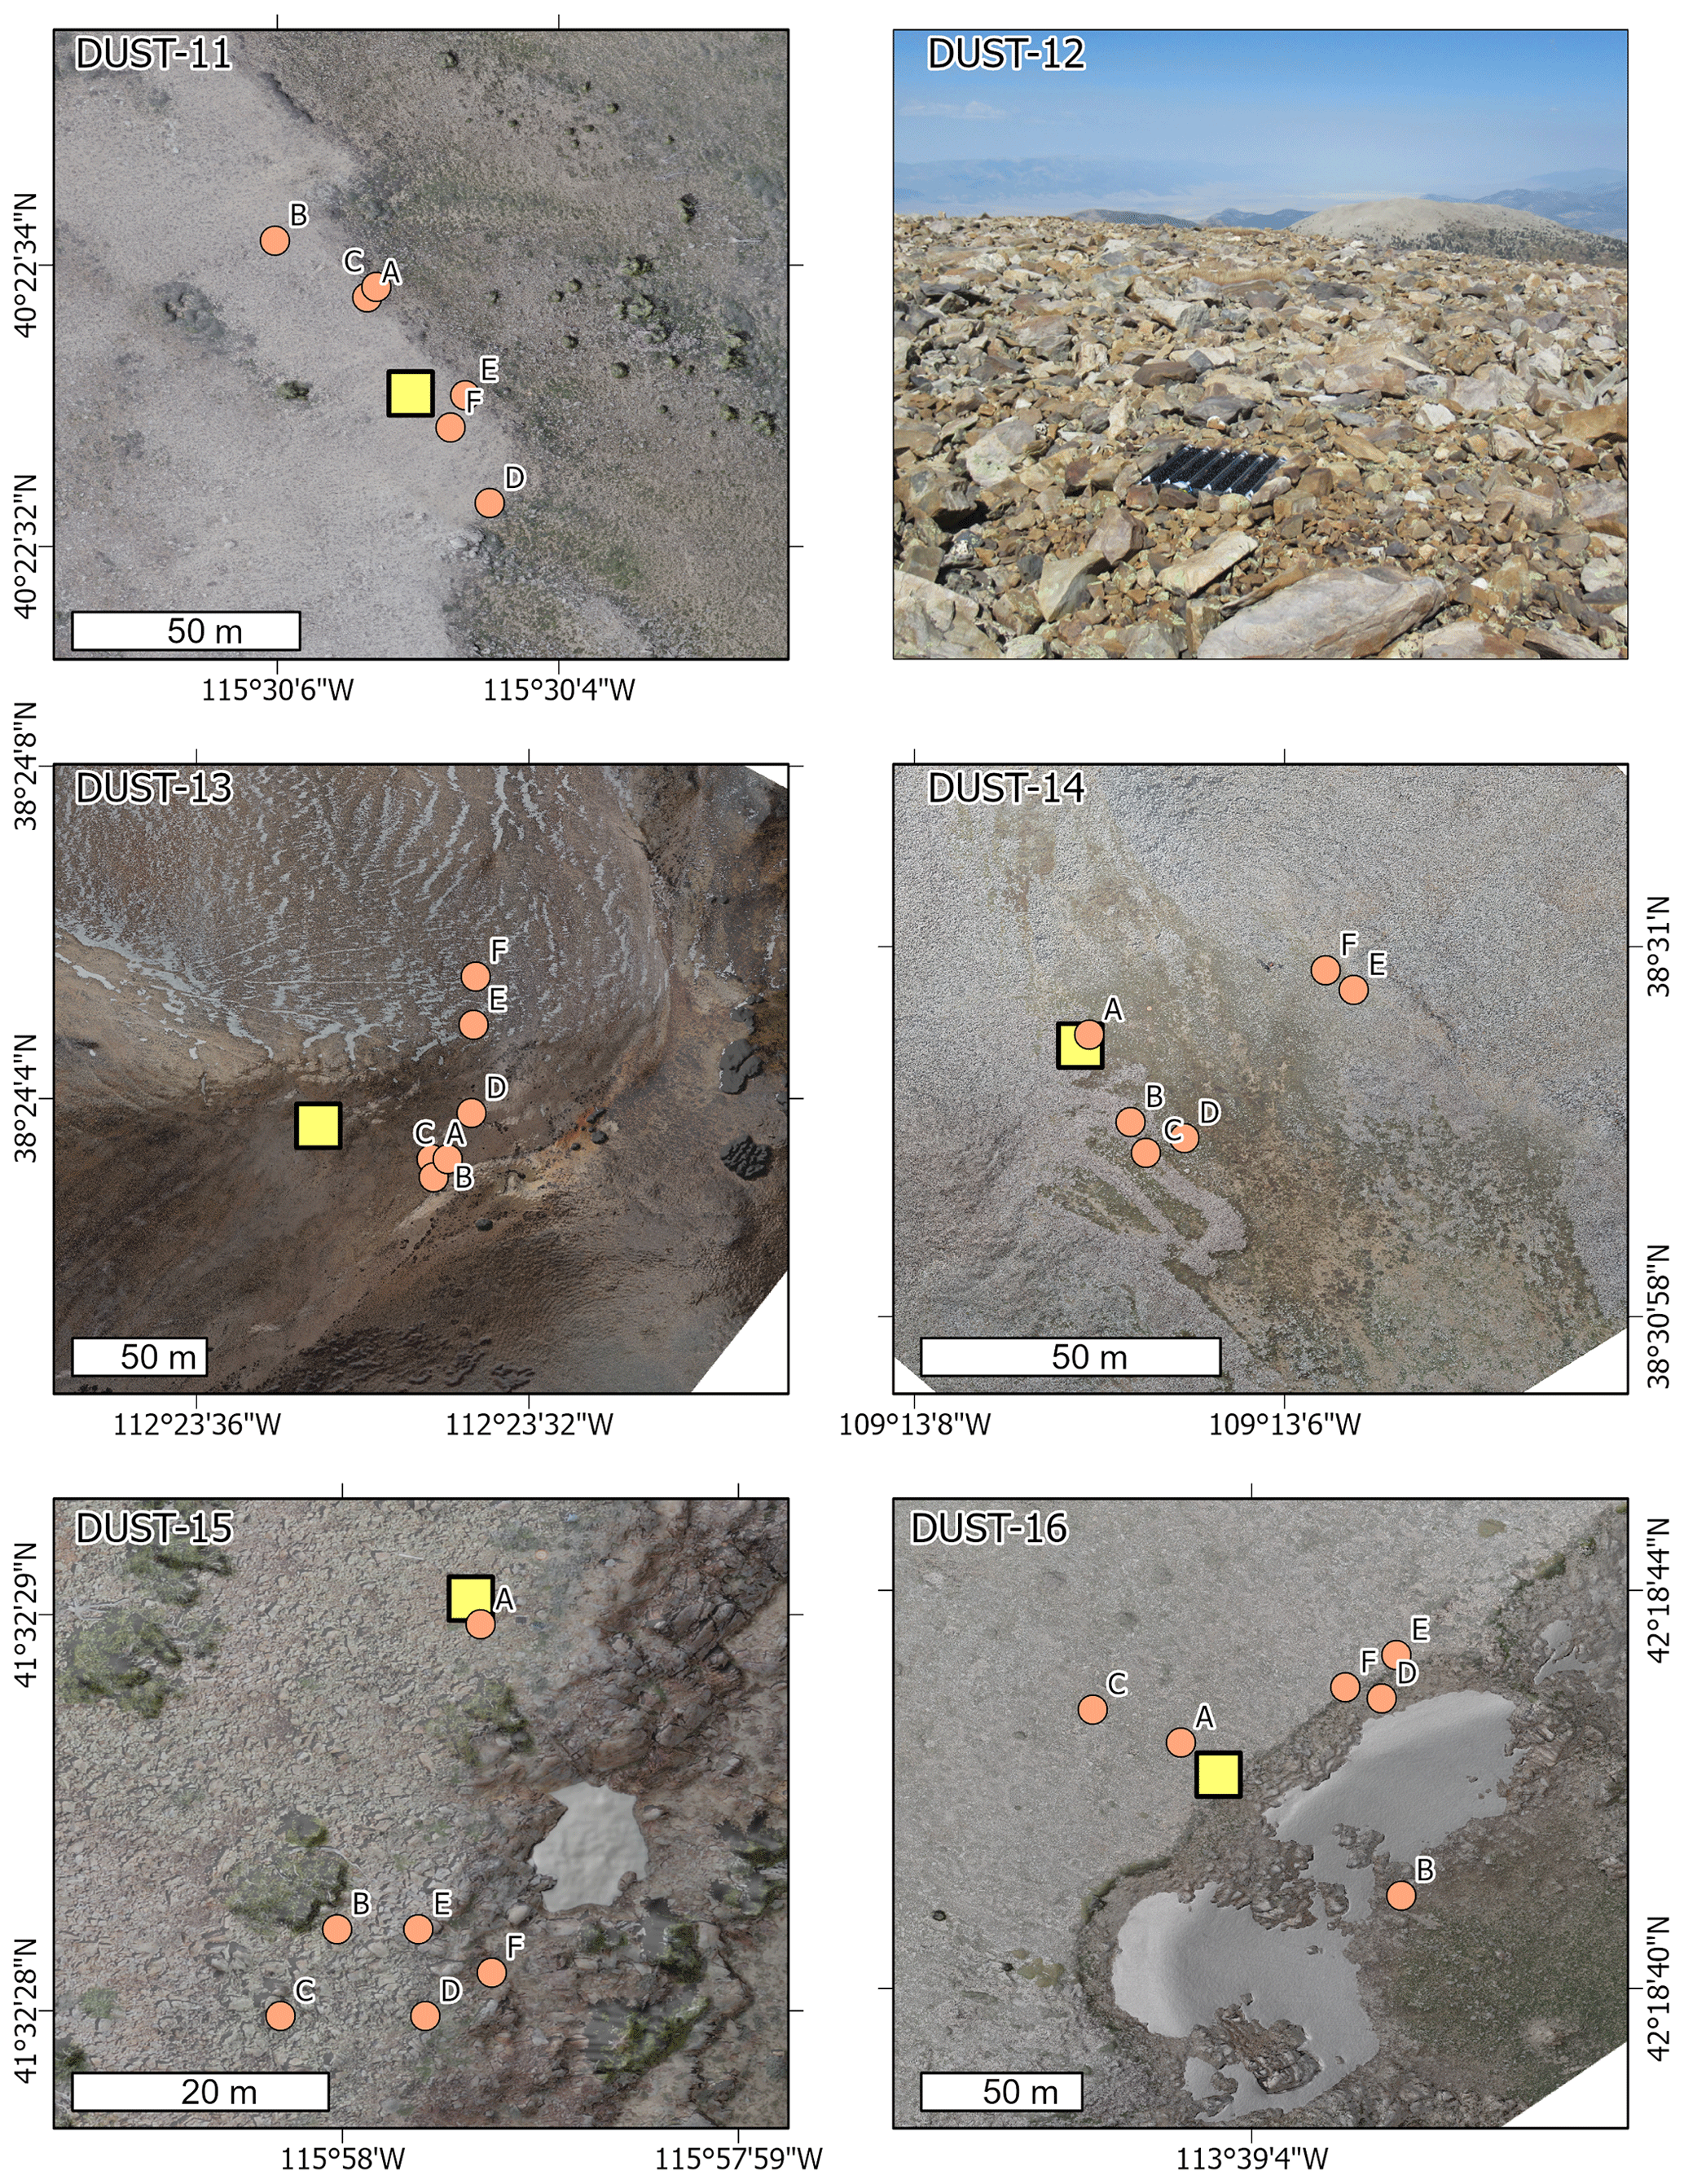
Figure 2Aerial images of the six study areas. For all but DUST-12, the locations of the dust collector (yellow square) and soil samples (orange circles) are presented over a seamless orthophoto mosaic created from pictures taken from an un-crewed aerial vehicle (UAV). For DUST-12, which is located in a national park where UAV operations are prohibited, the collector is shown in a ground-level photograph.
DUST-13 is located in the Tushar Mountains of southwestern Utah (Figs. 1 and 2), the third highest mountain range in the state. These mountains are the remnants of stratovolcanoes that formed between the Oligocene and the early Miocene (Cunningham et al., 2007). The highest summit in the Tushar Mountains is Delano Peak at 3710 m. DUST-13 sits on bedrock mapped as trachyte at an elevation of 3456 m to the north of Bullion Pasture. Soils have not been officially mapped at DUST-13, and the landscape around the collector is nearly devoid of vegetation. The location of DUST-13 is warmer than that of DUST-14 (Tmean of 1.31 ∘C), but Pmean (1042 mm) and fwin (0.68) are similar (Table 1).
DUST-12 was deployed on the northeast shoulder of Wheeler Peak in the South Snake Range of eastern Nevada (Figs. 1 and 2). Wheeler Peak, the centerpiece of Great Basin National Park, reaches an elevation of 4285 m, the second highest mountain in Nevada. DUST-12 is situated in a periglacial block field developed over quartzite bedrock (Hose and Blake, 1976) at an elevation of 3684 m to the north of the main summit. The sole remaining glacier in the region is located ∼200 m below and ∼1 km to the southeast of the collector (Osborn and Bevis, 2001). At DUST-12, the soil is mapped as the Wheelerpek series, a Lithic Cryothent. These soil profiles, which form over quartzite, only occur in the Snake Range of Nevada, where they cover ∼1000 ha. A typical profile consists of a pair of A horizons with Munsell hues of 10YR, totaling 23 cm, over a thin C horizon resting on bedrock. Gravel content is high, a subangular blocky structure is weakly developed, and mean annual soil temperature is from 1 to 4 ∘C (Soil Survey Staff, Natural Resources Conservation Service, https://soilseries.sc.egov.usda.gov/OSD_Docs/W/WHEELERPEK.html, last access: 23 January 2024). According to the PRISM dataset, this is the coldest of the six sites, with Tmean of −0.68 ∘C. It is also drier than the locations in southern Utah, with Pmean of 947; however, fwin is nearly the same at 0.70 (Table 1).
DUST-11 is positioned at the south end of the Ruby Mountains in eastern Nevada, 180 km northwest of DUST-12 (Figs. 1 and 2). The Ruby Mountains are a metamorphic core complex of Paleozoic quartzites and carbonates, with granitic intrusions (Litherland and Klemperer, 2017). The protoliths of these rocks were emplaced during the Cambrian and Ordovician, followed by metamorphism and eventual uplift during the Neogene (Litherland and Klemperer, 2017). The Ruby Mountains reach elevations of 3470 m. DUST-11 is positioned at an elevation of 2881 m along a contact between quartzite and granitic bedrock on the sparsely vegetated southeastern shoulder of Green Mountain just outside the boundary of the federally protected Ruby Mountain Wilderness Area. The area around the DUST-11 collector is mapped as the Lowemar series, a Xeric Humicryept in USDA soil taxonomy. These soil profiles are found in upland landscapes and form in residuum derived from metamorphic rocks. The typical pedon for the Lowemar series contains multiple gravelly A horizons with Munsell hues of 10YR, totaling 50 cm in thickness, over a C horizon of cobbly loamy fine sand (Soil Survey Staff, Natural Resources Conservation Service, https://soilseries.sc.egov.usda.gov/OSD_Docs/L/LOWEMAR.html, last access: 30 January 2024). This is the warmest of the six sites, with Tmean of 3.61 ∘C, and also the driest, with Pmean of 823 mm. Summers here are much drier relative to winters, with fwin of 0.81 (Table 1).
DUST-15 is located in the Independence Mountains of northern Nevada (Figs. 1 and 2), which straddle the hydrologic divide between the Great Basin and the Snake River system. The area around DUST-15 is dominated by Paleozoic quartzite bedrock, although a variety of Ordovician rocks including shales and cherts are present elsewhere in the range. The highest summit in the Independence Mountains is McAfee Peak at 3182 m. The DUST-15 collector sits at an elevation of 3021 on the narrow ridgeline extending northward from McAfee Peak. Clumps of stunted Pinus flexilis are present in the vicinity of DUST-15, and the surrounding landscape is mapped as an association of rubble land with the Longhike and Jarbidge soil series. These Haplocryoepts, which form in residuum derived from quartzite and rhyolite, cover 15 000 ha of mountain land in northern Nevada. The Jarbidge series, in particular, has a type locality on quartzite bedrock, making it likely to be the best match for the actual soils sampled at DUST-15. Jarbidge soil profiles feature a pair of light-colored (10YR ) A horizons over a very-pale-brown Bw horizon resting on bedrock (Soil Survey Staff, Natural Resources Conservation Service, Jarbidge series – https://soilseries.sc.egov.usda.gov/OSD_Docs/J/JARBIDGE.html, last access: 30 January 2024, Longhike series – https://soilseries.sc.egov.usda.gov/OSD_Docs/L/LONGHIKE.html, last access: 30 January 2024). From the PRISM dataset, Tmean is 1.72 ∘C, Pmean is 1032 mm, and considerably more precipitation arrives in winter than summer (fwin of 0.82, Table 1).
The DUST-16 collector was deployed in the Albion Mountains of southern Idaho (Figs. 1 and 2). This range is part of the Albion–Raft River–Grouse Creek metamorphic core complex, consisting of Precambrian granite, granitic gneiss, schist, and amphibolite (Miller, 1980). The Albion Mountains reach maximum elevations of 3150 m. DUST-16 is located at 2785 m on quartzite bedrock at the southern edge of the gently sloping, partially vegetated upland summit of Mount Harrison. There is no official soil map for the DUST-16 site. The climate here is similar to that at DUST-15, with Tmean of 2.86 ∘C, Pmean of 1060 mm, and fwin of 0.81 (Table 1).
3.1 Field methods
3.1.1 Dust collection
Each study site was equipped with an identical passive dust collector designed and constructed at Middlebury College (Munroe, 2022). These collectors are variations of the classic marble dust trap (Reheis and Kihl, 1995) altered for use in high-precipitation mountain environments (Fig. 3). Each is a 56 cm×56 cm polycarbonate tray, composed of five 7 cm deep troughs with V-shaped cross-sections. Each trough is filled with ∼400 black glass beads. These beads trap dust and retain it while heating in the sun to evaporate water and leave concentrated dust at the bottom. The upper part of each trough has a row of small drilled holes to allow for water drainage in times of excessive precipitation. Gasketed panels can be removed from the end of each trough to facilitate dust removal. The collectors are positioned on a relatively flat surface and held down on the edges by rocks. Each is equipped with an automated temperature data logger to constrain the duration of winter snow cover. Full technical designs for the collectors have been previously published (Munroe, 2022).
Figure 3Photograph of the DUST-12 collector showing the sampler design (five troughs with V-shaped cross sections filled with black glass marbles) and the typical ground-level deployment. In the background a dust storm lifting material from the ground surface in the Spring Valley and transporting it to the east (right) into the North Snake Range is visible.
Dust is removed from a collector by washing with distilled water. The beads are removed with a slotted spoon, transferred to a colander, and rinsed into an acid-washed 1 L Nalgene bottle. After the beads are removed, each trough is rinsed with additional water, and the collector is scrubbed with a small brush. The process yields 5 L of water with suspended dust that is shipped back to the laboratory for analysis.
Collectors DUST-11 through DUST-14 were deployed in the fall of 2020 (Table 1). DUST-15 and DUST-16 were added in July 2021, at the same time that DUST-11 through DUST-13 were emptied. All collectors were emptied again in the fall of 2021 (an annual sample for DUST-14 and summer samples for the others), in July 2022 (winter dust samples), and in October 2022 (summer dust samples). This approach yielded a total of 21 dust samples (Fig. S1 in the Supplement).
3.1.2 Soil and rock collection
In July 2022, samples containing a mixture of rock and soil spanning depths of 0–20 cm were collected within ∼50 m of each dust collector. At DUST-12, five samples (A–E) were collected, and at the other sites, six samples (A–F) were gathered (Fig. 2). Sampling involved canvassing the area around each collector to identify locations where it was possible to collect a representative soil sample with a hand shovel. Each sample was collected in a new 1 L plastic bag, and the sampling position was recorded with a GPS. Because exposures of local bedrock are rare in the periglacial landscapes surrounding each collector, pebbles contained within each soil sample were used to represent the underlying bedrock. This assumption is considered to be acceptable given the presumably slow rates of chemical weathering in these cold, high-elevation environments.
3.2 Laboratory methods
3.2.1 Dust samples and grain size analysis
All samples (water bottles from 21 dust collections and 35 bags of mixed soil and rock) were shipped back to Middlebury College for analysis. In the laboratory, bags of soil were separated into soil and rock using a 2 mm sieve. Material passing through the sieve was considered to be bulk soil, while larger fragments that did not pass were considered to represent the local bedrock. Roots and other organic materials were picked out and discarded along with any lichens scraped from the rock fragments. The <2 mm bulk soil samples were transferred to new plastic bags. The rocks sieved from each sample were processed in a jaw crusher and milled in a shatterbox. This process generated 35 bulk soil and 35 powdered rock samples.
The grain size distribution of the bulk soil samples was determined by laser scattering using a Horiba LA-950 analyzer. Approximately 5 cm3 of each homogenized sample was removed and reacted with 35 % H2O2 at room temperature for 7–10 d to remove organic matter. After the reaction had subsided, samples were centrifuged and rinsed with distilled water. Sodium hexametaphosphate (3 %) was added as a dispersant, and all samples were physically mixed and sonified prior to analysis. The LA-950 has an effective range from 10 nm to 3 mm, and a refractive index of 1.54 with an imaginary component of 0.1i was used in calculating the grain size distribution of each sample on a volume basis.
To isolate the size fraction of the bulk soil most closely matching the grain size distribution of the dust (medium silt and finer), a representative portion of each sample was thoroughly mixed with distilled water in a 1000 mL graduated cylinder. After settling for 2 min, a vacuum flask was used to collect the top 200 mL of water and suspended material. This subsample was then freeze dried. Once fully desiccated, these subsamples were gently ground by hand using a mortar and pestle before being ignited at 1000 ∘C for 30 min in a Leco TGA-701 thermogravimetric analyzer to determine percent loss on ignition (LOI). These subsamples from the original bulk soil are referred to from here on as soil samples.
Dust samples were concentrated from the 5 L of water from each collector by centrifuging at 6000 rpm, with repetitive decanting. Organic matter was eliminated by treatment with 35 % H2O2 over 7 d. After this step, samples were wet-sieved to 63 µm. Particles >63 µm were considered to be of local origin, whereas the material <63 µm was considered to be most likely to represent exotic mineral dust. Both fractions were dried and weighed to calculate depositional fluxes, and the <63 µm fraction was utilized for all subsequent analyses.
3.2.2 Soil fertility analysis
Roughly 150 cm3 of each homogenized bulk soil sample was removed and sent to the Agricultural and Environmental Testing Laboratory at the University of Vermont. Soil pH was measured at a 1:2 in 0.01 M CaCl2 and was converted to its water equivalent. Organic matter was measured by loss on ignition at 375 ∘C and was converted to its Walkley–Black organic matter equivalent. Morgan solution (pH 4.8 ammonium acetate) was used to extract soil nutrients at a 1:5 ratio for 15 min. P was analyzed through colorimetric flow injection. Other nutrients (P, K, Ca, Mg, S, Mn, B, Cu, Zn, Na, and Al) were measured by inductively coupled plasma atomic emission spectroscopy (ICP-OES).
3.2.3 Mineralogical analyses
All samples of soil, rock, and dust were examined for their mineralogical composition at Middlebury College using a Bruker D2 Phaser X-Ray Diffractometer (XRD) with a copper K-alpha radiation source and a LYNXEYE XE-T solid-state detector. As an initial check for consistency, soil samples A through C for each site were analyzed from 3 to 40∘ 2Θ through a 7 min scan at 30 kV and 10 mA. After confirming mineralogical homogeneity, a composite sample was created for each site by combining equal amounts of each soil sample (A–F and A–E for DUST-12). This process generated a ∼6 g composite sample for each collector (the composite for DUST-12 had a mass of 5 g). This approach was replicated with the rock samples to produce composite samples representative of the bedrock at each site.
The composite samples of rock and soil, as well as the individual dust samples, were scanned from 3 to 40∘ 2Θ continually for 13 min at 30 kV and 10 mA. Dust samples were wetted and mixed and transferred to a glass slide with an eye dropper before analysis; soil and rock powders were analyzed as random powders. XRD results were analyzed semi-quantitatively by measuring the area under the curve of diagnostic peaks for quartz (20.8 and 26.7∘ 2Θ) and feldspar (22.0 and 22.7∘ 2Θ). A mineralogical index (feldqtz) for each sample was then calculated as the quotient of the sum of the area beneath the two feldspar peaks and the sum of the area beneath the two quartz peaks.
3.2.4 Geochemical analyses
Concentrations of 50 major and trace elements in the rock, soil, and dust samples were determined by inductively coupled plasma mass spectrometry (ICP-MS) at the University of Utah's ICP-MS Metals and Strontium Isotope Facility. Dust samples from 2020 through 2021 were run in March 2022. Dust samples from 2021 through 2022 were run in January 2023. Rock and soil samples were run in May 2023. Each analysis run included standard reference material (SRM) 1643f (trace elements in water), four multiple chemical blanks, and four aliquots of standard AGV-1 (andesite). All samples were dissolved in HF before analysis; therefore, concentrations of Si were not measured. Mean recoveries for individual elements relative to the AGV-1 standard (Jochum et al., 2016) were 105 % (dust 2020–2021), 98 % (dust 2021–2022), and 97 % (rock and soil).
Strontium and neodymium isotope analysis was conducted in the Department of Geoscience at the University of Wisconsin-Madison using thermal ionization mass spectrometry (TIMS) and multi-collector inductively coupled plasma mass spectrometry (MC-ICP-MS). A total of 14 dust samples were analyzed during two analytical sessions in spring 2022 and winter 2023. Three samples were from winter 2020–2021, four were from summer 2021, one (DUST-14) was an annual sample from fall 2020 through fall 2021, and six were composite samples created from mixtures of winter 2021–2022 and summer 2022 dust weighted by the relative contributions of each of those seasons to the total annual mass. Composite samples of soil and rock from each of the six sites were also analyzed. Sample dissolution and column chemistry procedures were performed following the details presented in Munroe et al. (2020). Total procedural blanks ranged from 35 to 60 pg Sr and 93 to 225 pg for Nd. Because these blanks are insignificant (minimum sample-to-blank ratio of 1800), no blank corrections were applied.
Strontium isotopes were analyzed using a Micromass Sector 54 TIMS. Samples analyzed in spring 2022 were loaded onto Ta filaments with 1 M H3PO4. Samples analyzed in winter 2023 had lower Sr abundances so they were loaded onto Re filaments with a TaF activator and 1 M H3PO4. All samples were analyzed using a three-jump multi-collector dynamic analysis with exponential normalization to an at a A 88Sr+ ion signal. Errors (2-σ) reported for individual analyses are based on the in-run statistics and are reported as 2 standard errors (2 SE) of the mean based on the 120 isotopic ratios collected during the dynamic analysis.
Neodymium isotopes were analyzed using a Nu Instruments NP2 MC-ICP-MS with an enhanced sensitivity interface for samples diluted to a concentration of 50 ppb Nd in 2 % HNO3. A Cetac Aridus II nebulizer was used to aspirate the sample into the instrument; this produced a typical 144Nd+ ion signal of A. The neodymium isotope ratio measurement used a static multi-collector analysis routine consisting of collecting 40 ratios (10 s of integrations) with an initial on-peak-zero subtraction based on a 1 min analysis of the 2 % HNO3 blank acid conducted before the Nd isotope analysis. Instrumental mass bias was corrected by exponential normalization to . Every third sample was a bracketing standard consisting of the internal UW Ames II Nd isotope synthetic standard. A correction factor for the exponentially normalized Nd isotope ratios was calculated based on taking the ratio of the measured exponentially normalized Nd isotope ratios and the long-term Nd TIMS isotope ratio analysis of Ames II Nd for all Nd ratios. This correction factor was applied to samples and standards run as unknowns. The ratio and errors reported for the Nd isotope analyses are the average and 2 standard deviations based on two replicate analyses. Values of εNd were calculated using a of 0.512634 for modern CHUR (Salters and Stracke, 2004).
During the course of this study, the average ratio for the NIST SRM-987 Sr standard was 0.710267 ± 0.000015 (2σ; n=15) for Ta filaments and 0.710269 ± 0.000016 (2σ; n=25) for Re filaments. The USGS EN-1 standard yielded an average ratio of 0.709199 ± 0.000007 (2σ; n=4) on Ta filaments and 0.709196 ± 0.000018 (2σ; n=16) on Re filaments. For each filament type, both standards yield values that are consistent with the long-term averages for the lab. For Nd, external reference material JNdi and in-house standard Ames I Nd were analyzed along with samples and yield average values of 0.512112 ± 0.000017 (2σ; n=8) and 0.512143 ± 0.000010 (2σ; n=9), respectively, which are also consistent with the lab's long-term measurement averages of these standards.
3.2.5 Data reduction and statistics
Data were organized in MS Excel, analyzed in SPSS 28.1, and plotted using Grapher 19.4. Results from XRD analysis were viewed and compared in Eva 6.1 software. Summary statistics for geochemical results were calculated for each element quantified, for each site, and for each type of sample (dust, soil, rock). To reduce the complexity of the overall geochemical dataset, elemental abundances were normalized to Fe (Reheis et al., 2002; Munroe et al., 2020) and log10 transformed before a principal component analysis was conducted using a varimax rotation with all elements (n=50). A second principal component analysis was conducted using a subset of elements (also normalized to Fe and log10 transformed) demonstrated to not have been impacted by anthropogenic activity post European settlement (Reynolds et al., 2010). Non-parametric statistics were utilized to compare means between sample sites (Kruskal–Wallis test) and in evaluating correlations (Spearman rank correlation), given the generally small number of samples of each type.
Starting from the logic that these soil samples are a mixture of dust and rock end members (Crouvi et al., 2013), estimates of the dust fraction (fDust) within each soil sample were calculated from the ratio (δ) of immobile trace elements (Reynolds et al., 2010), as well as from the ratio feldsparquartz (Litaor, 1987) in the soil, dust, and rock using a two-end-member mixing equation following previous studies (Lawrence et al., 2011; Capo et al., 1998; Graustein and Armstrong, 1983):
In addition, fDust was also estimated from the ratio and from εNd using a concentration-weighted mixing model (Colville et al., 2011; Faure, 1997; Munroe et al., 2020):
where Rm is the value of or εNd for a particular sample. Ce is the average concentration of Sr or Nd measured in the dust and rock end members. R is the concentration-weighted average value of or εNd in the rock and dust end members. The sum of fDust and fRock equals 1; therefore, .
Mixing models were constructed with and εNd in average dust and rock end members, and fDust was determined for the mean or εNd in each soil sample, as well as ± 1 standard error. To visualize the error envelope of these estimations, the mixing models were also constructed with each of the individual dust samples (three at each of DUST-11, 12, and 13 and two at each of DUST-14, 15, and 16). Finally, the ensemble of estimates of fDust obtained by different approaches was averaged to produce an overall fDust estimate for each site.
4.1 Soil properties
The soil profiles at the six dust collectors are thin, silty, and minimally developed, consistent with their locations in high mountain environments. At DUST-11, 12, and 15, the sampled profiles closely match the series mapped for these locations. At DUST-13, 14, and 16, where soil maps are not available, profiles resemble those at the other sites, with gravelly 10YR A horizons and a shallow depth to bedrock. At DUST-11, 15, and 16, mostly bare soil was exposed directly at the ground surface with only sparse vegetation. In contrast, at DUST-12, soil was concentrated in vegetated islands generally <2 m in diameter surrounded by block fields of broken quartzite with open void space. At DUST-13, soil was present beneath a veneer of cobble gravel and was rarely exposed at the surface. At DUST-14, the soil surface was vegetated with continuous tundra vegetation.
In contrast to their visual similarity, bulk soils at the six dust collector sites vary considerably in their grain size distribution (Table 2). The samples from DUST-14 exhibit the coarsest mean grain size (118 µm), whereas the mean at DUST-12 is the finest (32 µm). Soils at DUST-11, 15, and 16 all have a mean grain size of ∼40 µm. Sand content is highest at DUST-14 (39 %) and lowest at DUST-12 and 15 (14 %). Silt content ranges from 55 % (DUST-14) to 77 % (DUST-12), and the abundance of clay size material (<2 µm) ranges from 6 % (DUST-14) to 13 % (DUST-13). Nearly all of the soil samples have textures of silt loam (Fig. 4), although one sample from DUST-14 is a sandy loam, and one from DUST-15 classifies as silt.
Table 2Summary of soil grain size and fertility data.
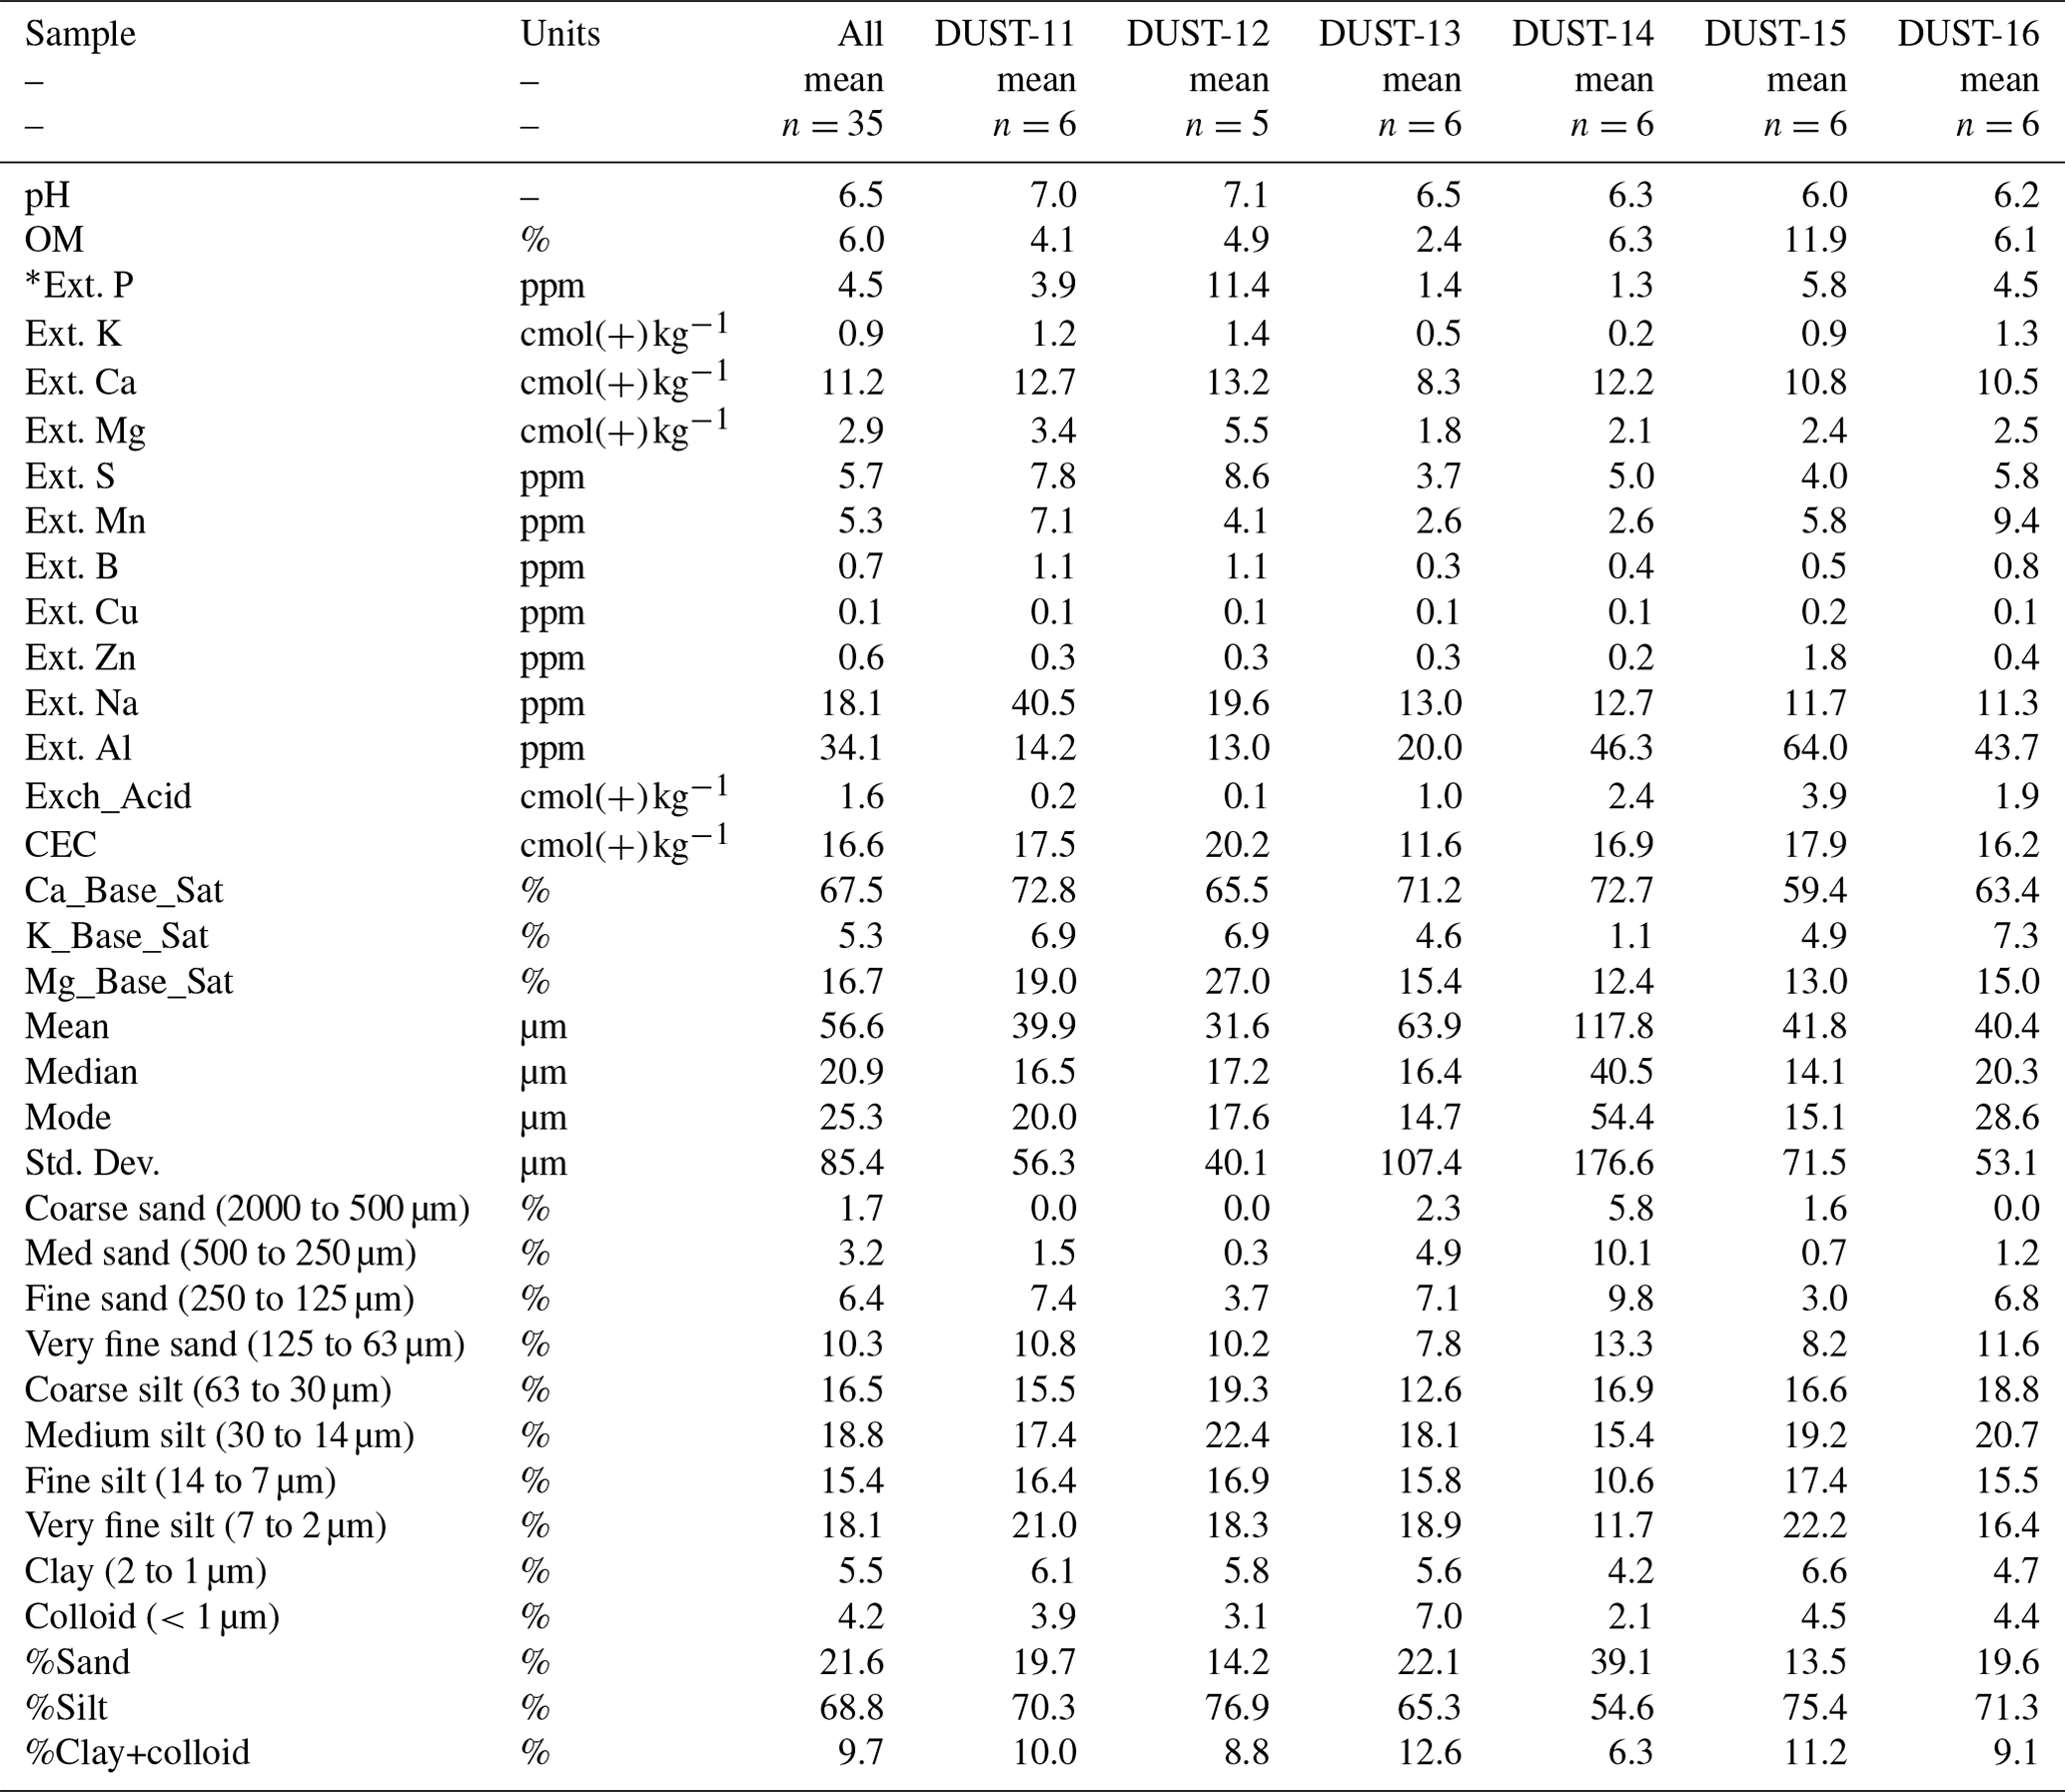
∗ Ext. denotes extractable.
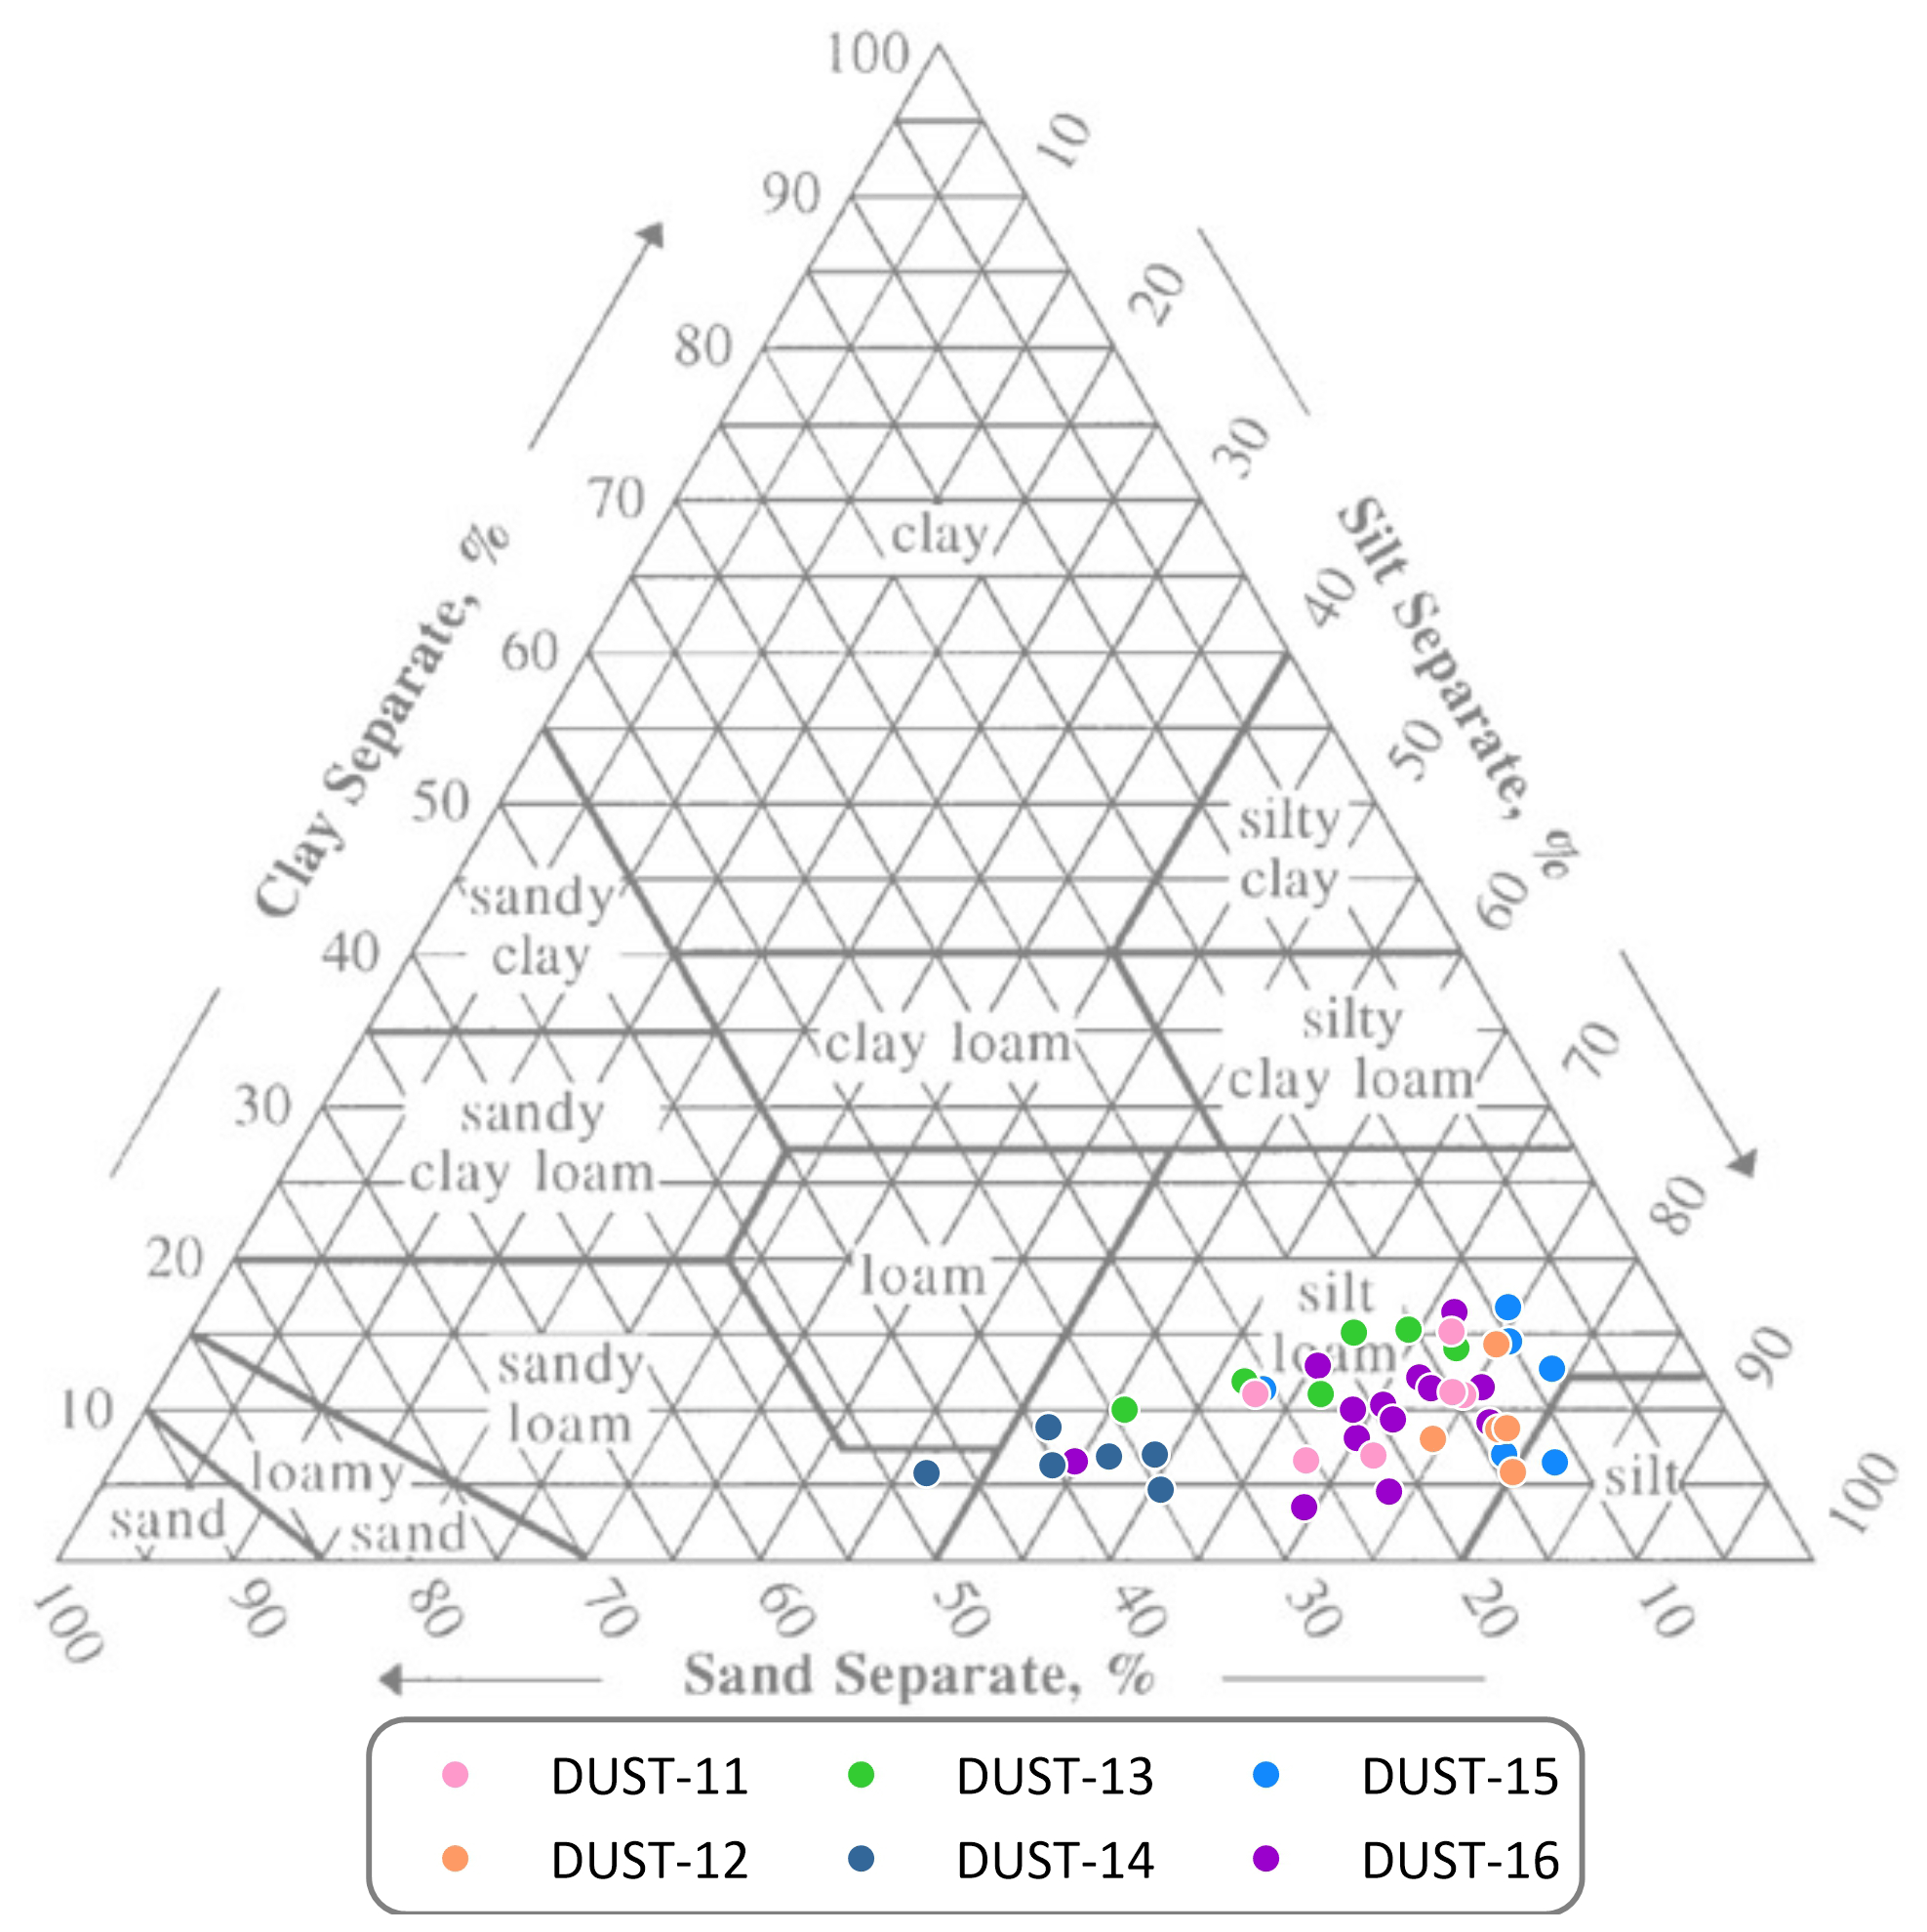
Figure 4Standard US Department of Agriculture ternary diagram presenting soil texture measurements at the six study sites. Nearly all samples fall in the silt loam texture class, with one sample from DUST-15 classifying as silt and one from DUST-14 as sandy loam.
Considerable chemical variation also exists between the bulk soils (Table 2, Fig. 5). Those at DUST-11 and 12 have the highest pH values (averaging 7), whereas DUST-15 soils are the most acidic (mean pH of 6). Organic matter content is much higher in bulk soil at DUST-15 (mean of 12 %) than at the other sites (2 %–6 %). Extractable P, K, Ca, Mg, S, and Mn are highest at DUST-12; the lowest values for extractable P and K are at DUST-14, and the lowest extractable Ca, Mg, S, and Mn are at DUST-13. Exchangeable acidity (Exch_Acid in Table 2) is highest at DUST-15, and overall cation exchange capacity (CEC) is highest at DUST-12.
4.2 Mineralogy
X-ray diffraction detected a range of mineral phases in the dust, soil (settled fine fraction), and rock samples including quartz, feldspars, mica, kaolinite, smectite, and illite (Fig. 6). Dust samples routinely contain all of these minerals, aside from smectite, which was only present in one collection from DUST-14. In contrast, the rock samples at DUST-11, 12, 15, and 16 reveal a nearly pure quartz composition, consistent with the quartzite bedrock mapped for these locations. At DUST-13 and 14, which are located over volcanic bedrock (trachyte), the rock sample exhibits XRD peaks for feldspar in addition to quartz.
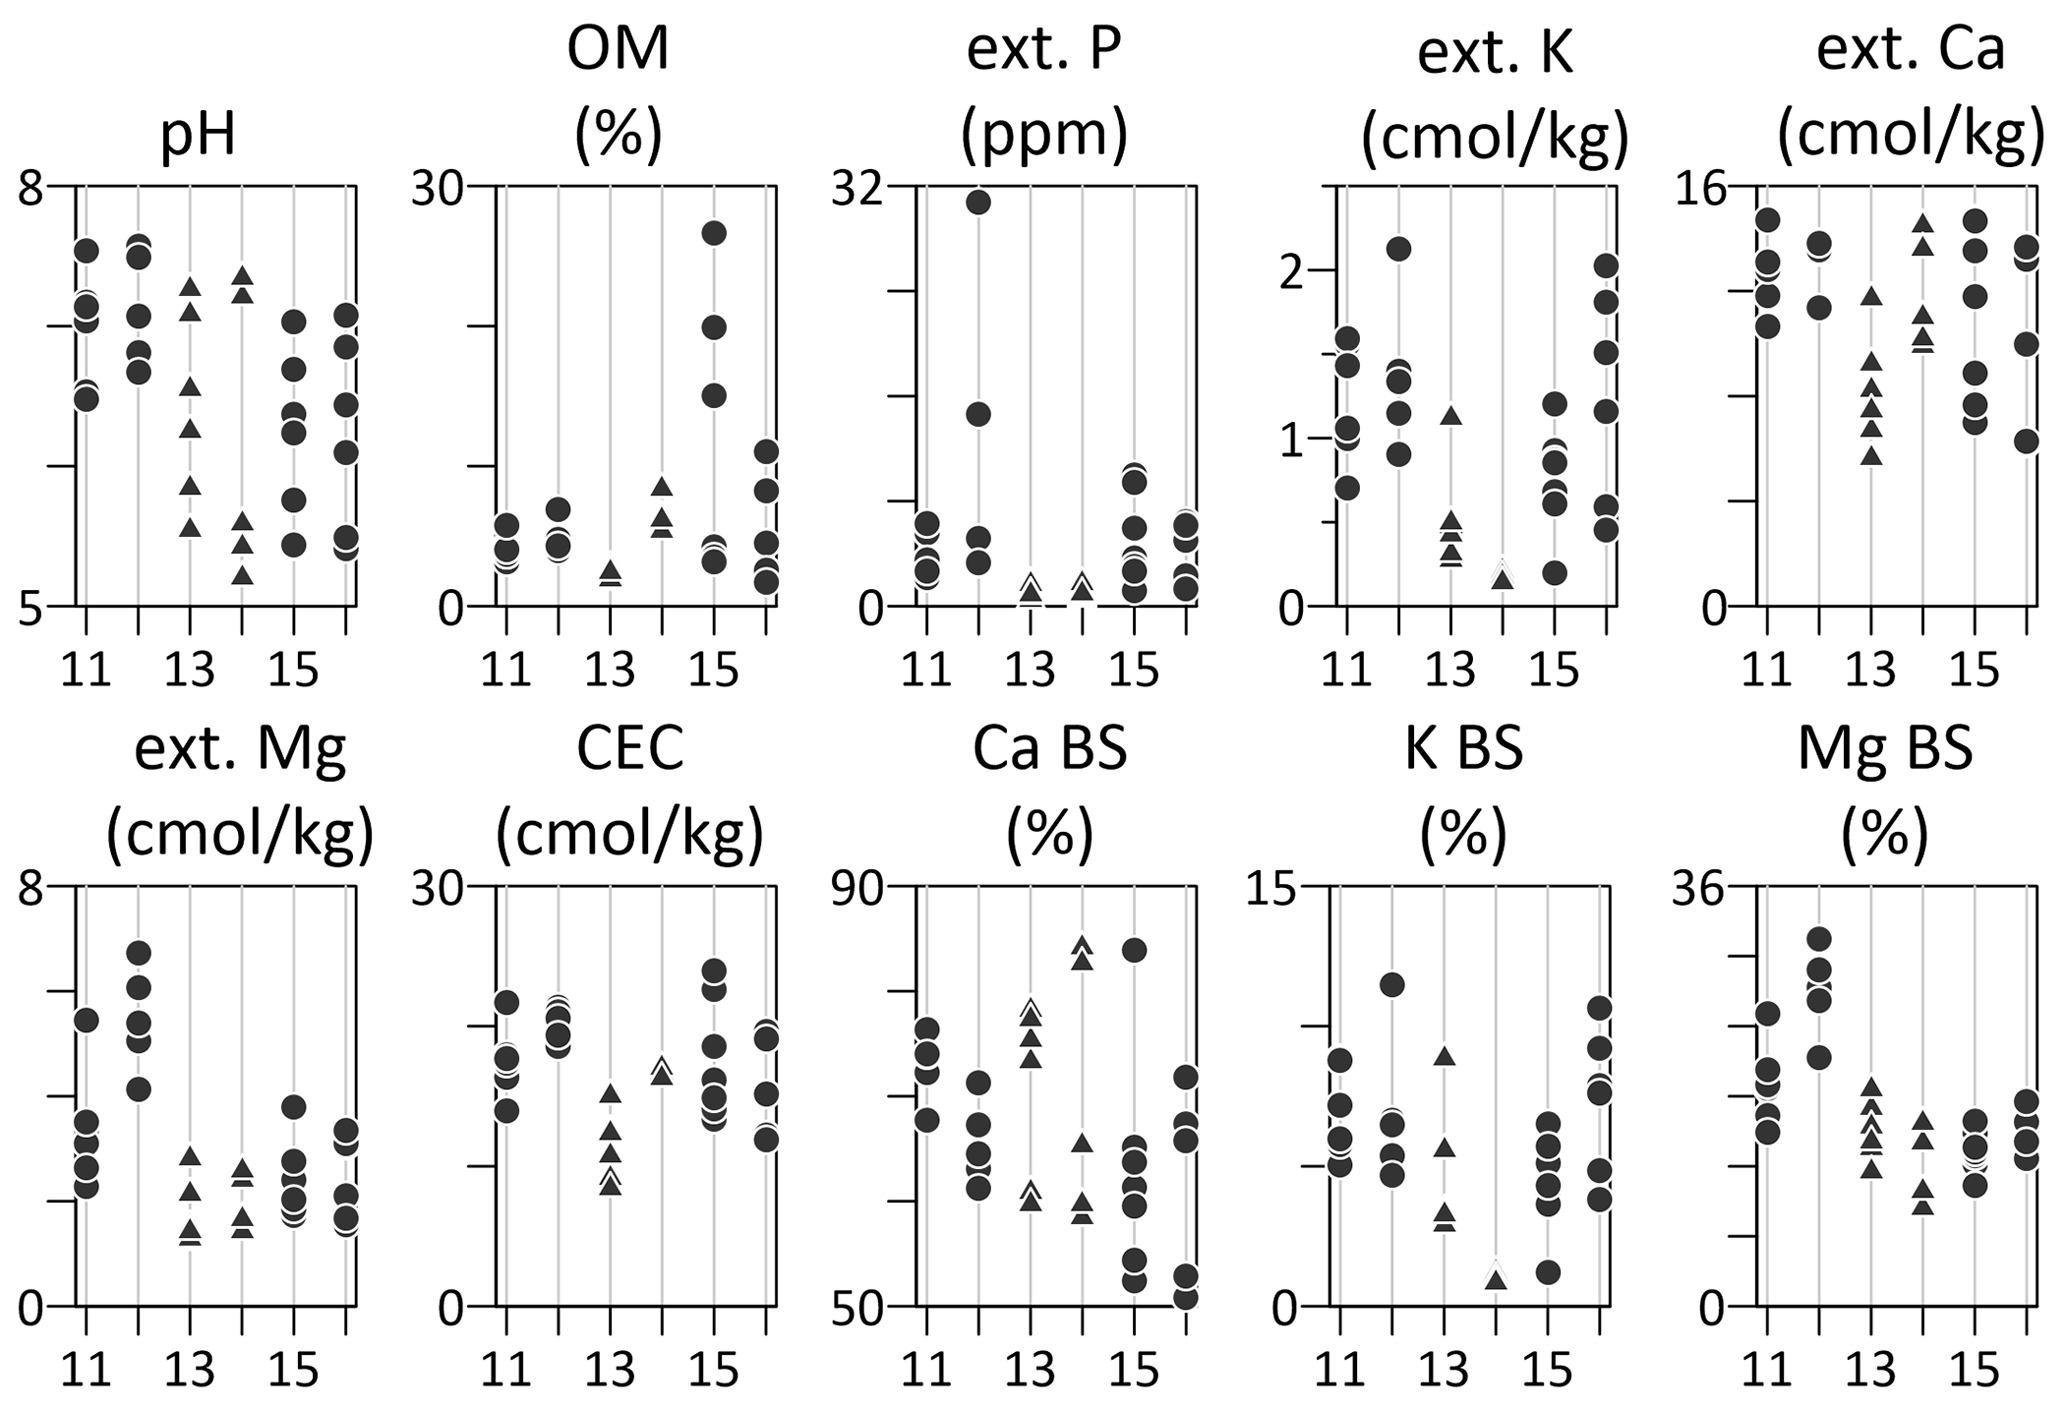
Figure 5Results of soil fertility measurements made at each of the study sites (11 through 16, x axis). Solid circles designate locations with quartzite bedrock; solid triangles denote trachyte bedrock at sites 13 and 14. OM is organic matter; ext. indicates extractable; CEC is cation exchange capacity; BS is base saturation.
Significantly, at all sites, soil samples contain minerals not present in the underlying rock. For example, feldspars are present in the soil at DUST-11, 12, 15, and 16 despite their absence in the bedrock. Illite is present in the soil at DUST-11, 13, 15, and 16; kaolinite is detectable in the soil at DUST-11, 13, and 15. On the other hand, the smectite detected in the first dust sample from DUST-14 (fall 2020 to fall 2021) is not present in the composite soil sample from this site.
Measuring the area under the curve of diagnostic peaks for quartz and feldspar provided a semi-quantitative approach to evaluating the XRD results (Table 3). At all sites except DUST-14, values of feldquartz are lowest in bedrock (∼0.04); at DUST-14 the ratio is elevated (2.46) by the large amounts of feldspar in the trachyte bedrock. Values are intermediate in all soil samples (∼0.5) and are higher in dust (∼0.9).
Table 3X-ray diffraction results.
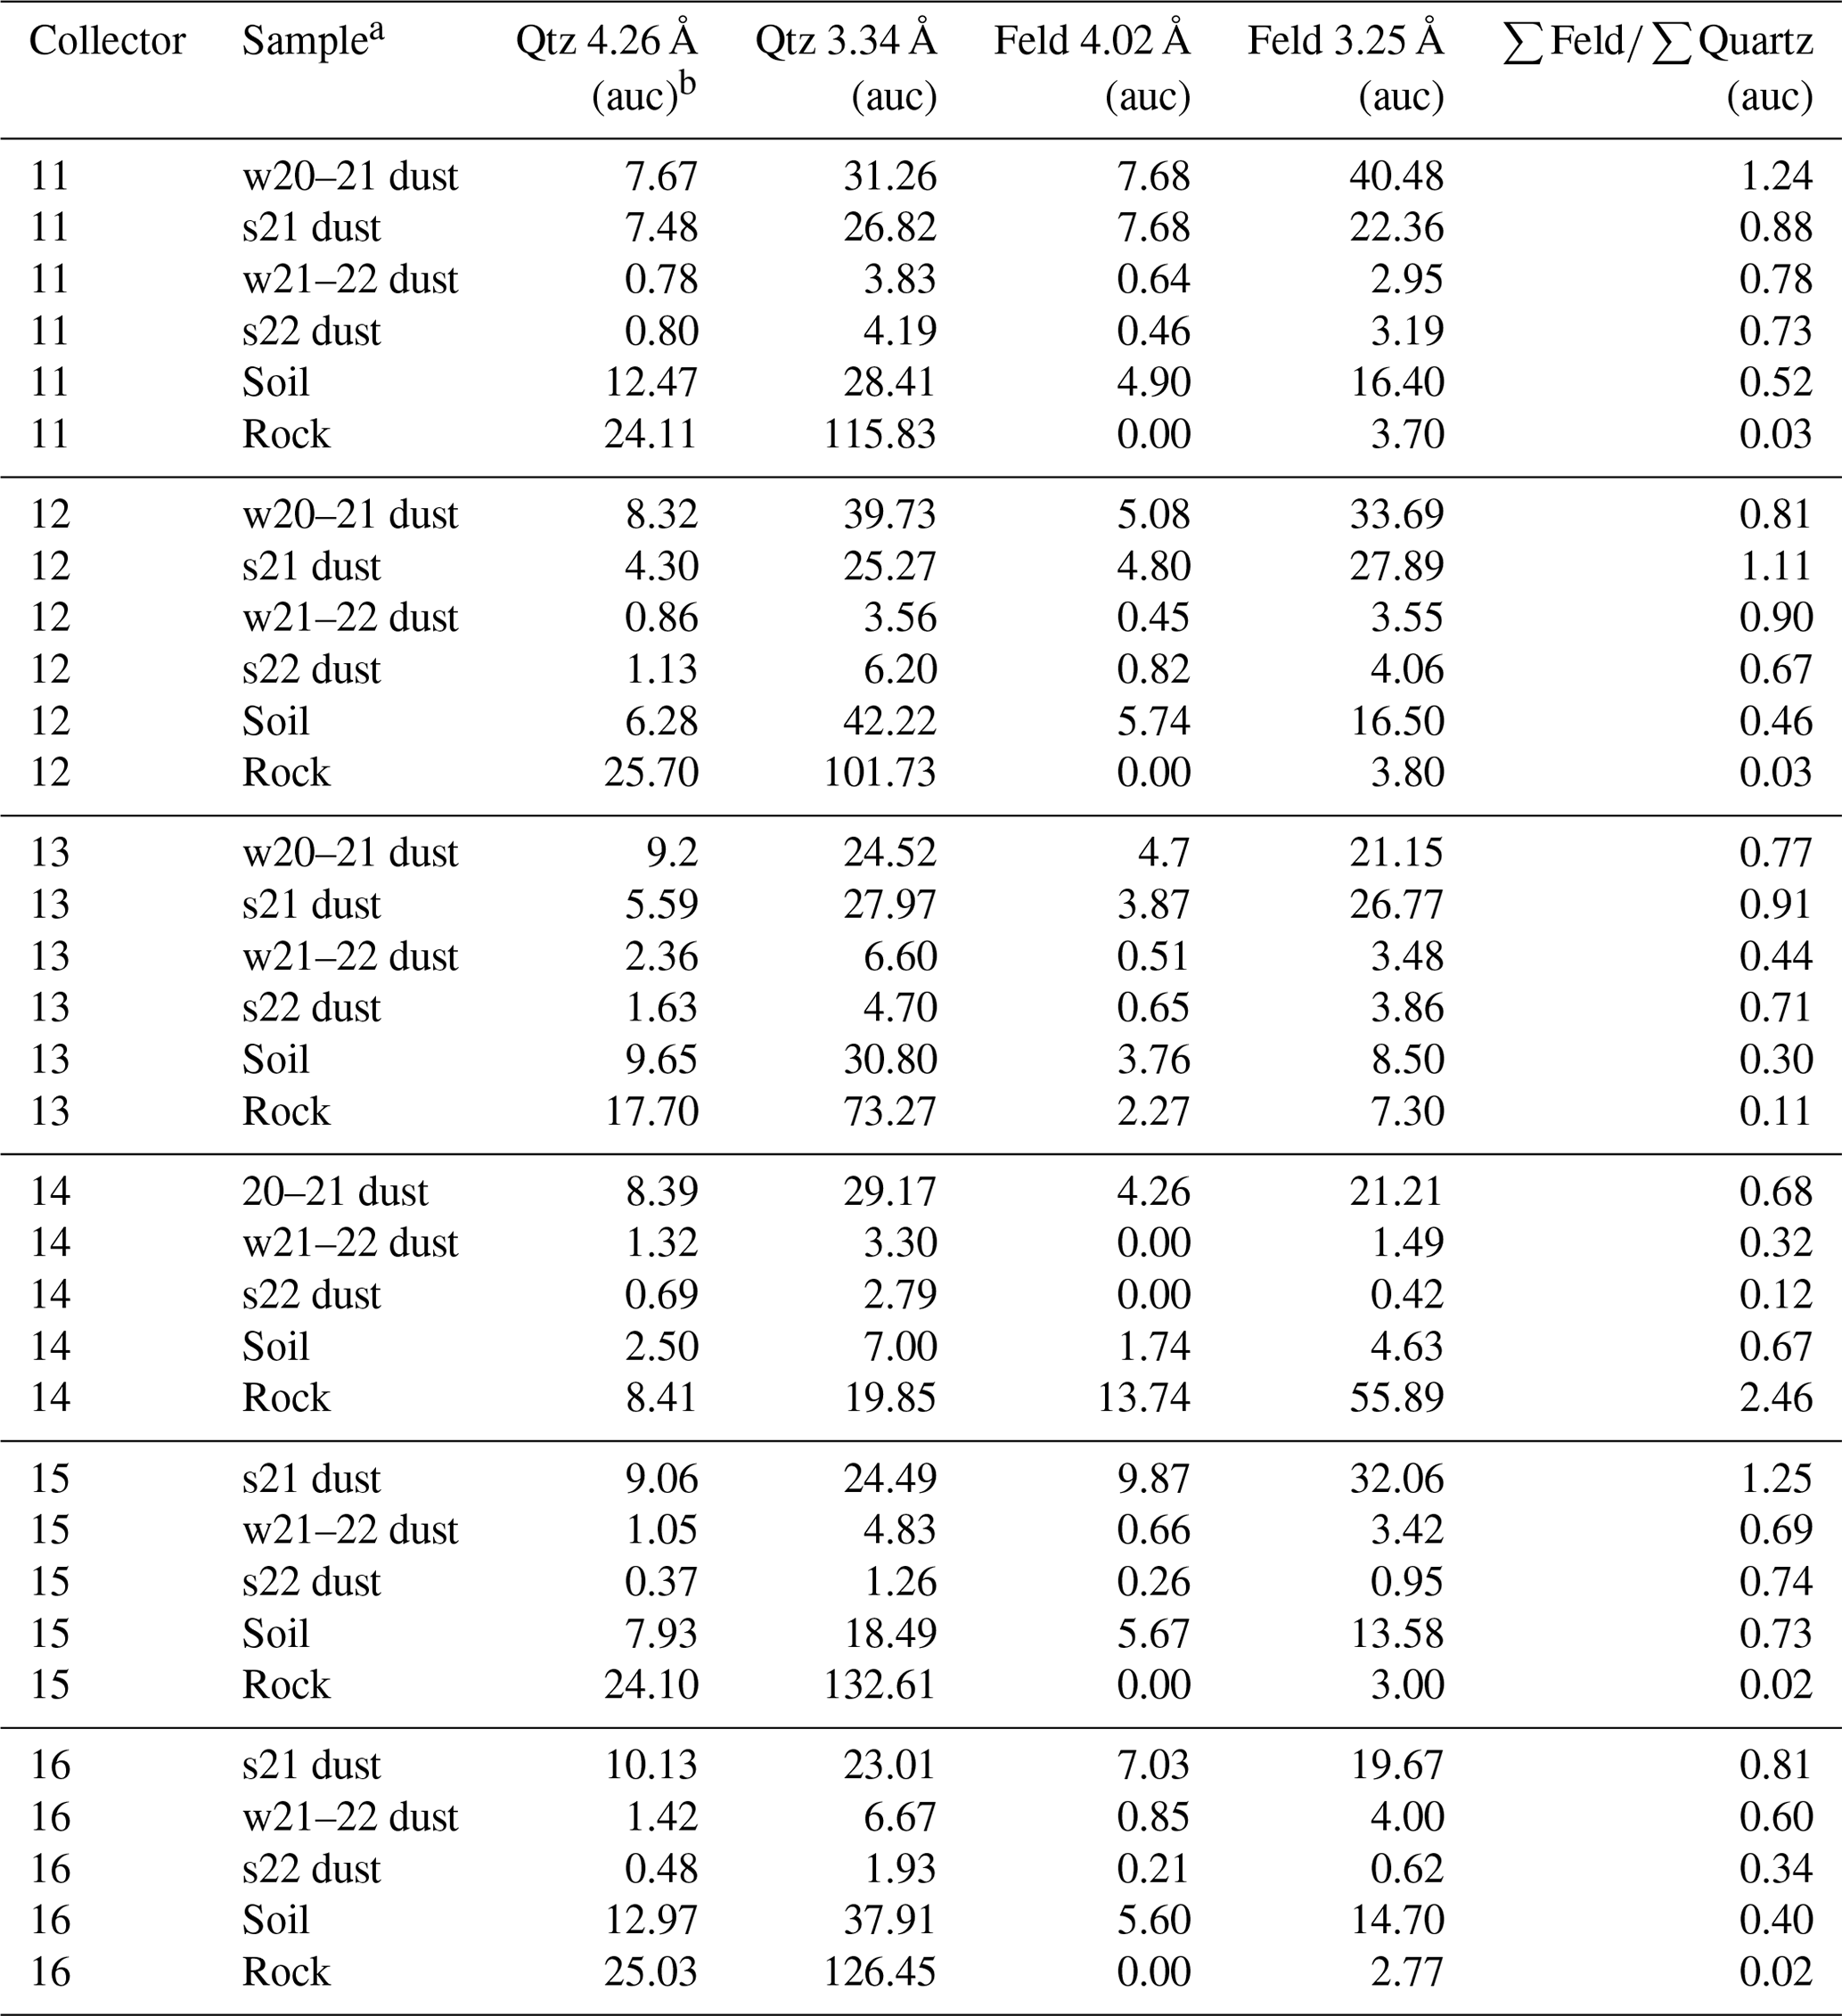
a Note that w denotes winter dust, and s designates summer dust. b Note that auc denotes area under curve.
4.3 Geochemistry
ICP-MS analysis provided a comprehensive perspective on the geochemistry of each sample. The elements Na, Mg, Ca, P, Cr, Cu, Zn, Ni, Sr, Zr, Mo, Cd, Sn, Sb, Ba, Pb, and Bi have the highest average abundances in dust samples (Tables S1–S3 in the Supplement). Be, Al, K, Sc, Mn, V, Fe, Ti, Ga, Rb, Y, As, Nb, Hf, Ta, Tl, Th, U, and the rare earth elements are most abundant in soils (settled fine fraction). Only Co and W are most abundant in bedrock samples, which are presumably dominated by Si, which was not measured. The high W abundance likely reflects the W-bearing puck utilized in the shatterbox. Overall, the most abundant element measured is Al (max of 10.2 % in dust, 12.3 % in soil, and 9.3 % in rock). The first two principal components (Kaiser–Meyer–Olkin score of 0.857) determined for the full dataset explain 67 % of the variance. The first component (PC-1) is dominated by REEs, Th, Zr, U, Rb, K, and Al. The second component (PC-2) contains metals like Sb, Cu, Cd, and Zn. Values of PC-1 and PC-2 for dust, soil, and rock are distinct from one another at each site; at sites 11, 12, 15, and 16, most of the scatter is in PC-2.
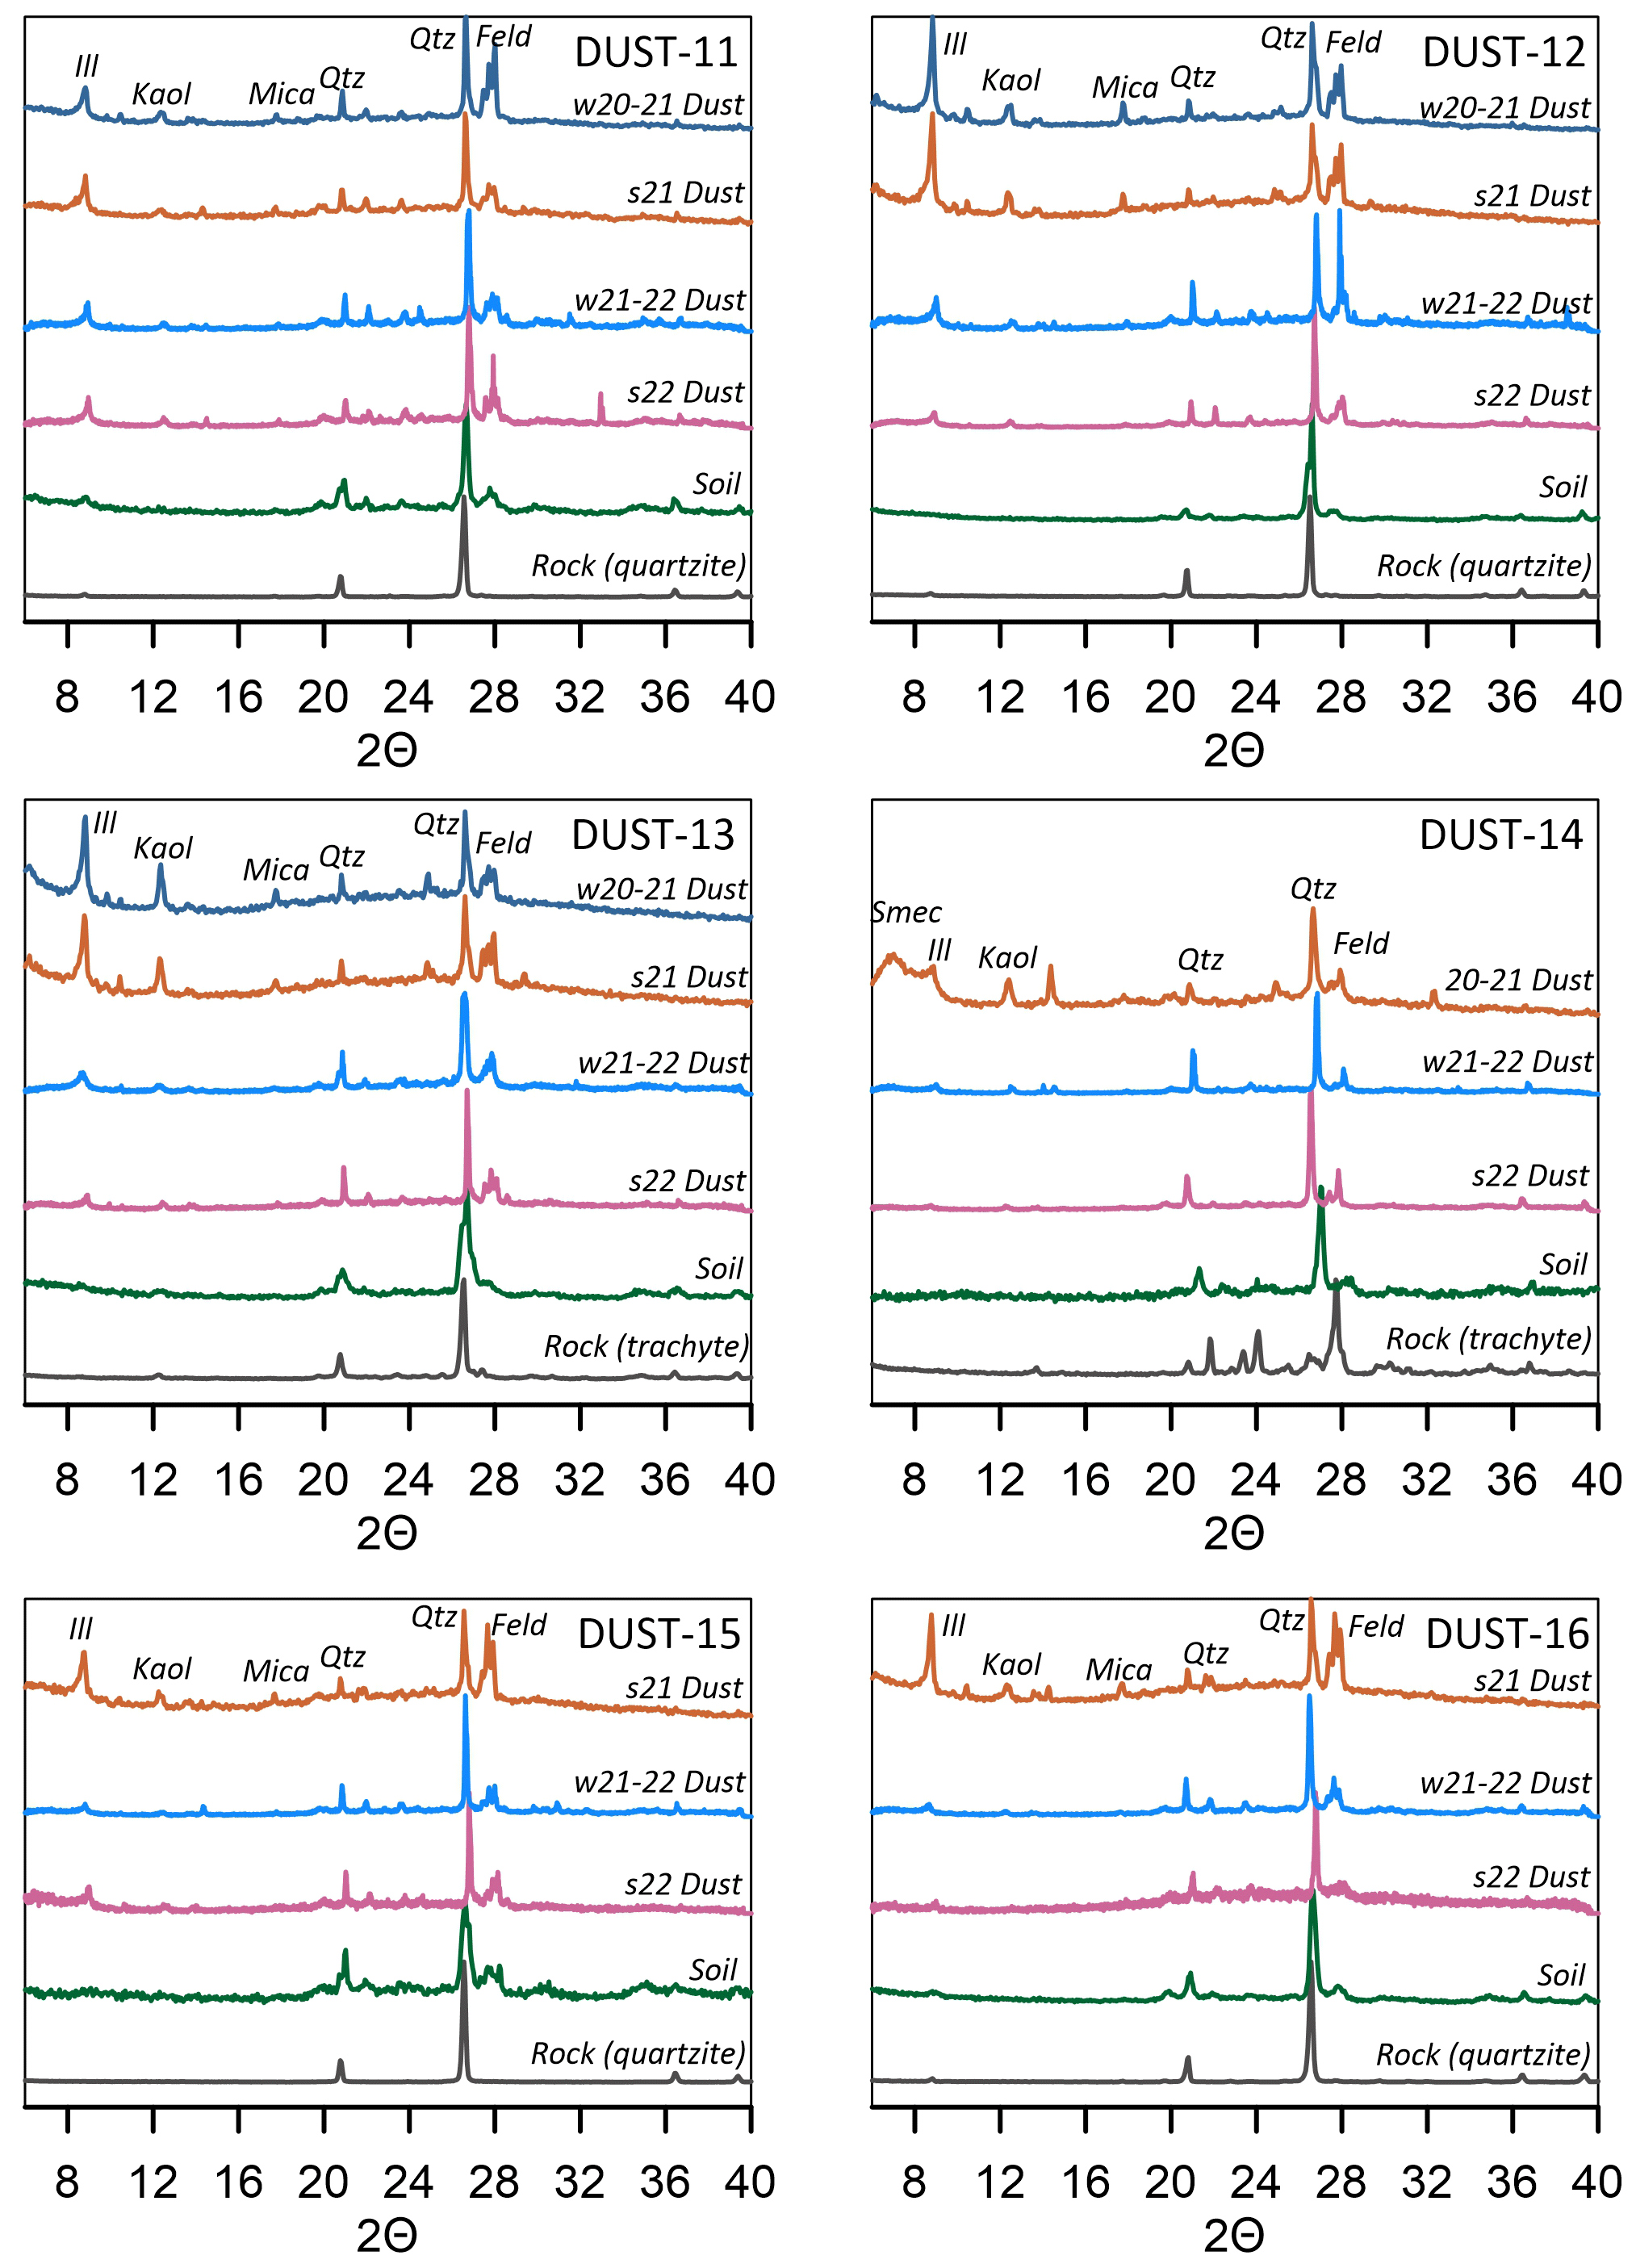
Figure 6X-ray diffraction (XRD) results for samples of dust, soil, and rock at the six study sites. Individual dust samples are presented to emphasize the general seasonal and interannual consistency of dust composition. Note that w20–21 is dust accumulated during the winter of 2020–2021, s21 is dust from summer 2021, w21–22 is dust from the winter of 2021–2022, and s22 is dust from summer 2022. Soil and rock samples are a composite of the individual samples collected at each site. Prominent mineral peaks are identified: Ill is illite, Kaol is kaolinite, Mica indicates K-mica, Qtz is quartz, and Feld is Ca and Na feldspar.
As noted in previous studies, many trace elements in modern mineral dust are present at abundances greatly in excess of their crustal averages, suggesting an anthropogenic contribution from mining (Munroe, 2014; Lawrence et al., 2013, 2011; Reheis et al., 2002). This situation presents a challenge for this project, which assumes that modern dust is representative of the long-term average dust that has contributed to soil formation. A solution is to identify elements in the dust that are least likely to be enriched by anthropogenic activity. Toward this end, a study of lacustrine sediment records from northern Utah identified that Al, Ca, Sc, Ta, U, Th, Ti, Zr, Cr, Rb, K, Na, and Nb did not increase in abundance in concert with European settlement and the start of widespread mining and smelting in this region (Reynolds et al., 2010). Of these, Ca, Zr, Cr, and Na are generally most abundant in the dust samples reported here, and Al, Sc, Ta, U, Th, Ti, K, Rb, and Nb are most abundant in soil. Principal component analysis (Kaiser–Meyer–Olkin score of 0.775) of the abundances of these elements places Th, Nb, Rb, Al, K, U, Ta, and Zr on PC-1, which explains 55 % of the variance. Na and Ca are associated with PC-2 (18 %), whereas Cr, Ti, and Sc are associated with PC-3 (11 %). Samples of dust and soil overlap strongly in a bi-plot of PC-1 vs. PC-2 and exhibit strong dissimilarity with rock samples (Fig. 7).
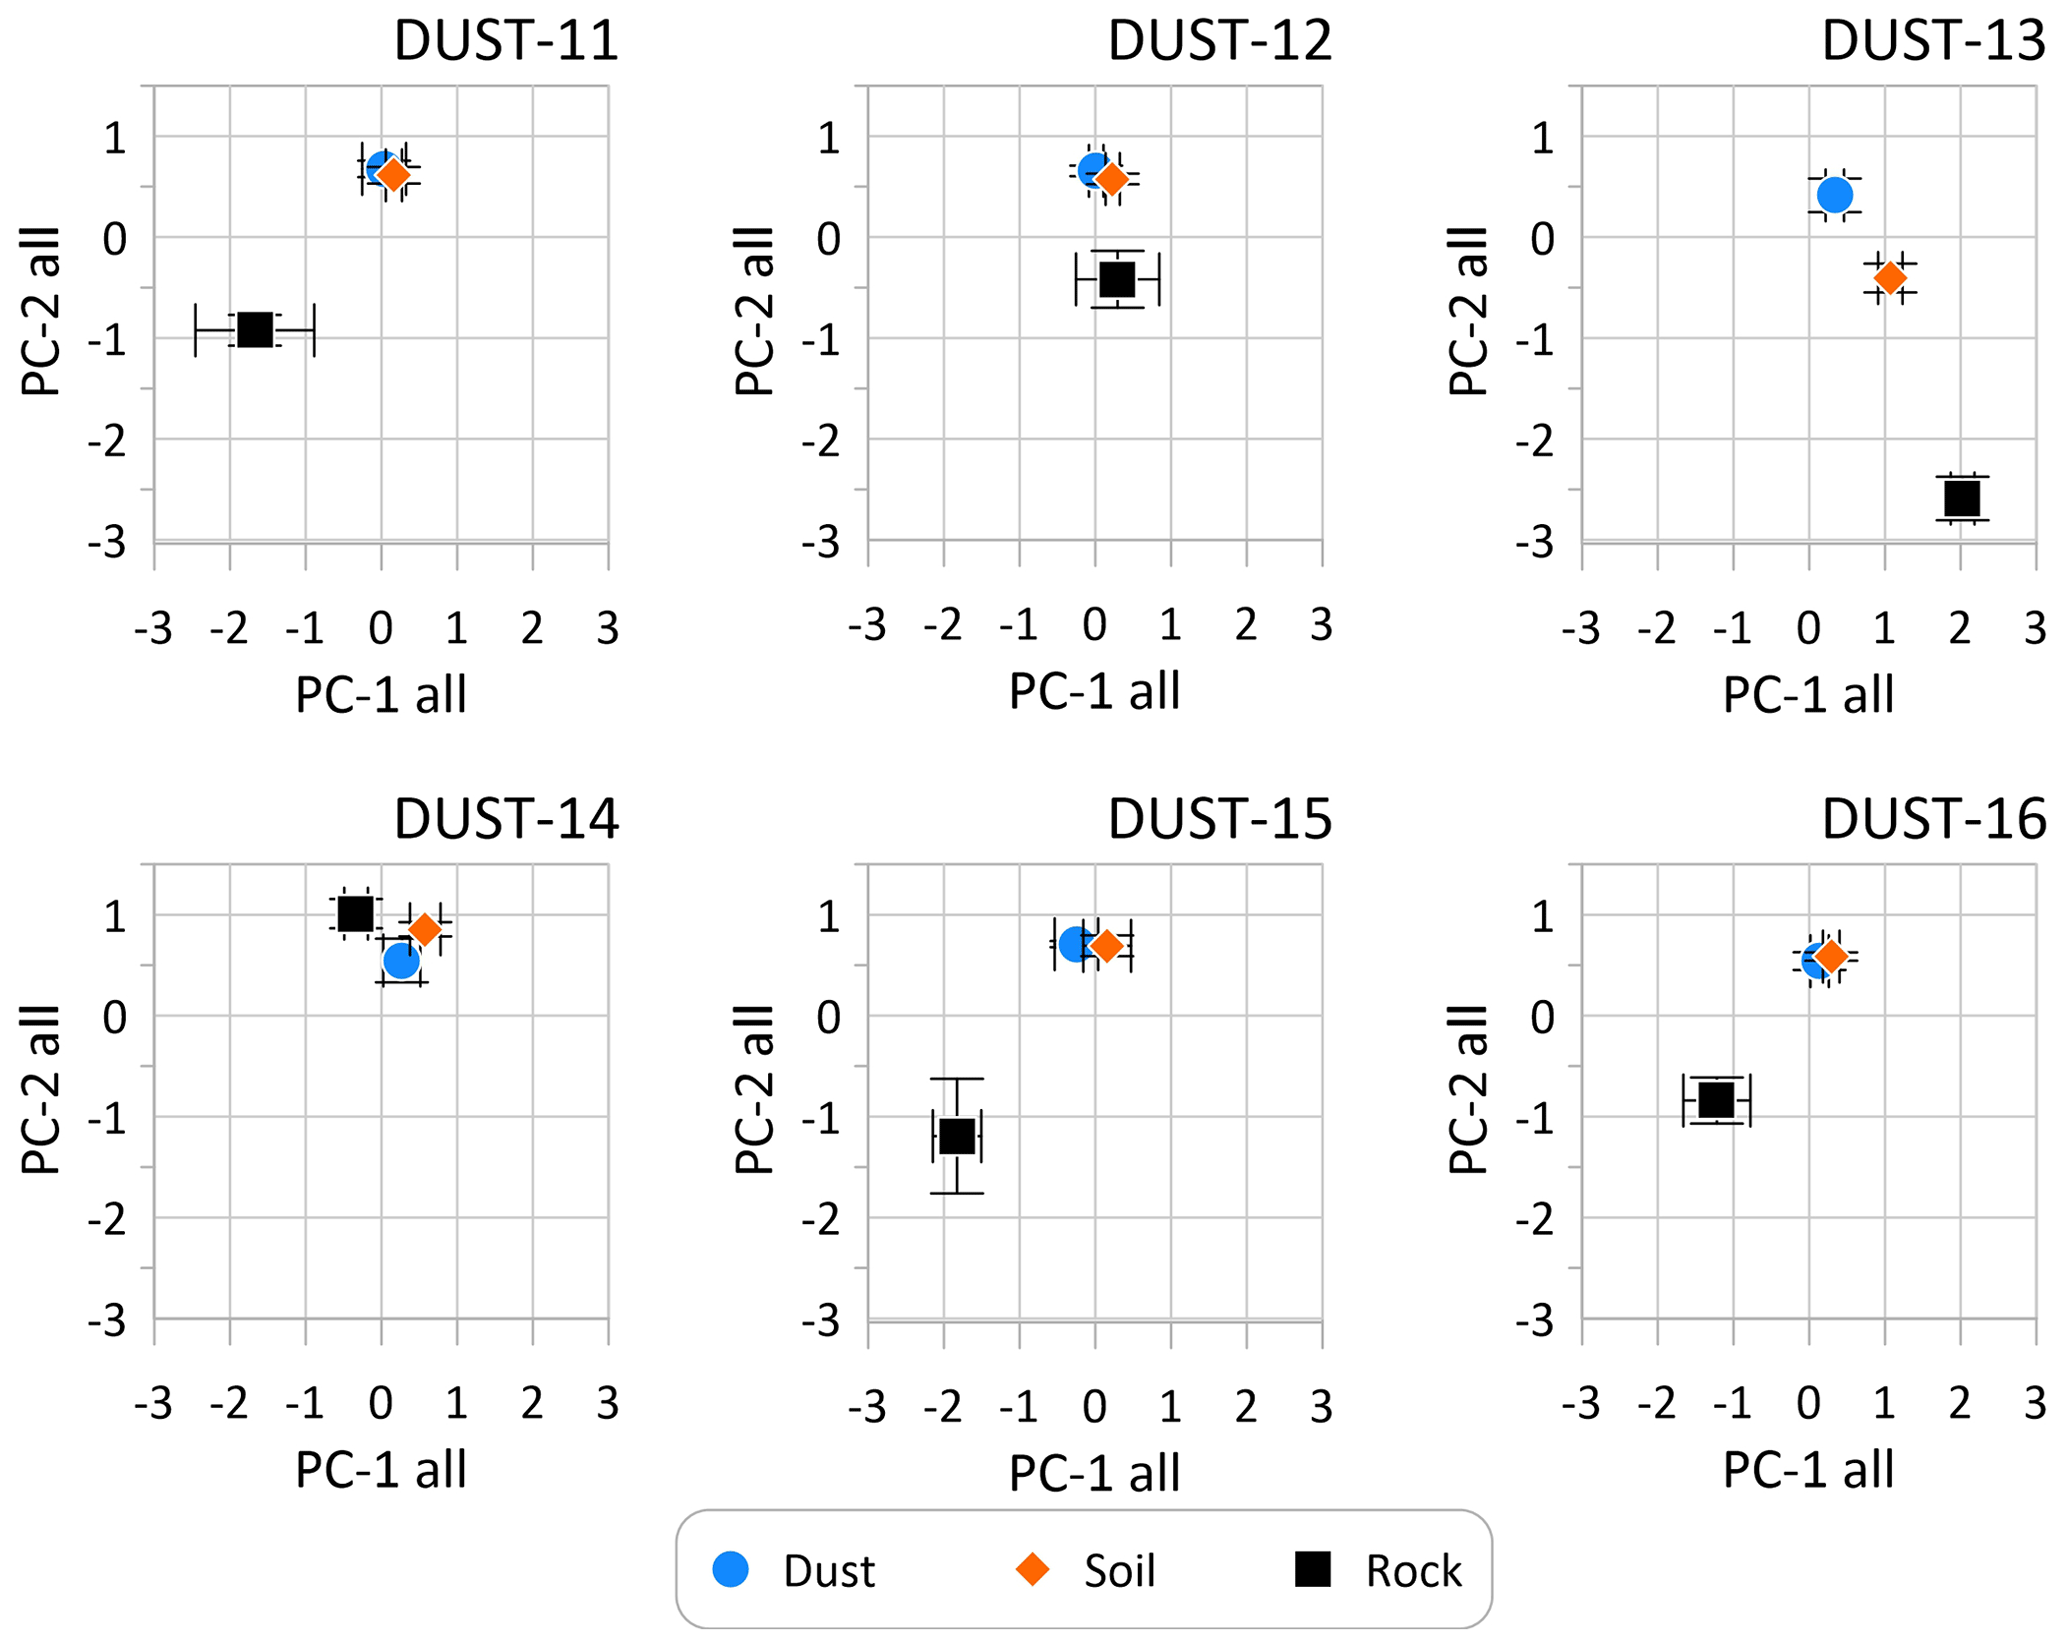
Figure 7Results of principal component analysis for 13 elements (Al, Ca, Sc, Ta, U, Th, Ti, Zr, Cr, Rb, K, Na, and Nb) quantified in the dust, soil, and rock samples previously demonstrated not to have been impacted by human activity following European settlement (Reynolds et al., 2010). Values of the first principal component (PC-1) and second principal component (PC-2) are plotted as mean ±1 standard deviation.
Rare earth elements (REEs) provide another approach for comparing material between the different study sites (Zheng et al., 2021). In particular, the ratio , where the subscript n designates values normalized to a chondrite standard (Nakamura, 1974), captures the difference in abundance between light REEs (La) and heavy REEs (Lu). Similarly, calculation of Eu*, the Eu anomaly, is useful for assessing the geologic history of individual samples (e.g., Pourmand et al., 2014; Tang et al., 2013). Overall average values of for dust, soil, and rock range from 8.48 at DUST-15 to 12.5 at DUST-16 and vary significantly between sites (Kruskal–Wallis H of 24.534, P<0.001). Values of Eu* are all <1, indicating Eu depletion, and are lowest at DUST-13, with a mean of 0.35. The highest mean Eu* value of 0.87 is at DUST-14. Once again, values are significantly different between sites (Kruskal–Wallis H of 59.397, P<0.001). Plotting vs. Eu* at the six sites reveals similarity between dust and soil at all locations and emphasizes the distinctions between the rock samples (Fig. 8).
Ratios of trace elements with limited mobility in surface environments are commonly employed to compare dust, soil, and local material (Muhs and Benedict, 2006; Mason and Jacobs, 1998; Reheis et al., 2002). In this study, the presence of different bedrock lithologies beneath the six study sites complicates the search for a single ratio appropriate for all locations. However, one ratio that is effective and appropriate given the results of Reynolds et al. (2010) is . Because Cr is typically elevated in dust samples, but not, apparently, due to anthropogenic effects, and because Ta is generally more abundant in soil, the ratio can serve as an index of dust abundance within a given soil sample. At all sites, is highest in dust samples (mean of 53.5 with a maximum of 66.5 at DUST-15) and lowest in rock samples (mean of 10.8 with a maximum of 13.8 at DUST-16). Soil samples have intermediate values, averaging 31.6.
As a final step to compare the sample types in terms of major elements, elemental abundances of Al, Ca, K, and Na were converted to oxide percent and used to calculate the chemical index of alteration–CIA (Nesbitt and Young, 1982) for dust, soil, and rock. This approach capitalizes on the tendency of CaO, K2O, and Na2O to be leached by chemical weathering in surface environments in contrast with the stability of Al2O3. Lower values indicate less weathered material, whereas progressive leaching drives the CIA toward higher values. The overall average of all samples in this study is 71.8, indicating a moderate degree of weathering. Notably, at all sites except DUST-14, the highest CIA values are found in the rock samples (mean of 75.8) and the lowest values in the dust (overall mean of 67.8). Moreover, the CIA for dust samples is very similar from site to site (standard deviation of 0.43) compared with the bedrock, which varies widely (standard deviation of 5.74). Soil samples generally have intermediate values (mean of 73.7 ± 0.90).
4.4 Radiogenic isotopes
Values of the ratio and εNd provide an additional mechanism for distinguishing between dust, soil (settled fine fraction), and rock in this study (Table 4). Measured ratios average 0.71013 (0.70707 ± 0.00001 to 0.71423 ± 0.00001) for dust, 0.71076 (0.70863 ± 0.00001 to 0.71223 ± 0.00001) for soil, and 0.73629 (0.70476 ± 0.00001 to 0.76848 ± 0.00001) for rock. Values of εNd average −8.92 (−11.37 ± 0.21 to −4.94 ± 0.22) for dust, −7.82 (−10.27 ± 0.15 to −6.20 ± 0.15) for soil, and −13.27 (−25.45 ± 0.15 to −4.51 ± 0.22) for rock. At each site, and εNd are consistently more similar for dust and soil samples and more different for rock samples (Fig. 9). At DUST-11, DUST-12, DUST-15, and DUST-16, values for dust and soil are nearly identical; at DUST-13 and DUST-14, there is slightly more separation between these materials. In general, values of dust and soil samples vary within a relatively narrow range between sites, whereas values for rock samples vary greatly (Fig. 9).
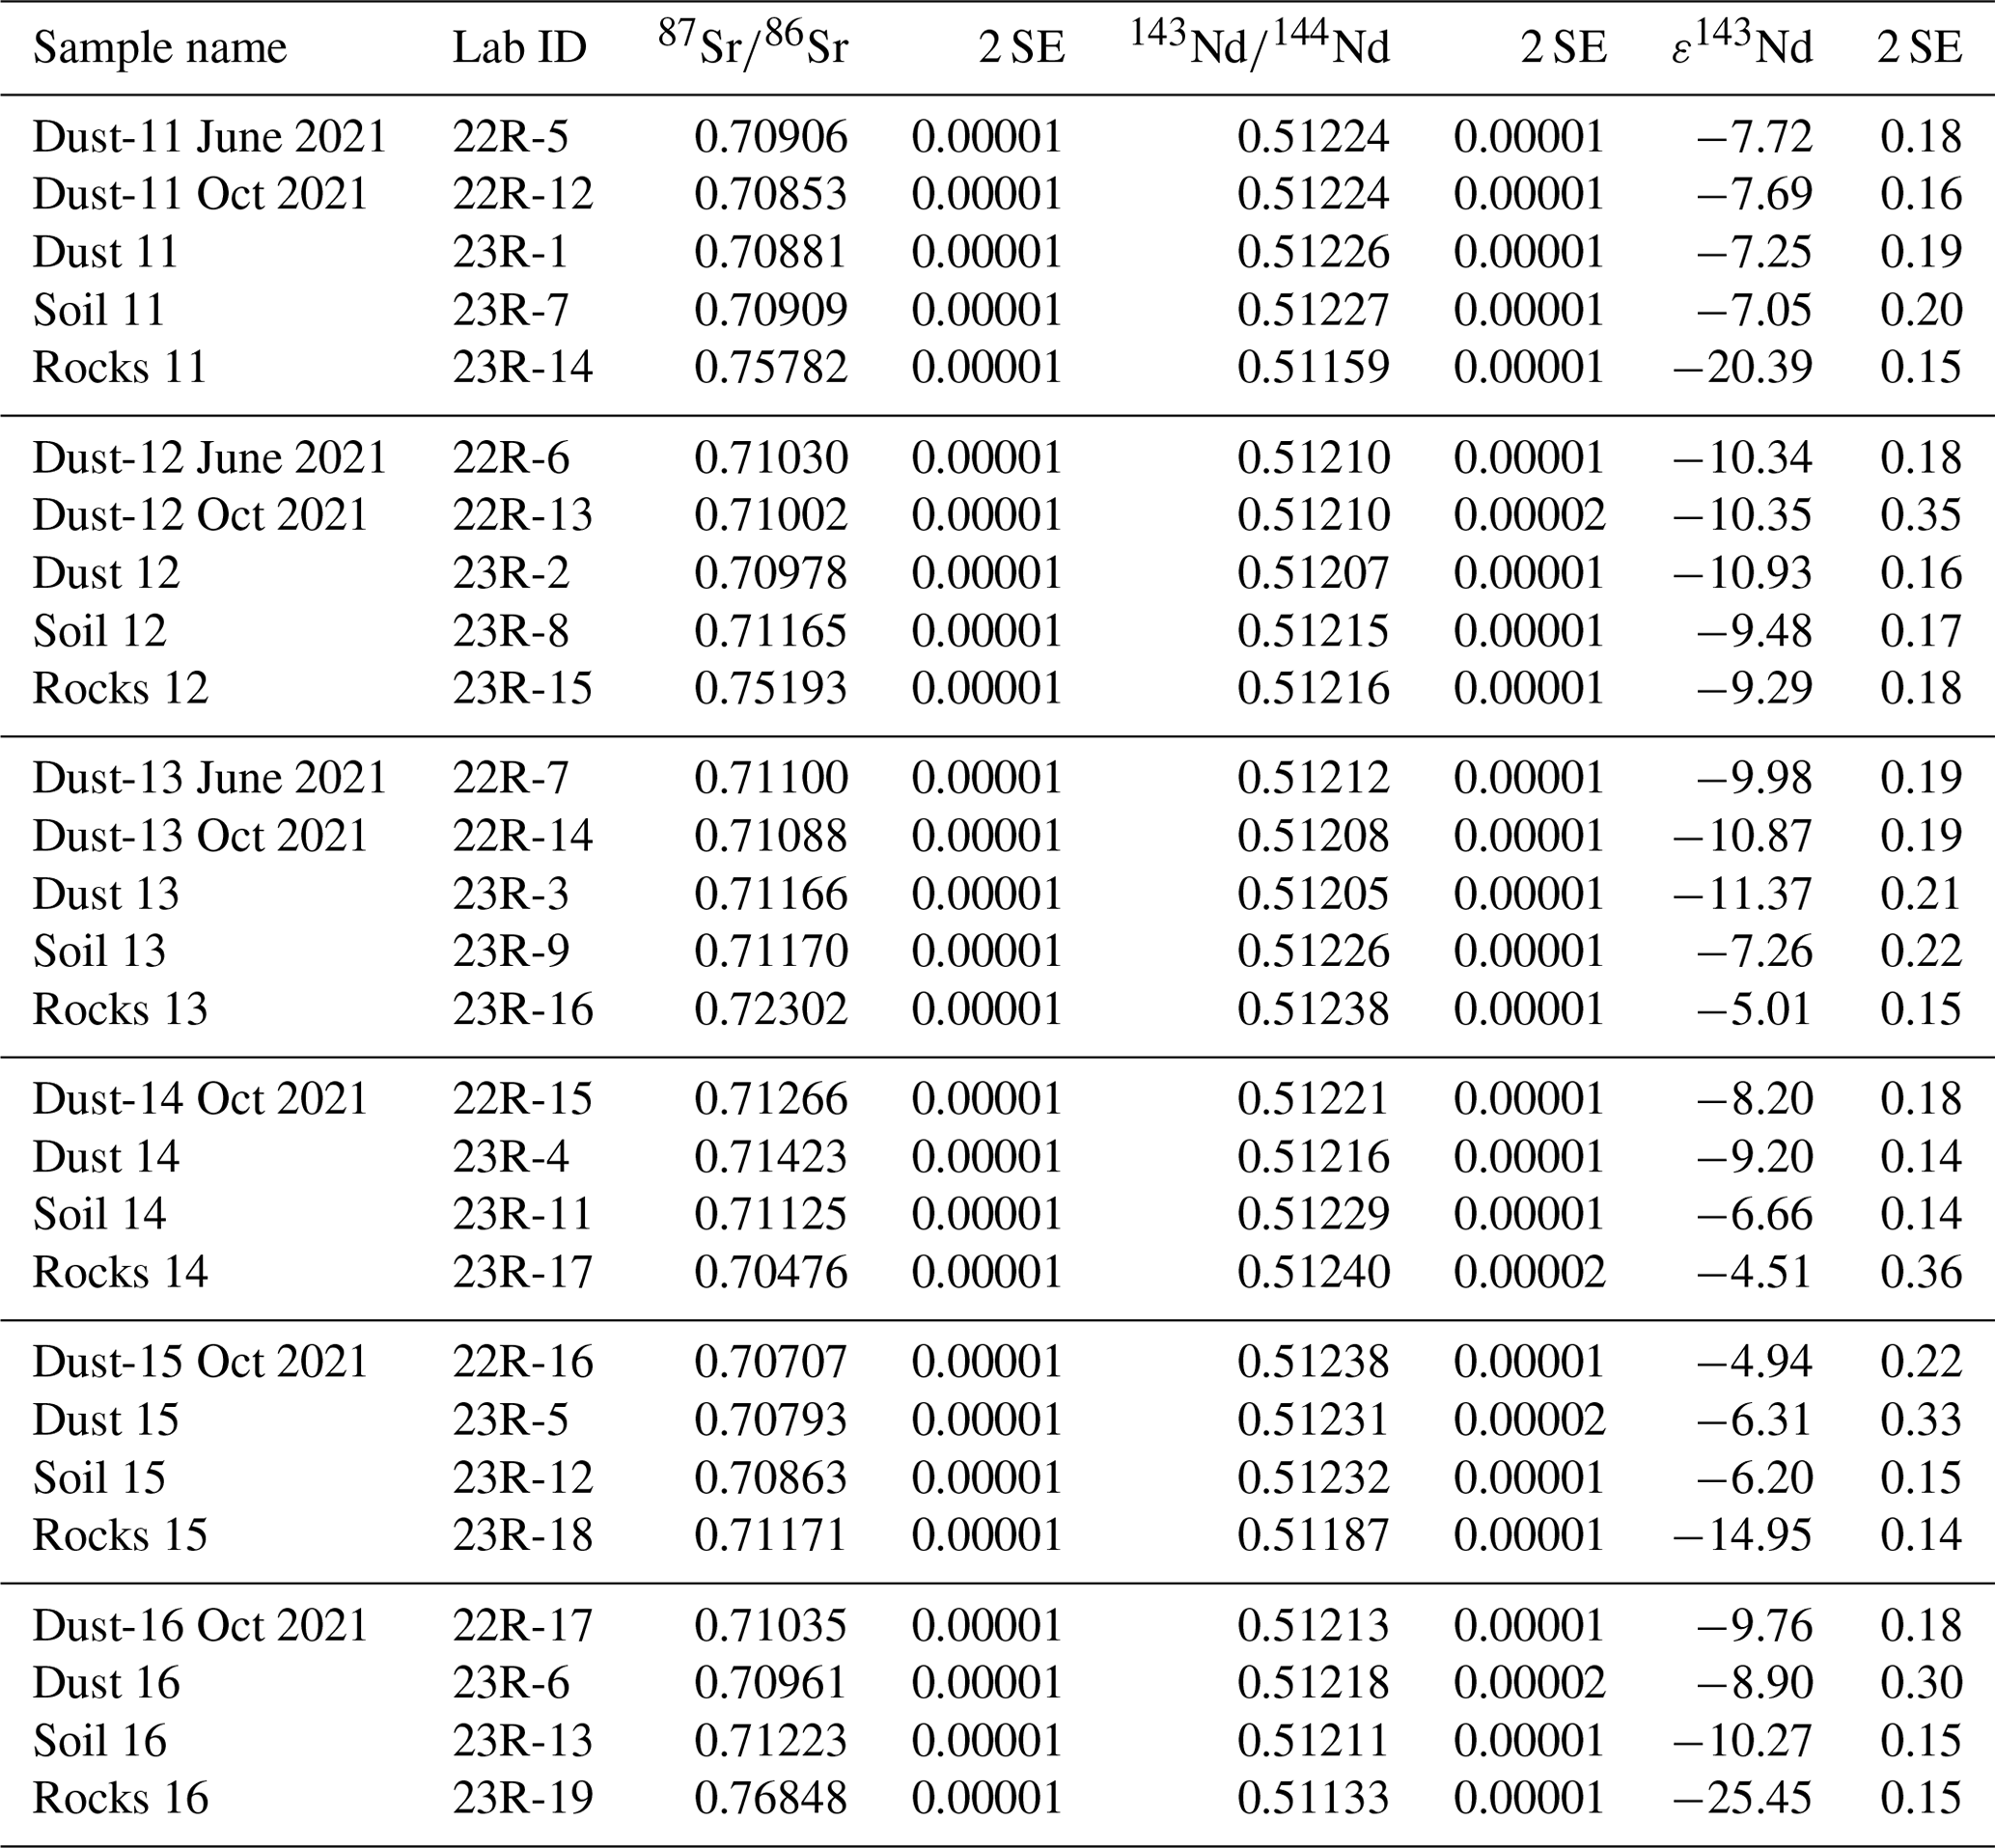
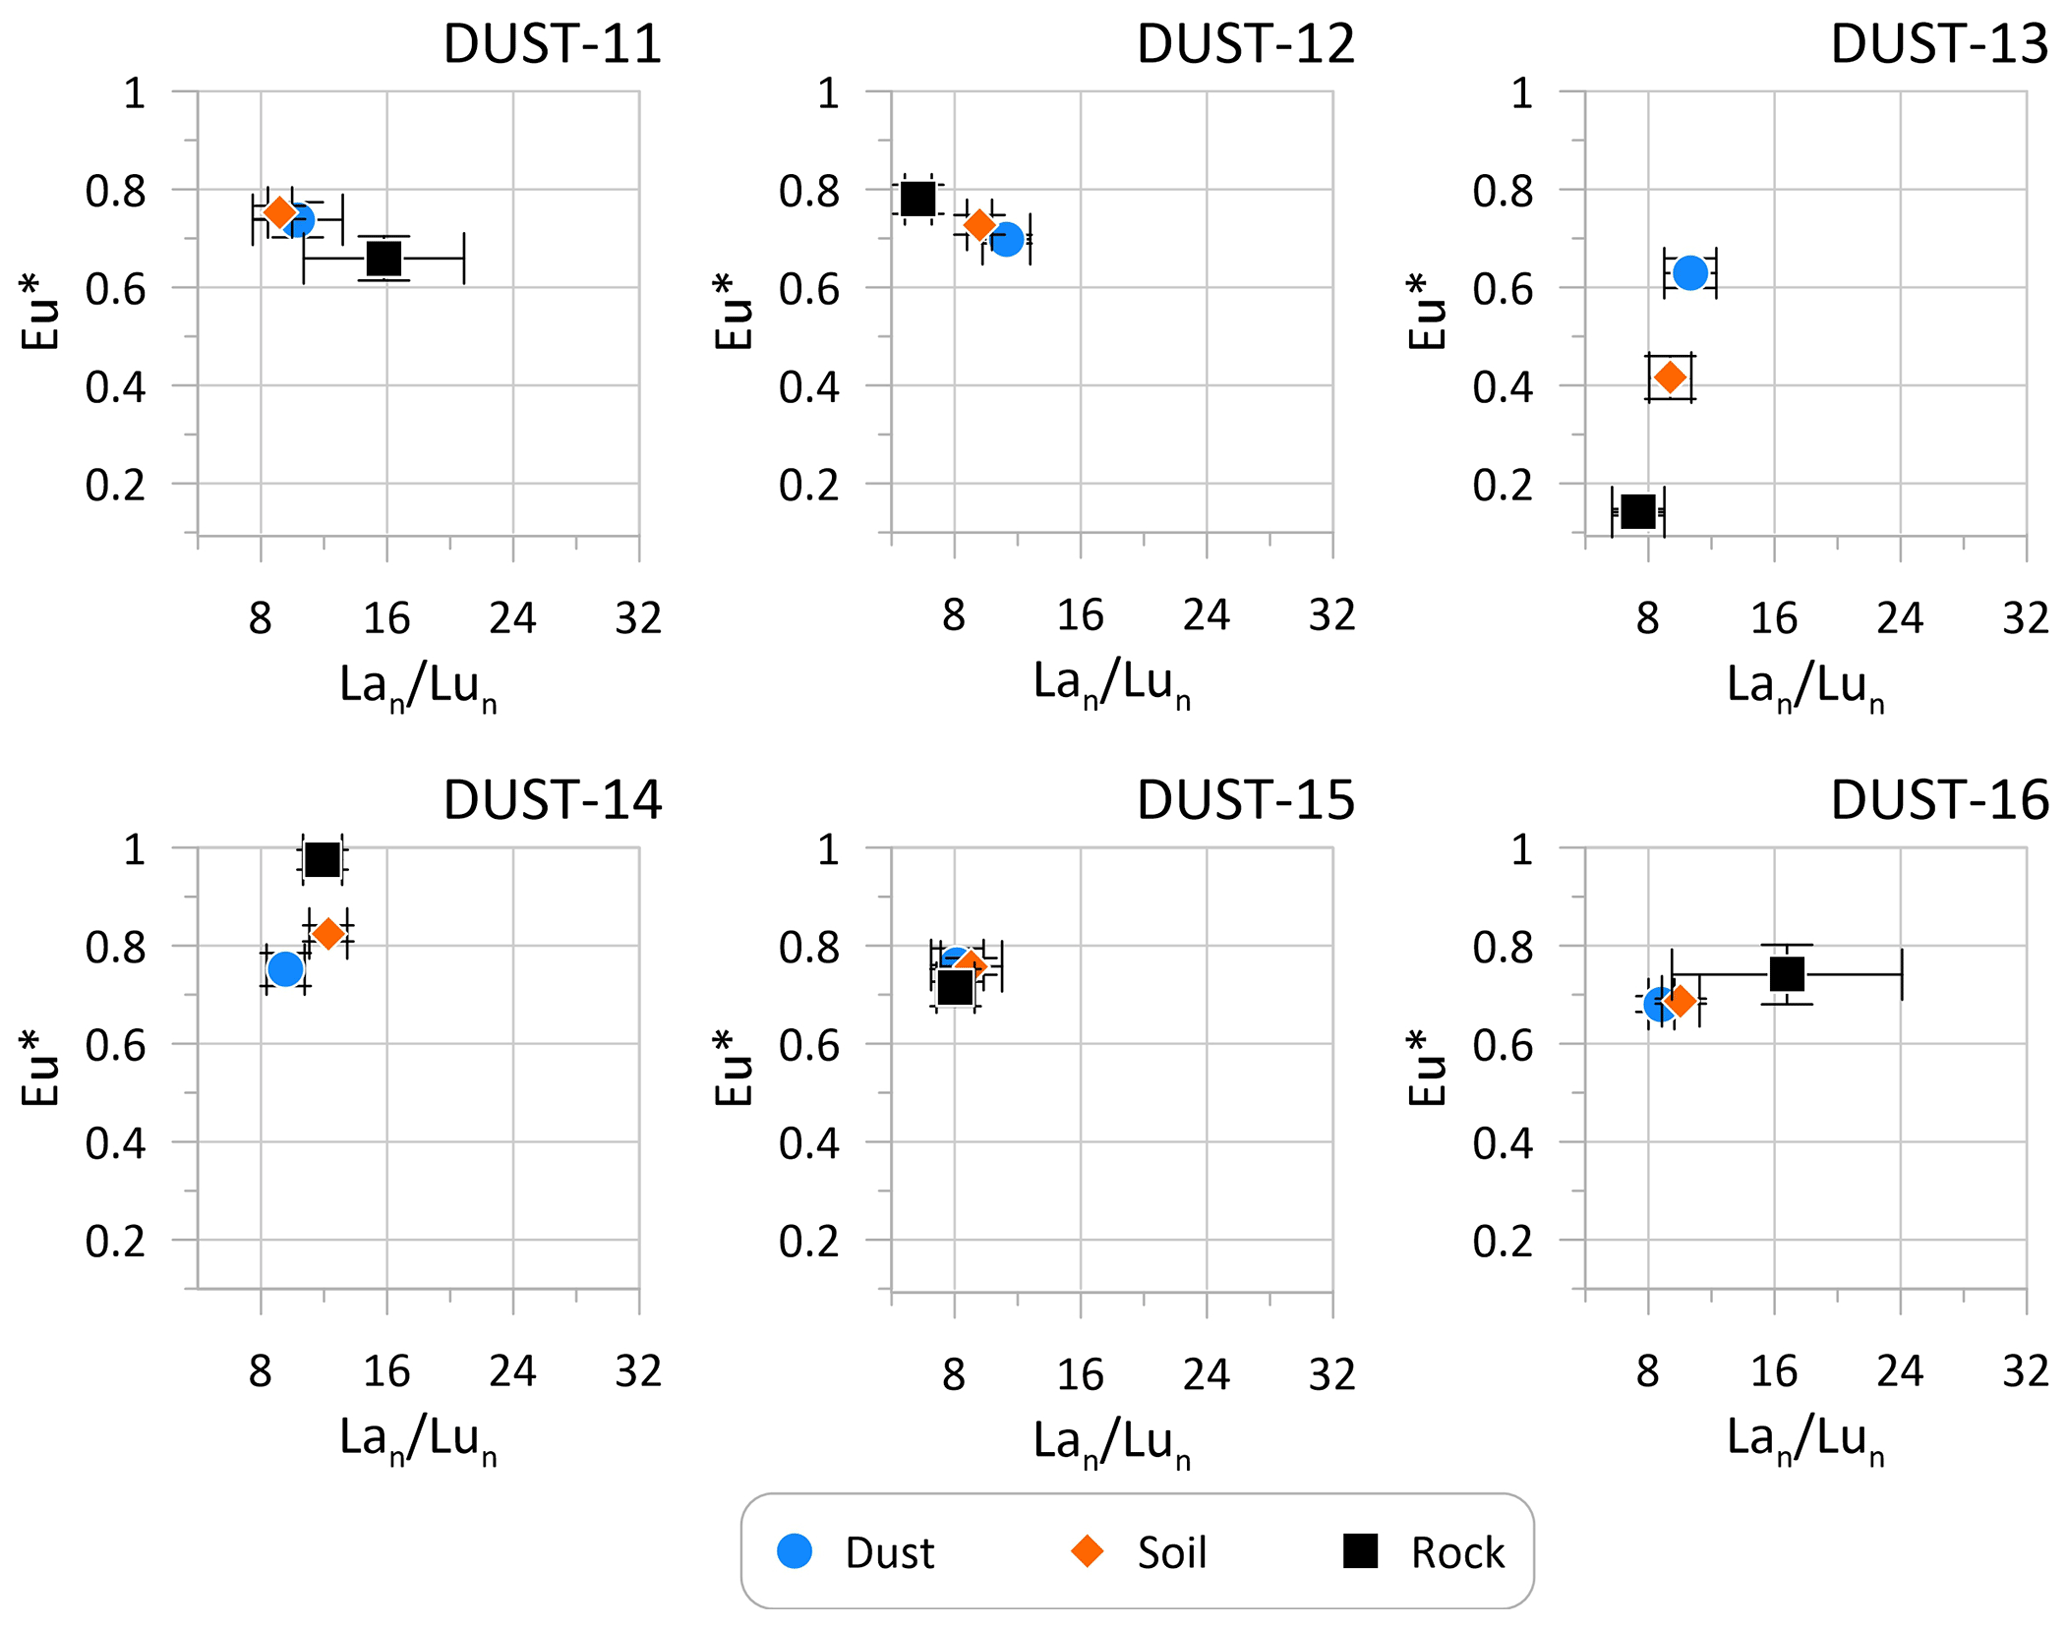
Figure 8Biplot of vs. Eu* at the six study sites. Symbols represent the mean ±1 standard deviation.
4.5 Dust fraction estimates
Starting from the assumption that the soil samples from the locations considered in this study can logically be considered to be mixtures of local rock and eolian dust, the dust fraction (fDust) within each soil sample (settled fine fraction) was estimated with a two-end-member mixing model (Table 5). For this approach to function, end members need to be essentially unaffected by weathering within the CZ. However, given the different bedrock types present at each of the dust collector sites and differences in the properties of dust delivered to each site, it is unlikely that a single pair of end members would work equally well for all six locations. Accordingly, four pairs of end members were considered. Two of these utilize the radiogenic isotope results since previous work has demonstrated the applicability of and εNd as fingerprints for geologic samples (e.g., Zhao et al., 2018). Similarly, the ratio was employed because Cr is generally more abundant in dust samples, and Ta is more common in soil samples, allowing to function as an index of dust content within the soil. In addition, the abundance of these elements in regional dust was previously shown to have not changed in response to European settlement (Reynolds et al., 2010), providing confidence that the modern dust samples are not distinguishable from prehistoric dust at these locations in terms of Cr and Ta concentrations. Finally, the feldsparquartz ratio was used to capitalize on the XRD mineralogy (Litaor, 1987).
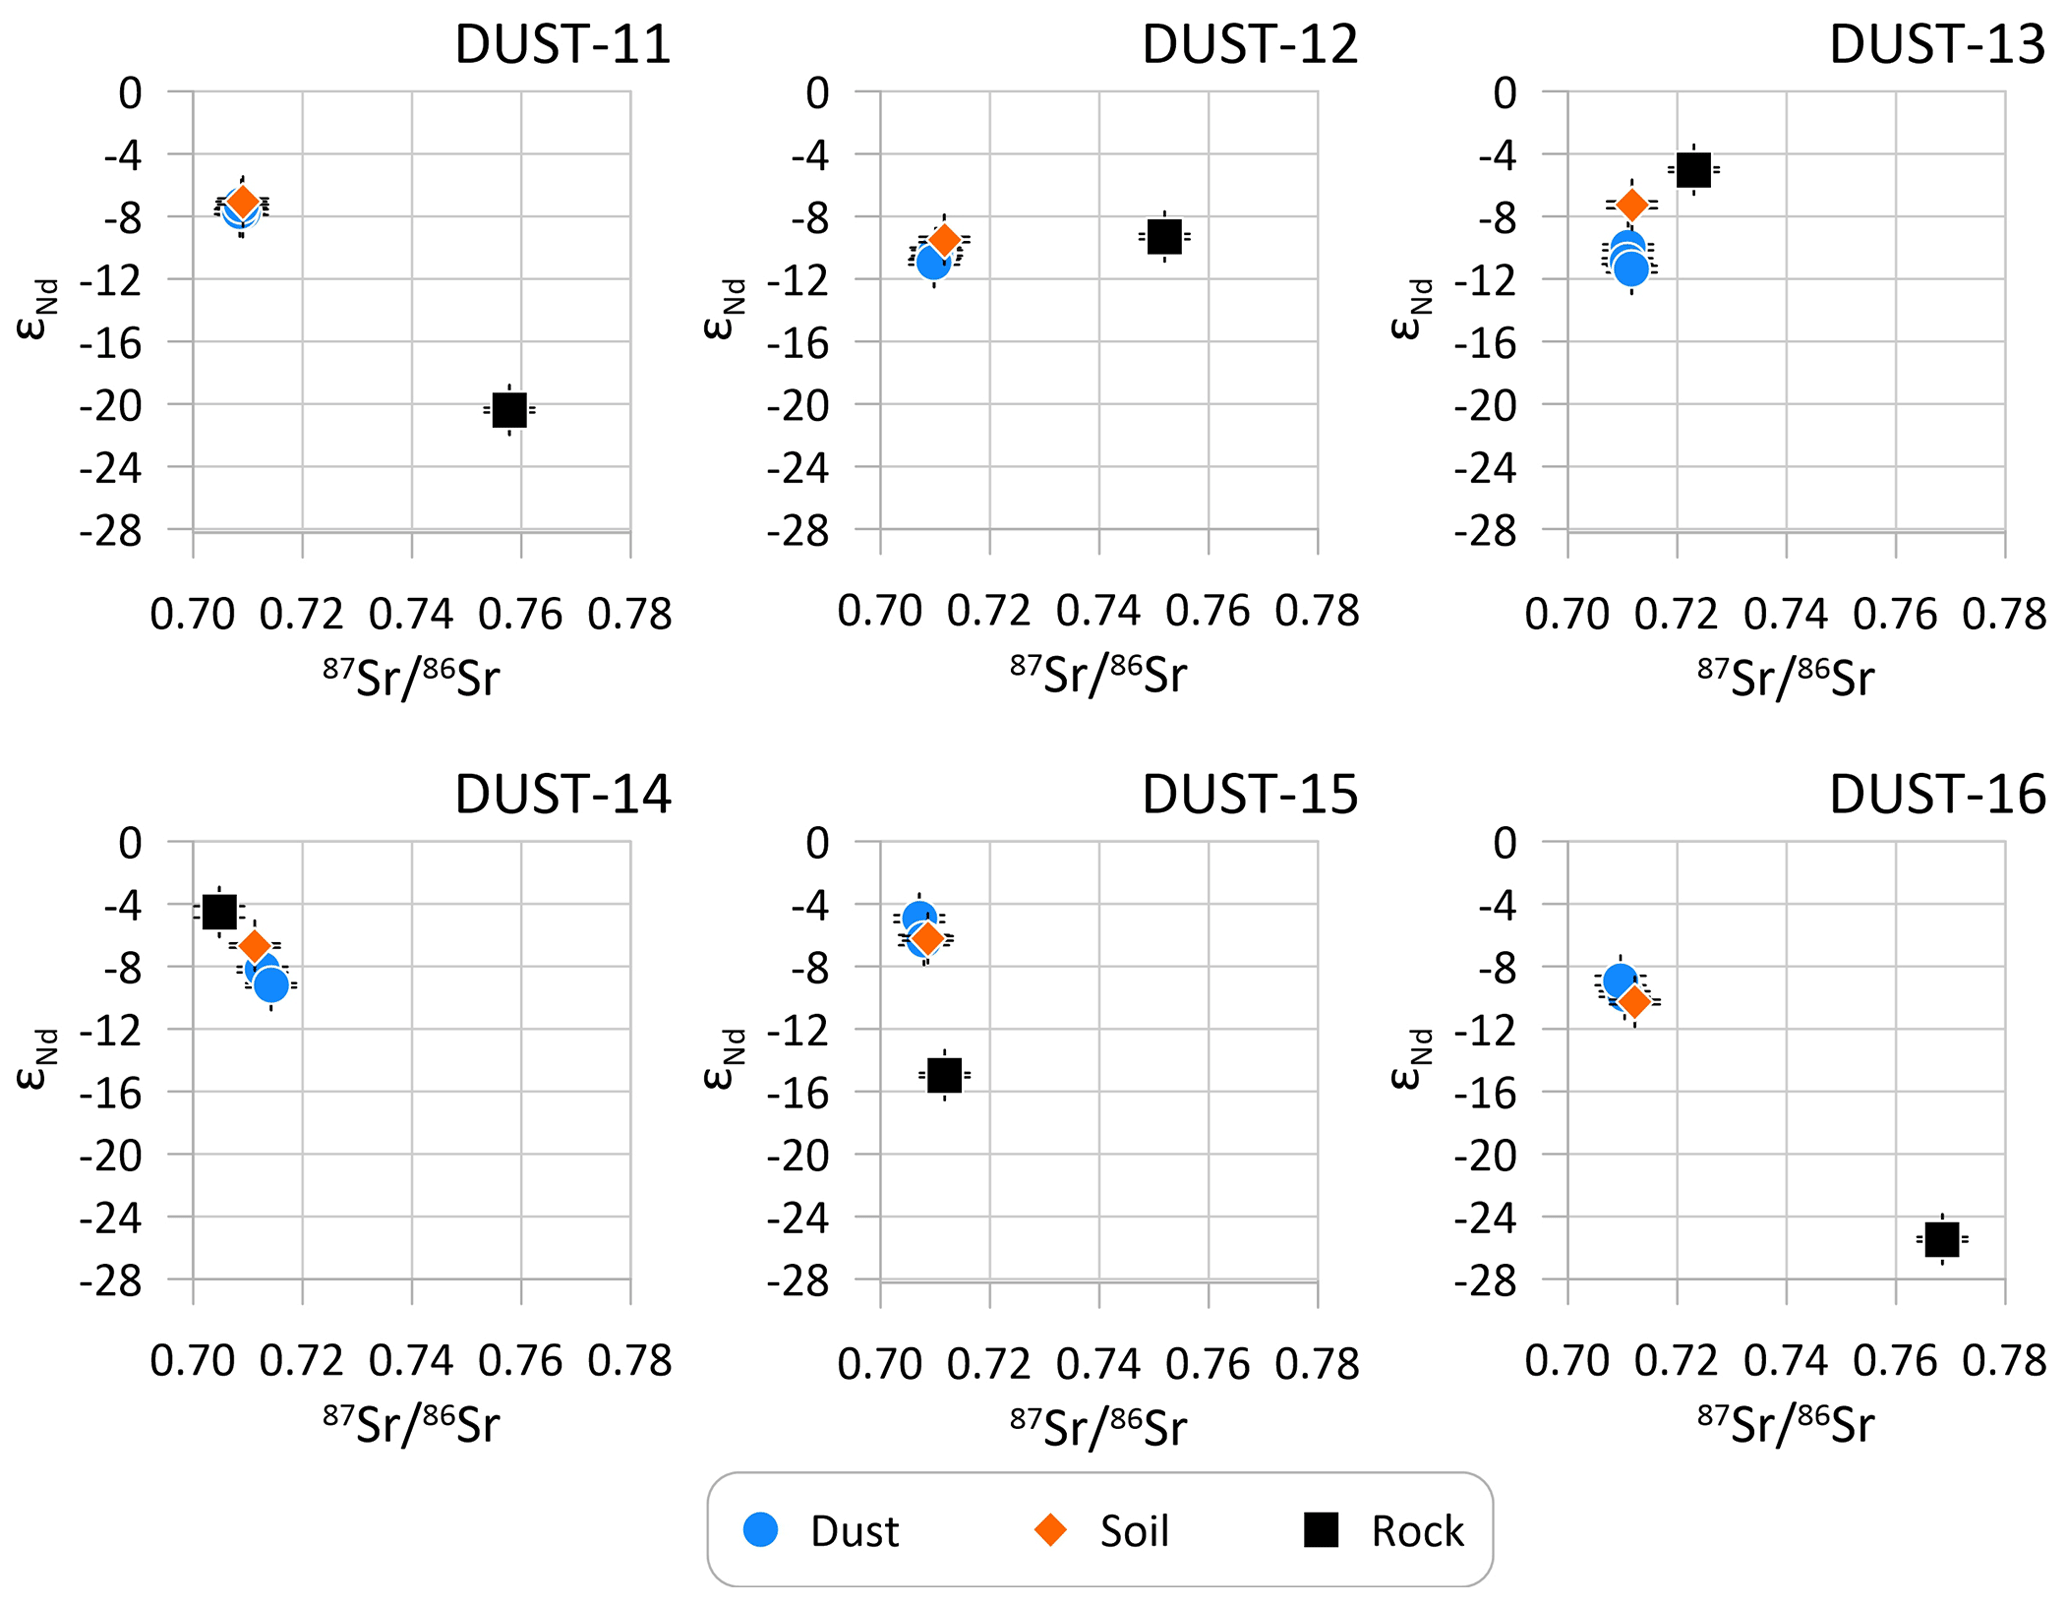
Figure 9Biplots of and εNd of soil, dust, and rock samples at the six study sites. Symbols represent the mean ±1 standard error.
Table 5Dust fraction estimates.
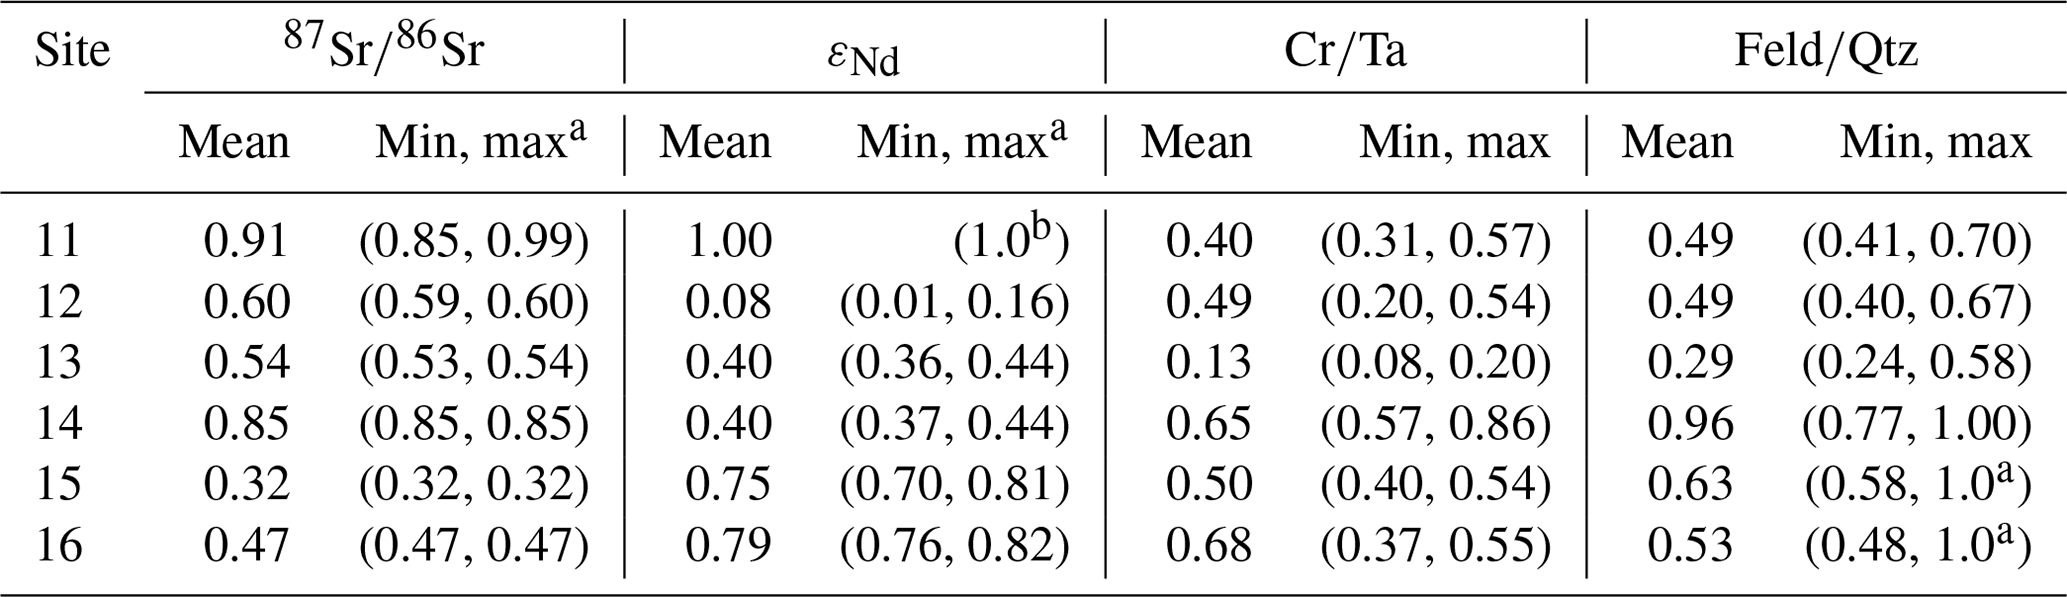
a Determined from ±1 SE of the measured soil value. b Rounded.
As expected, estimates of fDust vary within each site, as well as between sites. However, in all cases, soils are clearly a mixture of dust- and rock-derived material, typically with a dominance of dust. For example, as demonstrated in Fig. 9, the ratio of most soil samples is very similar to that of the dust sample from the corresponding collector. The concentration-weighted mixing models for and εNd yield varying estimates for fDust (Figs. 10 and 11). At DUST-11, dust content quantified by this approach is >90 %. At DUST-12, fDust from is near 0.60, whereas the estimate from εNd is much lower (<0.10). Values at DUST-13 and 14 are intermediate, and at DUST-15 and 16, the fDustestimates from are near 0.40 in contrast to εNd, which yields estimates ∼0.75 (Figs. 10 and 11, Table 5). Estimates of fDust from the ratio vary across a similar range, from a high of 0.68 at DUST-16 to a low of 0.13 at DUST-13, with a mean of 0.48 (Fig. 11). Finally, estimates obtained from the feldsparquartz ratio extend from 0.96 at DUST-14 to 0.29 at DUST-13, with a mean of 0.57 (Fig. 11). The average of all fDust estimates is 0.56 (Fig. 11), with the lowest mean values per site at DUST-12 (0.41) and DUST-13 (0.34) and the highest mean values at DUST-11 (0.70) and DUST-14 (0.72).
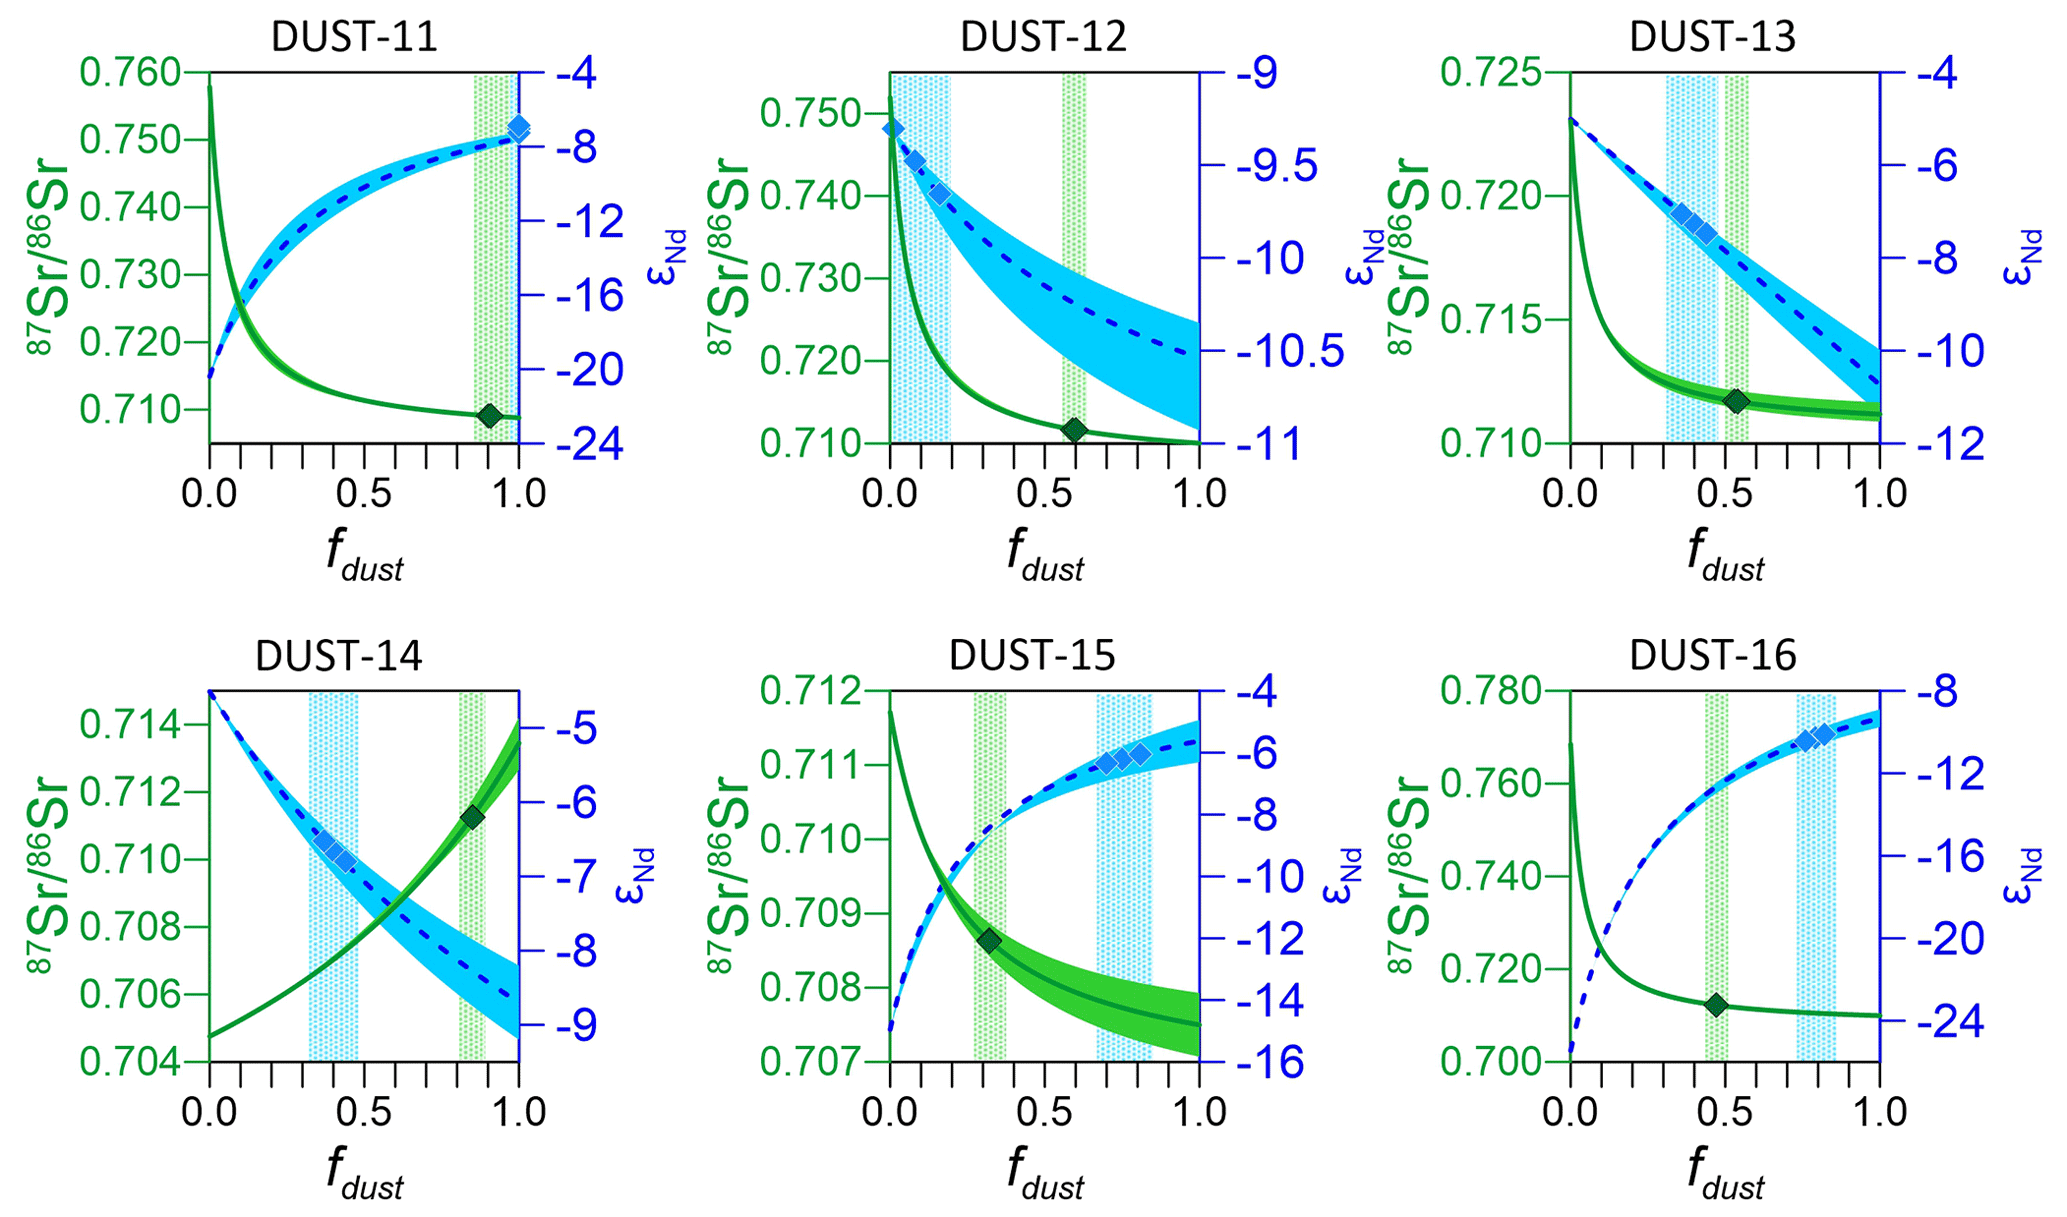
Figure 10Concentration-weighted mixing models used to estimate the dust fraction (fDust) in soil samples from measurements of and εNd at each of the six study sites. Green colors indicate , whereas blue denotes εNd. The width of the mixing envelop reflects uncertainty in the analyses made on the dust and rock end members. The three diamonds in each plot indicate the mean, mean − 1 standard error, and mean +1 standard error of analyses made on the composite soil sample from each site. The vertical green- and blue-shaded boxes are intended to visually highlight the fDust estimate range made at each site for and εNd.
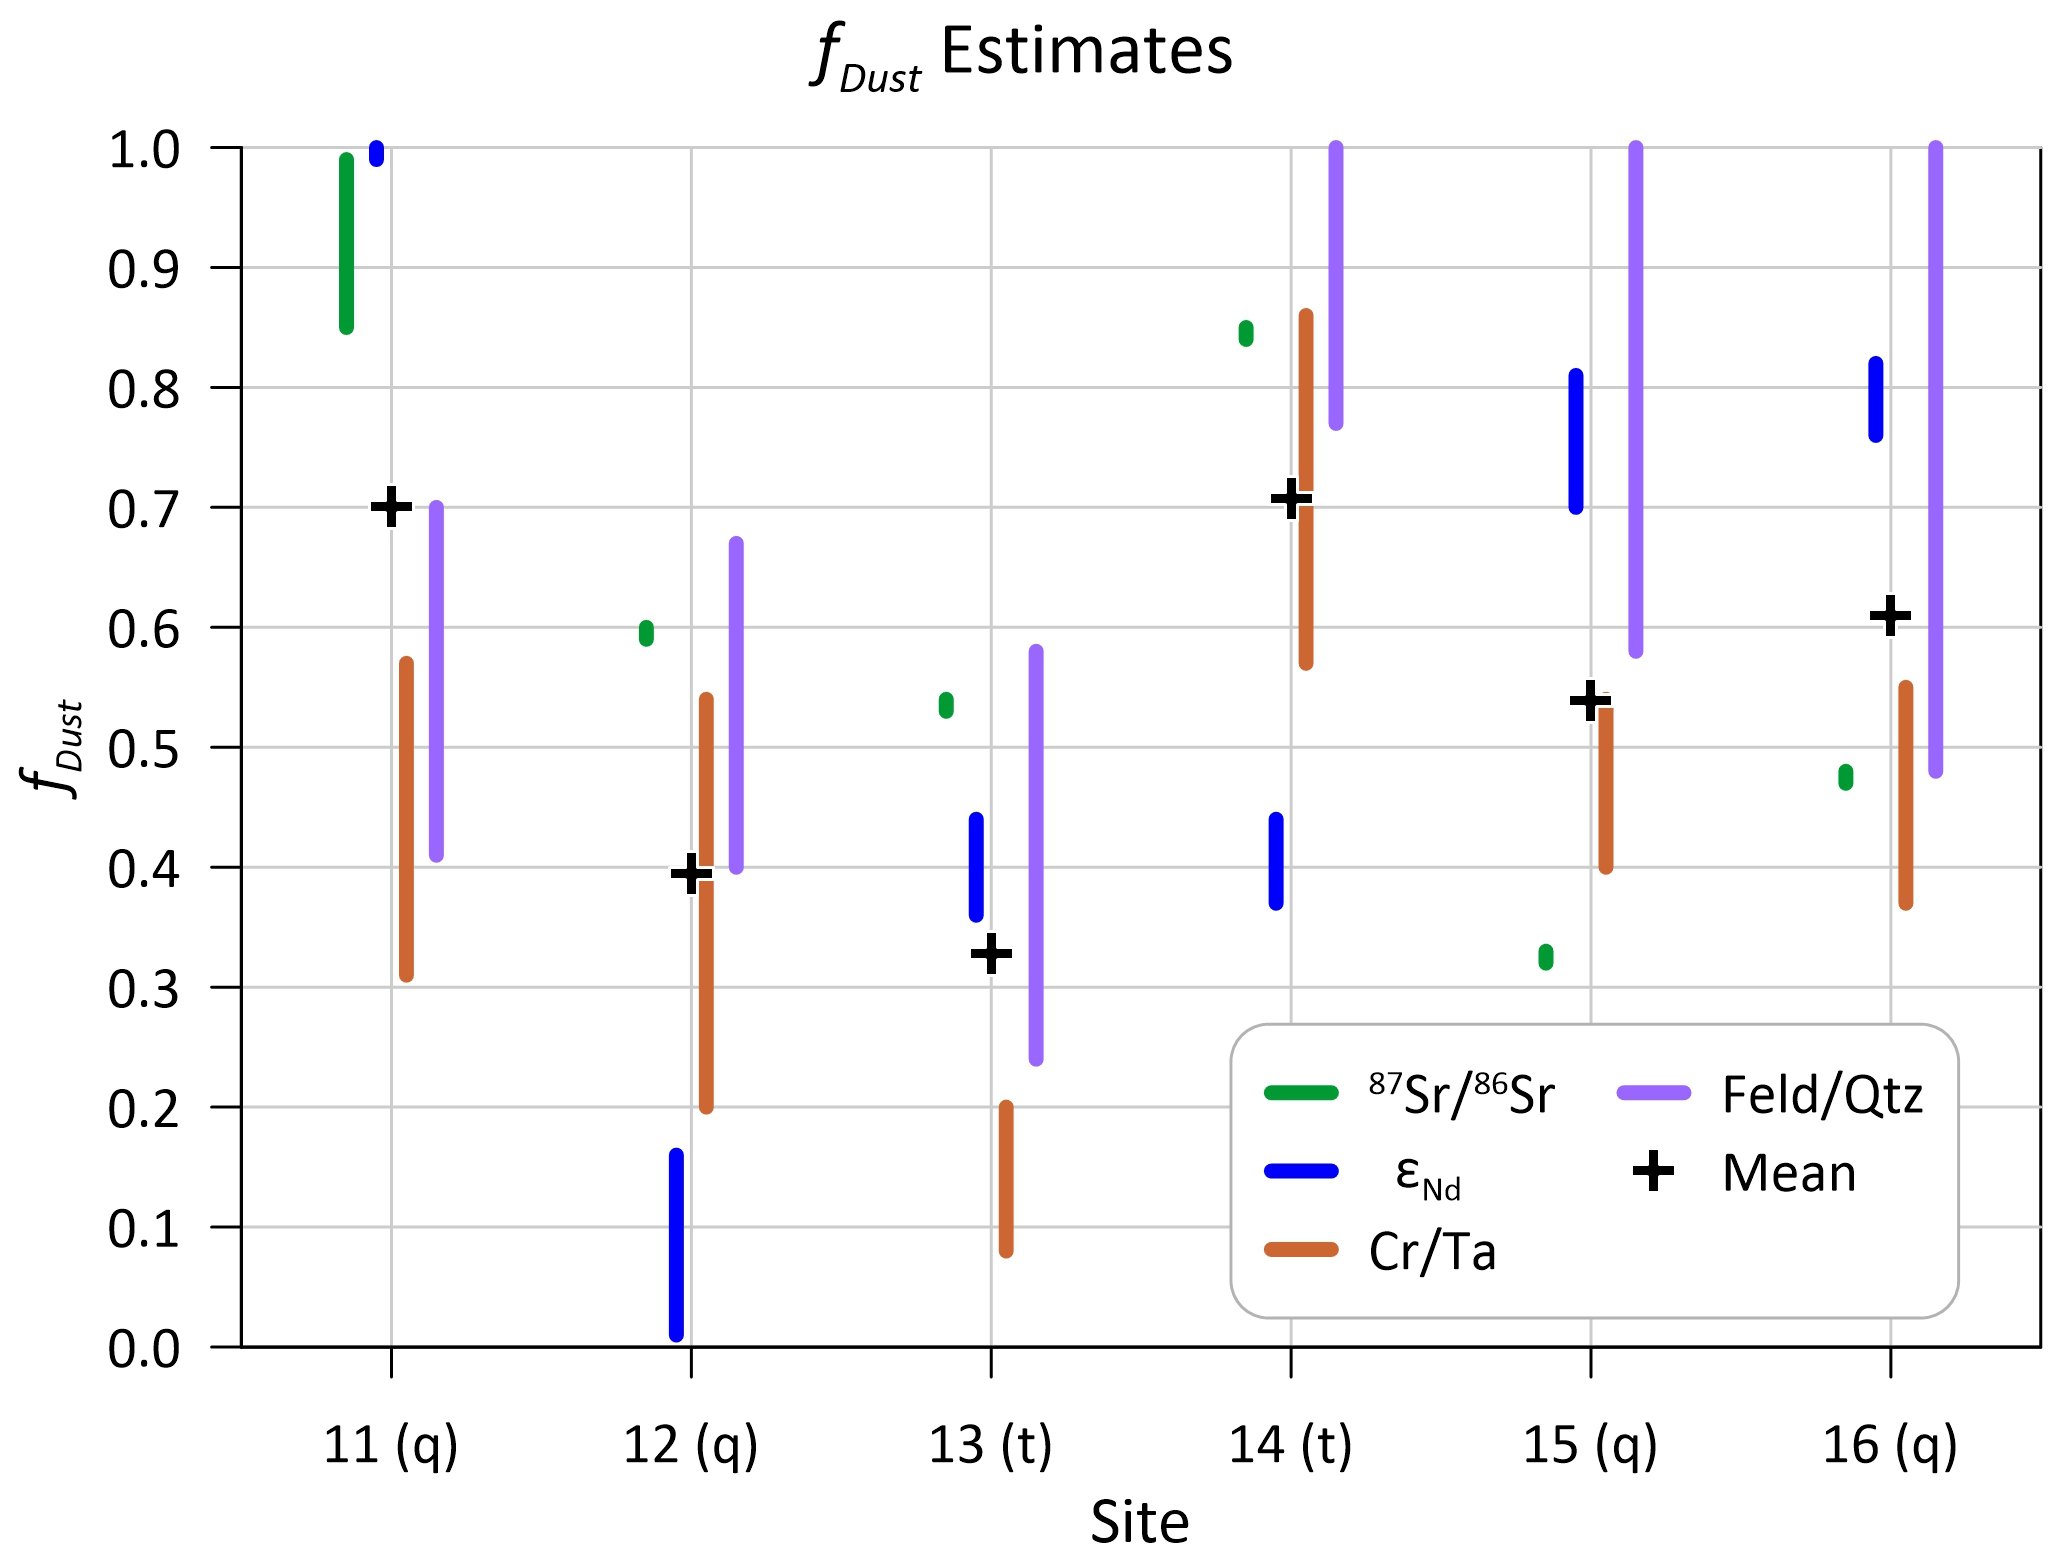
Figure 11Summary of fDust estimates at the six study sites (x axis) from four mixing models: and εNd, , and feldquartz. The vertical extent of each bar reflects the range of estimates for a given approach at a given site. The black crosses represent the overall mean at each site. Note that “q” designates quartzite bedrock, and “t” denotes trachyte.
This study was designed to evaluate the contribution of eolian dust to soil formation in the alpine critical zone across a range of mountain locations. Through the collection and analysis of dust, soil, and rock samples, three complementary objectives were targeted: (1) to characterize the mineralogy and geochemistry of dust, soil, and rock samples from the six study sites; (2) to quantify the fraction of the soil at each site derived from dust; and (3) to evaluate whether the dust fraction is more elevated at sites underlain by less weatherable bedrock lithologies.
5.1 Comparison of mineralogy and geochemistry
The mineralogical and geochemical analyses conducted as part of this project provide the framework necessary for evaluating the degree of similarity between the dust, soil, and rock samples at each site. X-ray diffraction clearly reveals that minerals present in the dust, such as feldspars, mica, illite, and kaolinite, are abundant in the soils, even in situations where these minerals are absent in the underlying bedrock (Fig. 6). This situation reveals that these minerals accumulate in the soil as a result of dust deposition over time, with the implication that the mineralogy of these soils would be quite different in the absence of dust deposition (Yaalon and Ganor, 1973). A similar causal connection between dust and soil mineralogy was reported for the mountain CZ in northern Utah (Munroe et al., 2015, 2021b), in Colorado (Lawrence et al., 2011; Litaor, 1987; Birkeland et al., 2003), and in Wyoming (Dahms, 1993), as well as for mountain locations around the world such as Taiwan (Tsai et al., 2021), Australia (Johnston, 2001), the Tibetan Plateau (Lin and Feng, 2015), and the Alps (Peer et al., 2022; Grashey-Jansen et al., 2014; Küfmann, 2003).
The geochemical results reinforce the interpretation that soil composition has been impacted by dust deposition. At all sites, the geochemistry of the soil samples more closely resembles that of the dust. This relationship is particularly obvious in the results of principal component analysis (Fig. 7). At the locations of DUST-11, 12, 15, and 16, the values for PC-1 and PC-2 overlap for dust and soil, indicating that they are essentially identical. In contrast, values for the rock samples at these sites plot in a non-overlapping field, indicating a great deal of dissimilarity. Further support comes from REEs (Fig. 8). Values of in dust and soil are similar at all sites, whereas values in rock samples vary considerably. Values of Eu* vary in a narrow range at DUST-11, 12, 15, and 16 but exhibit more spread at DUST-13 and DUST-14. Despite the variability in rock samples, at all locations, soil is similar to dust. Collectively, these patterns are consistent with soil formation from a mixture of dust and rock, with a dominance of dust at most sites.
The abundance of trace elements provides another line of argument for the importance of dust deposition as a control on the chemistry of these mountain soils. As noted previously, the abundances of most measured elements are higher in dust and soil samples than in rock at each site. Ratios of abundance of dustrock are >1.0 for nearly all measured elements. The highest average dustrock ratio is 212 for Sb, followed by 165 for Sn, 64 for P, 34 for Cu, 35 for Cd, and 31 for Zn. Many of these elements were reported in previous studies to have abundances elevated above natural levels by anthropogenic activity (Lawrence and Neff, 2009; Lawrence et al., 2010; Munroe, 2014; Heindel et al., 2020). Of the non-anthropogenic elements reported by Reynolds et al. (2010), Ca exhibits the greatest enrichment in dust relative to rock (25×) followed by Na, Cr, Rb, and Ti, all with values . Notably, the ratios dustrock and soilrock for the elements reported by Reynolds et al. (2010) exhibit a significant positive correlation, with an r2 of 0.974 (P<0.001). Collectively, these relationships underscore that most elements are present in higher abundances in dust and soil compared with rock and that elements enriched to a greater degree in dust tend to be enriched to a correspondingly greater degree in soil.
Given their established utility as essentially immutable fingerprints, and εNd provide a particularly strong argument supporting the similarity of dust and soils in this study. As is clear from Fig. 9, the isotopic fingerprints of the dust collected at the different sites is consistent from season to season, and at DUST-11, 12, 15, and 16, they are indistinguishable from the soil samples. At DUST-13 and 14, the soil sample plots in a more intermediate position between dust and rock. In all cases, despite the wide-ranging and εNd of the rock, dust and soil generally plot in the same region. This consistency is best explained if the soils contain a large amount of dust and a correspondingly minor contribution of weathered local bedrock.
As with the mineralogy results, the conclusion that dust deposition has impacted the abundances of major and trace elements in these soils, along with and εNd, is supported by studies of mountain soils from other locations. For instance, in northern Utah, alpine soils over SiO2-dominated quartzite bedrock were shown to be strongly controlled by Quaternary dust deposition, with elemental chemistry and and εNd of soil resembling dust and playa sources upwind and strongly contrasting with local bedrock (Munroe et al., 2020). In Colorado, mountain soils demonstrate a clear geochemical affinity with dust in their geochemistry and isotope fingerprint (Muhs and Benedict, 2006; Lawrence et al., 2013). In Idaho, ratios of immobile elements were shown to correlate between dust and soil (Ferrier et al., 2011). In Wyoming, the geochemistry of soils has changed as a result of the incorporation of Zr-poor eolian material over time (Reheis, 1990). In California, mountain soils in the Sierra Nevada have an isotope fingerprint that matches a mixture of Asian dust delivered by trans-Pacific transport and more regional material from California's Central Valley (Aciego et al., 2017). And in New Mexico, gypsiferous dust derived from White Sand National Monument has a measurable impact on the chemistry and of soils positioned over sandstone in the Sacramento Mountains (Rea et al., 2020). Collectively, the mineralogical and geochemical results of this study clearly indicate that soils on these six widely distributed mountain summits have been strongly influenced by dust deposition, a finding that expands upon previous work focused on more limited spatial scales.
5.2 Dust fraction in soils
The conclusion that dust deposition plays a major role in controlling the mineralogy and geochemistry of the soils considered in this study leads naturally to the question of how much of the soil at each site is derived from dust deposition. Prior work from specific locations has yielded a range of estimates that provide context for the results presented here. For instance, in the San Juan Mountains of southwestern Colorado, mountain soils were estimated to contain 10 % to 40 % eolian dust on the basis of and εNd measurements (Lawrence et al., 2011). Values for fDust were generally higher for soils over more resistant metamorphic bedrock and were lower above less resistant volcanic rock. Following a similar isotope-based methodology, Munroe et al. (2020) estimated that alpine soils over weathering-resistant quartzite in Utah contain 50 % to 80 % dust. Together, these studies indicate that the dust content in mountain soils can be large and hint that the relative weatherability of the underlying bedrock can exert an influence on the magnitude of the dust component.
The range of fDust estimates generated in this study are consistent with this prior work (Fig. 11, Table 5). It is not possible to determine which of the approaches ( and εNd, , or feldquartz) is the most accurate, and given the varying bedrock lithologies, it should not be expected that one ratio would be equally appropriate at all sites. Therefore, an ensemble approach considering the range of estimates from all four ratios is considered to be prudent. With this in mind, the overall average of 0.56 ± 0.24 (all four estimates at all six sites) is intermediate between the somewhat higher values over resistant quartzite in Utah and the lower values over more weatherable rock types in Colorado. Moreover, the lowest site-specific estimate (mean of 0.34) is over volcanic trachyte in the Tushar Mountains at DUST-13. In contrast, estimates are higher over quartzite bedrock at DUST-11, 15, and 16. This pattern supports the prediction that the importance of dust deposition to soil formation will be elevated at sites where the bedrock is weathering more slowly and diminished in locations where the bedrock is more vulnerable to weathering.
Estimates of fDust are less straightforward to interpret at DUST-12 and DUST-14. At DUST-12 the bedrock is quartzite, which would support the expectation of a large dust component in the soils, yet fDust estimates at this site are rather low, with a mean of 0.49. A significant factor is the very low (<0.10) value derived from εNd. However, in contrast with the other sites, at DUST-12, there is very little spread in the values of εNd between dust, soil, and rock (Fig. 9). As a result, fDust estimates based on εNd vary considerably (Table 5) and span an even wider array when the full error range is taken into account in the mixing model (Fig. 10). As a result, the fDust value for DUST-12 is likely underestimated, and if the εNd-based estimate is discounted, then the average for DUST-12 overlaps with the values determined for the other sites underlain by quartzite (DUST-11, 15, and 16).
At DUST-14, the bedrock is trachyte, similarly to DUST-13; however, the fDust estimates are higher. The value from εNd is identical to the estimate (0.40) from the same technique for DUST-13. Yet counter-balancing that value is a very high estimate (0.96) from feldquartz and a high, but narrowly constrained (0.85), value from . Both of these may relate to the bedrock at this site, which contains considerably more feldspar (Fig. 6) than the other locations (mapped as hornblende plagioclase trachyte), has a feldquartz ratio 2 orders of magnitude higher than the others (Table 3), and exhibits an unusually low ratio with relatively radiogenic εNd (Fig. 9). Rock samples from DUST-14 also have a much lower ratio (0.2) than those at DUST-13 (23), reducing the potential for radiogenic ingrowth through decay of 87Rb. These unique properties of the bedrock at DUST-14 complicate attempts to compare results from this site with the other locations when calculated with the same methods. Furthermore, the dust at DUST-14 has a feldquartz ratio that is notably low when compared with the other locations (Table 3), reflecting the preponderance of siliciclastic sedimentary rocks in the upwind region of the Colorado Plateau. Collectively these factors challenge efforts to constrain fDust at DUST-14; however, it is nonetheless notable that the estimate from εNd is low and identical at the two sites underlain by volcanic rocks.
5.3 Dust influence on pedogenesis
Together, the mineralogy and geochemical results strongly support the conclusion that eolian dust is the dominant parent material for the alpine soils at the locations considered in this study. Therefore, it is a useful exercise to consider the soil texture and fertility in light of dust properties to evaluate how pedogenesis may have been influenced by dust deposition. Perhaps the most straightforward connection relates to soil texture. At all sites, regardless of the nature of the underlying bedrock, nearly all of the bulk soils have silt loam textures (Fig. 4), with total silt averaging 70 % (Table 2). Silt, particularly in the very fine silt class (2–7 µm), is also the most abundant grain size class in the dust samples from these locations (Munroe et al., 2023). This correspondence is consistent with eolian silt as the main parent material for these soils and matches previous studies comparing dust and soil grain size distributions in mountain settings (Lawrence et al., 2011; Munroe et al., 2020; Litaor, 1987).
Bulk soil grain size also corresponds with bedrock lithology, and the assessment of dust importance at each site presented above. The coarsest soils are at DUST-13 and DUST-14, where sand content averages 30 % and total silt drops to 60 % (Table 2). This pattern is consistent with a larger contribution of coarse material from physically weathered bedrock at these locations, where the trachyte lithology should be less resistant than the metamorphic quartzite present at the other sites.
The average amount of extractable Ca in the soils is elevated at sites were the Ca content of dust is greater (Fig. S2a in the Supplement), mineral Ca abundance in soils is positively and significantly correlated (P=0.019) with Ca abundance in the dust (Fig. S2b), and base saturation in these soils is dominated by Ca (Table 2). Furthermore, as noted above, ratios of elemental abundance in dustrock and soilrock reveal that Ca content is greatly elevated in the dust, an observation corroborated by previous work (Munroe et al., 2021a). The wet technique used in this study to remove dust from the collectors might dissolve fine-grained calcite, making it difficult to assess whether calcite is present in the dust, as reported in previous studies (Litaor, 1987). However, XRD does demonstrate that Ca-bearing minerals such as plagioclase feldspar are present in all of the dust samples. Therefore, it seems likely that dust is delivering Ca to these soils in mineral form and that weathering is releasing Ca to become plant-available. This same mechanism was invoked to explain the high Ca content of alpine soils in the Uinta Mountains of Utah (Bockheim et al., 2000) and in the Rocky Mountains of Colorado (Litaor, 1987). Supporting this interpretation is the observation that extractable K and Mg in the full set of soil samples (not just the six site averages) are significantly, and positively, correlated with the abundance of silt, with correlation coefficients of 0.639 (P<0.001) and 0.527 (P<0.001), respectively (Fig. S2c and d). Viewed collectively, mineral dust deposition has had an impact on the abundance of extractable Ca, K, and Mg in these soils.
Other aspects of the bulk soil properties presented in Fig. 5 can also be connected back to the conditions of each site and its regional position. Values of pH are generally highest at DUST-11 and 12 (Fig. 5); these two sites are located farthest to the southwest (Fig. 1) and closest to the dry playas of the central Great Basin, suggesting that they might be positioned to receive larger amounts of carbonate and evaporite minerals. In contrast, DUST-15 and 16 are located farthest to the northwest, where they likely receive dust delivered from the igneous terrane of the Snake River Plain that could be less able to counteract natural sources of acidity. Organic matter abundance is highest at DUST-15 (Fig. 5); however, this relatively low elevation site (Table 1) is the only one where (dwarf) trees are present in the vicinity of the collector. Thus, soils at this location could contain higher amounts of organic matter due to greater abundance of vegetation now and in the past. The two unusually high values of extractable P at DUST-12 were samples collected from beneath vegetation (as opposed to from barren ground). Therefore, it may be that biochemical cycling at these micro-sites concentrated P or, conversely, that these locations are vegetated as a consequence of elevated P abundance. Finally, CEC is correlated (r=0.376, P=0.026) with the abundance of silt, matching the connection between silt and extractable K and Mg noted above.
Collectively the mountain soils considered in this study are shallow and stony and exhibit weak horizonation. Given their locations, they are also cold and spend much of the year frozen. Nonetheless, they are surprisingly fertile (Table 2), with circumneutral pH values; organic matter abundance averaging 6 %, abundant plant-available Ca, K, and Mg; and cation exchange capacities similar to high-quality agricultural fields (Holmgren et al., 1993). That these soils exhibit such high fertility cannot be traced back to their underlying bedrock, which, at four of the six sites, is quartzite and, at all sites, should be weathering slowly given the periglacial climates. Instead, the properties of these soils can best be explained as a result of long-term dust additions, corroborating conclusions from previous site-specific investigations of alpine soils (Bockheim et al., 2000; Litaor, 1987; Birkeland et al., 2003).
5.4 Implications
The results presented here clearly establish that the alpine soils considered in this study are a product of eolian dust deposition. Much of the silt in these soils, which relates to their water-holding capacity (Petersen et al., 1968), absolute surface area (Lawrence et al., 2011), and their ability to accommodate plant roots (Catt, 2001), has apparently been delivered as eolian material. Similarly, their notably high levels of plant-available nutrients can be traced back to the mineralogy and geochemistry of the dust they receive rather than to weathering of the underlying bedrock (Aciego et al., 2017). The wide spatial scale of the network of dust collectors employed in this work (Fig. 1) represents a significant advance beyond the site-specific focus of previous projects and firmly establishes that the mountain CZ across a wide swath of southwestern North America has been profoundly influenced by long-term dust deposition. Simply stated, alpine soils in this region would not be what they are were it not for the dust they have accumulated over time.
The primary implication of this conclusion is that future changes in dust flux will have corresponding effects on future soil formation in the mountain CZ. Studies utilizing lake sediment archives have demonstrated that dust fluxes to the Rocky Mountains changed during the Holocene, likely in response to climatic factors (Arcusa et al., 2020; Routson et al., 2016, 2019; Munroe et al., 2021a); thus, dust flux should not be expected to be invariant. This realization is concerning for two reasons. First, dust delivery rates increased massively in response to European settlement in the southwestern US, underscoring the connection between human activity in the lowlands and dust delivery to downwind mountain ecosystems (Neff et al., 2008). As the population continues to grow in this region, which is home to some of the fastest-growing cities in the United States (Wu et al., 2011), land surface disturbance leading to increased dust emissions is almost unavoidable (Duniway et al., 2019; Belnap, 1995). Second, climate models predict that the arid parts of southwestern North America are likely to become even drier in the future (Cayan et al., 2010; Cook et al., 2015; Seager et al., 2013, 2007), and analysis of a 10-year dust deposition record in the Uinta Mountains confirms that greater aridity in the southwestern US corresponds to higher rates of dust deposition in downwind mountains (Munroe, 2022). Collectively, these insights support the prediction that dust fluxes to the mountain CZ in this region are likely to remain high, and possibly increase, in the future. This change could affect mountain soils and the geo-ecological systems they support in a variety of ways, both positively and negatively.
An additional concern pertains to the elevated trace element abundances in modern dust. Analysis of modern dust and lake sediment records has demonstrated that many elements, including heavy metals of environmental concern such as As, Cu, Cd, Mo, Pb, and Zn, are present at levels greatly in excess of their normal crustal values (Lawrence et al., 2010; Heindel et al., 2020; Munroe, 2014) and that many of these began to increase in abundance in concert with European settlement in the 19th century and with the start of widespread mining, smelting, and land surface alteration in the drylands of southwestern North America (Reynolds et al., 2010; Munroe et al., 2015). Corresponding to their high abundances in dust, many trace metals are also present at elevated abundances in alpine soils, as noted here and in previous work (Lawrence et al., 2013). It remains unclear whether trace metals are accumulating in alpine soils to levels high enough to have environmental consequences (Lawrence et al., 2013); however, studies have demonstrated that the deposition of dust-derived metals has begun to impact sensitive mountain hydrologic systems (Moser et al., 2010). The question of whether soils in the mountain CZ are being negatively impacted by trace element loading remains open and should be investigated by future studies.
At six mountain sites in the southwestern United States, the mineralogy, geochemistry, and radiogenic isotope fingerprint of soils are very similar to those of modern dust and consistently divergent from the local bedrock. This relationship is evidence that soils in the mountain critical zone (CZ) across this broad region are strongly influenced by the deposition of eolian material. This dust deposition controls soil texture and delivers minerals not present in the local bedrock, with corresponding positive effects on moisture-holding capacity and fertility. This dust is also delivering heavy metals that are accumulating in the soils, with potential negative implications for future soil quality. Projections of increasing aridity and anthropogenic land surface disturbance in this region suggest that soils of the mountain CZ will be influenced by dust deposition to an even greater degree in the future. This causal connection between land use at low elevations and functioning of the CZ in the mountains should be taken into account when designing management strategies for arid landscapes subject to a variety of development pressures.
The data compiled in this study are available in the EarthChem Library at https://doi.org/10.26022/IEDA/113001 (Munroe, 2024a) (dust chemistry 2021–2022), https://doi.org/10.26022/IEDA/113002 (Munroe, 2024b) (soil and rock chemistry), and https://doi.org/10.26022/IEDA/112309 (Munroe, 2024c) (dust chemistry 2020–2021).
The supplement related to this article is available online at: https://doi.org/10.5194/soil-10-167-2024-supplement.
JSM conceived the project, acquired the funding, developed the methodology, conducted the investigations, administered the project, analyzed the results, conducted the data visualization, and wrote the paper. AAS, EJS, and MJT participated in the analyses. All the authors were involved in revising the paper for submission.
The contact author has declared that none of the authors has any competing interests.
Publisher's note: Copernicus Publications remains neutral with regard to jurisdictional claims made in the text, published maps, institutional affiliations, or any other geographical representation in this paper. While Copernicus Publications makes every effort to include appropriate place names, the final responsibility lies with the authors.
The authors thank Shane Lusk, Diane Munroe, and Emmet Norris for their help in the field and Camryn Kluetmeier for the assistance in the laboratory. The dust collectors were built by Eamon McMahon at Middlebury College. Patrice de Caritat and Ruth Heindel provided helpful suggestions during peer review. Fieldwork took place in the ancestral homelands of the Goshute, Shoshone, and Ute tribes.
This research has been supported by the Directorate for Geosciences (grant no. EAR-2012082) and by Middlebury College.
This paper was edited by Jonathan Maynard and reviewed by Ruth Heindel and Patrice de Caritat.
Aciego, S. M., Riebe, C. S., Hart, S. C., Blakowski, M. A., Carey, C. J., Aarons, S. M., Dove, N. C., Botthoff, J. K., Sims, K. W. W., and Aronson, E. L.: Dust outpaces bedrock in nutrient supply to montane forest ecosystems, Nat. Commun., 8, 14800, https://doi.org/10.1038/ncomms14800, 2017.
Arcusa, S. H., McKay, N. P., Routson, C. C., and Munoz, S. E.: Dust-drought interactions over the last 15 000 years: A network of lake sediment records from the San Juan Mountains, Colorado, Holocene, 30, 559–574, 2020.
Arvin, L. J., Riebe, C. S., Aciego, S. M., and Blakowski, M. A.: Global patterns of dust and bedrock nutrient supply to montane ecosystems, Sci. Adv., 3, eaao1588, https://doi.org/10.1177/0959683619875192, 2017.
Belnap, J.: Surface disturbances: Their role in accelerating desertification, Environ. Monit. Assess., 37, 39–57, https://doi.org/10.1007/BF00546879, 1995.
Birkeland, P. W., Shroba, R. R., Burns, S. F., Price, A. B., and Tonkin, P. J.: Integrating soils and geomorphology in mountains – an example from the Front Range of Colorado, Geomorphology, 55, 329–344, 2003.
Bockheim, J., Munroe, J., Douglass, D., and Koerner, D.: Soil development along an elevational gradient in the southeastern Uinta Mountains, Utah, USA, Catena, 39, 169–185, 2000.
Brantley, S. L., Goldhaber, M. B., and Ragnarsdottir, K. V.: Crossing disciplines and scales to understand the critical zone, Elements, 3, 307–314, 2007.
Capo, R. C., Stewart, B. W., and Chadwick, O. A.: Strontium isotopes as tracers of ecosystem processes: theory and methods, Geoderma, 82, 197–225, 1998.
Catt, J. A.: The agricultural importance of loess, Earth-Sci. Rev., 54, 213–229, https://doi.org/10.1016/S0012-8252(01)00049-6, 2001.
Cayan, D. R., Das, T., Pierce, D. W., Barnett, T. P., Tyree, M., and Gershunov, A.: Future dryness in the southwest US and the hydrology of the early 21st century drought, P. Natl. Acad. Sci. USA, 107, 21271–21276, 2010.
Colville, E. J., Carlson, A. E., Beard, B. L., Hatfield, R. G., Stoner, J. S., Reyes, A. V., and Ullman, D. J.: Sr-Nd-Pb Isotope Evidence for Ice-Sheet Presence on Southern Greenland During the Last Interglacial, Science, 333, 620–623, https://doi.org/10.1126/science.1204673, 2011.
Cook, B. I., Ault, T. R., and Smerdon, J. E.: Unprecedented 21st century drought risk in the American Southwest and Central Plains, Science Advances, 1, e1400082, https://doi.org/10.1126/sciadv.1400082, 2015.
Crouvi, O., Pelletier, J. D., and Rasmussen, C.: Predicting the thickness and aeolian fraction of soils in upland watersheds of the Mojave Desert, Geoderma, 195, 94–110, 2013.
Cunningham, C. G., Rowley, P. D., Steven, T. A., and Rye, R. O.: Geologic evolution and mineral resources of the Marysvale volcanicfield, west-Central Utah, edited by: Willis, G. C., Hylland, M. D., Clark, D. L., and Chidsey, T. C., Central Utah, diverse geology of adynamic landscape, 36, 143–162, Utah Geological Association Publication, 2007.
Dahms, D. E.: Mineralogical evidence for eolian contribution to soils of late Quaternary moraines, Wind River Mountains, Wyoming, USA, Geoderma, 59, 175–196, 1993.
Derry, L. A. and Chadwick, O. A.: Contributions from Earth's atmosphere to soil, Elements, 3, 333–338, 2007.
Dixon, J. C. and Thorn, C. E.: Chemical weathering and landscape development in mid-latitude alpine environments, Geomorphology, 67, 127–145, 2005.
Duniway, M. C., Pfennigwerth, A. A., Fick, S. E., Nauman, T. W., Belnap, J., and Barger, N. N.: Wind erosion and dust from US drylands: a review of causes, consequences, and solutions in a changing world, Ecosphere, 10, e02650, https://doi.org/10.1002/ecs2.265, 2019.
Faure, G.: Principles and applications of geochemistry, Prentice Hall, Upper Saddle River, NJ, ISBN 0-02-336450-5, 1997.
Ferrier, K. L., Kirchner, J. W., and Finkel, R. C.: Estimating millennial-scale rates of dust incorporation into eroding hillslope regolith using cosmogenic nuclides and immobile weathering tracers, J. Geophys. Res.-Earth, 116, https://doi.org/10.1029/2011JF001991, 2011.
Grashey-Jansen, S., Korch, O., Beck, C., Friedmann, A., Bernhard, R., and Dubitzky, C.: Aeolian influenced soil sites in consideration of atmospheric circulation types–a case study in the alpine zone of the Zugspitzplatt (Northern Calcareous Alps, Germany), Journal of Geology, Agriculture and Environmental Sciences, 2, 11–19, 2014.
Graustein, W. C. and Armstrong, R. L.: The use of strontium-87/strontium-86 ratios to measure atmospheric transport into forested watersheds, Science, 219, 289–292, 1983.
Greilinger, M. and Kasper-Giebl, A.: Saharan Dust Records and Its Impact in the European Alps, in: Oxford Research Encyclopedia of Climate Science, edited by: von Storch, H., Oxford University Press, https://doi.org/10.1093/acrefore/9780190228620.013.827, 2021.
Hagedorn, F., Mulder, J., and Jandl, R.: Mountain soils under a changing climate and land-use, Biogeochemistry, 97, 1–5, 2010.
Heindel, R. C., Putman, A. L., Murphy, S. F., Repert, D. A., and Hinckley, E.-L. S.: Atmospheric Dust Deposition Varies by Season and Elevation in the Colorado Front Range, USA, J. Geophys. Res.-Earth, 125, e2019JF005436, https://doi.org/10.1029/2019JF005436, 2020.
Hirmas, D. R. and Graham, R. C.: Pedogenesis and soil-geomorphic relationships in an arid mountain range, Mojave Desert, California, Soil Sci. Soc. Am. J., 75, 192–206, 2011.
Holmgren, G. G. S., Meyer, M. W., Chaney, R. L., and Daniels, R. B.: Cadmium, lead, zinc, copper, and nickel in agricultural soils of the United States of America, Wiley Online Library, https://doi.org/10.2134/jeq1993.00472425002200020015, 1993.
Hose, R. K. and Blake Jr., M. C.: Geology and Mineral Resources of White Pine County, Nevada, Part 1. Geology: Nevada Bureau of Mines and Geology Bulletin 85, 1–35, map scale 1:250,000, 1976.
Huggett, R. J.: Soil landscape systems: a model of soil genesis, Geoderma, 13, 1–22, 1975.
Hunt, C. B. and Waters, A. C.: Structural and igneous geology of the La Sal Mountains, Utah: U.S. Geological Survey Professional Paper 294-I, 305–364, 1958.
Jenny, H.: Factors of soil formation: a system of quantitative pedology, McGraw-Hill, New York, ISBN 13 978-0486681283, 1983.
Jochum, K. P., Weis, U., Schwager, B., Stoll, B., Wilson, S. A., Haug, G. H., Andreae, M. O., and Enzweiler, J.: Reference Values Following ISO Guidelines for Frequently Requested Rock Reference Materials, Geostand. Geoanal. Res., 40, 333–350, https://doi.org/10.1111/j.1751-908X.2015.00392.x, 2016.
Johnston, S. W.: The influence of aeolian dust deposits on alpine soils in south-eastern Australia, Soil Res., 39, 81–88, https://doi.org/10.1071/sr99121, 2001.
Küfmann, C.: Soil types and eolian dust in high-mountainous karst of the Northern Calcareous Alps (Zugspitzplatt, Wetterstein Mountains, Germany), Catena, 53, 211–227, 2003.
Lawrence, C. R. and Neff, J. C.: The contemporary physical and chemical flux of aeolian dust; a synthesis of direct measurements of dust deposition, Chem. Geol., 267, 46–63, https://doi.org/10.1016/j.chemgeo.2009.02.005, 2009.
Lawrence, C. R., Painter, T. H., Landry, C. C., and Neff, J. C.: Contemporary geochemical composition and flux of aeolian dust to the San Juan Mountains, Colorado, United States, J. Geophys. Res., 115, G03007, https://doi.org/10.1029/2009JG001077, 2010.
Lawrence, C. R., Neff, J. C., and Farmer, Gl.: The accretion of aeolian dust in soils of the San Juan Mountains, Colorado, USA, J. Geophys. Res.-Earth, 116, F02013, https://doi.org/10.1029/2010JF001899, 2011.
Lawrence, C. R., Reynolds, R. L., Ketterer, M. E., and Neff, J. C.: Aeolian controls of soil geochemistry and weathering fluxes in high-elevation ecosystems of the Rocky Mountains, Colorado, Geochim. Cosmochim. Ac., 107, 27–46, 2013.
Lin, Y.-C. and Feng, J.-L.: Aeolian dust contribution to the formation of alpine soils at Amdo (Northern Tibetan Plateau), Geoderma, 259–260, 104–115, https://doi.org/10.1016/j.geoderma.2015.05.012, 2015.
Litaor, M. I.: The influence of eolian dust on the genesis of alpine soils in the Front Range, Colorado, Soil Sci. Soc. Am. J., 51, 142–147, 1987.
Litherland, M. M. and Klemperer, S. L.: Crustal structure of the Ruby Mountains metamorphic core complex, Nevada, from passive seismic imaging, Geosphere, 13, 1506–1523, 2017.
Mason, J. A. and Jacobs, P. M.: Chemical and particle-size evidence for addition of fine dust to soils of the midwestern United States, Geology, 26, 1135–1138, 1998.
Miller, D. M.: Structural geology of the northern Albion Mountains, Geol. Soc. Am. Mem., 153, 399–423, 1980.
Moser, K. A., Mordecai, J. S., Reynolds, R. L., Rosenbaum, J. G., and Ketterer, M. E.: Diatom changes in two Uinta mountain lakes, Utah, USA: responses to anthropogenic and natural atmospheric inputs, Hydrobiologia, 648, 91–108, 2010.
Muhs, D. R. and Benedict, J. B.: Eolian additions to late Quaternary alpine soils, Indian Peaks Wilderness Area, Colorado Front Range, Arct. Antarct. Alp. Res., 38, 120–130, 2006.
Munroe, J. S.: Properties of modern dust accumulating in the Uinta Mountains, Utah, USA, and implications for the regional dust system of the Rocky Mountains, Earth Surf. Proc. Land., 39, 1979–1988, 2014.
Munroe, J. S.: Relation between regional drought and mountain dust deposition revealed by a 10 year record from an alpine critical zone, Sci. Total Environ., 844, 156999, https://doi.org/10.1016/j.scitotenv.2022.156999, 2022.
Munroe, J. S.: Data from the DUST∧2 Project, Collectors DUST-1 through DUST-18, winter 2021–22 and summer 2022, https://doi.org/10.26022/IEDA/113001 (last access: 14 February 2024a.
Munroe, J. S.: Data from the DUST∧2 Project, Soil and Rock from Collectors DUST-11 through DUST-16, https://doi.org/10.26022/IEDA/113002 (last access: 14 February 2024b.
Munroe, J. S.: Data from the DUST∧2 Project, Collectors DUST-1 through DUST-17, winter 2020-21 and summer 2021, https://doi.org/10.26022/IEDA/112309 (last access: 14 February 2024c.
Munroe, J. S., Attwood, E. C., O'Keefe, S. S., and Quackenbush, P. J.: Eolian deposition in the alpine zone of the Uinta Mountains, Utah, USA, Catena, 124, 119–129, 2015.
Munroe, J. S., Norris, E. D., Olson, P. M., Ryan, P. C., Tappa, M. J., and Beard, B. L.: Quantifying the contribution of dust to alpine soils in the periglacial zone of the Uinta Mountains, Utah, USA, Geoderma, 378, 114631, https://doi.org/10.1016/j.geoderma.2020.114631, 2020.
Munroe, J. S., McElroy, R., O'Keefe, S., Peters, A., and Wasson, L.: Holocene records of eolian dust deposition from high-elevation lakes in the Uinta Mountains, Utah, USA, J. Quaternary Sci., 36, 66–75, 2021a.
Munroe, J. S., Ryan, P. C., and Proctor, A.: Pedogenic clay formation from allochthonous parent materials in a periglacial alpine critical zone, Catena, 203, 105324, 2021b.
Munroe, J. S., Soderstrom, E. J., Kluetmeier, C. L., Tappa, M. J., Mallia, D. V., and Bauer, A. M.: Regional sources control dust in the mountain critical zone of the Great Basin and Rocky Mountains, USA, Environ. Res. Lett., 18, 104034, https://doi.org/10.1088/1748-9326/acfb26, 2023.
Nakamura, N.: Determination of REE, Ba, Fe, Mg, Na and K in carbonaceous and ordinary chondrites, Geochim. Cosmochim. Ac., 38, 757–775, 1974.
Neff, J. C., Ballantyne, A. P., Farmer, G. L., Mahowald, N. M., Conroy, J. L., Landry, C. C., Overpeck, J. T., Painter, T. H., Lawrence, C. R., and Reynolds, R. L.: Increasing eolian dust deposition in the western United States linked to human activity, Nat. Geosci., 1, 189–195, https://doi.org/10.1038/ngeo133, 2008.
Nesbitt, Hw. and Young, G. M.: Early Proterozoic climates and plate motions inferred from major element chemistry of lutites, Nature, 299, 715–717, 1982.
Osborn, G. and Bevis, K.: Glaciation in the Great Basin of the Western United States, Quaternary Sci. Rev., 20, 1377–1410, 2001.
Peer, T., Zheng, L.-J., Neubauer, F., Friedl, G., Hauzenberger, C., and Kasper-Giebl, A.: Mineralogical Composition and Origin of Airborne Dust in an Alpine Environment of Hochtor (Hohe Tauern, Austria): Effects on Pedogenesis, Biological Soil Crusts, and Vascular Plant Growth, Front. Earth Sci., 10, https://doi.org/10.3389/feart.2022.871211, 2022.
Petersen, G. W., Cunningham, R. L., and Matelski, R. P.: Moisture characteristics of Pennsylvania soils: II. Soil factors affecting mositure retention within a textural class – silt loam, Soil Sci. Soc. Am. J., 32, 866–870, 1968.
Pourmand, A., Prospero, J. M., and Sharifi, A.: Geochemical fingerprinting of trans-Atlantic African dust based on radiogenic Sr-Nd-Hf isotopes and rare earth element anomalies, Geology, 42, 675–678, 2014.
PRISM Climate Group: https://prism.oregonstate.edu/, last access: 16 June 2020.
Rea, P., Ma, L., Gill, T. E., Gardea-Torresdey, J., Tamez, C., and Jin, L.: Tracing gypsiferous White Sands aerosols in the shallow critical zone in the northern Sacramento Mountains, New Mexico using and ratios, Geoderma, 372, 114387, https://doi.org/10.1016/j.geoderma.2020.114387, 2020.
Reheis, M. C.: Influence of climate and eolian dust on the major-element chemistry and clay mineralogy of soils in the northern Bighorn Basin, USA, Catena, 17, 219–248, 1990.
Reheis, M. C. and Kihl, R.: Dust deposition in southern Nevada and California, 1984-1989: Relations to climate, source area, and source lithology, J. Geophys. Res.-Atmos., 100, 8893–8918, 1995.
Reheis, M. C., Budahn, J. R., and Lamothe, P. J.: Geochemical evidence for diversity of dust sources in the southwestern United States, Geochim. Cosmochim. Ac., 66, 1569–1587, 2002.
Reynolds, R. L., Mordecai, J. S., Rosenbaum, J. G., Ketterer, M. E., Walsh, M. K., and Moser, K. A.: Compositional changes in sediments of subalpine lakes, Uinta Mountains (Utah): evidence for the effects of human activity on atmospheric dust inputs, J. Paleolimnol., 44, 161–175, 2010.
Ross, M. L., Friedman, J. D., and Huffman, A. C.: Geology of the tertiary intrusive centers of the La Sal mountains, Utah: influence of preexisting structural features on emplacement and morphology. U.S. Geol. Surv. Bull. 2158, 61–83, 1998.
Routson, C. C., Overpeck, J. T., Woodhouse, C. A., and Kenney, W. F.: Three millennia of southwestern North American dustiness and future implications, PloS one, 11, e0149573, https://doi.org/10.1371/journal.pone.0149573, 2016.
Routson, C. C., Arcusa, S. H., McKay, N. P., and Overpeck, J. T.: A 4500-Year-Long Record of Southern Rocky Mountain Dust Deposition, Geophys. Res. Lett., 46, 8281–8288, https://doi.org/10.1029/2019GL083255, 2019.
Salters, V. J. M. and Stracke, A.: Composition of the depleted mantle, Geochem. Geophy. Geosy., 5, Q05B07, https://doi.org/10.1029/2003GC000597, 2004.
Seager, R., Ting, M., Held, I., Kushnir, Y., Lu, J., Vecchi, G., Huang, H.-P., Harnik, N., Leetmaa, A., and Lau, N.-C.: Model projections of an imminent transition to a more arid climate in southwestern North America, Science, 316, 1181–1184, 2007.
Seager, R., Ting, M., Li, C., Naik, N., Cook, B., Nakamura, J., and Liu, H.: Projections of declining surface-water availability for the southwestern United States, Nat. Clim. Change, 3, 482–486, 2013.
Simonson, R. W.: Airborne dust and its significance to soils, Geoderma, 65, 1–43, 1995.
Singh, R., Gupta, I., Raina, R., Mahajan, P., Srivastava, P., Singh, V. K., and Batish, D. R.: Mountain soils and climate change: importance, threats and mitigation measures, in: Understanding Soils of Mountainous Landscapes, Elsevier, edited by: Bhadouria, R., Singh, S., Tripathi, S., and Singh, P., ISBN 9780323959261, 3–21, 2023.
Soderberg, K. and Compton, J. S.: Dust as a Nutrient Source for Fynbos Ecosystems, South Africa, Ecosystems, 10, 550–561, https://doi.org/10.1007/s10021-007-9032-0, 2007.
Soil Survey Staff, Natural Resources Conservation Service: Official Soil Series Descriptions, https://soilseries.sc.egov.usda.gov/, last access: 6 February 2024.
Stres, B., Sul, W. J., Murovec, B., and Tiedje, J. M.: Recently Deglaciated High-Altitude Soils of the Himalaya: Diverse Environments, Heterogenous Bacterial Communities and Long-Range Dust Inputs from the Upper Troposphere, PLoS one, 8, e76440, https://doi.org/10.1371/journal.pone.0076440, 2013.
Tang, Y., Han, G., Wu, Q., and Xu, Z.: Use of rare earth element patterns to trace the provenance of the atmospheric dust near Beijing, China, Environ. Earth Sci., 68, 871–879, 2013.
Tito, R., Vasconcelos, H. L., and Feeley, K. J.: Mountain ecosystems as natural laboratories for climate change experiments, Frontiers in Forests and Global Change, 3, 38, https://doi.org/10.3389/ffgc.2020.00038, 2020.
Tsai, H., Chen, J.-H., Huang, W.-S., Huang, S.-T., Hseu, Z.-Y., and You, C.-F.: Aeolian additions of podzolic soils on the high-altitude mountains in central Taiwan-sediment origin and pedological implications, Geoderma, 383, 114726, https://doi.org/10.1016/j.geoderma.2020.114726, 2021.
World Imagery – Overview: https://www.arcgis.com/home/item.html?id=10df2279f9684e4a9f6a7f08febac2a9, last access: 9 November 2023.
Wu, J., Jenerette, G. D., Buyantuyev, A., and Redman, C. L.: Quantifying spatiotemporal patterns of urbanization: The case of the two fastest growing metropolitan regions in the United States, Ecol. Complex., 8, 1–8, 2011.
Yaalon, D. H. and Ganor, E.: The influence of dust on soils during the Quaternary, Soil Sci., 116, 146–155, 1973.
Zhao, W., Balsam, W., Williams, E., Long, X., and Ji, J.: Sr–Nd–Hf isotopic fingerprinting of transatlantic dust derived from North Africa, Earth Planet. Sc. Lett., 486, 23–31, 2018.
Zheng, K., Li, Y., Li, Z., and Huang, J.: Provenance tracing of dust using rare earth elements in recent snow deposited during the pre-monsoon season from mountain glaciers in the central to northern Tibetan Plateau, Environ. Sci. Pollut. R., 28, 45765–45779, 2021.