the Creative Commons Attribution 4.0 License.
the Creative Commons Attribution 4.0 License.
 | 12 Jan 2023
Forest liming in the face of climate change: the implications of restorative liming for soil organic carbon in mature German forests
Oliver van Straaten
Larissa Kulp
Guntars O. Martinson
Dan Paul Zederer
Ulrike Talkner
Forest liming is a management tool that has and continues to be used extensively across northern Europe to counteract acidification processes from anthropogenic sulfur and nitrogen (N) deposition. In this study, we quantified how liming affects soil organic carbon (SOC) stocks and attempt to disentangle the mechanisms responsible for the often contrasting processes that regulate net soil carbon (C) fluxes. Using a paired plot experimental design we compared SOC stocks in limed plots with adjacent unlimed control plots at 28 experimental sites to 60 cm soil depth in mature broadleaf and coniferous forests across Germany. Historical soil data from a subset of the paired experiment plots were analyzed to assess how SOC stocks in both control and limed plots changed between 1990 and 2019.
Overall, we found that forest floor C stocks have been accumulating over time in the control plots. Liming however largely offset organic layer buildup in the L/Of layer, and forest floor C stocks remained unchanged over time in the limed plots. This, in turn, meant that nutrients remained mobile and were not bound in soil organic matter complexes. Results from the paired plot analysis showed that forest floor C stocks were significantly lower in limed plots than the control (−34 %, −8.4 ± 1.7 Mg C ha−1) but did not significantly affect SOC stocks in the mineral soil, when all sites are pooled together. In the forest floor layers, SOC stocks exhibited an exponential decrease with increasing pH, highlighting how lime-induced improvements in the biochemical environment stimulate organic matter (OM) decomposition. Nevertheless, for both forest floor and mineral soils, the magnitude and direction of the belowground C changes hinged directly on the inherent site characteristics, namely, forest type (conifer versus broadleaf), soil pH, soil texture, and the soil SOC stocks. On the other hand, SOC stock decreases were often offset by other processes that fostered C accumulation, such as improved forest productivity or increased carbon stabilization, which correspondingly translated to an overall variable response by SOC stocks, particularly in the mineral soil.
Lastly, we measured soil carbon dioxide (CO2) and soil methane (CH4) flux immediately after a re-liming event at three of the experimental sites. Here, we found that (1) liming doubles CH4 uptake in the long-term; (2) soil organic matter mineralization processes respond quickly to liming, even though the duration and size of the CO2 flush varied between sites; and (3) lime-derived CO2 contributed very little to total CO2 emissions over the measurement period (determined using stable isotope approaches).
- Article
(3120 KB) - Full-text XML
-
Supplement
(1076 KB) - BibTeX
- EndNote


Millions of hectares of forest have been limed in Germany and across northern Europe over the last few decades to counteract soil acidification processes derived from anthropogenic sulfur (S) and nitrogen (N) deposition. Soil acidification is responsible for hindering organic matter decomposition processes and concomitantly immobilizing nutrients and carbon (Shen et al., 2021). The application of lime on acidic soils, as either calcium carbonate (CaCO3) or dolomite (CaMg(CO3)2), elicits a strong biochemical response by lowering soil acidity, reducing both aluminum (Al) and manganese toxicity, and increasing the soil's buffering capacity. These changes subsequently drive a cascade of ecosystem responses, with implications for soil fertility, forest productivity, stand vitality, and litter decomposition (Derome et al., 2000; Kreutzer, 1995), which in turn correspondingly affect the ecosystem carbon (C) balance (Melvin et al., 2013; Persson et al., 2021) and soil greenhouse gas (GHG) budgets. The direction and magnitude of ecosystem responses to liming depend on numerous factors, including (1) the inherent soil characteristics of the site (soil acidity, soil texture, the chemical makeup of the forest floor layer), (2) vegetation characteristics (species distributions, tree density, and stand age), (3) the application of lime (type and quantity of lime, and frequency of liming), and (4) the ongoing acidification from recent N and S deposition. In this context, both above- and belowground carbon stocks have been shown to have quite variable responses to liming (Court et al., 2018; Lundström et al., 2003; Melvin et al., 2013; Persson and Ahlström, 1990; Persson et al., 2021).
While it is broadly reported that liming stimulates soil microbial activity, leading to accelerated soil organic matter (SOM) decomposition (Andersson and Nilsson, 2001; Kreutzer, 1995), some studies report either no change in litter and forest floor decomposition (Smolander et al., 1996) or even forest floor organic matter accumulations (Derome et al., 2000; Melvin et al., 2013). Soil organic carbon (SOC) stock gains as a result of liming can be attributed to different drivers. First, earthworm abundance is known to increase after liming (Persson et al., 2021), which, by actively incorporating and binding SOM with the mineral soil, improves physical properties, such as soil structure and aggregate stability (Bronick and Lal, 2005). Second, physicochemical properties are also affected. Liming-induced changes in nutrient stoichiometry may enhance cation-mediated cross-linking between SOM compounds and divalent calcium (Ca) or magnesium (Mg) ions (Kalbitz et al., 2000), thereby stabilizing soil carbon. It has also been shown that higher soil Ca availability increases lignin contents in leaf litter, which makes litter more recalcitrant and resistant to decomposition (Eklund and Eliasson, 1990; Xing et al., 2021). Third, liming will affect microbial community structure and abundance, which has the potential to create nutrient imbalances (such as phosphorus) on decomposer communities and trees (Melvin et al., 2013), which in turn may decrease microbial breakdown of SOM. Lastly, liming-induced improvements in nutrient availability (Jansone et al., 2020; Long et al., 2015), may increase ecosystem productivity, which correspondingly can increase SOM inputs from aboveground (e.g. leaf litter, Lin et al., 2015) and belowground sources (e.g. root detritus).
In this study, we quantified the magnitude of SOC stock changes resulting from forest liming activities, with the explicit intent to better understand the implications of liming for soil organic carbon and forest soil greenhouse gas (GHG) budgets. Given the lack of a consistent direction in which SOC stocks respond to liming as reported in literature, we attempted to disentangle the mechanisms responsible for the often contrasting processes that regulate net carbon fluxes in the soil. Here, we also assessed liming effects across different timescales, ranging from the immediate effects liming has on soil carbon dioxide (CO2) production to methane (CH4) uptake and to long-term changes in soil carbon stocks measured several decades after liming. The study was implemented at experimental sites in managed mature forests across Germany using both space-for-time substitution and chronosequence approaches.
We hypothesized that liming-induced changes in SOC stocks will be most pronounced at the soil surface. More specifically, we expect that there will be significant decreases in the forest floor layer C stock because SOM decomposition will be stimulated by reduced pH levels. However, these C losses will be offset, if not exceeded, by significant gains in SOC stocks in the topsoil because of improved ecosystem productivity, increased fine root biomass in the upper mineral soil horizons, and increased earthworm activity, which will improve soil structure, thereby protecting SOM from mineralization.
2.1 Experimental study sites
Liming effects on soil organic carbon stocks were determined at 28 liming experiment sites distributed across Germany (Fig. A1). All sites consisted of mature forest stands whereby all, except one (HLI 2680), were managed, meaning these sites were occasionally selectively harvested. Lime was applied in different forms (dolomite (CaMg(CO3)2) and calcium carbonate (CaCO3)) and in differing quantities, ranging from a total between 2–9 t ha−1 spread over multiple application dates (Table 1). The last lime application at most sites was typically 20 to 30 years prior to our sampling, and therefore findings reflect the long-term effects liming has on belowground carbon. The experiment was conducted using a paired plot design, where each site consisted of a limed plot adjacent to a control plot which was not limed. In total, for this analysis, we sampled nine sites with European beech (Fagus sylvatica L.), two with common oak (Quercus robur L.), 16 with Norway spruce (Picea abies L. karst.), and one European red pine (Pinus sylvestris L.) site. General site characteristics are described in Table 1. At two spruce sites (GOH 155, SEG 244), we only had data from the forest floor layers and not the mineral soil as soil bulk density data were unavailable. Nitrogen deposition was ascertained from the German Environment Agency (Umweltbundesamt, 2019).
Table 1Site characteristics and liming details of the 28 experimental sites. Soil parameters were measured from samples taken during the most recent sampling campaign. Soil texture measurements were only made at 16 sites.
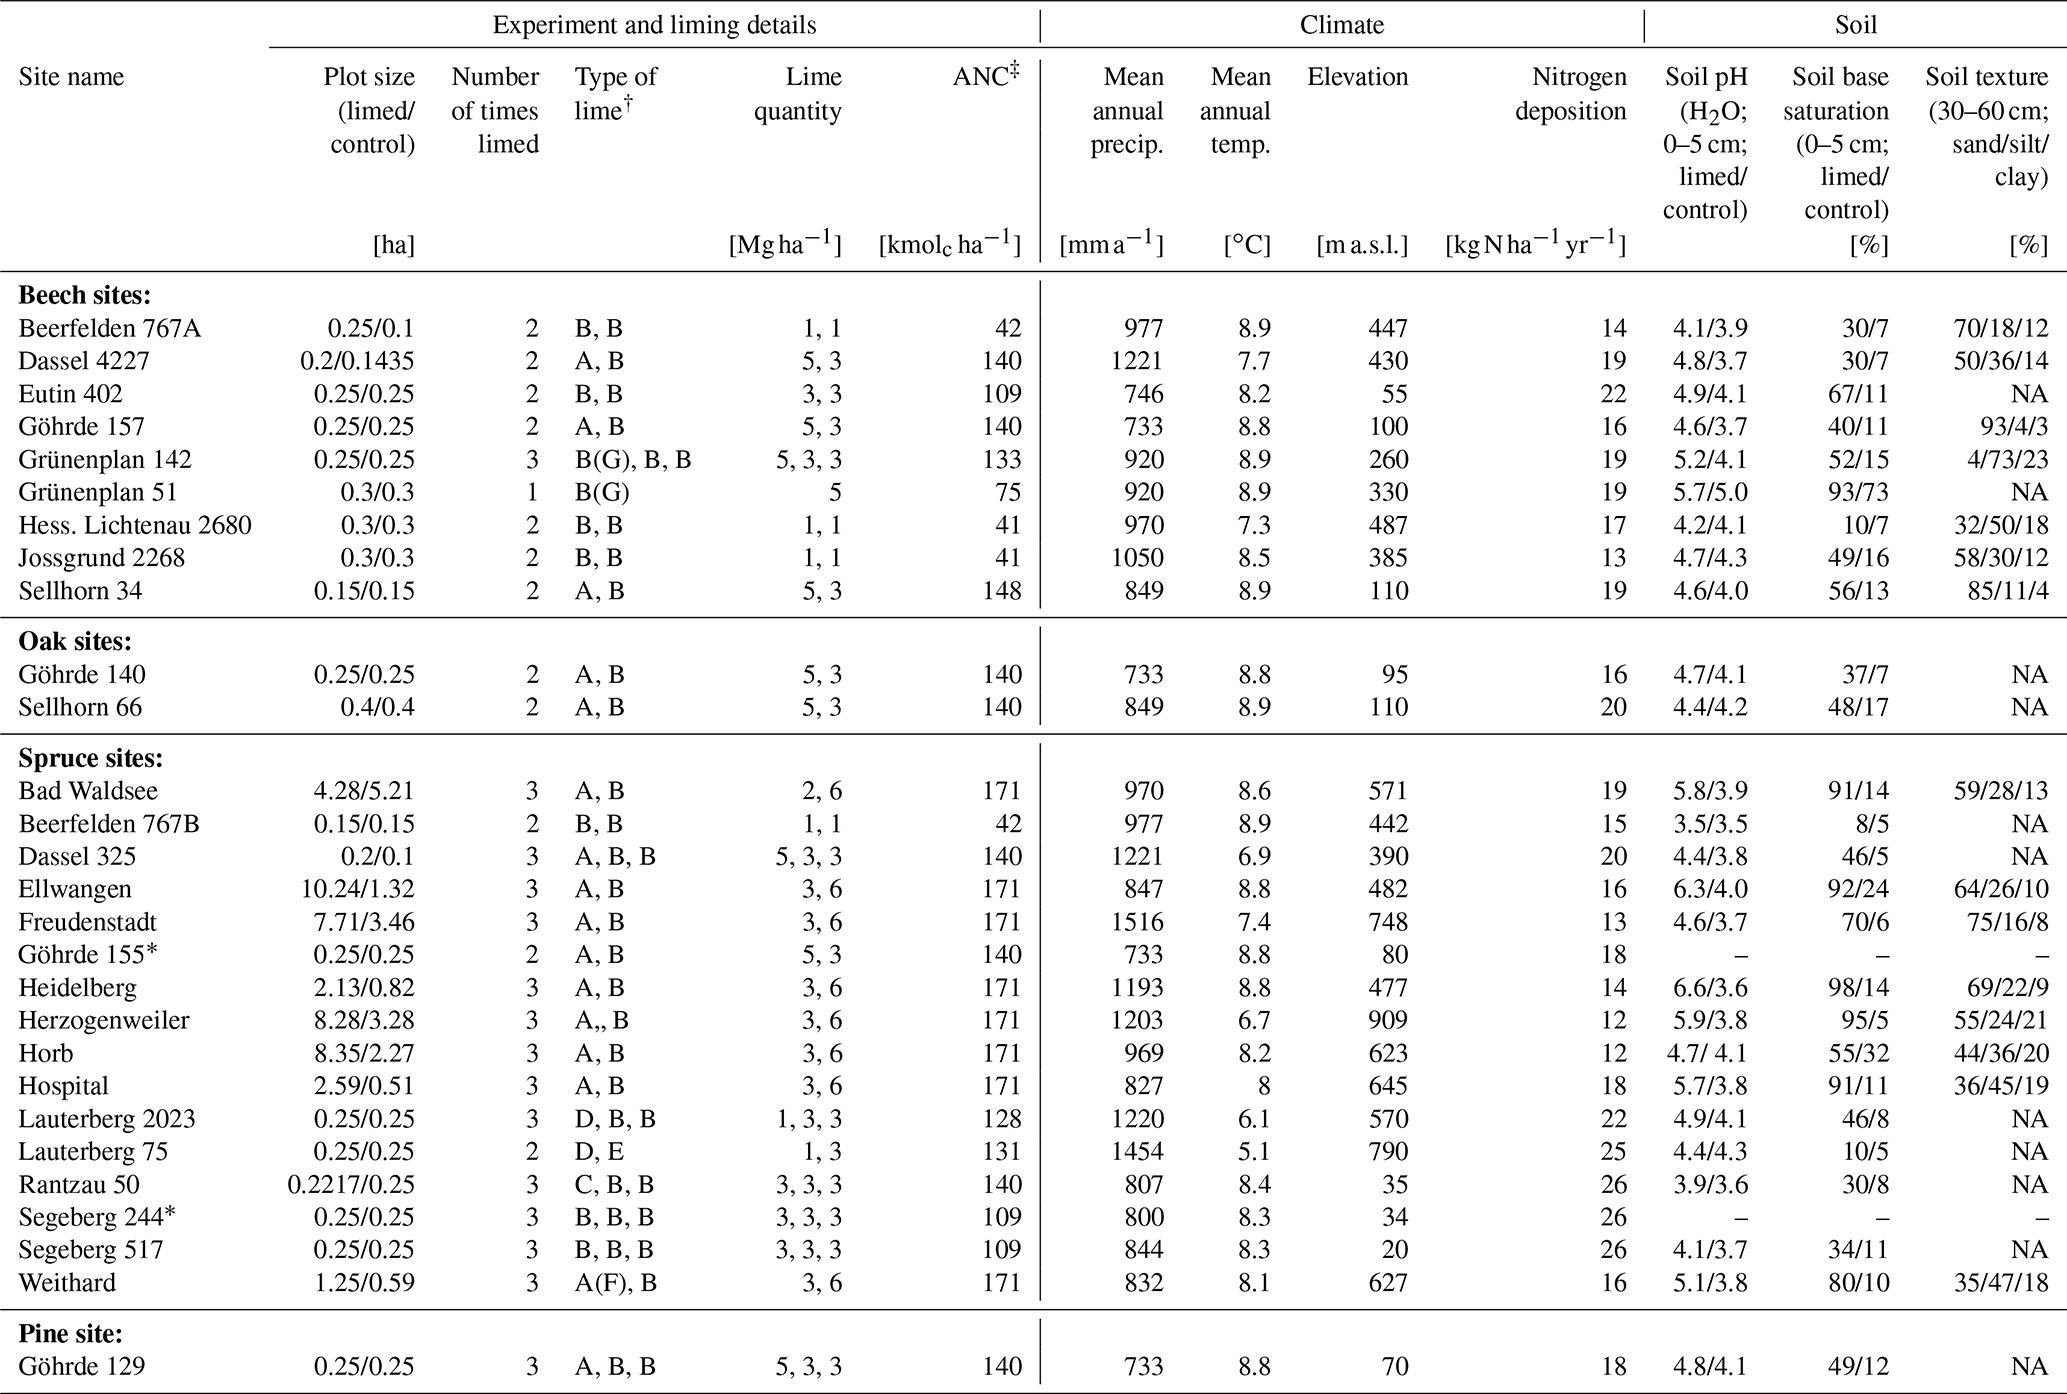
∗ Only forest floor layer sampled in this plot. † Types of lime: A – calcium carbonate, B – dolomite, C – marl lime, D – Thomas phosphate, E – slag lime, F – potassium sulfate, and G – rock phosphate. ‡ Acid neutralization capacity. NA: not available.
2.2 Soil organic carbon stocks
We collected soil and forest floor samples from both limed and control plots from each site at four locations distributed around the plot. Samples were taken from the forest floor (L/Of and Oh) as well as from the mineral soil at four predefined depths (0–5, 5–10, 10–30, and 30–60 cm). Samples of the forest floor and the topsoil (0–30 cm) were taken using a root auger (diameter 8 cm) and samples of the subsoil (30–60 cm) using a gouge auger (diameter 3 cm). At each of the four sampling locations per plot, three samples were taken in close proximity to another for each depth and pooled. Forest floor samples were subsequently oven-dried at 60 ∘C, sieved (2 mm), and ground. Mineral soil samples were oven-dried at 40 ∘C, sieved (2 mm), and also ground. Both forest floor and mineral soil samples were then analyzed for carbon (C) and nitrogen (N) contents using a CN analyzer (Euro EA – CN Elemental Analyzer, HEKAtech GmbH, Wegberg, Germany). Carbonates were measured in soil samples that had a pH (H2O) greater than 6.2. This however consisted of just 21 samples (<2 % of the complete dataset), and carbonate contents were a fraction of total soil carbon. Sieved forest floor and mineral soil samples were also analyzed for pH in a 1:2.5 H2O solution and mineral soil samples for exchangeable cations (Ca, Mg, K, Na, Al, Fe, and Mn) using an ICP-AES instrument (Thermo Scientific iCAP 7400 Radial, Thermo Scientific, Dreieich, Germany). Base saturation was calculated as the percentage of exchangeable base cations of the effective cation exchange capacity (ECEC). Soil texture was determined using the pipette method at 16 experiment sites.
Soil bulk density and the mineral soil dry mass per unit area were determined using a modified version of the Blake and Hartge (1986) core method. Samples were taken at four soil pits per plot for the same respective depths as where samples were taken for chemical analysis. Depending on the size and relative abundance of stones observed in the soil profile, different approaches were employed to estimate the bulk density of the soil fine fraction. Methods and equations are described by König et al. (2014). All samples were oven-dried at 105 ∘C for 48 h and subsequently weighed. Volumes of coarse fragments were determined using the volume displacement method. For the mineral soil, we calculated the fine earth soil mass per unit area for each respective sampling layer as follows:
where fine earth soil mass per unit area is in kilograms per square meter (kg m−2), BD is the soil bulk density in grams per cubic centimeter (g cm−3), stone content is relative volumetric coarse fragment content, d is the thickness (depth) of the sampling horizon in centimeters, and 10 is a conversion factor for converting grams per square centimeter (g cm−2) to kilograms per square meter (kg m−2).
The organic layer dry mass per unit area was determined at the same four sampling locations as where the samples for the chemical analysis were collected using a root auger (diameter 8 cm). The organic material from within the auger was collected and separated into the two forest floor layers (L/Of and Oh). Roots and plant debris larger than 2 cm in size were removed from the sample, whereupon samples were oven-dried and weighed (König et al., 2014):
whereby organic layer mass per unit area is in kilograms per square meter (kg m−2), MH is the dry mass of the organic layer in grams, SA is the surface area that was sampled in square centimeters (cm2), and 10 is a conversion factor for converting to kilograms per square meter. Mineral and forest floor organic carbon stocks were calculated as follows:
whereby SOC stock is in megagrams of carbon per hectare (Mg C ha−1), OC is the organic C content in grams per kilogram (g kg−1), MuA is the mass per unit area in kilograms per square meter (kg m−2), and 100 is a conversion factor for converting to megagrams of carbon per hectare.
SOC stocks in the limed plots were corrected for fixed-depth differences that incurred because of liming-induced changes in soil bulk density (Fig. A2) using the equivalent soil mass (ESM) approach described by Wendt and Hauser (2013). This approach fits a cubic spline curve of cumulative organic carbon stocks with the corresponding soil mass of the reference profile.
Effects of liming were evaluated using two approaches. First, the difference in soil C stocks between limed and control plots was calculated to assess the relative differences. Second, a chronosequence approach was used to assess temporal changes in soil C stocks using historic data, between 1990 and 2019, collected at a subset of the paired experiment sites (forest floor: n=17, mineral soil: n=13). Table S1 in the Supplement shows the years when forest floor and mineral soil samples were collected. The change in SOC stocks over time was estimated by calculating the slope of a linear best-fit function of the SOC stock values over time. In this analysis, we assumed that soil density did not change during this time, and accordingly we used bulk density estimates from the most recent measurement date.
2.3 Short-term effects of liming on soil CO2 and CH4 fluxes
Soil carbon dioxide (CO2) and methane (CH4) fluxes were measured at three beech forest sites (Dassel 4227 (DAS 4227), Sellhorn 34 (SEL 34), and Göhrde 157 (GOH 157)) in both control and limed plots to assess both short- and long-term effects of liming. All three sites were freshly re-limed with an equivalent of 3 Mg CaCO3 ha−1 in August–September 2020. Accordingly, the measurements made after these liming events reflect the short-term effects of liming on soil respiration and soil methane fluxes. The soil trace gas fluxes were measured using the vented static chamber method. Round chamber bases (polyvinyl chloride, covering a ground area of 0.07 m2) were inserted 1–2 cm into the soil surface at four randomly locations within each plot. These chamber bases were covered with polyethylene lid (∼22 L headspace volume), from which gas samples were collected at 20 min intervals for 1 h (2, 22, 42 and 62 min) and stored in pre-evacuated 12 mL Labco Exetainers® (Labco Limited, Lampeter, UK). To minimize effects from diurnal fluctuations, we randomized the order the plots were measured during each measurement campaign. Gas samples were analyzed using a gas chromatograph (GC, SRI 8610c, SRI Instruments, Torrance, USA), equipped with a flame ionization detector to measure CH4 and CO2. The latter gas species was analyzed by converting it to CH4, using a built-in methanizer in the GC. The GC was calibrated prior to each analysis using three calibration gases (Deuste Steininger GmbH, Mühlhausen, Germany), spanning the concentration range of the field samples. Soil gas fluxes were calculated using the ideal gas law, based on the linear increase of gas concentrations in the chamber over time and corrected with air temperature and atmospheric pressure measured at the time of sampling. A positive flux indicates a net emission, while a negative flux indicates a net consumption. In parallel to the greenhouse gas flux measurements, we also measured air pressure, soil and air temperature, and chamber volume during each measurement.
In early September 2020, we measured soil CO2 and CH4 fluxes at one site (DAS 4227) three times in the week prior to lime application (on 7 September 2020) to evaluate baseline fluxes and determine whether there were long-term effects of previous liming events still evident. After liming, we measured GHG fluxes weekly for 2 months (to 3 November 2020) to evaluate immediate effects of the liming. Subsequently, in the spring of 2021, we resumed gas flux measurements on a biweekly basis at the DAS 4227 site and additionally also commenced soil GHG measurements at the two other sites (SEL 34, GOH 157). These measurements were made from 11 March 2021 to 8 July 2021.
2.4 Calculation of lime-derived CO2 emissions
The proportion of lime-derived CO2 to the overall CO2 flux was determined using δ13C stable isotope approaches and a two-pool mixing model at the same three sites as where soil GHG fluxes were measured. Unlike the soil GHG measurements, we collected gas samples for δ13CO2 analysis every second measurement campaign. Samples were collected 2 and 62 min after chamber closure. The 13C signature of newly formed CO2 (δn) between time point t=1 (2 min; δ1) and t=2 (62 min; δ2) and the newly formed CO2 fraction at t=2 is given by the following mass balance equation (Martinson et al., 2018):
The fraction of lime-derived CO2 to total CO2 emissions is calculated following the two-pool mixing model under the assumption that (1) biologically derived 13CO2 is equal between limed and unlimed plots, and (2) CO2 from lime carbonates and from lime-induced respiration is in isotopic equilibrium:
whereby δ is the isotopic signature of 13CO2 from limed plots, δ0 the isotopic signatures of 13CO2 from unlimed plots, and δ1 the isotopic signature of lime.
The carbon isotope signature (δ13C) of CO2 was determined by isotope ratio mass spectrometry after gas chromatographic separation, and the δ13C of the added lime was analyzed using an isotope ration mass spectrometer coupled to an elemental analyzer, both at the Centre for Stable Isotope Research and Analysis (KOSI) at the University of Göttingen.
2.5 Statistical analysis
Liming effects on SOC stocks at each soil depth were tested using linear mixed-effects (LME) models (Crawley, 2013). In these models, the C stock was the response variable, the treatment (control, limed) was the fixed effect, and the site was the random effect. For the soil trace gas flux measurements, the treatment was considered a fixed effect, and the measurement date was considered a random effect. Significance levels were tested separately for each site. Differences were considered significant if P≤0.05 and marginally significant if P≤0.1. The input C stock data as well as the output model residuals were tested for normality using the Shapiro–Wilk test. To gain an insight into the underlying factors regulating C stocks in the control (unamended plots) and the relative changes in C stocks as a result of liming, we used Spearman's rank correlation analyses to assess how C stocks correlated with climatic parameters, the stand parameter, and inherent soil properties (of the control plot) as well as the liming-induced changes in soil properties (difference between limed and control plots). The goodness of fit of the nonlinear best-fit models was assessed using Pearson correlation analyses between model-predicted values and measured values. All statistical analyses were carried out using R version 4.0.02 (R Core Team, 2020).
3.1 SOC stocks in the control plots: magnitude and drivers
There was a large variability in SOC stocks across the experimental sites, ranging between 49 and 366 Mg C ha−1 (forest floor to 60 cm, in the control plots). In the soil profile, SOC content was highest in the forest floor layer and decreased with soil depth (Fig. S1a in the Supplement). In the control plots, 23 % of the total SOC stock was found in the forest floor layer and 27 % in the topsoil (0–10 cm), and the remaining 50 % was found below 10 cm depth (10–60 cm) (Fig. S1b). Soils under coniferous forests stored approximately 38 % more carbon than broadleaf forests (conifer: 157 ± 17 Mg C ha−1 (mean ± standard error (SE)), broadleaf: 97 ± 9 Mg C ha−1), where differences were most pronounced in the forest floor L/Of horizon and below 10 cm soil depth. Soil bulk density was lowest at the soil surface (0–5 cm) and increased with soil depth. SOC stocks in the mineral soil correlated significantly with soil chemical and physical properties but not with climatic variables such as temperature, precipitation, or elevation (Table S2 in the Supplement). In the forest floor layers, SOC stocks were correlated with both N deposition and pH. For the latter, there was an exponential decrease in the SOC stocks with increasing pH (Fig. 1), where, particularly in the L/Of layer, there was large decline in SOC stocks when pH increased from 3.5 to 4.5. Next, N deposition exhibited a significant positive correlation with SOC stock in the L/Of horizon, whereby these effects were only evident in coniferous forests (Fig. A3a). This trend was largely driven by the strong linear correlation present between C content and N deposition (Fig. A3b), and although the mass of the L/Of horizon correspondingly increased with N deposition, the most increases were only consistent when N deposition was higher than 25 (n=4) (Fig. A3c).
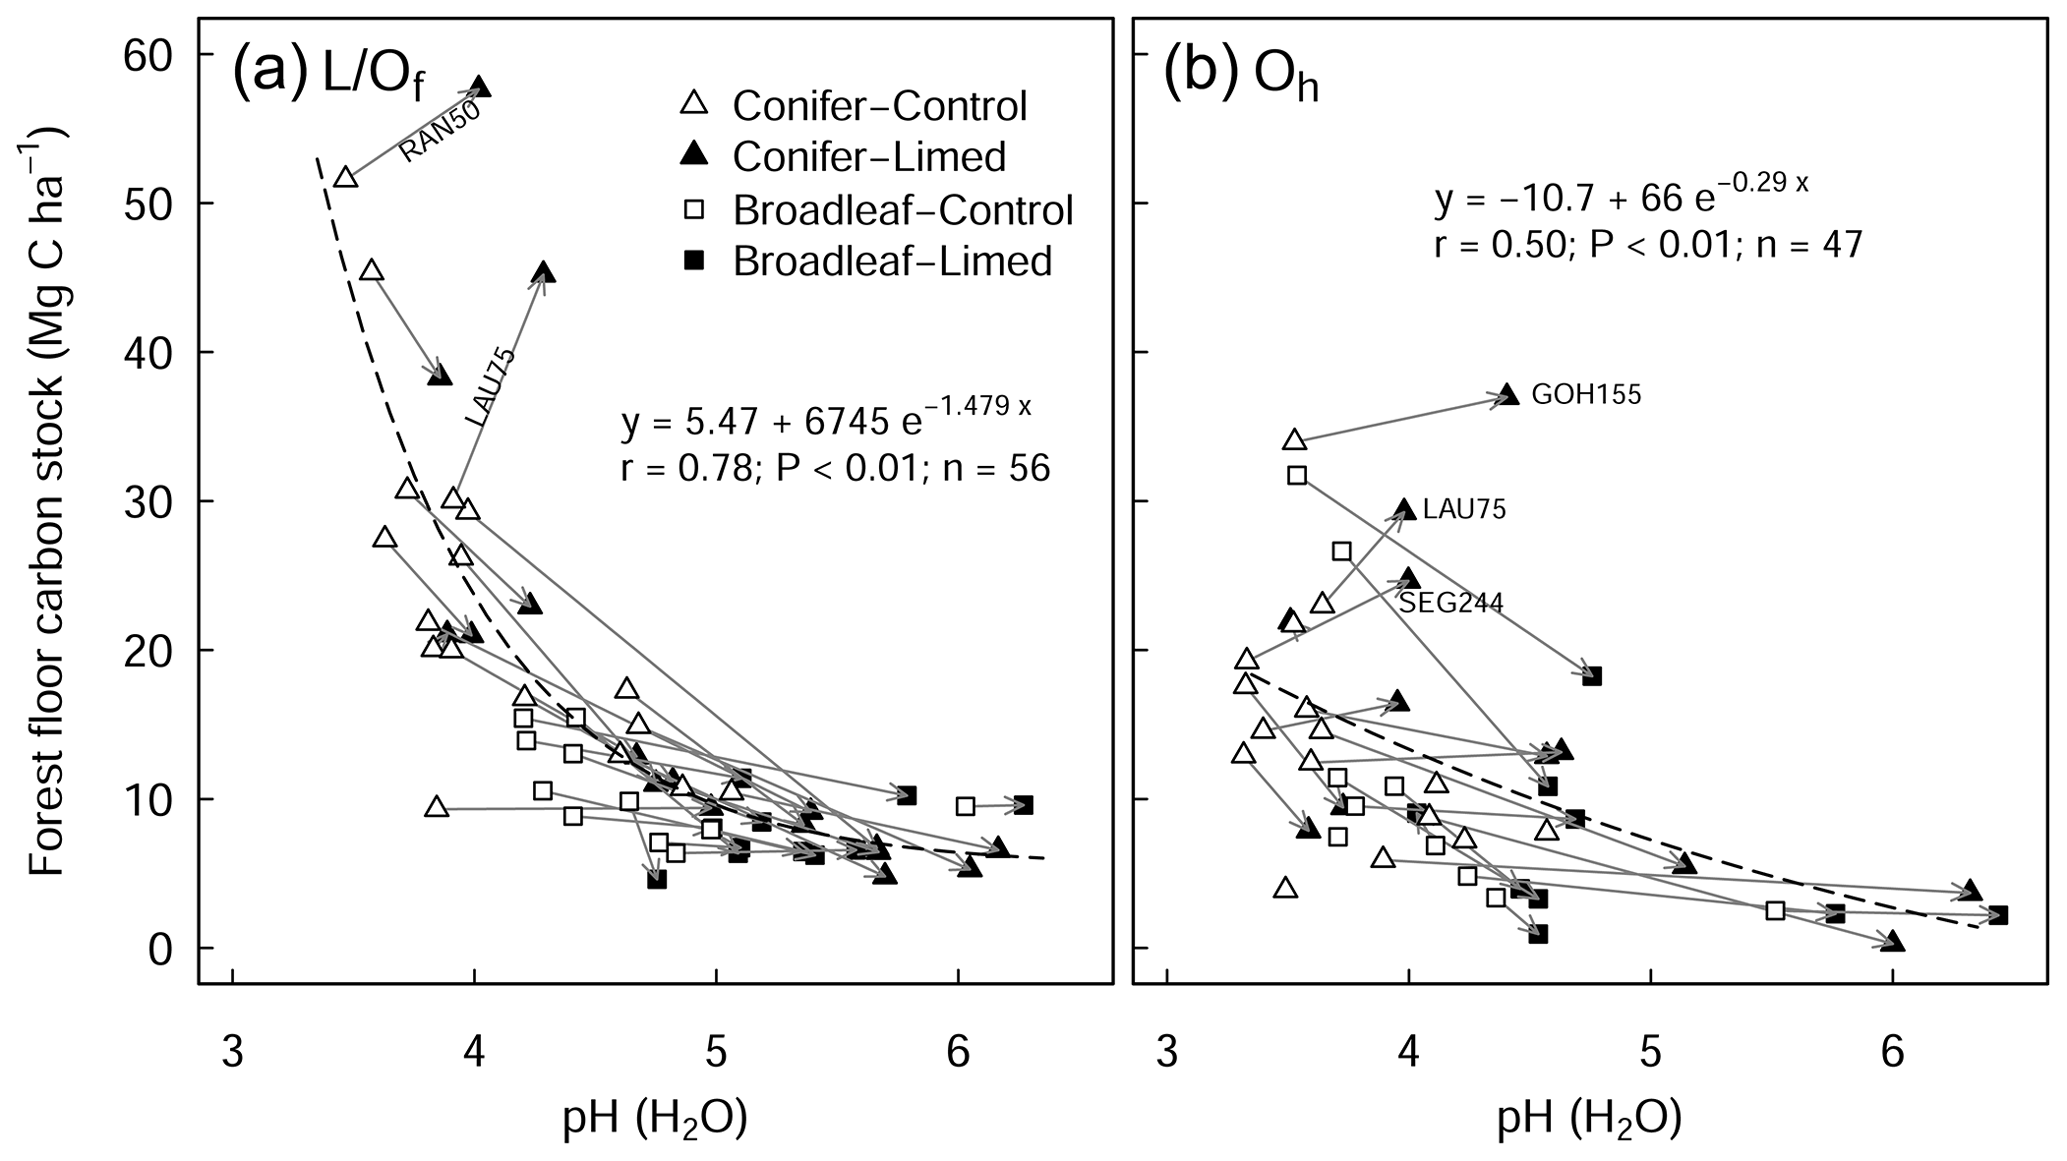
Figure 1Relationship between the pH of the forest floor layer and the carbon stock of the (a) L/Of and (b) Oh horizons. The arrows indicate the change from control to limed plots. Missing arrows (in b) are because the Oh horizon disappeared at those sites as a result of liming. The r is the Pearson correlation coefficients between observed and fitted values. RAN50 is Rantzau 50, LAU75 is Lauterberg 75, GOH155 is the Göhrde 155, and SEG 244 is the Segeberg 244 site.
In the mineral soil, SOC stocks correlated with soil texture fractions. This was evident in the significant negative correlations between SOC stock and sand contents at 0–5 and 5–10 cm, as well as the positive correlation with clay content at 10–30 cm (Table S2). In the subsoil (30–60 cm), SOC stocks exhibited a similar exponential decay relationship with soil pH to the forest floor layers (data not shown).
3.2 SOC stock response to liming: chronosequence approach
At a subset of experimental sites where historical data were available, most dating back to 1990 (Table S1), forest floor C stocks in the control plots increased in time (0.5 ± 0.1 ; Fig. 2a), whereby the increases were largely driven by C accumulations at coniferous forest site (0.8 ± 0.3 ). Although forest floor SOC stocks in the limed plots also increased over time, the accumulation rates in the L/Of horizon were significantly lower than the control (Fig. 2b). In the mineral soil, there were no significant changes in SOC stocks at any depth during this period. Nevertheless, when C stock change rates were compared between limed and control plots, liming did bolster C accumulation rates slightly at 5–10 cm depth.
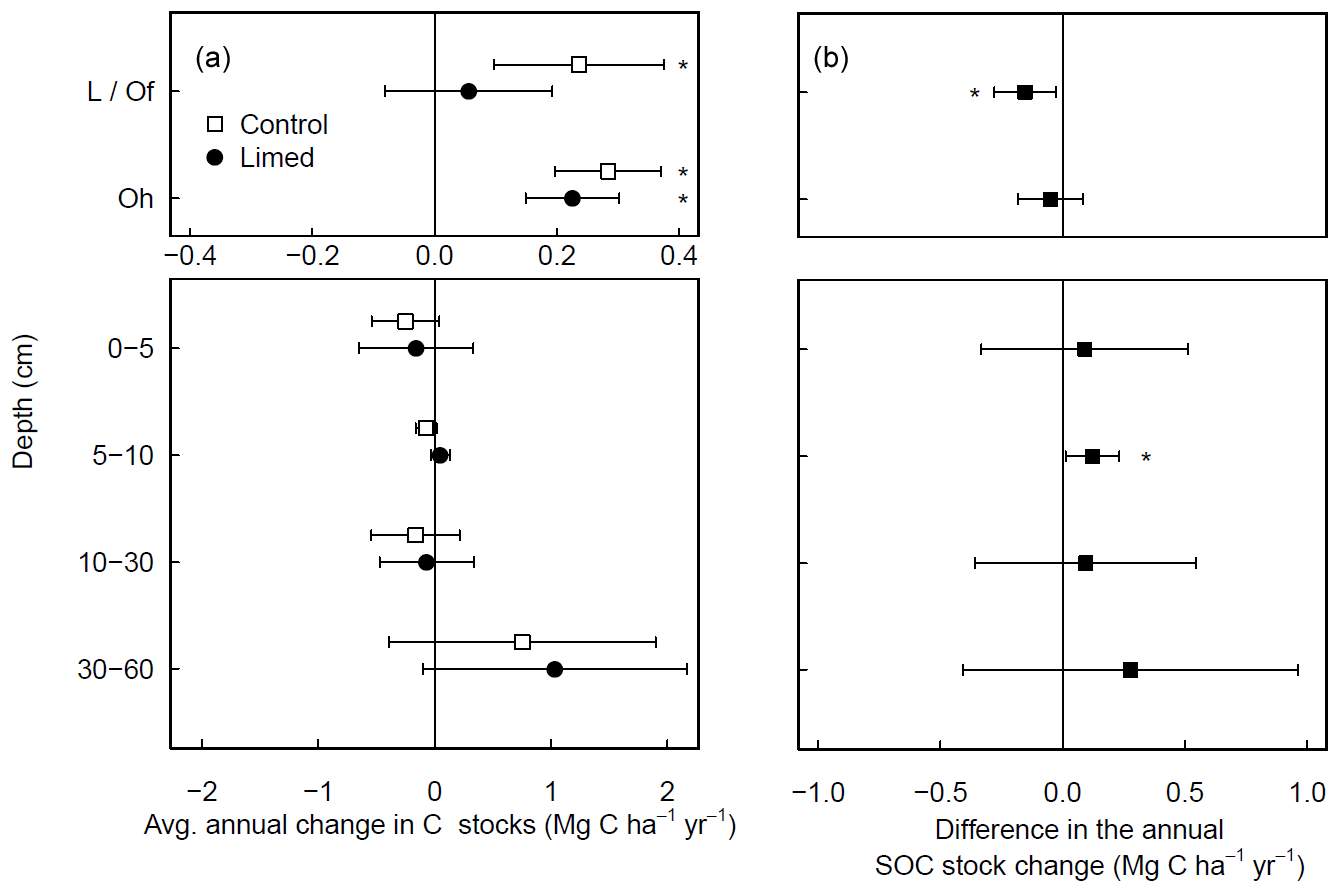
Figure 2Average (±95 % T test confidence interval) annual changes in SOC stocks experienced over the last 2 decades in (a) both the control and limed plots and (b) the difference between the limed and control plots. Statistical significance was tested using LME models for each respective soil depth or layer at P≤0.05 (*).
3.3 SOC stock response to liming: paired plot approach
Total SOC stocks (forest floor to 60 cm) were comparable between the limed (126±12 Mg C ha−1) and control plots (132 ± 12 Mg C ha−1) (Fig. S1b). In the forest floor layer, liming significantly reduced SOC stocks by 34 % ± 12 % (equivalent to 8.4 ± 3.6 Mg C ha−1, Fig. 3a), which reflects reductions in both C content (−8.8 % ± 2.4 %) and the forest floor dry mass (−26.1 % ± 6.7 %). Both broadleaf and coniferous forests had similar SOC losses in the forest floor layer both in magnitude (broadleaf: −8.1 ± 4.8 Mg C ha−1, coniferous: −8.6 ± 2.7 Mg C ha−1) and in overall proportion of the forest floor SOC stock (Fig. 3b).
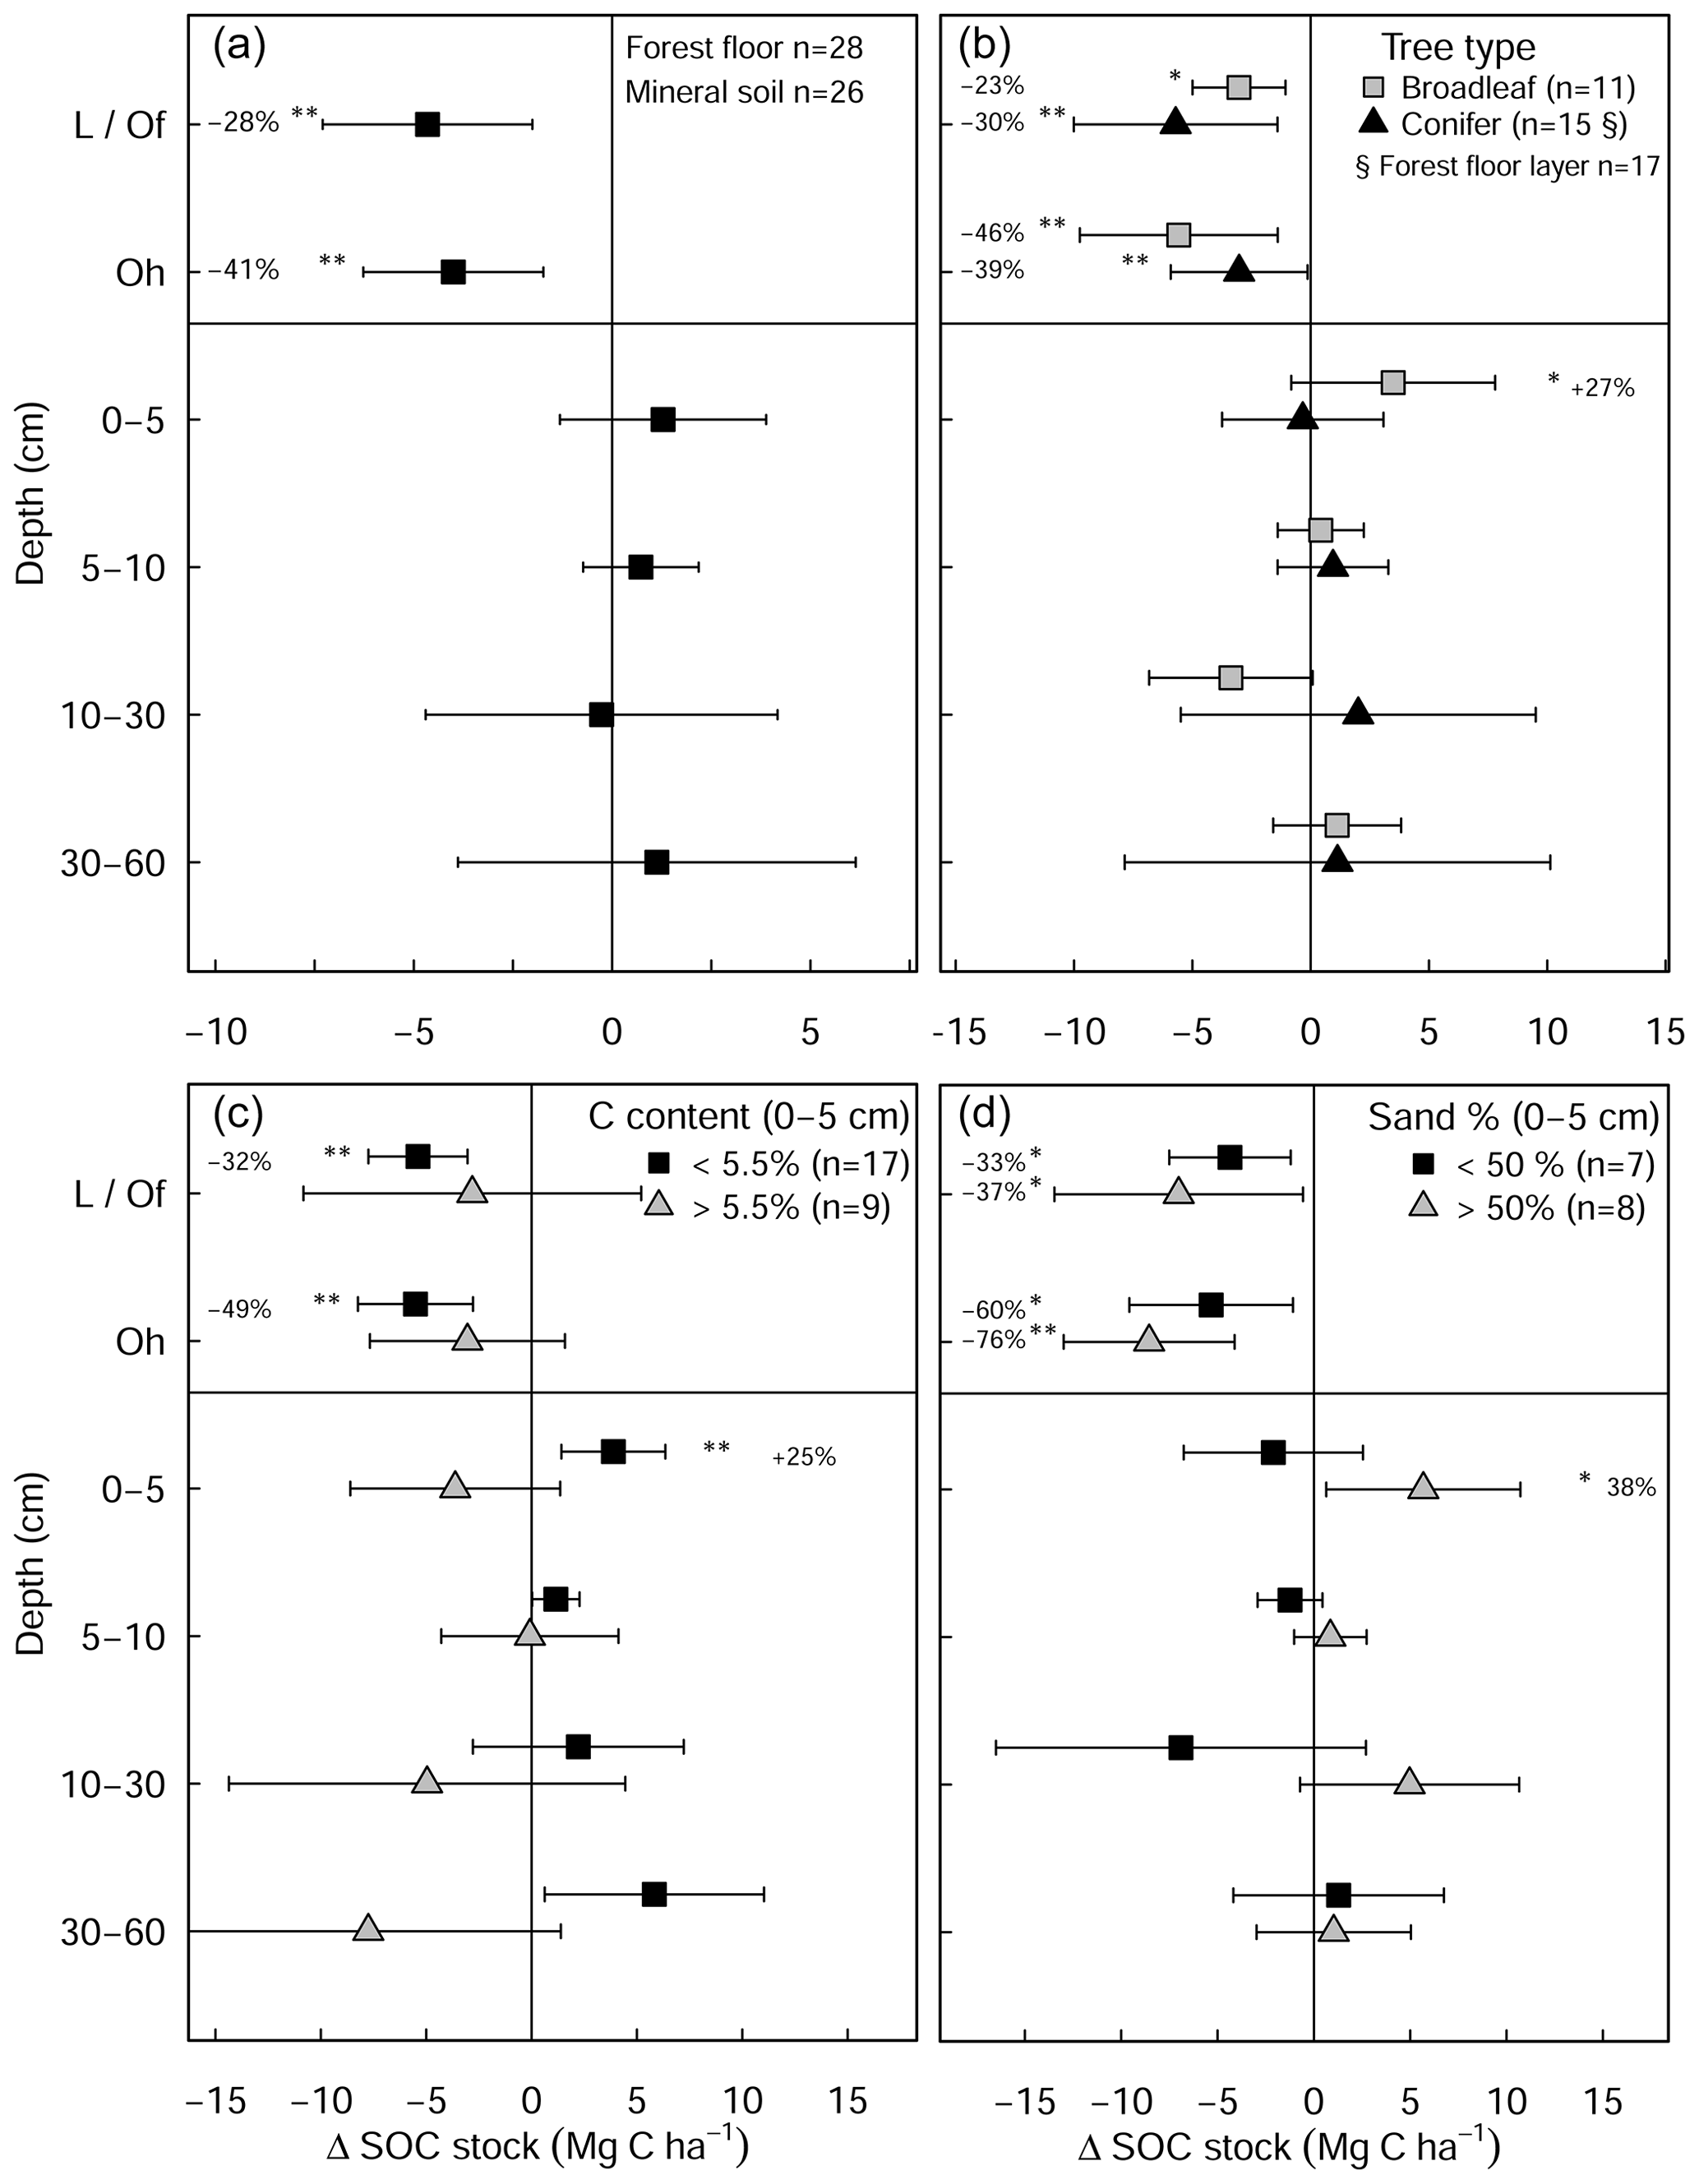
Figure 3Changes in mean soil organic carbon stock (limed−control) as a result of liming (a) for all plots in the experiment and classified by (b) tree types and (c) inherent C content of the control plots and (d) site sand percent from 0–5 cm depth. Error bars indicate the 95 % confidence intervals based on Student's T distribution. Statistical significance was tested using LME models for each respective soil depth/layer and grouping at P≤0.05 (*) and P≤0.01 (**).
The liming quantities which are responsible for the changes in soil pH exhibited a negative linear relationship with SOC stock changes (Fig. A4), indicating that higher liming dosages result in larger SOC losses. In the forest floor layer, the proportion of C losses or C gains (at a few sites) could further be explained by the initial C stock present on the site (control plot C stock), whereby the C losses were largest at sites with medium amounts of stored C (between 20 and 35 Mg C ha−1) and less pronounced (or even positive) at sites with either little or large C stocks present in the reference state (Fig. 4e).
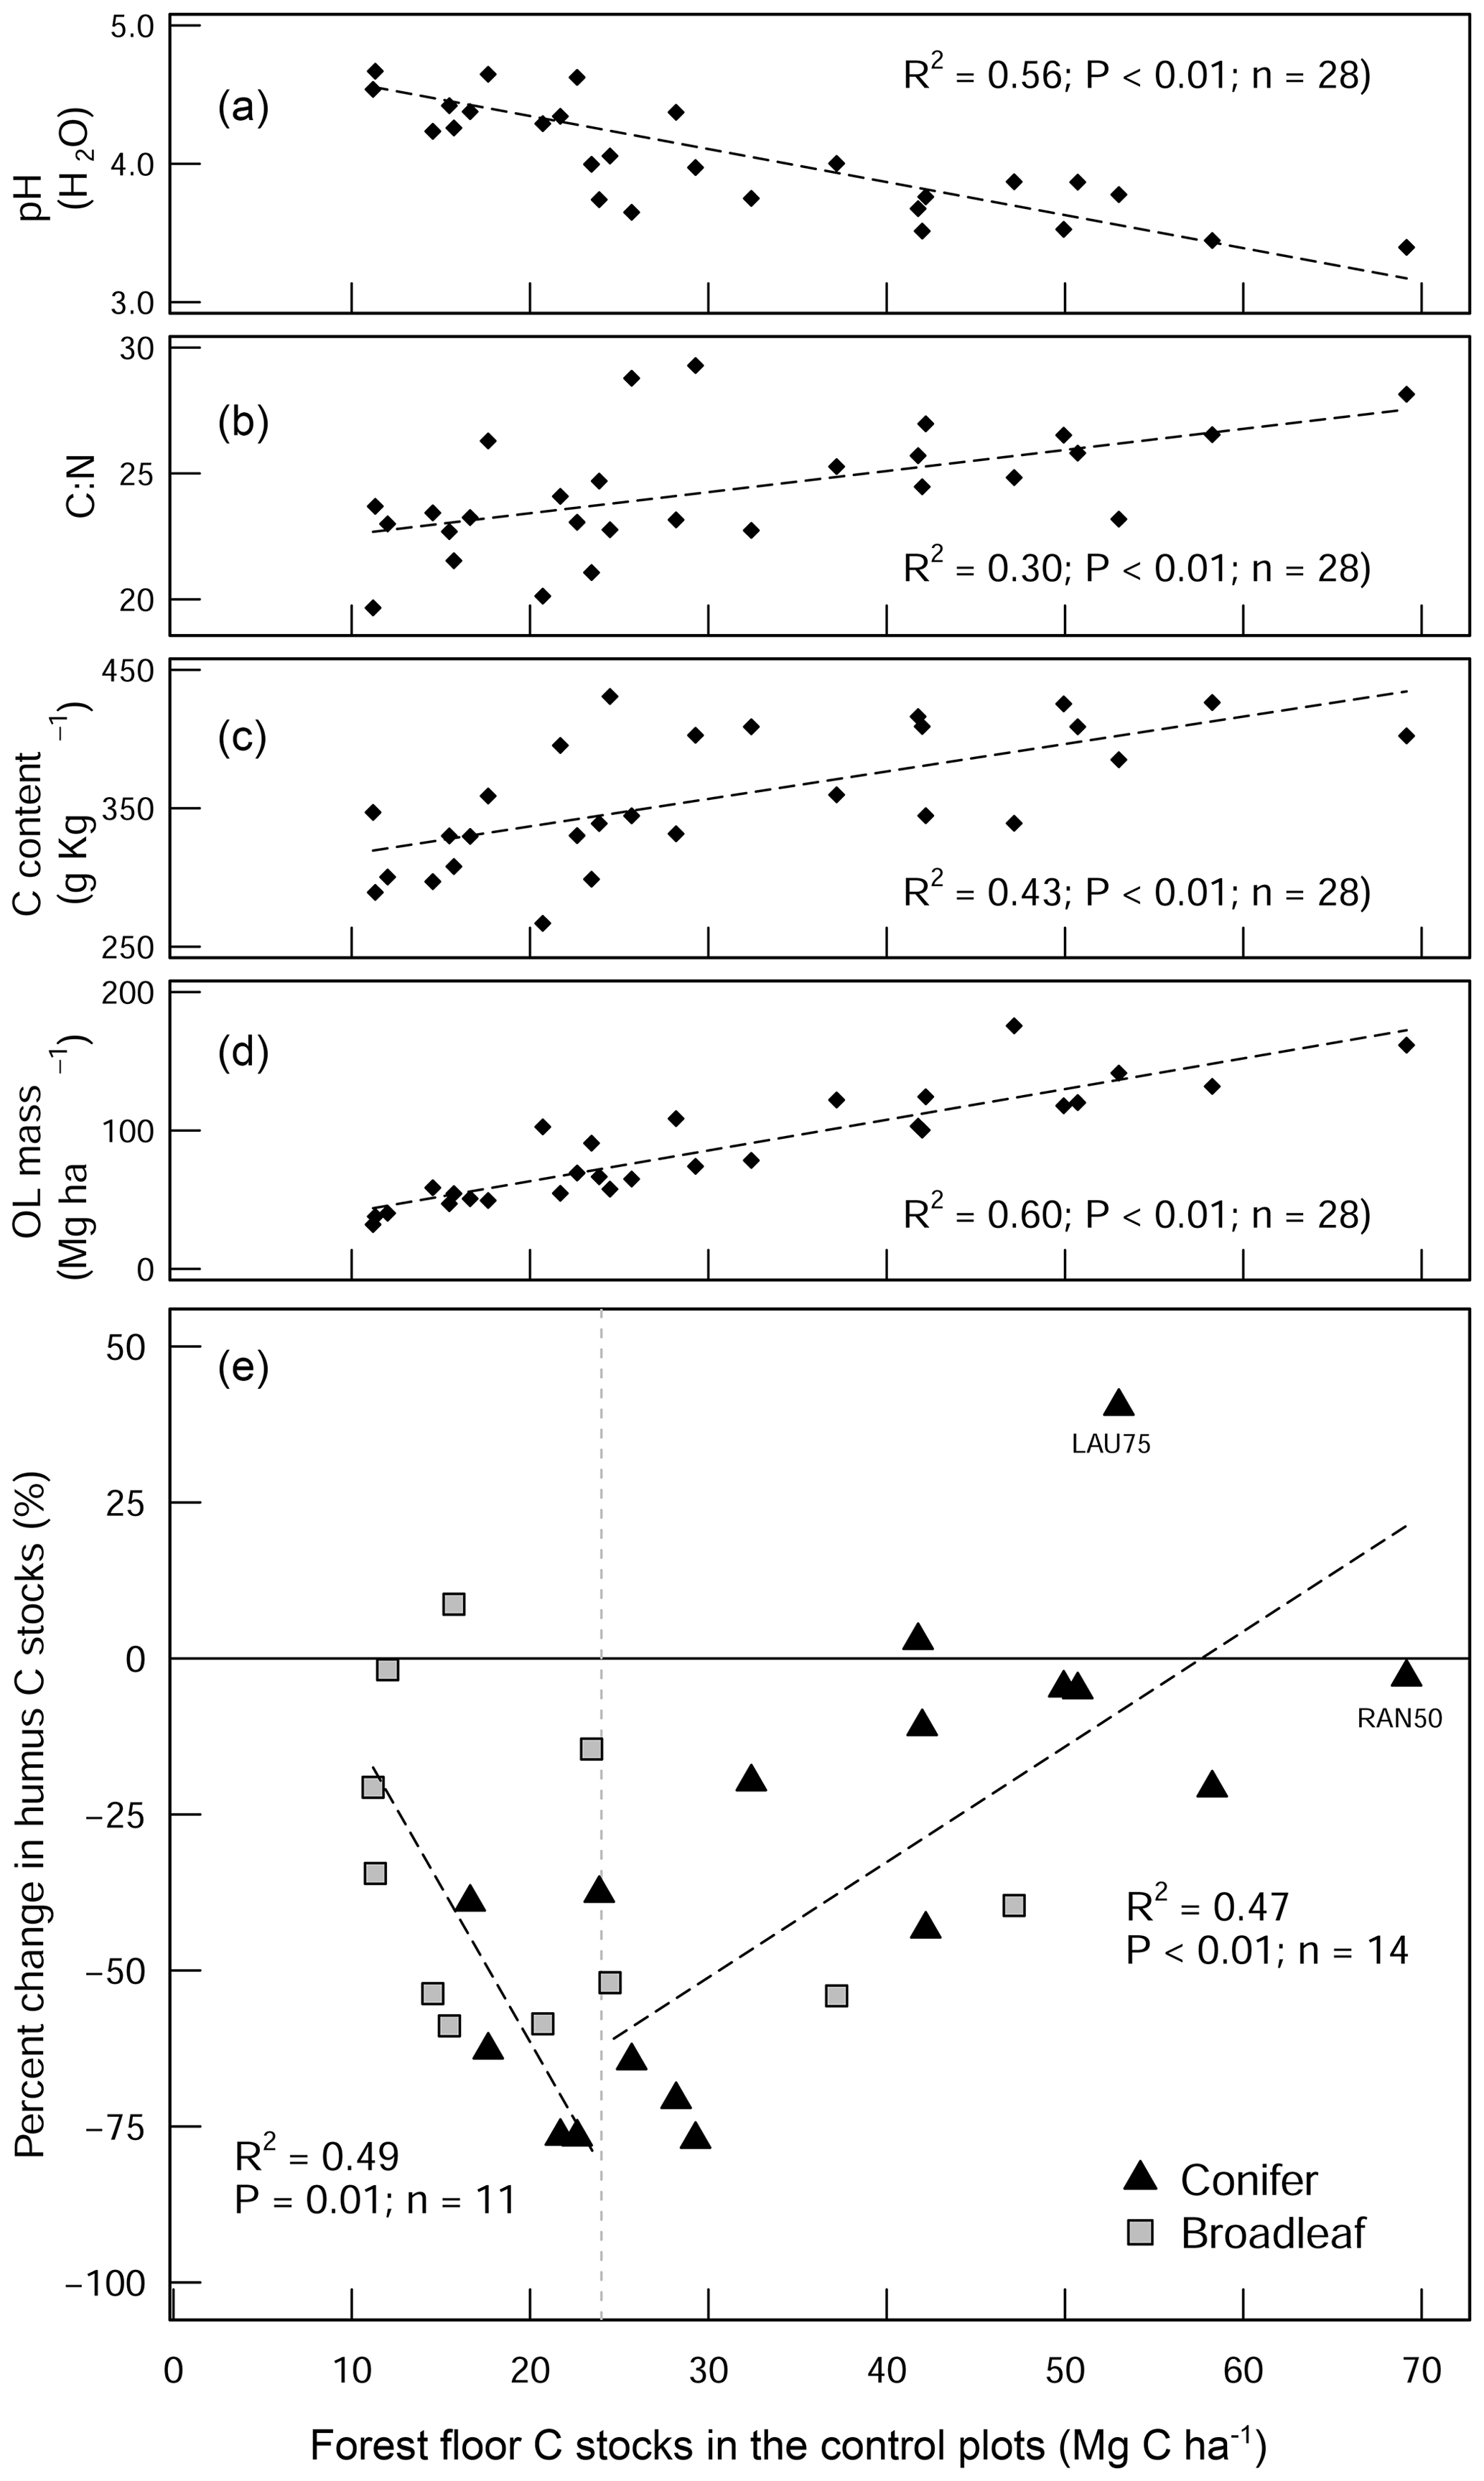
Figure 4Scatter plot diagrams showing how the forest floor SOC stocks in the control plots relate to (a) pH (H2O), (b) the C:N ratio, (c) the C content of the forest floor layer, and (d) the forest floor (organic layer (OL)) biomass. These four parameters show how the forest floor C stock in the control plots is a good measure of organic matter stability. The scatter plot in (e) shows the percentage change in the forest floor C stock as a result of liming in relation to the C stocks of the control plots. The two linear regression lines in (e) show C change for the different forest floor stock ranges (above and below 25 Mg C ha−1). LAU75 is Lauterberg 75, and RAN50 is Rantzau 50.
Overall, there were no significant changes in mineral SOC stock at any depth (Fig. 3a), when all sites are pooled together. Unlike coniferous forests, broadleaf forest plots (n=11) exhibited significant increases in SOC stock in the topsoil (0–5 cm) (3.5 ± 1.9 Mg C ha−1, Fig. 3b). While it was not significant for SOC stock changes (Table S3 in the Supplement), changes in soil C content hinged on the inherent (control) C content (Fig. A5). In the mineral soil, the experimental sites that initially had low C contents exhibited increases in C, while sites with C contents that were already high exhibited decreases. Accordingly, when sites were classified as having either inherently high C contents (>5.5 % at 0–5 cm, n=9) or inherently low C contents (<5.5 % at 0–5 cm, n=17), large differences in SOC stocks between the two categories became evident in the soil profile (Fig. 3c). Namely, SOC stocks increased significantly at sites which had inherently low C contents in the control plots (C content <5.5 % at 0–5 cm, Fig. 3c). Here, gains in mineral SOC stocks (0–60 cm) were significantly higher than zero (13.1 ± 4.7 Mg C ha−1), although these gains were partially offset by the SOC losses in the forest floor layers (−10.6 ± 5.6 Mg C ha−1). Conversely, the sites that had inherently high SOC contents in the control plots (C content >5.5 % at 0–5 cm) did not exhibit significant changes in SOC stock at any soil depth throughout the profile, whereby there was a tendency to have SOC losses throughout the profile (forest floor: −5.6 ± 3.5 Mg C ha−1, mineral soil 0–60 cm: −16.4 ± 3.8 Mg C ha−1). Next, SOC stocks significantly increased in the 0–5 cm layer in sandy sites (<50 % sand, Fig. 3d), while sites with higher clay and silt fractions exhibited no change in SOC stocks at any depth. In both the forest floor Oh horizon and at 0–5 cm depth, soil C:N ratios decreased significantly as a result of liming (Fig. S2 in the Supplement).
3.4 Liming effects on soil CO2 and CH4 fluxes in beech forests
The soil greenhouse gas flux measurements made prior to re-liming at the DAS 4227 site (indicative of the long-term effects of liming) showed that (1) there were no significant differences in soil respiration rates between limed and control plots (P=0.49, Fig. 5a) but that (2) methane uptake was twice as high in the limed plots compared to the control (P<0.01, Fig. 5d–f). Immediately following the re-liming, soil CO2 fluxes increased and remained consistently higher than the control (P<0.01, Fig. 5a) for the duration of the measurements. Soil methane uptake on the other hand did not respond to the liming application and remained consistently lower than the control (P<0.01, Fig. 5d).
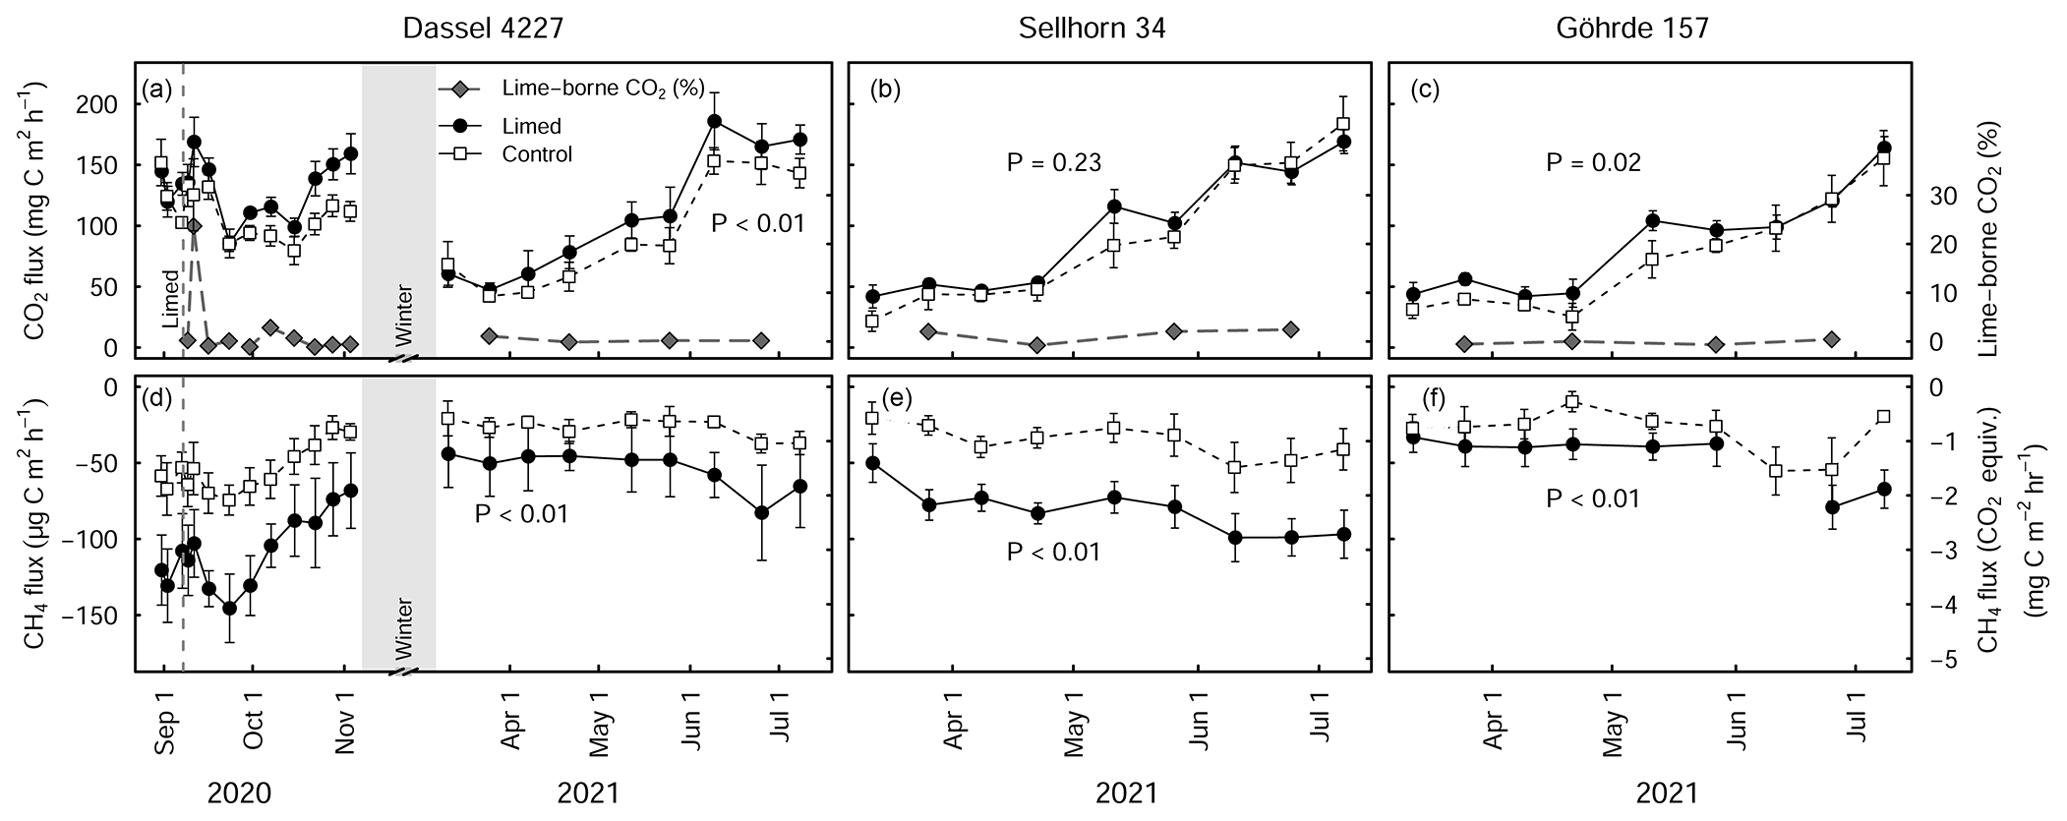
Figure 5Mean (± SE) soil CO2 (a–c) and CH4 fluxes (d–f) at the Dassel 4227, Sellhorn 34, and Göhrde 157 sites in limed and control plots. The grey lines in (a–c) indicate the percentage of lime-derived CO2 of the total CO2 flux. P values indicate the significance level between treatments based on LME models. At the Dassel 4227 site, the three baseline measurements made prior to re-liming give an indication of existing long-term differences in soil CO2 and soil CH4 fluxes. At the time there were no significant treatment differences for CO2 fluxes (P=0.49), but CH4 fluxes were significant between the treatments (P<0.01). At each site, 3 Mg CaCO3 ha−1 was applied in the late summer of 2020. Soil CH4 fluxes are presented in both actual measured units and CO2 equivalence, based on a global warming potential of 28.
Soil respiration measurements made at the beginning of the growing season of 2021 (6 to 10 months after liming) at the three sites (GOH 157, DAS 4227, and SEL 34) show that overall soil CO2 fluxes were significantly higher (23 % ± 7 %, P<0.01) in the limed plots in comparison to the control (Fig. 5a–c). The strength of the liming response however depended on the site, where both GOH 157 and DAS 4227 exhibited significant increases in CO2 fluxes, while the SEL 34 site did not show any significant change in CO2 flux (Fig. 5b). Overall, soil methane uptake was significantly higher in the limed treatments (P<0.01) and was on average 2 times higher than the control at all three sites (Fig. 5d–f).
Using a stable isotope analysis approach, the overall contribution of lime-derived CO2 was low, averaging 2.7 % of the total CO2 flux in the first 2 months after lime application at the DAS 4227 site. At this site, there was only one short-lived lime-derived CO2 pulse immediately after a rewetting event 5 d after liming (Fig. 5a), which accounted for 23 % of total (biotic and abiotic) CO2 emissions. The lime-derived CO2 contribution remained negligible the following spring when we measured at the three sites, averaging 0.7 % ± 0.5 % (n=3) of the total CO2 flux.
4.1 Liming effects on organic C stocks in the forest floor layers
Over the last 3 decades, forest floor C stocks have gradually been accumulating in both the limed and control plots (Fig. 2a), with increases being most pronounced at coniferous sites. These gains likely reflect the influence of elevated N depositions (among other factors) that can (1) enhance tree growth which accordingly increase litter inputs (Court et al., 2018; Van der Perre et al., 2012) and/or (2) constrain organic matter decomposition rates (Knorr et al., 2005). The effects of N additions were particularly evident at our coniferous forest plots where sites with higher N deposition had larger forest floor carbon accumulations over time (Fig. A3).
Considering the biochemical environment plays an intrinsic role in many soil biological processes (Andersson and Nilsson, 2001; Persson et al., 2021; Melvin et al., 2013); changes in soil pH from liming can and will cause a cascade of responses that concomitantly affect the net soil C balance. In the temporal (chronosequence) analysis, the small absolute gains in the forest floor C stocks measured in the limed plots over time (Fig. 2a) were significantly lower than those measured in the unlimed control plots (Fig. 2b), highlighting how lime applications have (in the majority of sites) promoted organic matter mineralization and offset forest floor OM accumulations. Since overall C stock gains were comparatively minor (in relation to the control), it indicates that lime applications here helped maintain stable organic matter decomposition and nutrient cycling rates.
These results are further substantiated in the paired approach analysis, where a larger number of plots were included (Fig. 3a). Although this analysis partly contrasts the findings reported by the German National Forest Soil Inventory (which showed that liming decreased forest floor C stocks while unlimed plots remained unchanged over time, Grüneberg et al., 2019), both of these studies show the same relative trends: namely that liming stimulates organic matter mineralization. This too is corroborated by most other studies (Court et al., 2018; Kreutzer, 1995; Marschner and Wilczynski, 1991; Persson et al., 2021), whereby some publications (Derome et al., 2000; Melvin et al., 2013) have reported the opposite, namely that under certain conditions liming can actually increase soil C stocks.
In this study, we found a clear exponential relationship evident between forest floor C stocks and forest floor layer pH (Fig. 1); namely poor sites with acidic pH had high C accumulations in contrast to sites with higher pH that had lower C stocks. In conjunction with increased microbial-induced SOM mineralization, it is also likely that increases in earthworm activity, which is known to increase with liming (Persson et al., 2021), will have assisted the breakup of the litter and the mixing of the organic matter with soil particles and microorganisms throughout the soil layer (Kreutzer, 1995; Persson et al., 2021). Next, the improvements in forest floor composition and morphology were also visually evident at six of the 28 experimental sites, where the humus-form classification improved along the moder to mull gradient. Similarly, at seven sites, the application of lime meant that the humic horizons (Oh) either did not develop or perhaps were lost over time, indicative of comparatively faster organic matter mineralization rates and/or earthworm bioturbation. Next, there was also an additive effect of the lime quantity on C stock, where higher lime applications translated to larger differences in C stocks with the limed plots (Siepel et al., 2019, Fig. A4).
The proportional net change in forest floor C stocks, either C losses or C gains (which were observed at a few plots), could best be explained when put in the context of the C stock present in the control plot. This is because the inherent forest floor C stock (in the control plots) is a good measure of organic matter stability, showing the integral effect of different biochemical drivers (such as pH and litter quality) that regulate SOM breakdown. For instance, sites with high C stocks had correspondingly acidic pHs (Fig. 4a), high C:N ratios (Fig. 4b), and both high C contents (Fig. 4c) and high SOM mass (Fig. 4d). This contrasts those sites with inherently low forest floor C stocks which had higher pH, low C:N ratios, low C contents, and thin organic matter layers. When we use the C stock of the control plots as a measure of carbon bioaccumulation, we see that liming effects on forest floor C stocks are most pronounced at sites with intermediate amounts of carbon (18–35 Mg C ha−1) and less prominent at the other ends of the index (Fig. 4e). First, liming additions to sites which had inherently low forest floor C stocks (characterized by thin SOM layers and high pH) exhibited only small proportional losses in overall C stocks (Fig. 4e). This minor response is because these sites already had relatively high pH values, and the addition of lime did not change the biogeochemical environment dramatically, and accordingly there were no large changes in forest floor C stocks. Next, further along this carbon accumulation gradient, sites with intermediate amounts of carbon exhibited large C losses (up to 75 % decreases). This is because the application of lime improved the biochemical environment for microbial communities, thereby stimulating organic matter decomposition, which led to strong C losses at these sites. Finally, fr sites which have inherently high forest floor C stocks, the application of lime had an increasingly muted effect on C losses, ultimately leading to negligible changes in C stocks and even gains at some sites (for example LAU75). Sites at this end of the spectrum were particularly poor, having inherently low pH and thick organic horizons. Here we suspect that more lime had to be applied in order to buffer soil acidification to an extent that leads to pH improvements favorable for soil microorganisms and other soil biota. Thus, microbial activity and accordingly also decomposition rates remained more or less unchanged. We suspect that the inherent biochemical conditions at this end of the spectrum are likely similar to those reported by Melvin et al. (2013) in hardwood forests in the United States and by Derome (1990) and Derome et al. (2000) in spruce and pine stands in Finland, who both report significant gains in SOC stocks as a result of liming.
4.2 Liming effects on organic carbon stocks in the mineral soil
In the mineral soil, liming had a variable response on SOC stocks. In the temporal analysis (Fig. 2b), we measured liming-induced increases in SOC in the topsoil (5–10 cm) over time, similar to but less pronounced than those reported by the German National Forest Soil Inventory (Grüneberg et al., 2019). In the paired approach analysis we found that the direction and magnitude of net SOC changes in response to liming at each site hinged on the strength of different processes at each site. These are primarily influenced by the sites' biochemical conditions and forest type (Fig. 3b–d). The observed variable response is driven by the dynamic balance in soil carbon accumulation rates, namely organic matter inputs, its stabilization, and losses as CO2 or dissolved organic carbon (Jackson et al., 2017). Considering the broad biophysical spectrum of sites at which we sampled, this net C balance (losses versus gains) varied considerably in response to the increases in soil pH and base saturation in the topsoil. Like in the forest floor layer, SOC losses can be attributed to the stimulation of microbial decomposition of organic matter. The direction and magnitude of the liming-induced SOC stock changes in the mineral soil (at all soil sampling depths) could however best be explained by the soil's SOC storage capacity and how much carbon was stored therein. Generally, we found that sites with low inherent soil carbon contents (in the control plots) exhibited SOC increases, while at the other end of the spectrum those sites with inherently high carbon contents exhibited decreases in SOC (Fig. A5). This trend was also observed by van Straaten et al. (2015) after land-use change and shows that sites with inherently high SOC stocks are more vulnerable to SOC losses than sites which initially had little to lose. When we separated our dataset into “carbon-rich” (SOC content >5.5 % at 0–5 cm depth) and “carbon-poor” sites (SOC content <5.5 %), we recorded significant increases in SOC stocks in those sites which initially had low carbon (Fig. 3c) but no significant change for sites with initially high SOC stocks. The lack of a significant response in this case likely reflects that we did not sample many sites with inherently high soil carbon. Considering the carbon-poor sites mostly had high sand content and low soil fertility, the corresponding SOC increases after liming likely reflect a re-equilibration of the ecosystem carbon cycling dynamics (Fig. 3d). We suspect that C stocks were initially depleted at these sites because sustained acidification over decades will likely have constrained aboveground net primary productivity, which accordingly reduced C inputs into the soil. Subsequent improvements in nutrient availability and reduced Al toxicity as a result of liming likely improved tree growth (Court et al., 2018; Van der Perre et al., 2012), which in turn increased C inputs into the soil. These suppositions are supported by Grüneberg et al. (2019), who similarly report that liming led to high C accumulations at sites with low clay contents and C losses at sites with high clay contents.
Next, improvements in both the biochemical environment and litter palatability will likely have stimulated earthworm bioturbation (Persson et al., 2021), as is evident from the higher C contents measured in the top 5 cm of soil in the limed plots in the broadleaf forest plots (data not shown). And while earthworm activity is known to promote organic matter mineralization (Lubbers et al., 2017), earthworms also foster the stabilization of physicochemically protected carbon in soil aggregates by building up mineral-protected microbial necromass (Angst et al., 2019). It is also suspected that the decreases in soil bulk densities in the topsoil (Fig. A2) are attributed to this intensified earthworm activity in the liming plots, which will have loosened and aerated the soil improving gas diffusion, therein also incorporating SOM from the Oh into the mineral soil. Although the net effect of earthworm activity on SOC stocks may not be clear (Persson et al., 2021), it may offer an insight into why net SOC stocks significantly increased in the topsoil (0–5 cm) in the broadleaf forest sites (Fig. 3a) where leaf Ca increased as a result of liming but not in the coniferous forests where needle Ca did not improve (data not shown). Another possible mechanism for the measured increases is through Ca–SOM bridging. Here, the divalent Ca2+ cations bonded on negatively charged organic matter exchange complexes which stabilize the SOM, thereby reducing the dissolution and mobility of the SOM (Kalbitz et al., 2000) and correspondingly also reducing decomposition processes (Grüneberg et al., 2019; Melvin et al., 2013).
4.3 Liming effects on soil respiration and soil methane fluxes
The comparable soil respiration rates measured in the limed and control plots at the DAS 4227 site prior to a third lime application highlight that (at least at this site) soil organic matter mineralization rates equilibrated after liming (done 27 years prior, Fig. 5a–c). The third application of lime (in August 2020) consequently elicited a pronounced and prolonged increase in soil respiration rates at all three sites (Rosikova et al., 2019). These increases were primarily driven by biotic sources, with only a very minor contribution (<3 %) coming from lime-derived CO2 (Fig. 5a–c). This is in agreement with Biasi et al. (2008), who measured similarly low abiotic CO2 production in a limed peatland forest in Finland. It is most likely that the resulting improvements in the soil biochemical environment created suitable conditions for microbial populations to mineralize organic complexes, which led to the increased CO2 production. However, like SOC stock responses to lime application, the size (and duration) of the CO2 production increase varied for the three sites. Notably, the two sites with thick SOM horizons (SEL 34 and GOH 157) had smaller and also shorter-lived CO2 flushes than the more fertile site (DAS 4227). This again supports the earlier observations that especially at poorer sites characterized with thick forest floor layers, liming only moderately improves organic matter mineralization rates.
Interestingly, long-term soil CH4 uptake in the limed plots was more than twice that of the control plot at the Dassel 4227 site (Fig. 5b). Although we did not take baseline measurements at the other two sites, they too had double the CH4 consumption than their respective control plots after liming. This strong CH4 consumption corresponds to the findings of Borken and Brumme (1997), who attributed this to the fact that liming both improves the soil structure (Bronick and Lal, 2005; Schack-Kirchner and Hildebrand, 1998) and reduces the forest floor layer thickness, which in turn improves CH4 diffusion into the soil. Furthermore, it has been shown that methanotroph abundance and activity are optimal at pHs just below 6 (Amaral et al., 1998). Despite these soils being a relatively large CH4 sink, their CO2 equivalency (global warming potential) nevertheless is still dwarfed by CO2 emissions from organic matter mineralization.
We hypothesized that liming would lead to decreases in the forest floor layer C stock and that these C losses would be offset, if not exceeded, by significant gains in SOC stocks in the topsoil. Liming indeed resulted in significant decreases in forest floor SOC stocks, but these losses were only partially offset by small gains made in the mineral soil under certain conditions. However, the question of whether liming enhances forest soil C sequestration is not straightforward. Although there were overall decreases in C stocks in the forest floor, the size of these losses depended on the inherent pH and decomposability of the organic material (before liming). While liming stimulated decomposition at most sites, some poorer quality sites which were characterized by thick organic matter accumulations exhibited either only minor C losses or in a few plots even C gains. Although there were no significant changes in SOC stocks in the mineral soil as a result of liming, the direction and magnitude of C stock changes here were likewise site-dependent. Specifically, sites with sandy soils and/or inherently low C storage exhibited large increases in SOC stocks as a result of liming, while on the other hand, C-rich sites were more predisposed to C losses, suggesting that the SOC stocks here were more vulnerable to decomposition than at sites which had little to lose.
Independent of liming, there is evidence of C accumulation in the forest floor layers over the last few decades (likely a response to elevated N deposition), but liming was able to moderate the amount of C that has become immobilized in the organic matter. Liming-induced increases in mineralization rates seem to last for only a limited amount of time, as seen on the respiration rates of the soil, while the doubling in methane consumption due to liming lasts for several decades. Still, CO2 emissions dwarf the CH4 consumption of the soil.
We can conclude that liming has an influence on forest soil organic carbon stocks. The effect is largest in the forest floor, where liming counteracts the observed temporal organic matter accumulation (due to N deposition), thereby reducing nutrient immobilization in the forest floor. In the mineral soil, the effect of liming on soil organic carbon stocks is less pronounced, but there are indications that liming promotes some carbon accumulation processes in the topsoil. In conclusion, the implications of liming for forest soil greenhouse gas budgets are small but highly site-specific.
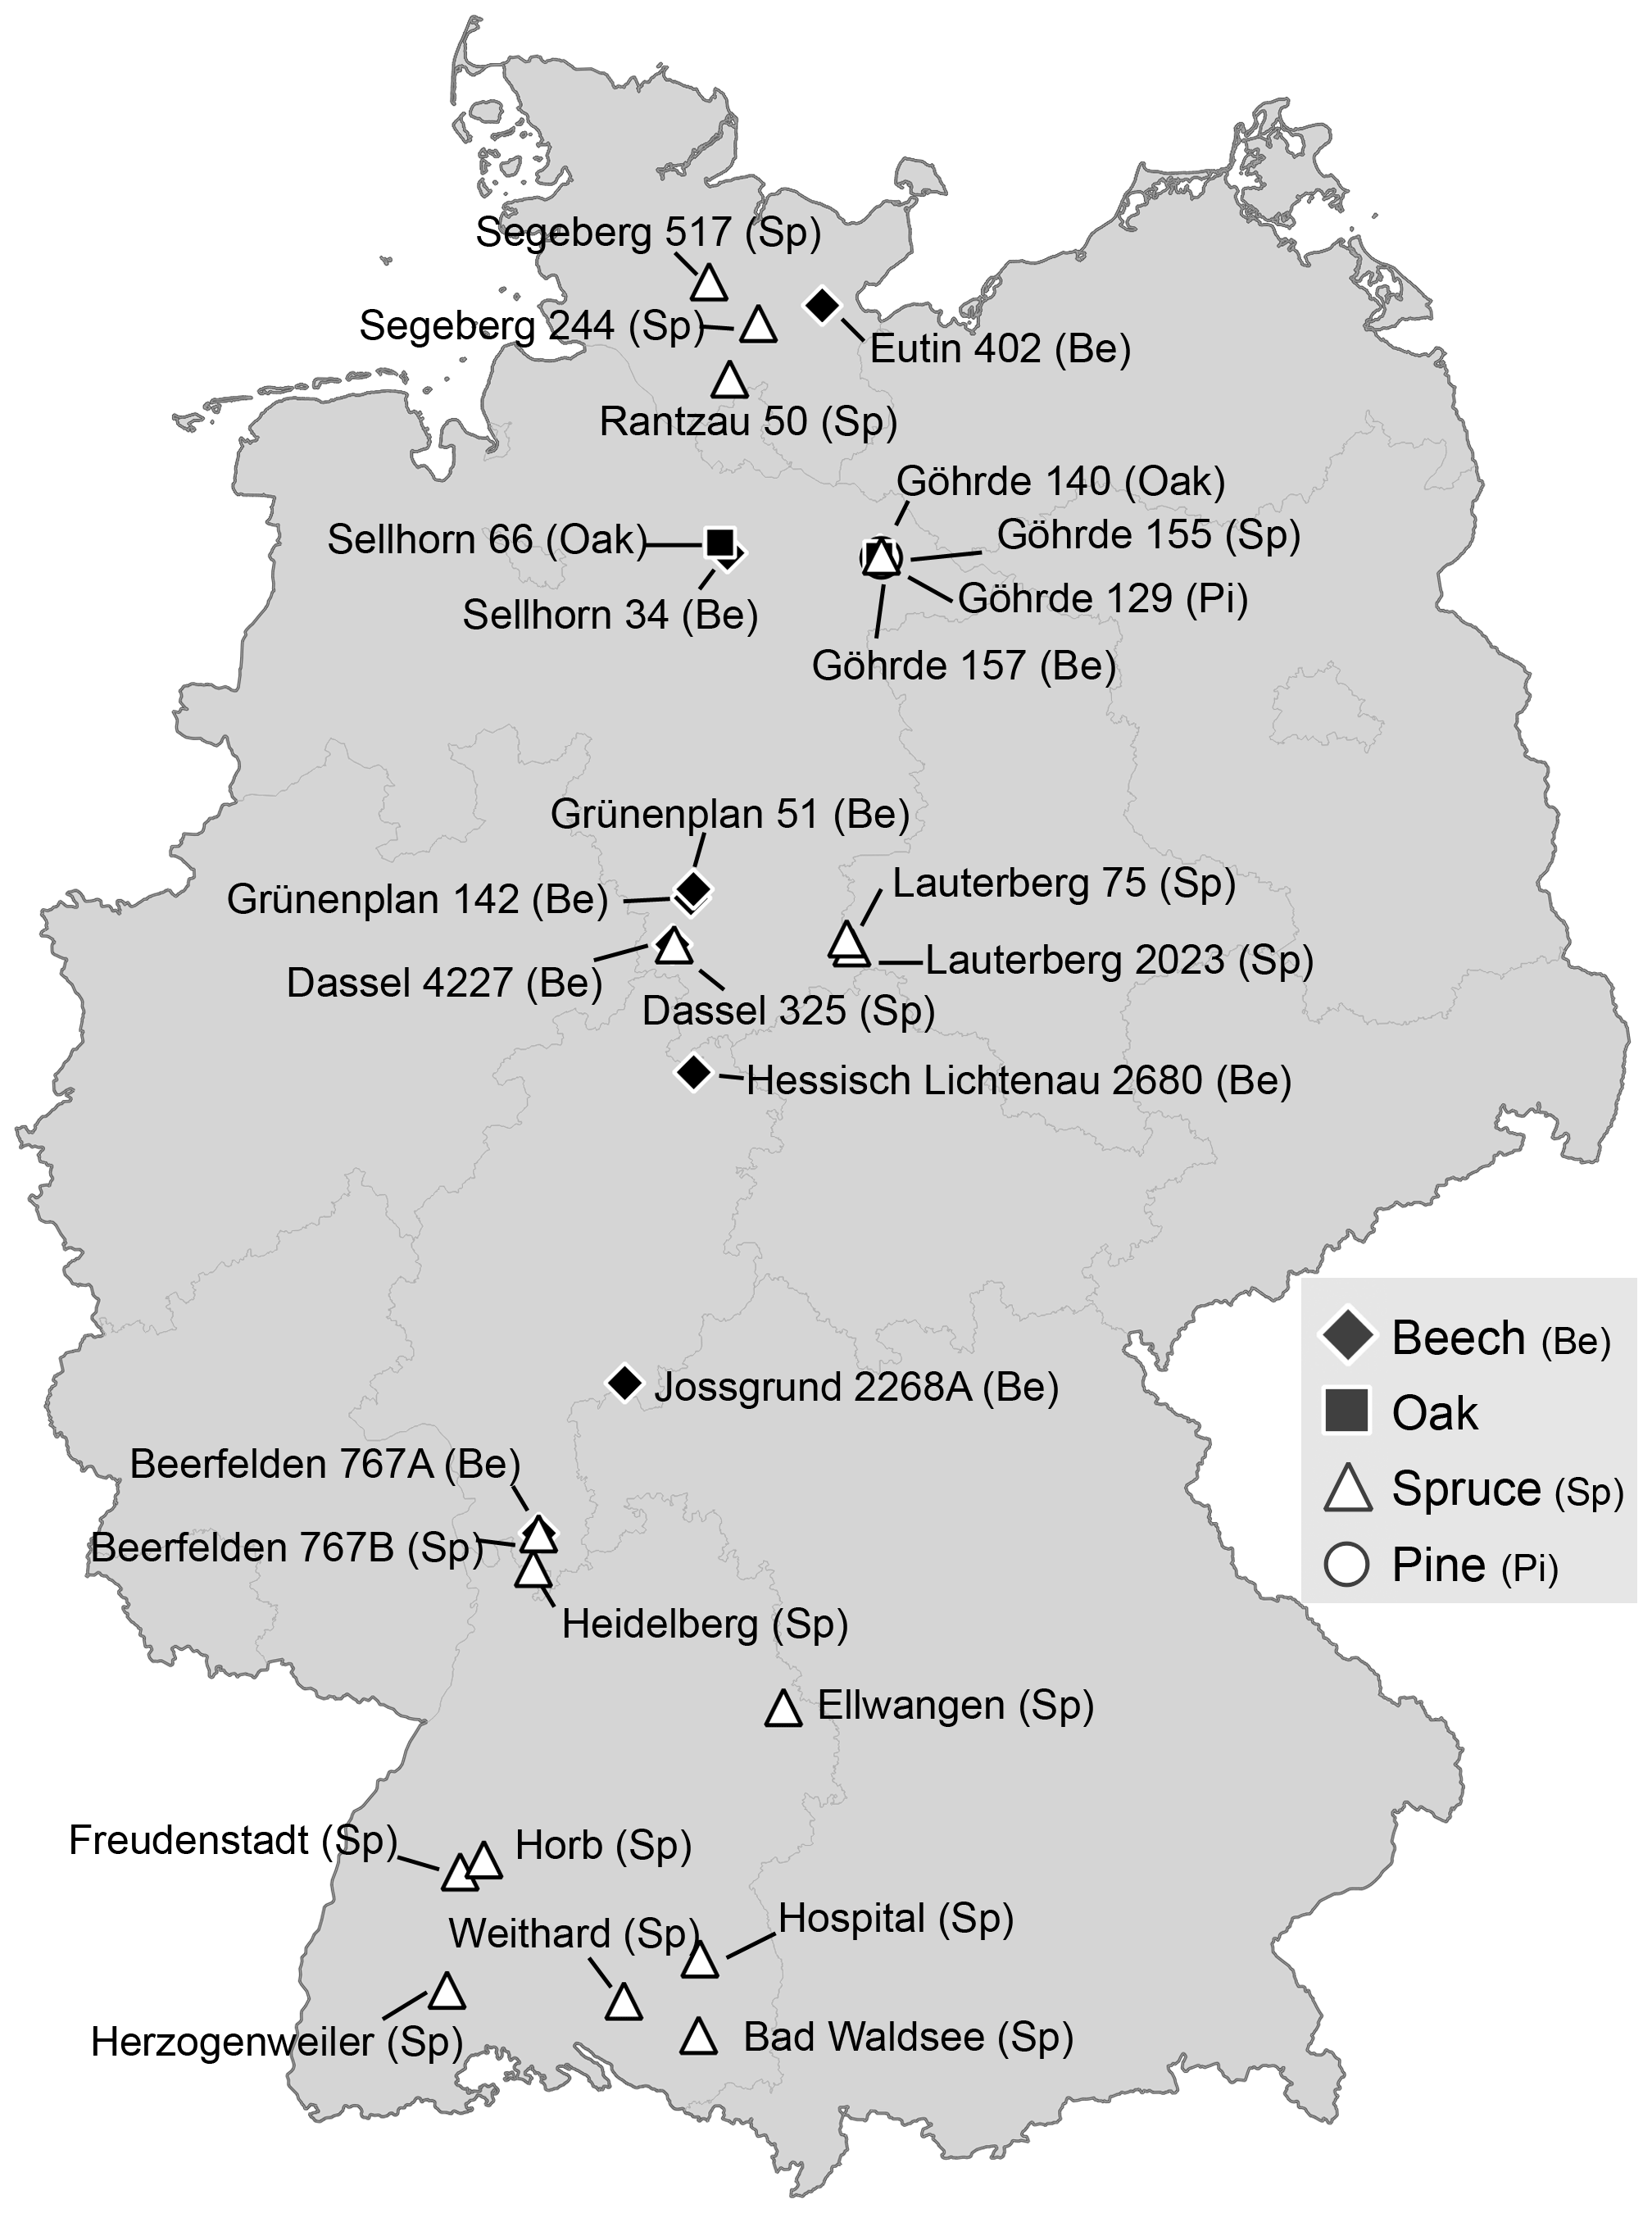
Figure A1Location of the 28 paired liming experiment sites in Germany where soil organic carbon samples were collected.
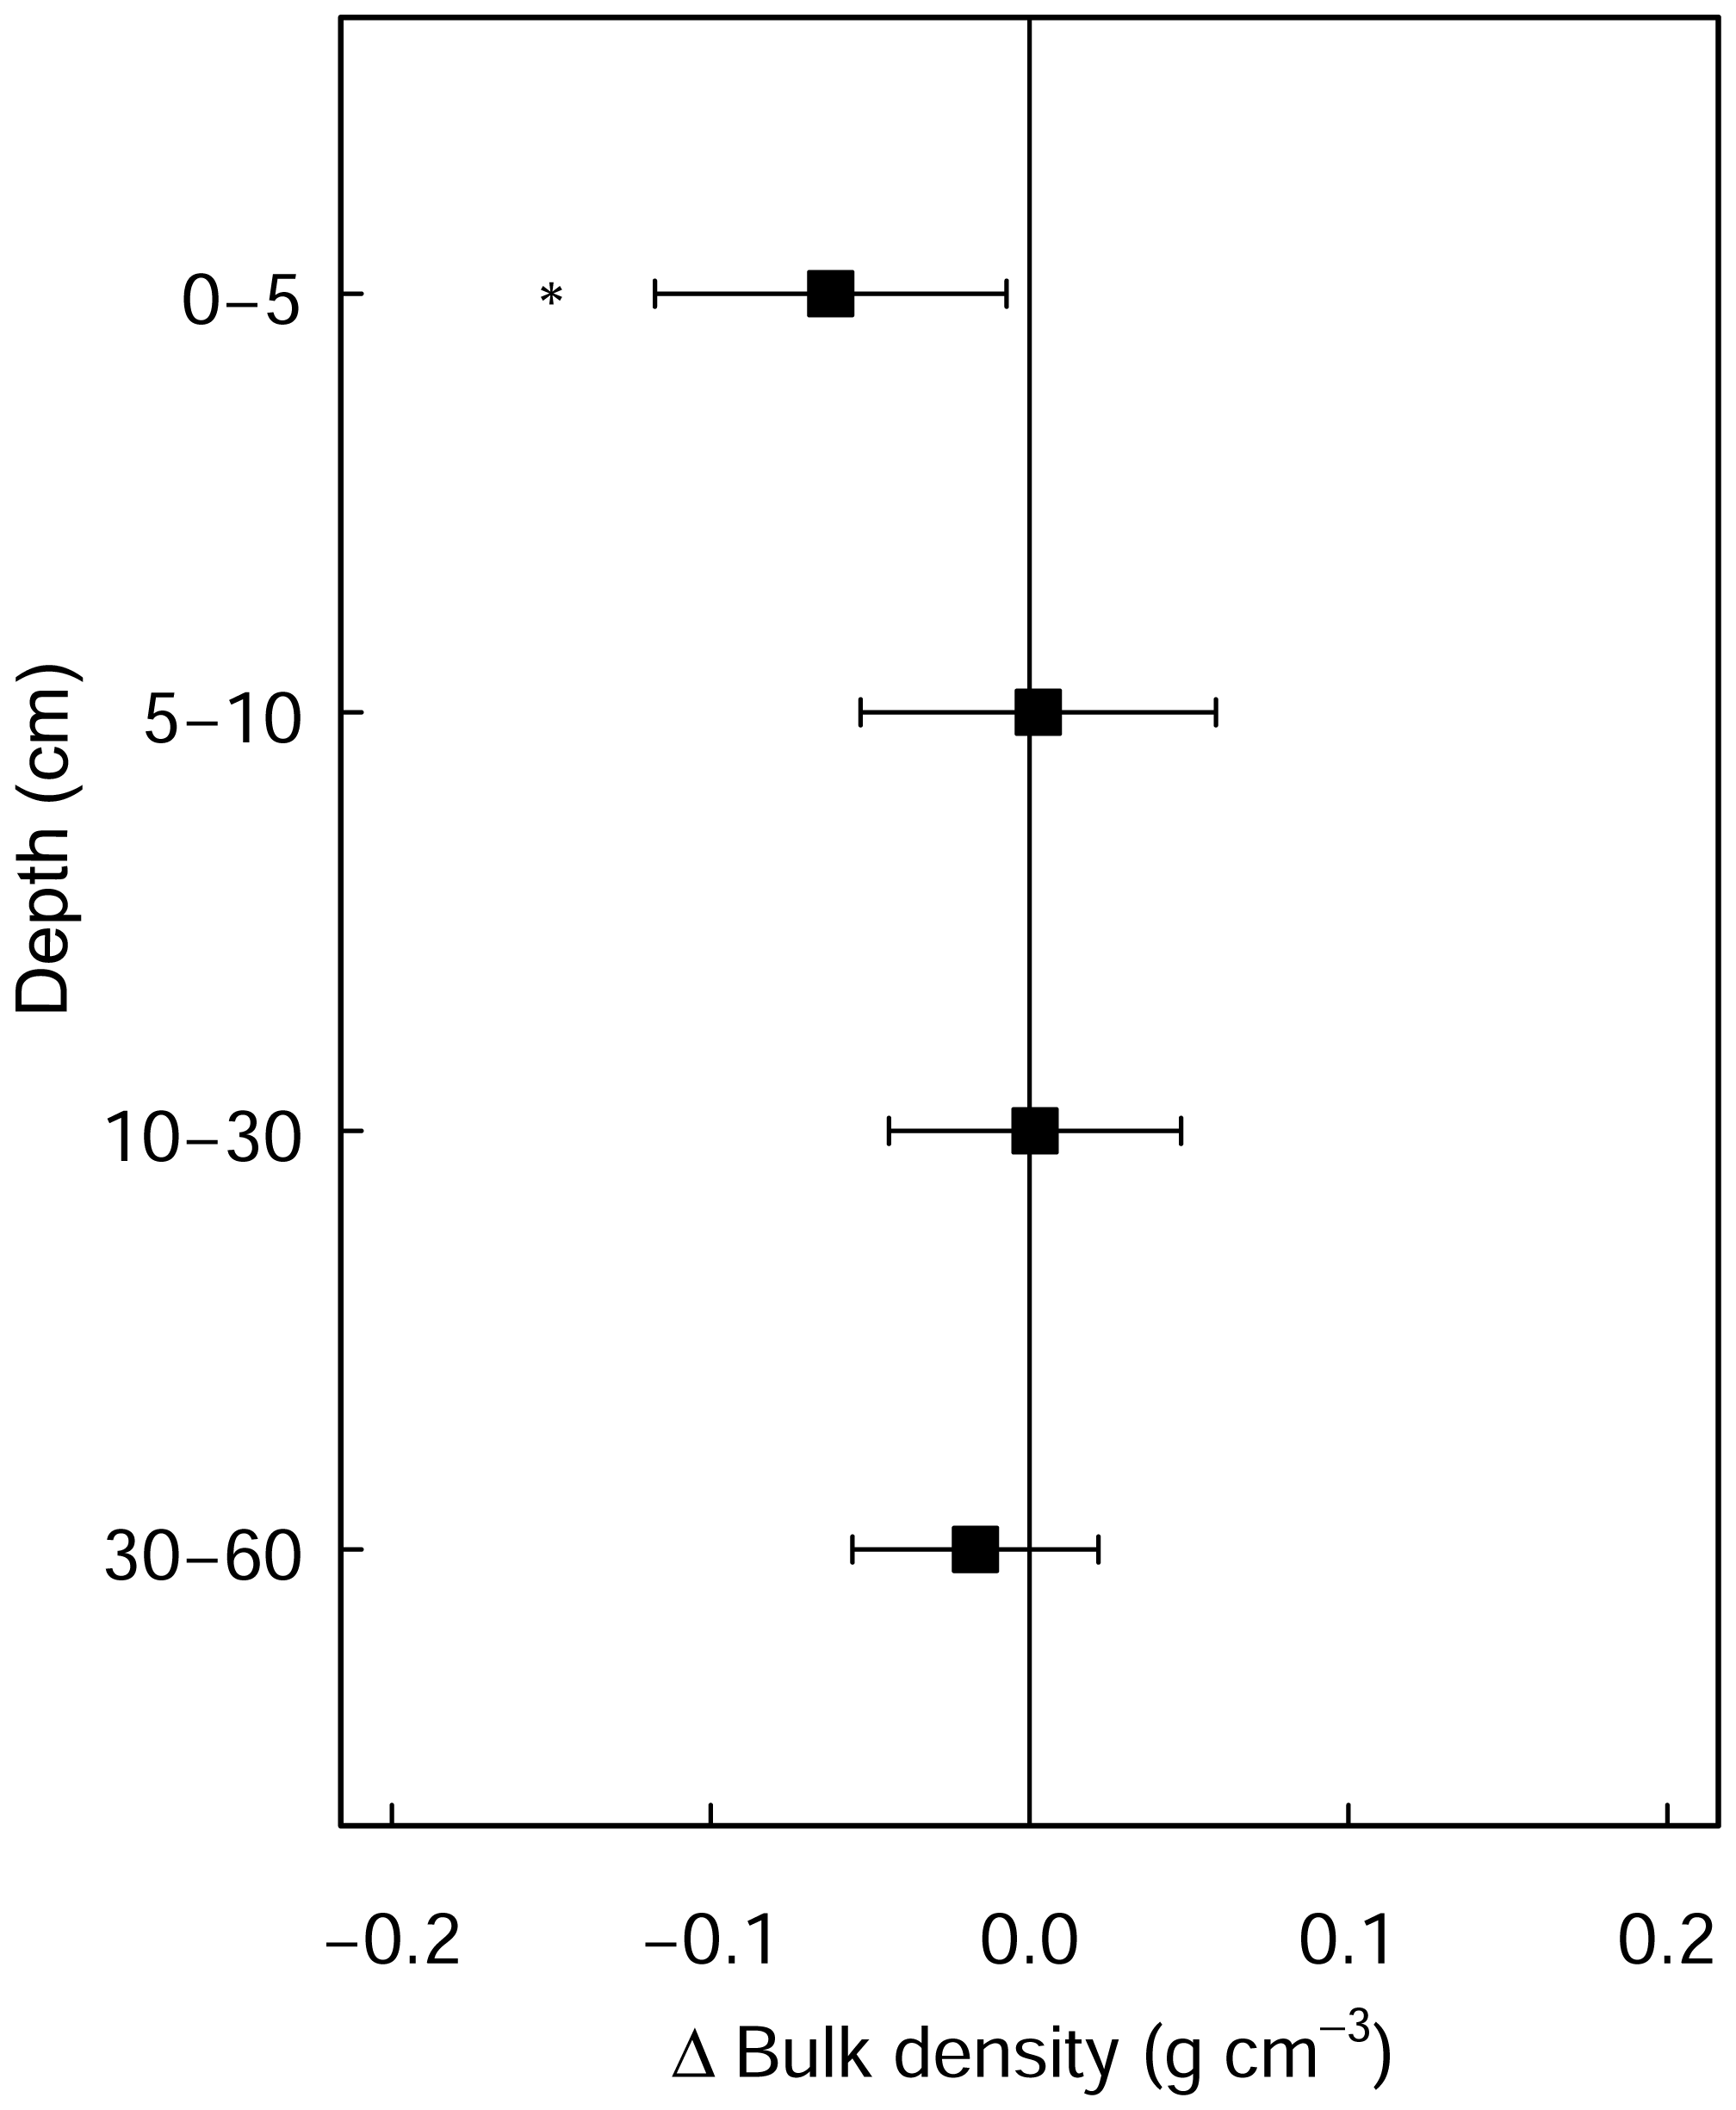
Figure A2Differences in soil bulk density between limed and control plots. Error bars indicate the 95 % confidence intervals based on Student's T distribution. Statistical significance was tested using LME models for each respective soil depth/layer at P≤0.05 (*) and P≤0.01 (**).
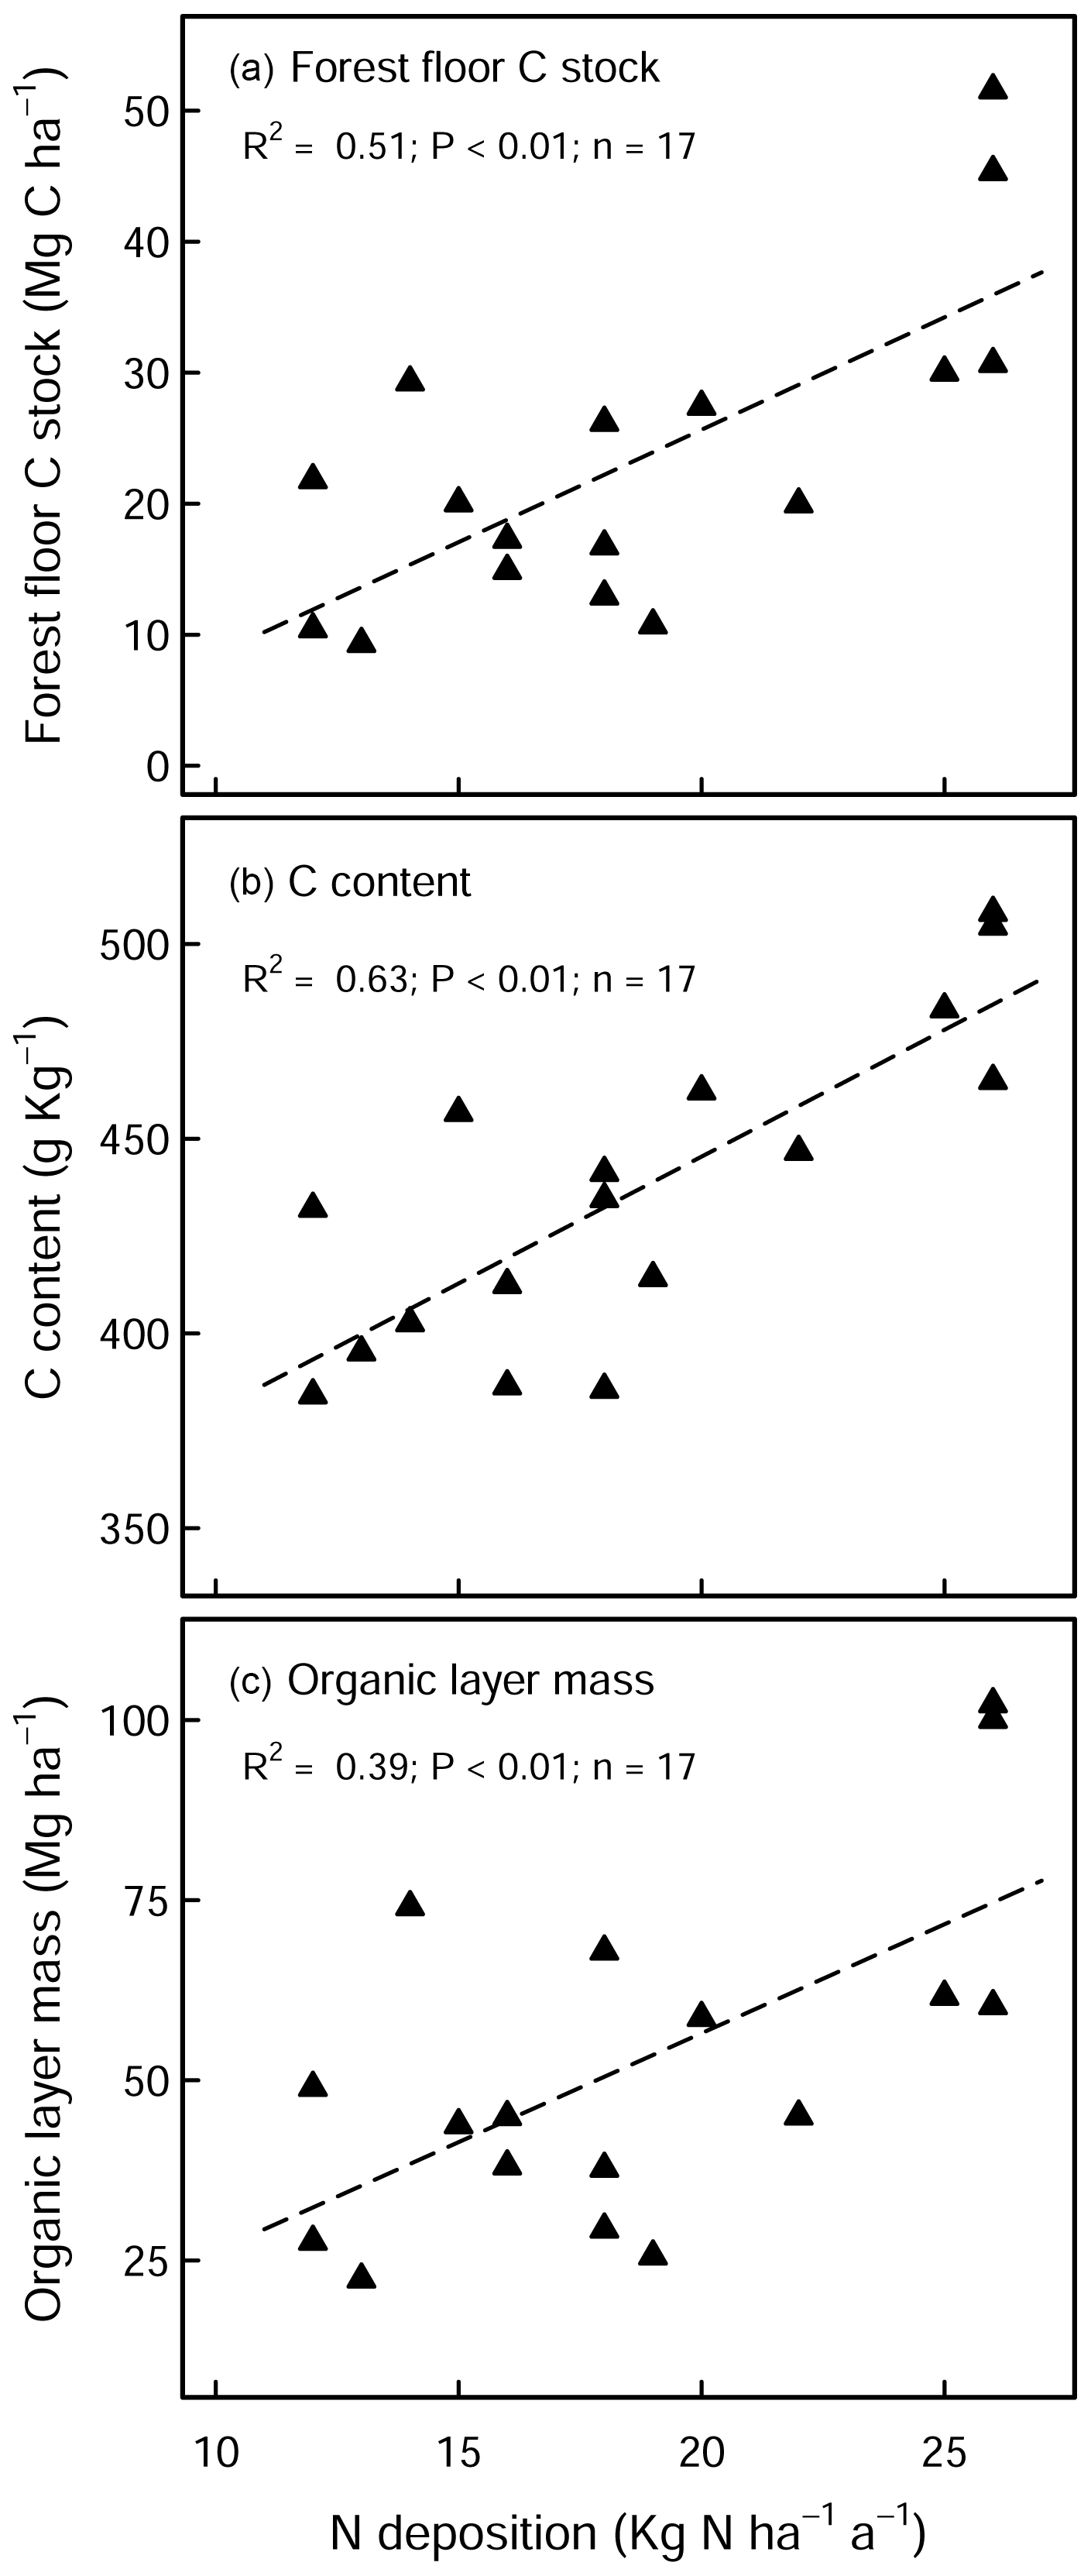
Figure A3Effects of N deposition on (a) SOC stock, (b) C content, and (c) dry mass of the L/Of horizon in unlimed coniferous forests. There was no significant correlation evident with broadleaf forests sites.
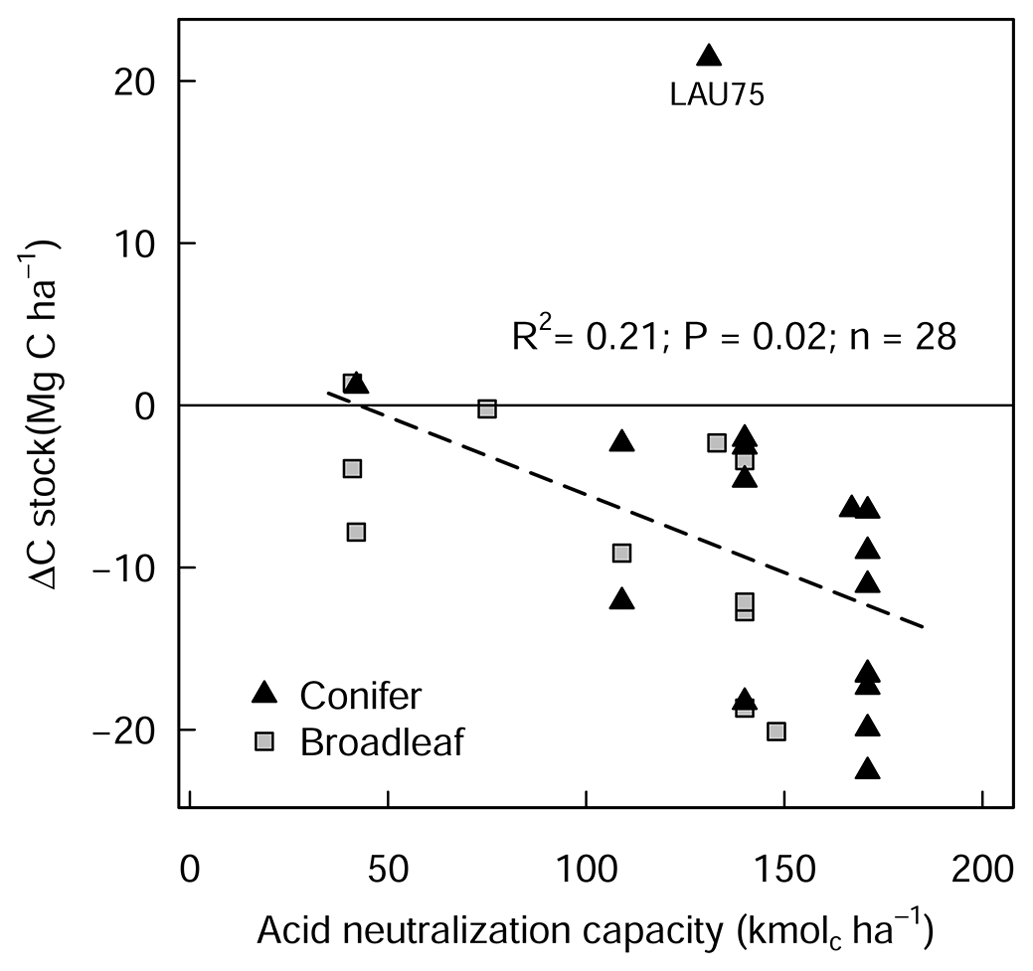
Figure A4Changes in forest floor C stock (L/Of and Oh) between limed and control plots in relation to liming quantities, expressed as acid neutralization capacity (ANC). LAU 75 is Lauterberg 75.

Figure A5Scatter plot diagrams showing SOC contents in the control plots in relation to the liming-induced changes in SOC contents for the different sampling depths in the soil profile.
Data are available on request.
The supplement related to this article is available online at: https://doi.org/10.5194/soil-9-39-2023-supplement.
The project was conceptualized by UT and DZ. UT, DZ, and LK coordinated the data collection activities and oversaw the maintenance of the liming pairs. GM calculated the lime-derived CO2 emissions. OvS did the data analysis and wrote the paper. UT, DZ, LK, and GM gave critical feedback on the paper.
The contact author has declared that none of the authors has any competing interests.
Publisher's note: Copernicus Publications remains neutral with regard to jurisdictional claims in published maps and institutional affiliations.
The authors gratefully acknowledge Peter Hartmann, Lelde Jansone, and the Forest Research Institute Baden-Württemberg for the soil biochemical data from eight liming experiment sites. We also kindly acknowledge Karl Josef Meiwes and Jan Evers for valuable input in the data analysis and interpretation. We also thank Lena Wunderlich, Vanessa Dietrich, and all the other field and lab technicians for their contribution to field and laboratory work. Lastly, we would like to thank the two anonymous reviewers for their constructive comments and suggestions.
This research has been supported by the Agency for Renewable Resources (Fachagentur Nachwachsende Rohstoffe; grant no. 28W-B-4-075-01).
This paper was edited by Claudio Zaccone and reviewed by two anonymous referees.
Amaral, J. A., Ren, T., and Knowles, R.: Atmospheric Methane Consumption by Forest Soils and Extracted Bacteria at Different pH Values, Appl. Environ. Microb., 64, 2397–2402, https://doi.org/10.1128/AEM.64.7.2397-2402.1998, 1998.
Andersson, S. and Nilsson, S. I.: Influence of pH and temperature on microbial activity, substrate availability of soil-solution bacteria and leaching of dissolved organic carbon in a mor humus, Soil Biol. Biochem., 33, 1181–1191, https://doi.org/10.1016/S0038-0717(01)00022-0, 2001.
Angst, G., Mueller, C. W., Prater, I., Angst, Š., Frouz, J., Jílková, V., Peterse, F., and Nierop, K. G. J.: Earthworms act as biochemical reactors to convert labile plant compounds into stabilized soil microbial necromass, Communications Biology, 2, 441, https://doi.org/10.1038/s42003-019-0684-z, 2019.
Biasi, C., Lind, S. E., Pekkarinen, N. M., Huttunen, J. T., Shurpali, N. J., Hyvönen, N. P., Repo, M. E., and Martikainen, P. J.: Direct experimental evidence for the contribution of lime to CO2 release from managed peat soil, Soil Biol. Biochem., 40, 2660–2669, https://doi.org/10.1016/j.soilbio.2008.07.011, 2008.
Blake, G. R. and Hartge, K. H.: Bulk Density, edited by: Klute, A., Methods of Soil Analysis, Part 1. Physical and Mineralogical Methods, 2nd Edition, American Society of Agronomy, Soil Science Society of America, Madison, 363–375, https://doi.org/10.2136/sssabookser5.1.2ed.c13, 1986.
Borken, W. and Brumme, R.: Liming practice in temperate forest ecosystems and the effects on CO2, N2O and CH4 fluxes, Soil Use Manage., 13, 251–257, https://doi.org/10.1111/j.1475-2743.1997.tb00596.x, 1997.
Bronick, C. J. and Lal, R.: Soil structure and management: a review, Geoderma, 124, 3–22, https://doi.org/10.1016/j.geoderma.2004.03.005, 2005.
Court, M., Van der Heijden, G., Didier, S., Nys, C., Richter, C., Goutal, N., Saint-Andre, L., and Legout, A.: Long-term effects of forest liming on mineral soil, organic layer and foliage chemistry: Insights from multiple beech experimental sites in Northern France, Forest Ecol. Manag., 409, 872–889, https://doi.org/10.1016/j.foreco.2017.12.007, 2018.
Crawley, M. J.: The R Book, 2nd edn., Wiley, Chichester, West Sussex, United Kingdom, https://doi.org/10.1002/9781118448908, 2013.
Derome, J.: Effects of forest liming on the nutrient status of podzolic soils in Finland, Water Air Soil Poll., 54, 337–350, https://doi.org/10.1007/BF00298677, 1990.
Derome, J., Kukkola, M., Smolander, A., and Lehto, T.: Liming of Forest Soils, in: Forest Condition in a Changing Environment: The Finnish Case, edited by: Mälkönen, E., Springer Netherlands, Dordrecht, 328–337, https://doi.org/10.1007/978-94-015-9373-1_39, 2000.
Eklund, L. and Eliasson, L.: Effects of calcium ion concentration on cell wall synthesis, J. Exp. Bot., 41, 863–867, https://doi.org/10.1093/jxb/41.7.863, 1990.
Grüneberg, E., Schöning, I., Riek, W., Ziche, D., and Evers, J.: Carbon Stocks and Carbon Stock Changes in German Forest Soils, in: Status and Dynamics of Forests in Germany, vol. 237, edited by: Wellbrock, N. and Bolte, A., Springer International Publishing, Cham, 167–198, https://doi.org/10.1007/978-3-030-15734-0_6, 2019.
Jackson, R. B., Lajtha, K., Crow, S. E., Hugelius, G., Kramer, M. G., and Piñeiro, G.: The Ecology of Soil Carbon: Pools, Vulnerabilities, and Biotic and Abiotic Controls, Annu. Rev. Ecol. Evol. S., 48, 419–445, https://doi.org/10.1146/annurev-ecolsys-112414-054234, 2017.
Jansone, L., von Wilpert, K., and Hartmann, P.: Natural Recovery and Liming Effects in Acidified Forest Soils in SW-Germany, Soil Syst., 4, 38, https://doi.org/10.3390/soilsystems4030038, 2020.
Kalbitz, K., Solinger, S., Park, J.-H., Michalzik, B., and Matzner, E.: Controls on the Dynamics of Dissolved Organic Matter in Soils: A Review, Soil Sci., 165, 277–304, https://doi.org/10.1097/00010694-200004000-00001, 2000.
Knorr, M., Frey, S. D., and Curtis, P. S.: Nitrogen addition and litter decomposition: a meta-analysis, Ecology, 86, 3252–3257, https://doi.org/10.1890/05-0150, 2005.
König, N. and Fortmann, H.: Probenvorbereitungs-, Untersuchungs- und Elementbestimmungs- und Qualitätskontrollmethoden des Umweltanalytik-Labors der Nordwestdeutschen Forstlichen Versuchsanstalt, 3. Ergänzung: 1999–2011, Sektion Waldökosystemforschung der Universität Göttingen, Göttingen, Germany, 348 pp., 2012.
Kreutzer, K.: Effects of forest liming on soil processes, Plant Soil, 168, 447–470, https://doi.org/10.1007/BF00029358, 1995.
Lin, N., Bartsch, N., Heinrichs, S., and Vor, T.: Long-term effects of canopy opening and liming on leaf litter production, and on leaf litter and fine-root decomposition in a European beech (Fagus sylvatica L.) forest, Forest Ecol. Manag., 338, 183–190, https://doi.org/10.1016/j.foreco.2014.11.029, 2015.
Long, R. P., Bailey, S. W., Horsley, S. B., Hall, T. J., Swistock, B. R., and DeWalle, D. R.: Long-Term Effects of Forest Liming on Soil, Soil Leachate, and Foliage Chemistry in Northern Pennsylvania, Soil Sci. Soc. Am. J., 79, 1223–1236, https://doi.org/10.2136/sssaj2014.11.0465, 2015.
Lubbers, I. M., Pulleman, M. M., and Van Groenigen, J. W.: Can earthworms simultaneously enhance decomposition and stabilization of plant residue carbon?, Soil Biol. Biochem., 105, 12–24, https://doi.org/10.1016/j.soilbio.2016.11.008, 2017.
Lundström, U. S., Bain, D. C., Taylor, A. F. S., and van Hees, P. A. W.: Effects of Acidification and its Mitigation with Lime and Wood Ash on Forest Soil Processes: A Review, Water, Air and Soil Pollution: Focus, 3, 5–28, https://doi.org/10.1023/A:1024115111377, 2003.
Marschner, B. and Wilczynski, W. A.: The effect of liming on quantity and chemical composition of soil organic matter in a pine forest in Berlin, Germany, Plant Soil, 137, 229–236, https://doi.org/10.1007/BF00011201, 1991.
Martinson, G. O., Pommerenke, B., Brandt, F. B., Homeier, J., Burneo, J. I., and Conrad, R.: Hydrogenotrophic methanogenesis is the dominant methanogenic pathway in neotropical tank bromeliad wetlands, Env. Microbiol. Rep., 10, 33–39, https://doi.org/10.1111/1758-2229.12602, 2018.
Melvin, A. M., Lichstein, J. W., and Goodale, C. L.: Forest liming increases forest floor carbon and nitrogen stocks in a mixed hardwood forest, Ecol. Appl., 23, 1962–1975, https://doi.org/10.1890/13-0274.1, 2013.
Persson, H. and Ahlström, K.: The effects of forest liming on fertilization on fine-root growth, Water Air Soil Poll., 54, 365–375, https://doi.org/10.1007/BF02385231, 1990.
Persson, T., Andersson, S., Bergholm, J., Grönqvist, T., Högbom, L., Vegerfors, B., and Wirén, A.: Long-Term Impact of Liming on Soil C and N in a Fertile Spruce Forest Ecosystem, Ecosystems, 24, 968–987, https://doi.org/10.1007/s10021-020-00563-y, 2021.
R Core Team: R: A language and environment for statistical computing, R Foundation for Statistical Computing, Vienna, Austria, https://www.R-project.org/ (last access: 5 May 2022), 2020.
Rosikova, J., Darenova, E., Kucera, A., Volarik, D., and Vranova, V.: Effect of different dolomitic limestone dosages on soil respiration in a mid-altitudinal Norway spruce stand, iForest, 12, 357–365, https://doi.org/10.3832/ifor2894-012, 2019.
Schack-Kirchner, H. and Hildebrand, E. E.: Changes in soil structure and aeration due to liming and acid irrigation, Plant Soil, 199, 167–176, https://doi.org/10.1023/A:1004290226402, 1998.
Shen, Y., Tian, D., Hou, J., Wang, J., Zhang, R., Li, Z., Chen, X., Wei, X., Zhang, X., He, Y., and Niu, S.: Forest soil acidification consistently reduces litter decomposition irrespective of nutrient availability and litter type, Funct. Ecol., 35, 2753–2762, https://doi.org/10.1111/1365-2435.13925, 2021.
Siepel, H., Bobbink, R., van de Riet, B. P., van den Burg, A. B., and Jongejans, E.: Long-term effects of liming on soil physico-chemical properties and micro-arthropod communities in Scotch pine forest, Biol. Fert. Soils, 55, 675–683, https://doi.org/10.1007/s00374-019-01378-3, 2019.
Smolander, A., Kitunen, V., Paavolainen, L., and Mälkönen, E.: Decomposition of Norway spruce and Scots pine needles: Effects of liming, Plant Soil, 179, 1–7, https://doi.org/10.1007/BF00011636, 1996.
Umweltbundesamt: Nationale Trendtabellen für die deutsche Berichterstattung atmosphärischer Emissionen, Umweltbundesamt, Dessau, https://gis.uba.de/website/depo1/de/index.html (last access: 5 May 2022), 2019.
Van der Perre, R., Jonard, M., André, F., Nys, C., Legout, A., and Ponette, Q.: Liming effect on radial growth depends on time since application and on climate in Norway spruce stands, Forest Ecol. Manag., 281, 59–67, https://doi.org/10.1016/j.foreco.2012.06.039, 2012.
van Straaten, O., Corre, M. D., Wolf, K., Tchienkoua, M., Cuellar, E., Matthews, R. B., and Veldkamp, E.: Conversion of lowland tropical forests to tree cash crop plantations loses up to one-half of stored soil organic carbon, P. Natl. Acad. Sci. USA, 112, 9956–9960, https://doi.org/10.1073/pnas.1504628112, 2015.
Wendt, J. W. and Hauser, S.: An equivalent soil mass procedure for monitoring soil organic carbon in multiple soil layers, Eur. J. Soil Sci., 64, 58–65, https://doi.org/10.1111/ejss.12002, 2013.
Xing, K., Zhao, M., Niinemets, Ü., Niu, S., Tian, J., Jiang, Y., Chen, H. Y. H., White, P. J., Guo, D., and Ma, Z.: Relationships Between Leaf Carbon and Macronutrients Across Woody Species and Forest Ecosystems Highlight How Carbon Is Allocated to Leaf Structural Function, Front. Plant Sci., 12, 1030, https://doi.org/10.3389/fpls.2021.674932, 2021.