the Creative Commons Attribution 4.0 License.
the Creative Commons Attribution 4.0 License.
 | 10 May 2023
Impact of contrasting fertilizer technologies on N dynamics from subsurface bands of “pure” or blended fertilizer applications
Michael J. Bell
Enhanced efficiency fertilizer (EEF) technologies that employ product coatings to delay nitrogen (N) release or are chemically stabilized to inhibit key steps of N transformations in soil offer potential for improving N use efficiency (NUE) in agricultural systems. However, the dynamics of N release and transformation from single technologies may result in a spatial or temporal mismatch of N supply and demand during a growing season. This may be overcome by use of blends of different technologies, provided the reduction in the concentration of stabilizing products does not reduce effectiveness. Laboratory incubations quantified the N dynamics around bands of controlled-release fertilizer (CRF) and nitrification-inhibited (NI) urea and varying blends of these technologies and referenced this against conventional urea and biodegradable, plant-oil-coated urea (POCU) applied at the same rates in two contrasting soils over 60 d. Blends of NI urea (3,4-dimethylpyrazole phosphate, DMPP urea) and a CRF (polymer-coated urea, PCU) typically resulted in N concentrations and distribution that were intermediate to those of the constituent products in unblended applications. Changes in the proportions of each product were mirrored by urea nitrogen (urea-N) concentrations around the bands in both soils, while the proportions of DMPP urea in each blend were only related to the extent of nitrification inhibition in the Vertisol. A proportion of the POCU granules burst during the early stages of incubation, resulting in initially higher mineral N concentrations compared to PCU. However, both CRFs delayed N release and formation of nitrate nitrogen (NO3-N) relative to granular urea, and mineral N distribution was similar within each soil. Soil type had a significant impact on banded N dynamics. Where there was little effect of N-fertilizer treatment on NO3-N production in the Ferralsol, the higher impedance to solute transport in the Vertisol contributed to a significant inhibitory effect of NI urea on nitrification in both pure and blended DMPP urea treatments. Using NO3-N production as a benchmark for the risk of environmental loss, the efficacy of fertilizer treatments in this soil was of DMPP urea PCU blends (higher ratio of PCU may offer small but insignificant benefit) > DMPP urea = PCU > urea. These findings highlight the importance of soil properties in determining the N dynamics from different banded EEF products. Insights into the efficacy of biodegradable alternatives to polymer coatings and the efficacy of blended EEF products can improve the reliability of N supply while reducing environmental impacts, therefore offering greater opportunities to sustainably improve fertilizer NUE in cropping systems.
- Article
(5619 KB) - Full-text XML
-
Supplement
(1207 KB) - BibTeX
- EndNote


Enhanced efficiency nitrogen (N) fertilizers (EEFs) are widely proposed as a key tool for meeting the competing demands of (i) improving agricultural productivity and (ii) reducing the impacts of agricultural activity on nearby environments. Broadly, these challenges involve improving N use efficiency (NUE) in agricultural systems. Current EEF technologies are deployed in fertilizer products which utilize controlled release or nutrient-stabilizing mechanisms which regulate fertilizer N transformations in soil to enhance crop N uptake and reduce potential losses to natural environments (Association of American Food and Plant Control Officials, 2013).
Controlled-release mechanisms aim to regulate the duration, rate and pattern of N release (Shaviv, 2001), providing a predictable supply of labile N under a given set of environmental conditions. The coating material of controlled-release fertilizers (CRFs) has evolved over time, with polymer-coated products currently being the most widely utilized form of this technology in agriculture. Recently, concerns of polymer “shell” persistence and the potential for these to carry unreleased N into natural ecosystems (Azeem et al., 2014; Trenkel, 2010) have led to investigation of a range of biodegradable coatings (Araujo et al., 2017; Li et al., 2016; Rotondo et al., 2018; Vadjung and Saengsuwan, 2018). Environmental concerns will continue to drive the development of biodegradable coatings in future CRF products, but the efficacy of these coatings for delivering a controlled release of N has only been explored in a very limited number of studies (e.g., Martinez et al., 2021).
Stabilized fertilizers function by reducing the rate of microbial activity at specific steps of N transformation, thereby regulating the formation of N products with greater risks of loss (Trenkel, 2010). Commercial stabilizing products currently target either of two key processes, viz. the hydrolysis of urea to ammonium carbonate ([NH4]CO3) with urease inhibitors (UIs) and the oxidization of ammonia (NH3) to nitrite (NO) with nitrification inhibitors (NIs). A wide range of compounds inhibit urease (Byrnes and Freney, 1995; Medina and Radel, 1988) and nitrification (Juliette et al., 1993; McCarty, 1999; McCarty and Bremmer, 1986, 1989) activities, with N-(n-butyl)thiophosphoric triamide (NBPT) and 3,4-dimethylpyrazole phosphate (DMPP) being the most widely used compounds in urease and nitrification inhibitor formulations, respectively.
While the function and efficacy of EEFs are relatively well-defined under controlled conditions (Azam et al., 2001; Benckiser et al., 2013; Creason et al., 1990; Du et al., 2006; Guardia et al., 2018; Shaviv et al., 2003), field performance of these technologies has not demonstrated consistent outcomes for yield improvement, N uptake and reductions in N losses (Dang et al., 2021; LeMonte et al., 2016; Lester et al., 2016; Li et al., 2015; Martinez et al., 2021; Nauer et al., 2018; Rowlings et al., 2016; Schwenke and Haigh, 2019; Wang et al., 2016b). This inconsistency has eroded confidence in EEFs to deliver improved NUE. In particular, concerns have been raised that the delivery of N from CRFs may be too slow to effectively meet early crop demand (Halvorson and Grosso, 2013; Nelson et al., 2009; Quemada et al., 2013; Thapa et al., 2016). Conversely, questions of inhibitor effectiveness have been raised where inhibition appears to be relatively transient (Chen et al., 2015; Fu et al., 2018; Shi et al., 2016). These concerns, combined with the higher fertilizer costs (per kg N) associated with EEF technology, raise real concerns about the effectiveness and the economic returns that can be derived from the use of products reliant on individual EEF technologies. In response, attempts have been made to blend the cheaper, readily soluble N products with variable proportions of EEF products to mitigate at least some of the potential N loss while minimizing the financial risk.
Multiple field experiments have investigated the potential for blends and varying the ratios of urea and CRFs (typically polymer-coated urea (PCU)) to deliver improved NUE (Dhakal and Nelson, 2019; Guo et al., 2017; McKenzie et al., 2010; Nash et al., 2012; Noellsch et al., 2009; Patil et al., 2010; Payne et al., 2015; Wang et al., 2015). Whilst most of these experiments have found that blends of PCU and urea may reduce N losses (cf. urea alone), not all have reported positive outcomes for improved crop uptake and/or yield gains (McKenzie et al., 2010; Nash et al., 2012; Patil et al., 2010). Where benefits have not been recorded, “failures” have been attributed to a disparity in N supply relative to crop demand (i.e., inadequate N available early in the season due to the delay in N supply from PCU) or conditions where N loss has been negligible and the addition of PCU has not provided any advantages (cf. urea). Where the supply of N from PCU urea blends has not met initial crop demand, it is hypothesized that the uncoated urea component of the applied fertilizer blend may have been lost. Under high loss conditions, the substitution of N-stabilized products for the more “vulnerable” urea in blends with PCU may provide additional protection against immediate leaching and/or denitrification losses. The combination of NI urea and PCU in fertilizer bands may therefore create a more “stable” and sustained supply of N compared to PCU urea blends or urea alone. The concept of blending NI urea and PCU products within fertilizer bands as a way of improving crop NUE has been recently tested in the Australian sugarcane industry (Bell et al., 2021; Connellan et al., 2021), where environmental conditions and soil characteristics are known factors for high N loss conditions. Sugarcane crops using these blends were consistently able to achieve similar crop N uptake to urea applications at 20 %–25 % higher application rates, although yield responses were variable in some situations and rarely exceeded those achieved from using either NI alone or a blend of urea and PCU (Connellan et al., 2021). Other evaluations of blended EEF products are limited, and the extent to which these reports of improved fertilizer-blend efficacy in sugarcane can be extrapolated to other soils, climates and cropping systems is limited by a lack of mechanistic studies. This study seeks to address this knowledge gap by determining the release, transformation rates and distribution of N from bands of granular urea, CRFs, stabilized urea and blends of these products in contrasting soils under controlled-environment conditions. A plant-oil-coated CRF (Kingenta, 2022) is also included in this investigation for preliminary examination of N release dynamics from an example of a biodegradable fertilizer coating. This study aims to provide a mechanistic understanding of fertilizer-blend dynamics which may be used to predict the potential efficacy of different EEF blends in contrasting soils that underpin a variety of crop industries.
2.1 Soil collection, characterization and preparation
Soil from the top 10 cm of the profile of a yellow Ferralsol and black Vertisol (IUSS Working Group, 2015) was collected from sugarcane farms in the Bundaberg district. The soils were chosen on the basis of their contrasting texture and physicochemical properties (Table 1). Briefly, the Ferralsol was slightly acidic and had a low clay content, cation exchange capacity (CEC) and pH buffering capacity (pHBC). The Vertisol had a high clay content, CEC and pHBC and a neutral pH. Prior to incubation, soil was prepared by air-drying and sieving to < 2 mm. The moisture content at field capacity for both soils was determined using the column method described in Asher et al. (2002).
Table 1Soil chemical properties and characteristics, where EC is the electrical conductivity, pHBC is the pH buffering capacity, CEC is the cation exchange capacity, TC is total carbon, TOC is total organic carbon, TN is total nitrogen and GWC (FC) is the gravimetric water content at field capacity.
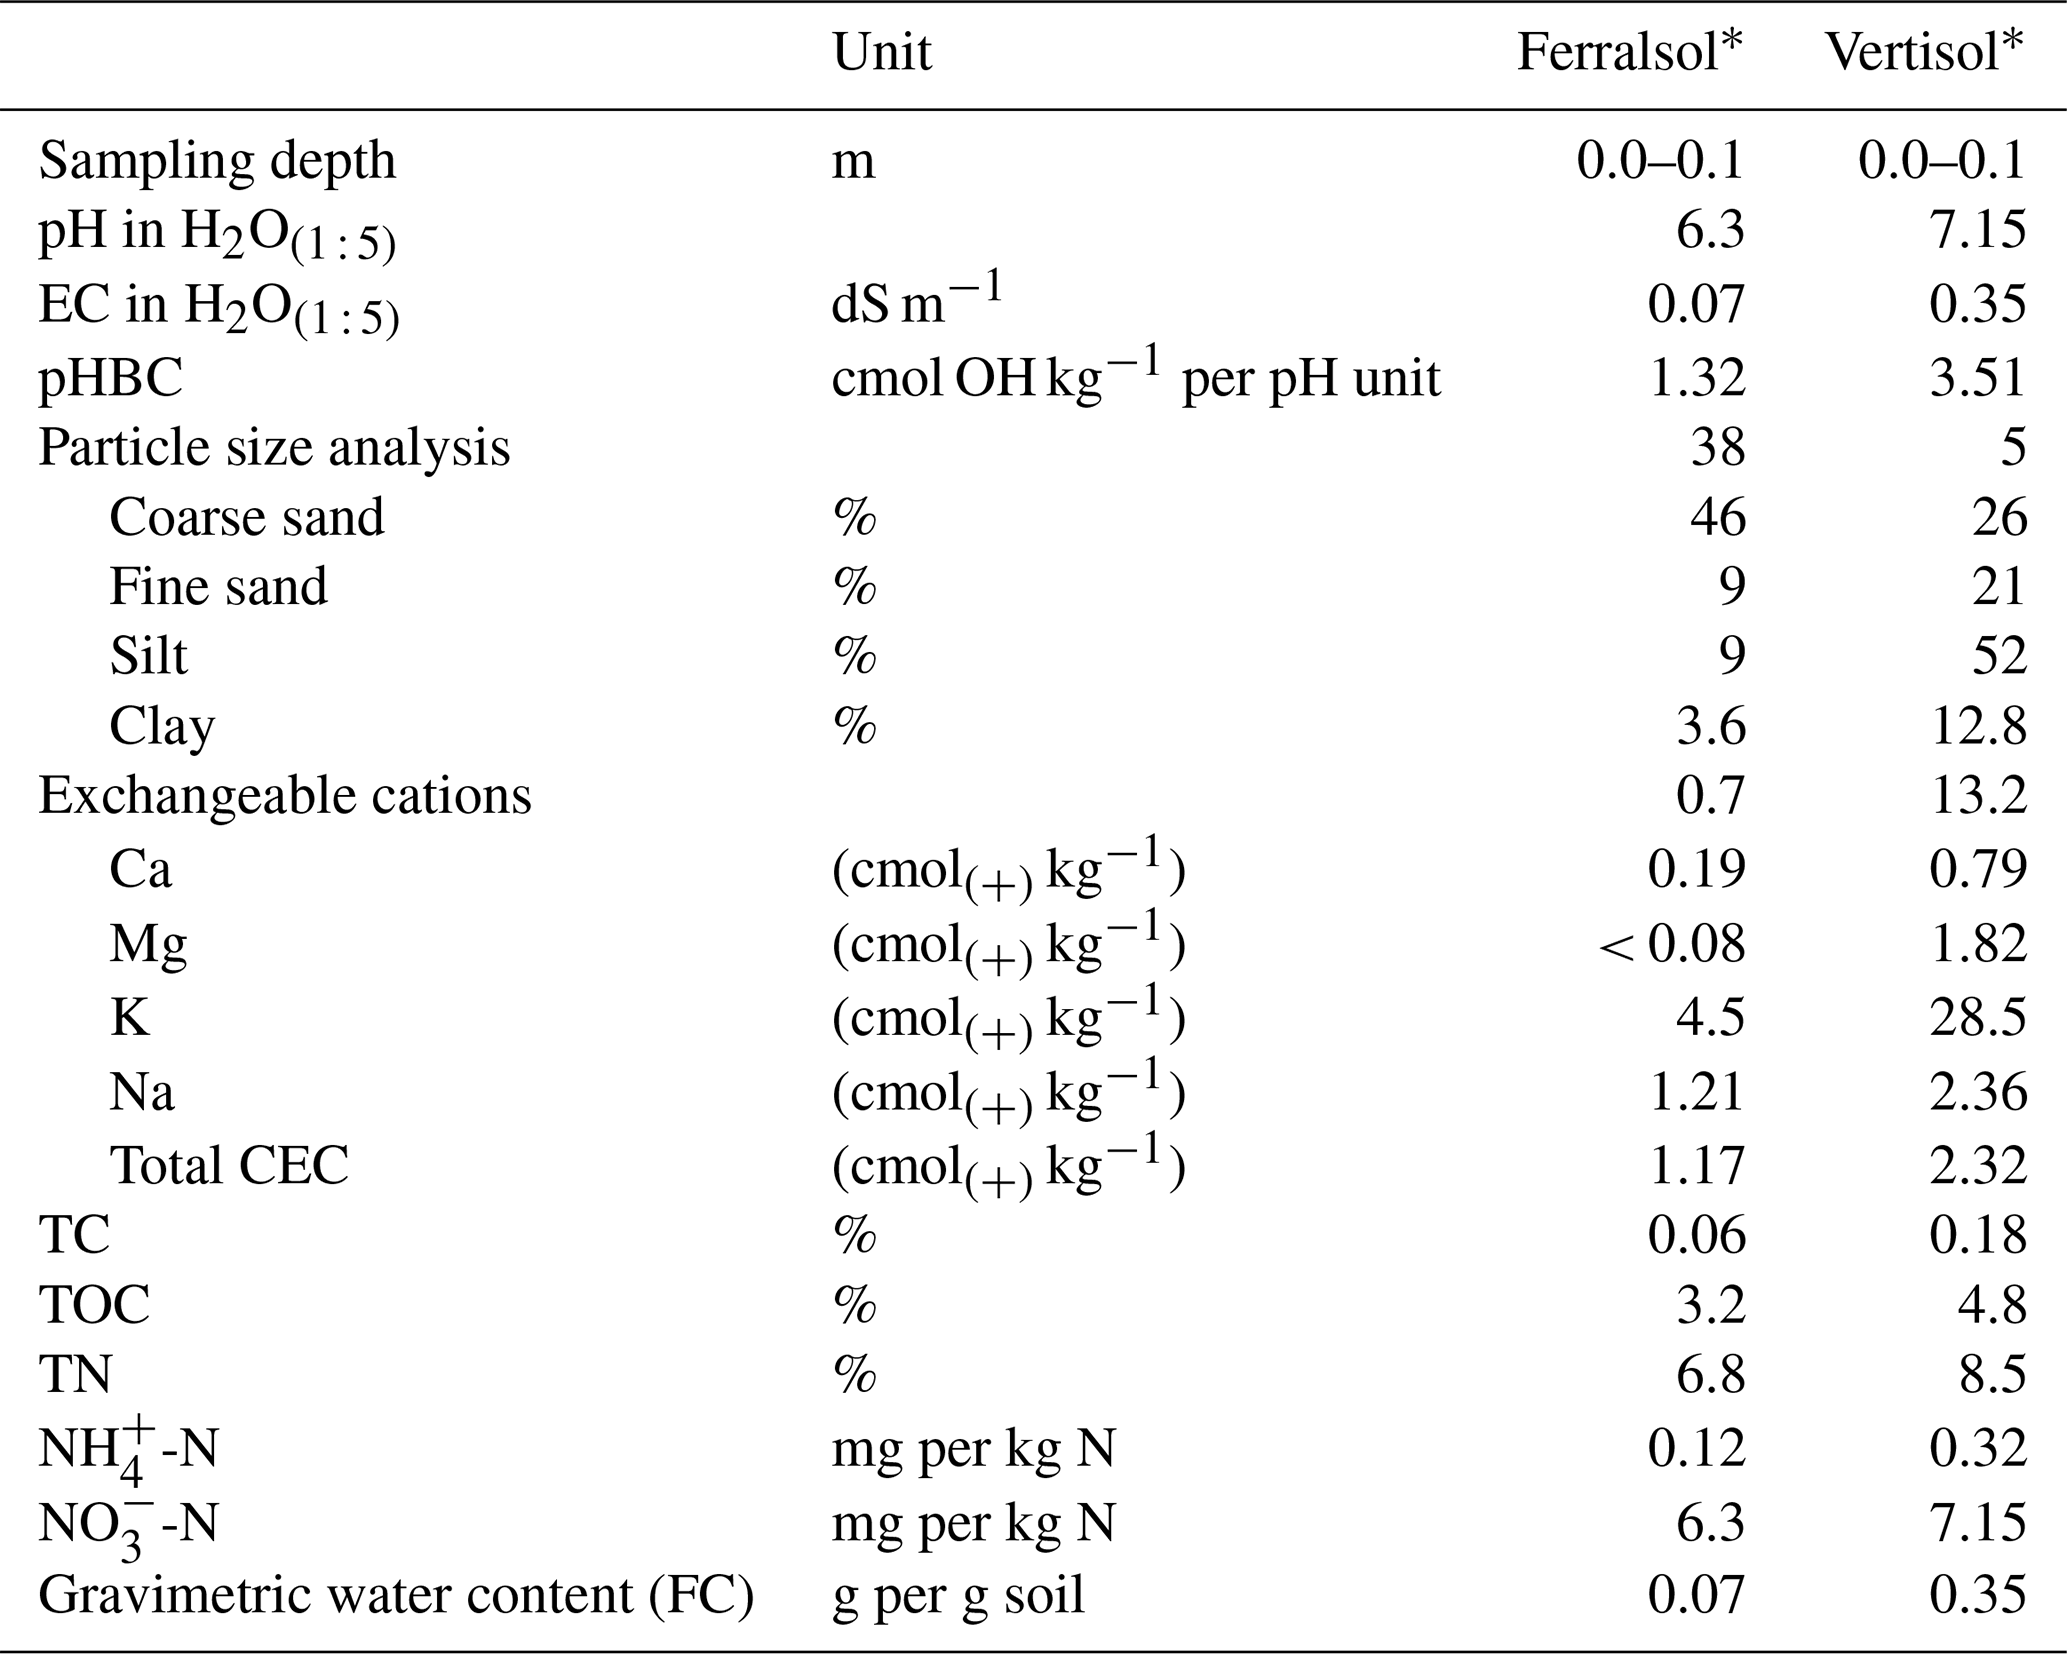
* IUSS Working Group (2015).
2.2 Incubation experiment
Prepared soil (air-dried, sieved to < 2 mm) was added to a depth of 50 mm in round incubation pots (225 mm diameter PVC end caps). Bulk density was adjusted to ca. 1.2 g cm−3 by tapping the pot base 10 times on the bench, which settled the soil to a depth slightly below 5 cm. Deionized water was added to each pot to bring the soil mass to the pre-calculated field capacity moisture content (0.32 and 0.12 g g−1 for the Vertisol and Ferralsol, respectively), taking into account the initial moisture content of air-dried soil. Pots were sealed with plastic cling wrap, and the moisture was allowed to equilibrate overnight. Following moisture application, the Vertisol swelled approximately 0.5 cm in height, reducing the bulk density of this soil to ca. 1.1 g cm3. Treatments of N fertilizer were then applied by removing a 10 mm diameter core of soil, inserting the various fertilizer treatments to a depth of 50 mm, and then covering the fertilizer column with some of the previously removed soil to limit volatilization losses. All treatments were applied at a rate equivalent to the weight of fertilizer in a 50 mm section of a N-fertilizer band applied at 150 kg N ha−1 at 1.8 m row spacing (1350 mg N per pot). This rate and concentration were chosen to reflect typical application rates and band spacings in the Australian sugarcane industry (i.e., Six Easy Steps Toolbox, 2022). The N-fertilizer treatments described in this paper include (i) granular urea; (ii) granular urea coated with the NI, DMPP and marketed as ENTEC® (DMPP urea); (iii) polymer-coated urea granules with a 90 d release duration and marketed as Agromaster Tropical® (PCU); (iv) urea granules with a biodegradable coating and an 80 d release duration supplied by Kingenta Australia Ag PTY LTD as plant-oil-coated urea (POCU); (v) a 1:2 fertilizer blend of DMPP urea and PCU (1:2 DMPP PCU); and (vi) a 2:1 fertilizer blend of DMPP urea and PCU (2:1 DMPP PCU). A moist glass fiber filter paper (125 mm diameter) was placed centrally on top of the soil to maintain humidity within the pot and allow for moisture adjustment without disturbing soil. Incubation pots were weighed to allow for ongoing moisture adjustment, with moisture maintained at field capacity ± 0.5 % (moisture adjustment every 7 d). Incubation pots were sealed with plastic wrap, and three pinholes were inserted to prevent the development of anaerobic conditions. The incubation was maintained at 23 ± 1 ∘C, and duplicate pots were placed in a completely randomized design across two benches.
2.3 Sample collection
Destructive sampling occurred at 10, 35 and 60 d after incubation initiation (DAI). Soil in each pot was collected concentrically beginning with a 20 mm diameter central core (designated the “0–10 mm” position) and then in increments moving outwards from that central core designated as the 10–30, 30–50, 50–70, 70–90 and 90–110 mm zones. These samples were collected using stainless steel sampling rings (diameters of 20, 40, 60, 80 and 100 mm) that were pushed down through the soil to isolate and progressively remove each ring of soil, beginning from the central 20 mm core, which contained the fertosphere (the volume of soil within “0–10 mm” of the fertilizer band and inclusive of the band). Soil in each increment was completely removed from incubation pots and mixed to homogenize, with two 10 g samples subsequently taken for analysis. One of the two soil subsamples was used for pH and EC measurement (1:5 soil : water) and subsequently extracted with 2M KCl for analysis of mineral N species. The other subsample was extracted with deionized water for analysis of urea nitrogen (urea-N) concentration. In fertilizer treatments containing controlled-release products, intact granules were recovered prior to removal of soil samples from incubation pots. The granule samples were kept frozen until analysis for total N.
2.4 pH and electrical conductivity measurements
The pH and EC of soil samples were measured in a 1:5 () soil : water solution by adding 50 mL DI water to 10 g soil. Measurements for pH and EC were recorded after 1 min of stirring. Values for pH and EC were arithmetically averaged from duplicate samples.
2.5 Soil extraction
Extraction of mineral N followed standard methods (Method: 7C2a, Rayment and Lyons, 2010), using a 1:5 () soil-solution extraction with 2M KCl (i.e., 10 g soil with 50 mL 2M KCl). Samples were shaken end over end for 1 h and then removed and allowed to settle for approximately 15 min. A 10 mL aliquot of the extraction solutions was taken and centrifuged at 3700 rpm (relative centrifugal force (RCF): 1760×g) for 9 min, followed by pouring off and re-centrifuging of the supernatant. All solutions were frozen at until analysis. The solutions were analyzed for NH-N (Searle, 1974), NO-N and NOx-N (Best, 1976; Bremner, 1965) by segmented flow analysis (SFA). Urea-N was extracted in 1:5 soil : water () solutions with the addition of 100 µL of 0.02 M Ag2SO4 (urease inhibitor, equiv. 62.4 µg per g soil) added immediately after water addition to soil samples (Douglas and Bremner, 1970). Samples were shaken end over end for 1 h and then removed and allowed to settle for approximately 15 min. A 10 mL aliquot of the extraction solutions was taken and centrifuged at 3700 rpm (RCF: 1760×g) for 9 min, followed by pouring off and re-centrifuging of the supernatant. All solutions were frozen until analysis. The urea extracts were analyzed on a Thermo Fisher Ultimate 3000 U-HPLC system using a Thermo Fisher DAD 3000 diode array detector following modified versions of the methods detailed for urea-N (MicroSolv, 2010). In each batch, urea spikes were added to an aliquot of sample extract to monitor and quantify any urea loss during the analysis process, which was minimal. Previous experiments indicated that the high concentrations of urea-N generated in this study resulted in solubility issues such that recoveries were incomplete when extracted from soil with 2M KCl solution. Consequently, water extractions from soil were considered appropriate for determination of this N species.
2.6 Granule analysis
The organic N content of a subsample (ca. 0.1 g) of intact fertilizer granules was determined by digestion in concentrated sulfuric acid followed by the semimicro-Kjeldahl procedures outlined in Brech (1976), Searle (1974), and Youden and Steiner (1975). A second subsample (ca. 1.7 g) was analyzed for mineral N content using segmented flow analysis (Best, 1976; Bremner, 1965; Searle, 1974) of solution containing crushed and dissolved granules (1:5 ). A separate incubation experiment, in which the conditions of the diffusion experiment were replicated on smaller scale, was conducted to determine the moisture uptake in controlled-release products over time. At 10, 35 and 60 DAI, PCU and POCU granules were removed, and gravimetric moisture was determined using oven drying methods at 40 ∘C (Topp et al., 2007). The moisture content was incorporated into calculations to accurately determine the remaining organic and inorganic N (identified in Kjeldahl digestions of wet samples and SFA analysis of granule solution extractions), which is expressed as a percentage of CRF N applied.
2.7 Data transformation
Urea-N values from HPLC analysis were expressed as the solution concentration (mg urea-N L−1) of extractions. Mineral N values are reported in mg N per kg soil as these data were obtained from soil extracts (1:5 2M KCl), and the unit of mg N per kg soil is comparable to that used in other studies. Concentrations of NO-N were determined by calculating the difference between NOx-N and NO-N (Best, 1976; Bremner, 1965). Quantities of net nitrate nitrogen (NO3-N) were calculated by dividing the reported concentration (mg L−1) for each sampled zone by the extractant volume and multiplying it by the volume of soil in that zone. All zones were summed to calculate the net NO3-N production in each pot (mg). The proportion of total N recovered was determined by summing the total N (mg) in soil solution with that remaining in granules in CRF and CRF-blend N-fertilizer treatments. It was assumed that any N immobilization was minimal and/or consistent across treatments. This value was divided by either the soil solution or granule N content (mg) to calculate the respective proportion of total N (%). Ammonia (aqueous NH3) concentrations were calculated by applying the pKa value of the NH NH3 reaction at 25 ∘ C (Emerson et al., 1975), then determining the NH3 (molarity) from known Ka, H+ (molarity) and NH (molarity) values in soil solution, as per Eq. (1) (Erickson, 1985). Quantities of ammonia were calculated by determining the moles in solution, multiplying them by the molecular weight of NH3 and expressing them in mg NH3 L−1.
2.8 Statistical analyses
Analysis of chemical data (pH1 : 5w and EC1 : 5w) and N (urea-N, mineral N and aqueous NH3) concentrations was conducted by a three-way analysis of variance (ANOVA) for each soil with time, treatment and distance from the fertosphere as factors. Granule N retention data was analyzed by two-way ANOVA for each soil, with time and fertilizer treatment as factors. Tukey's HSD (honestly significant difference) method (P < 0.05) was used to test means for significant interaction effects identified in ANOVAs. For CRF granule N, urea-N, mineral N and aqueous NH3 datasets, statistical variation is represented in figures by standard error bars fitted to mean values at each point. Statistical differences for pH and EC are not presented within the paper as the number of interactions makes graphical presentation difficult to interpret. Where appropriate, significant effects are noted in the text, with the full statistical results available in Supplement Part B.
3.1 Soil chemical changes vary with fertilizer form and soil type
Rapid hydrolysis of concentrated urea bands results in significant increases in soil pH, EC and aqueous NH3 concentrations (Janke et al., 2021). This effect was observed in both soils treated with uncoated N fertilizers (urea and DMPP urea) and to a lesser extent in blended DMPP urea and PCU treatments (Figs. 1–3). The slow release of small amounts of urea-N to soil solution from the single-product CRF treatments (PCU, POCU) meant that these treatments demonstrated a much smaller zone of impact for ureolytic-induced increases in pH, EC and aqueous NH3, although peak changes within the fertosphere (0–10 mm zone) did not appear to be any less severe than those of granular urea (Figs. 1–3). Further, the longer duration of release of urea-N from CRFs (Fig. 4), and thus the extended period of urea hydrolysis, meant that the pH remained high within the fertosphere over the 60 d incubation in treatments containing CRFs (Fig. 1). In the Ferralsol, the effects of the chemically “hostile” zone extended as far as ca. 8–9 cm from the fertosphere in the granular urea and DMPP urea treatment, with this zone reduced by 1–2 cm for the DMPP urea PCU blends and 3–4 cm for the two CRFs (Figs. 1, 2). The higher pHBC and CEC of the Vertisol (Table 1) buffered these chemical changes more effectively and, combined with the reduced permeability of this soil, resulted in a reduced zone of impact and less severe and more rapidly reversible pH and EC increases. For the Vertisol, the effects of rapid urea hydrolysis extended as far as ca. 6 cm for urea, DMPP urea and the 2:1 DMPP urea PCU blend. The impacted zone decreased by ca. 1 and 2 cm for the 1:2 DMPP urea PCU and CRF treatments, respectively.
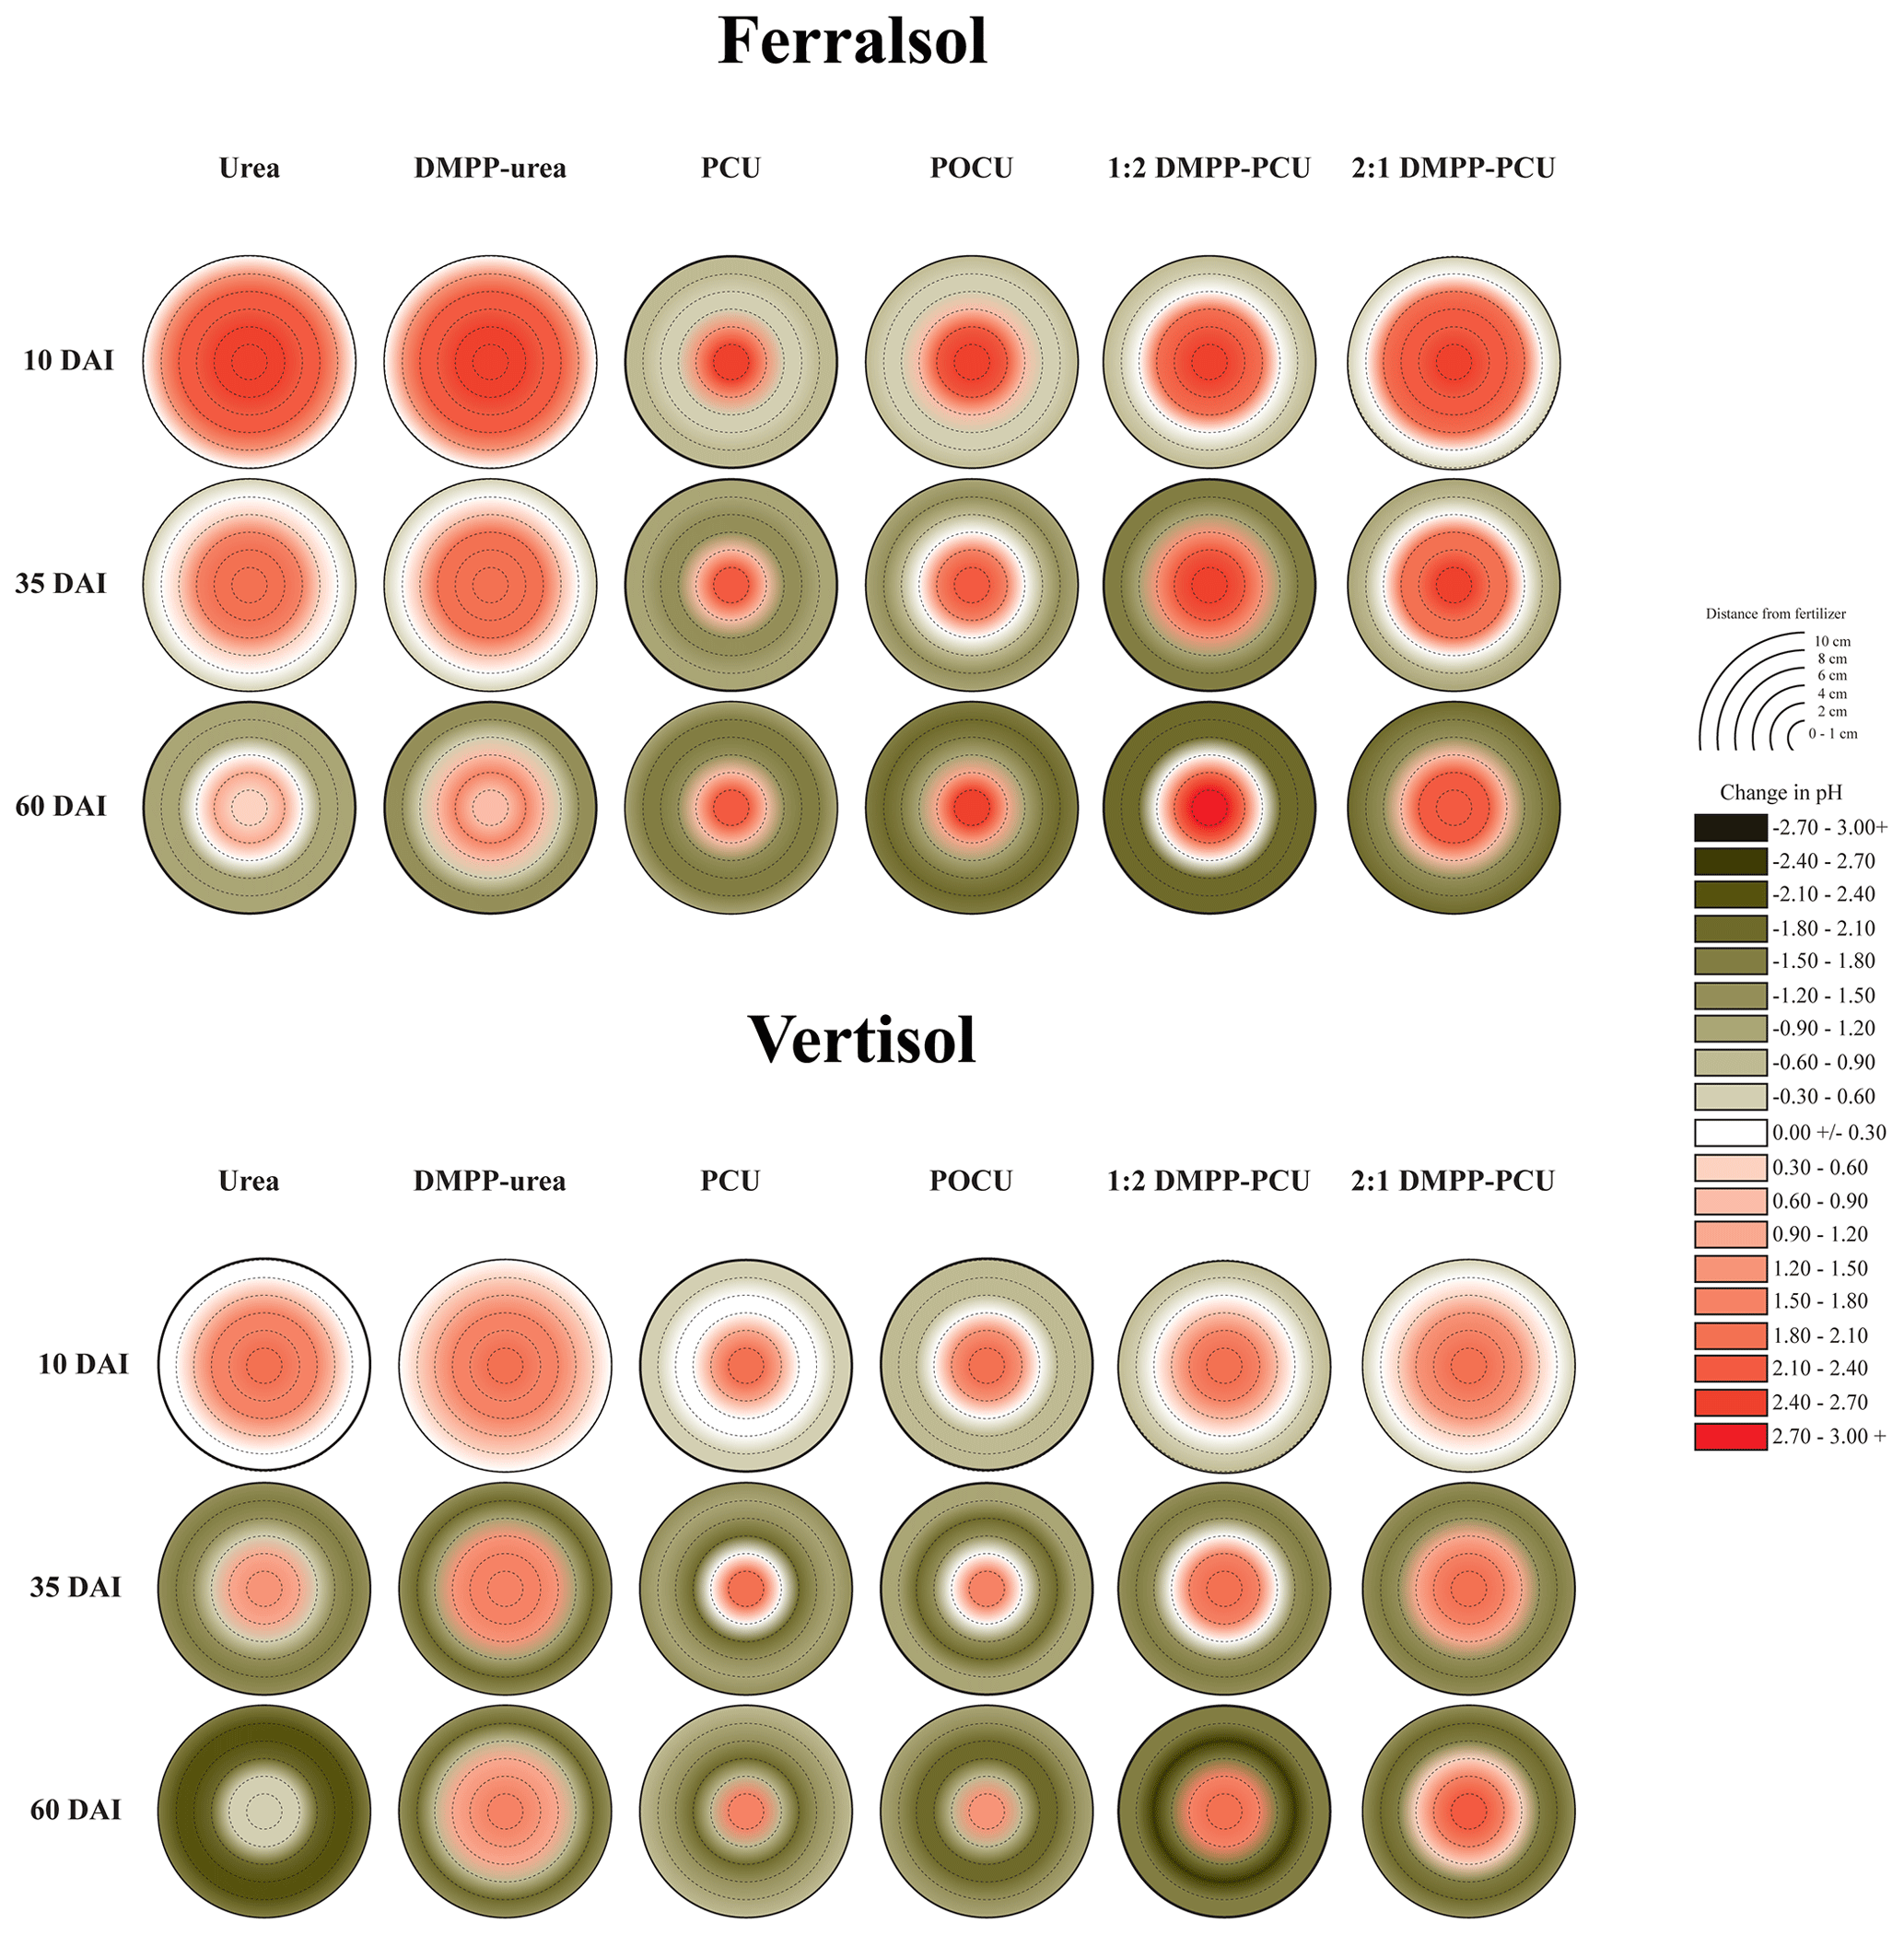
Figure 1Heat maps displaying changes (with respect to untreated soil, Table 1) in pH distribution from bands of N-fertilizer treatments in the Ferralsol and Vertisol over time (days after incubation, DAI). Initial pH values were 6.30 (Ferralsol) and 7.15 (Vertisol). Changes in the pH of untreated soil are presented in the Supplement (Part A, Table S1).

Figure 2Heat maps displaying changes (with respect to untreated soil, Table 1) in electrical conductivity (EC, dS m−1) distribution from bands of N-fertilizer treatments in the Ferralsol and Vertisol over time (days after incubation, DAI). Initial EC values were 0.07 dS m−1 (Ferralsol) and 0.35 dS m−1 (Vertisol). Changes in the EC of untreated soil are presented in the Supplement (Part A, Table S1).
Acidification of soil solution occurred outside the boundaries of the hydrolyzing zone for each combination of soil and N-fertilizer treatment (Fig. 1). There was a clear trend for higher NO3-N production in pots in which greater proportions of soil were at lower pH, suggesting nitrification was a causal factor for this acidification. However, correlation of specific zones of reduced pH and higher NO3-N concentrations was poor (data not shown), likely due to the diffusive mobility of NO3-N down high-concentration gradients from the zones in which the NO3-N was formed.
3.2 N dynamics in the Ferralsol
The high and widely distributed NH4-N concentrations arising from bands of uncoated fertilizers in the Ferralsol (i.e., urea and DMPP urea; Fig. 5) were somewhat preserved by the broad zone and persistence of modified chemical conditions which were inhibitory to nitrification (Figs. 1–3). Since DMPP distribution from fertilizer bands is limited to approximately 1–3 cm (Janke et al., 2021), and significant concentrations of NH4-N were more widely distributed (up to 7 cm from fertosphere in both urea and DMPP urea treatments), there was little effect of this inhibitor on nitrification compared to the standard urea in this soil. Compared to the pure CRFs, the greater availability of substrate-N (i.e., NH4-N in solution) combined with wider zones of modified soil chemistry meant that peak NO3-N concentrations were higher (ca. 50 mg N per kg soil) but occurred further from the fertosphere in the 1:2 DMPP urea PCU blend (3–5 cm), 2:1 DMPP urea PCU blend (5–7 cm), and the urea and DMPP urea treatments (7–9 cm). In contrast, narrower zones of soil impacted by urea hydrolysis meant that early and more rapid nitrification of released N was observed around bands of PCU (0–3 cm zone) and to a lesser extent POCU (0–5 cm zone) by 10 DAI in the Ferralsol (Fig. 5).
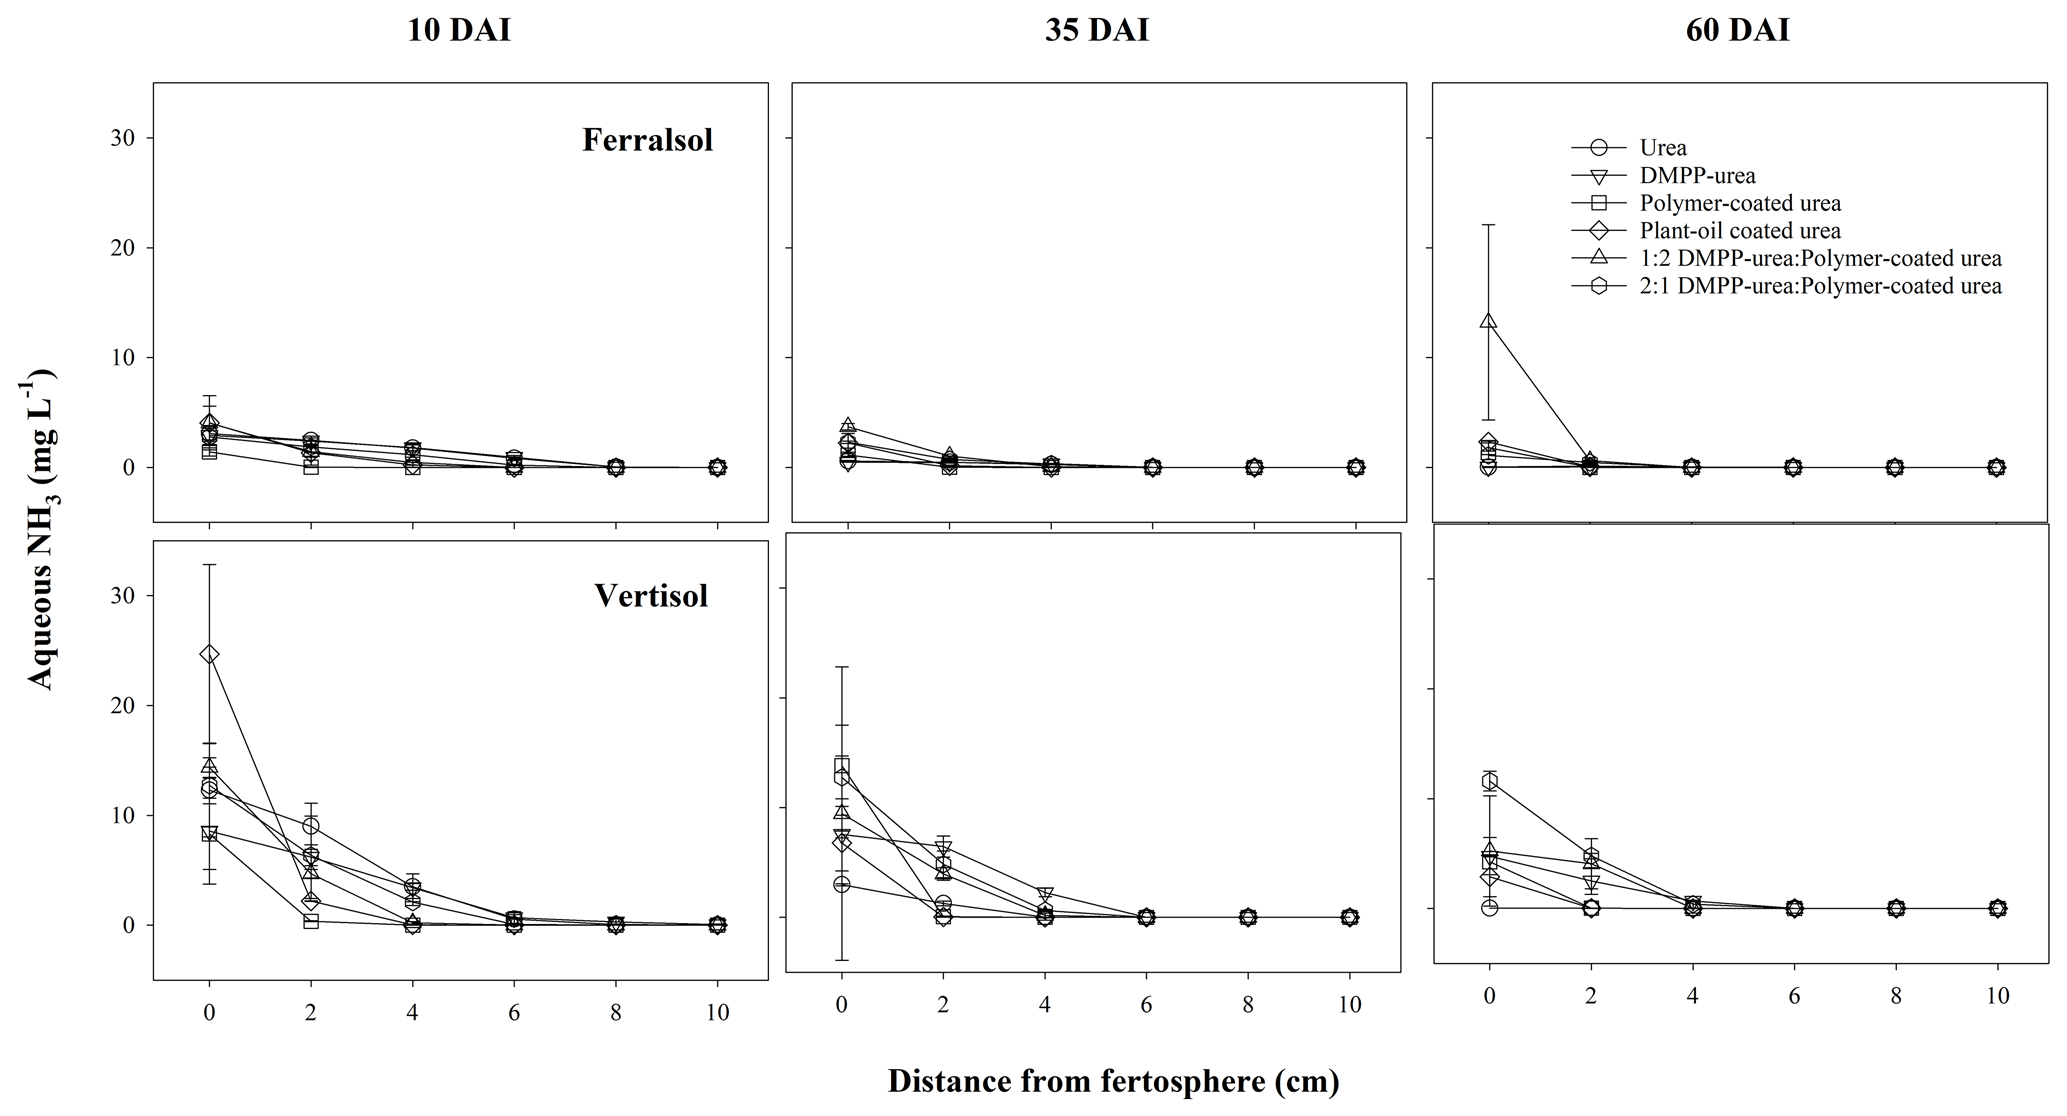
Figure 3Aqueous NH3 concentration (mg L−1) over distance and time (days after incubation, DAI) from banded N-fertilizer treatments in a Ferralsol and Vertisol. Vertical bars represent the standard error of the mean.
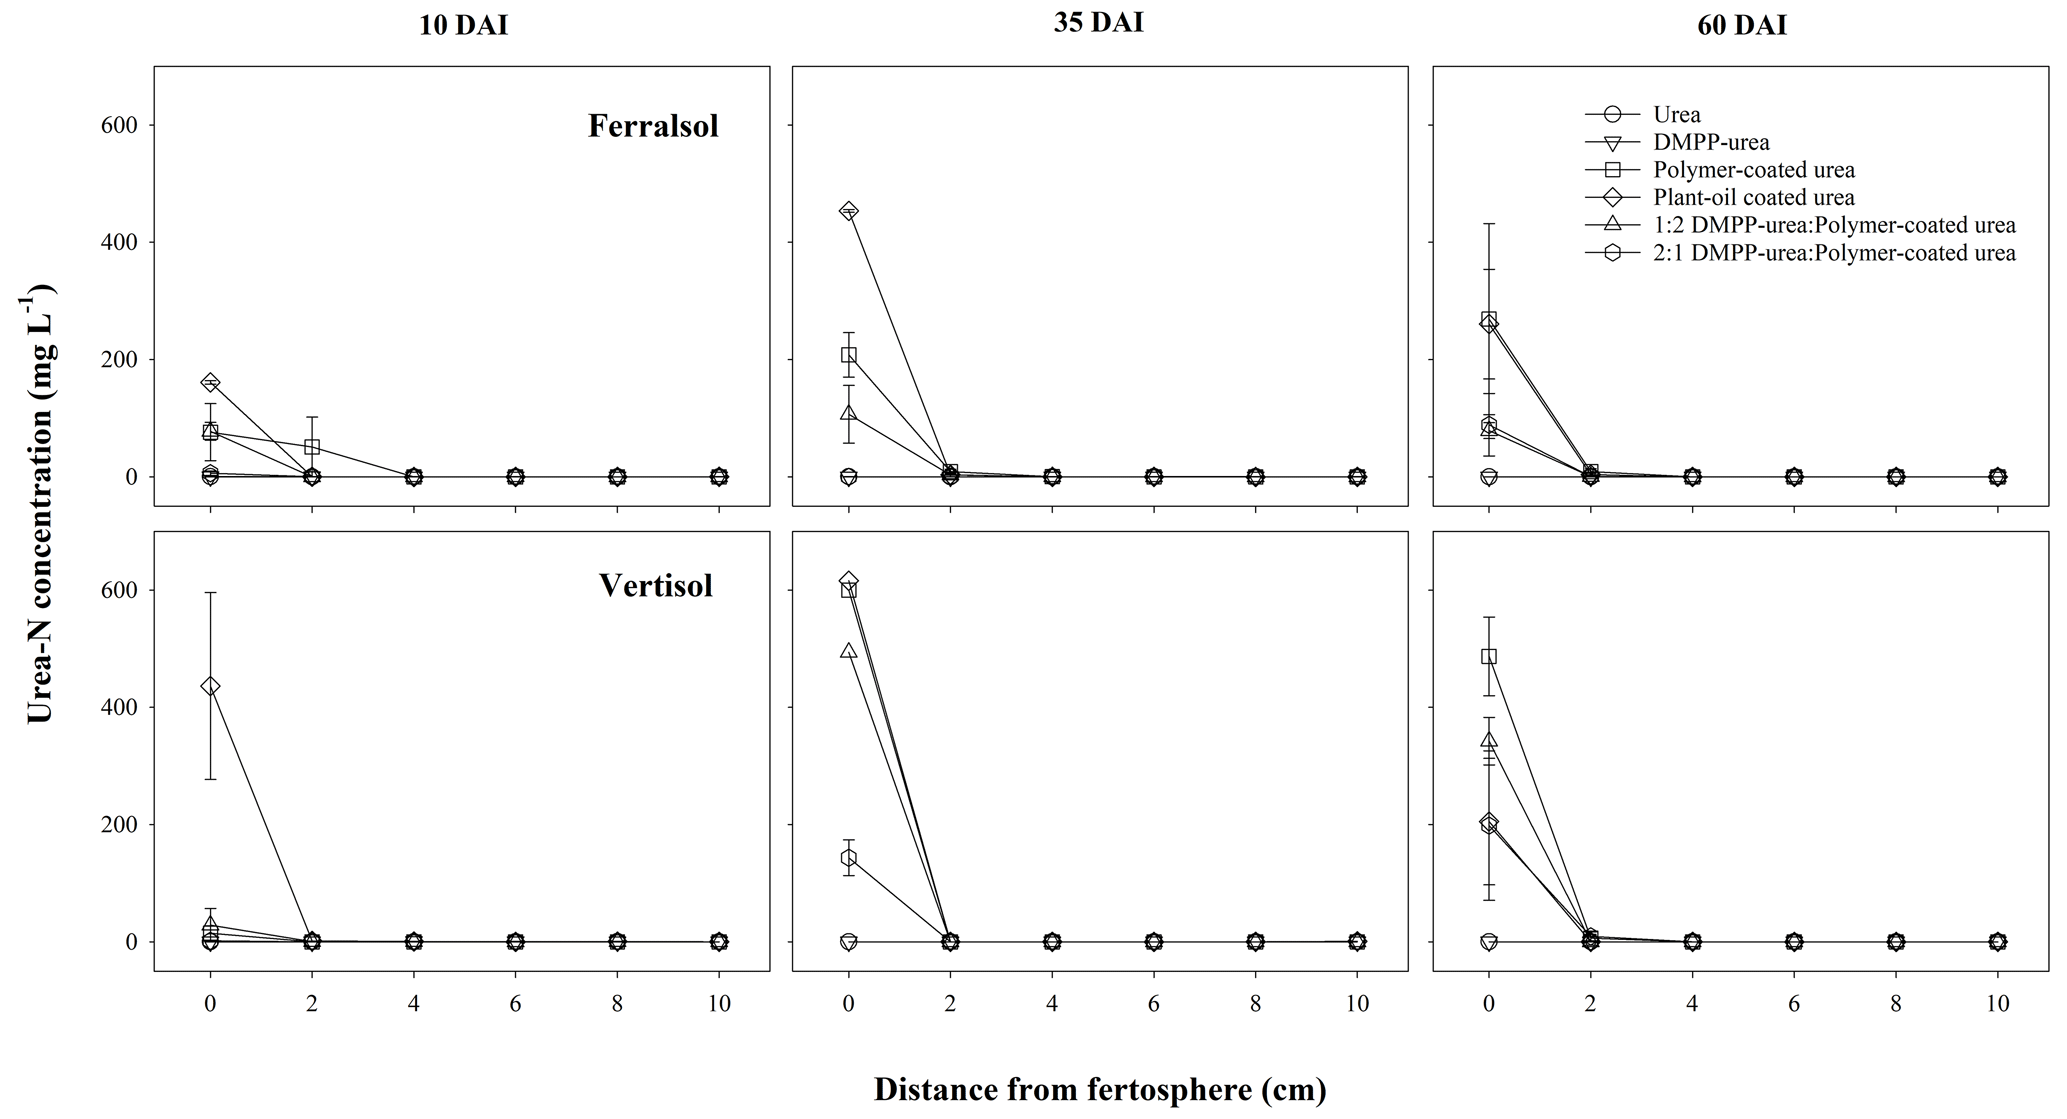
Figure 4Urea-N concentration (mg L−1) over distance and time (days after incubation, DAI) from banded N-fertilizer treatments in a Ferralsol and Vertisol. Vertical bars represent the standard error of the mean.
Despite the observed variation in NO3-N distribution between N-fertilizer treatments (Fig. 5), the differences in total NO3-N production were not large in the Ferralsol (ca. 30–70 mg N, Figs. 5, S2). Compared to standard urea, total NO3-N production was most reduced in the PCU treatment (21 %) over 35 DAI, where the 1:2 and 2:1 DMPP urea PCU blends produced total quantities of NO3-N that were 9 % and 14 % lower, respectively (Fig. S2). While the controlled-release mechanism appears to be more effective for regulating NO3-N production when compared to bands of uncoated product (i.e., urea, DMPP urea) over the short-term (10–35 DAI) in the Ferralsol, this is likely an outcome of simply less N being available for nitrification. When PCU and DMPP urea are blended, greater proportions of PCU do not appear to confer greater regulation of NO3-N formation. Rather, in the blended treatments, having a greater proportion of N as uncoated DMPP urea reduced NO3-N production (cf. greater proportions of PCU in the blend) by 5 % at 35 DAI, with this trend becoming stronger over time (9 % difference at 60 DAI). It is unclear if the inhibitory effect of a greater proportion of DMPP urea in blends was due to (i) a better synchrony of N and DMPP in and around bands (having a portion of the N derived from the coated component of this blend meant that N did not disperse as far as N from pure applications of uncoated products) or (ii) greater ureolytic-induced chemical changes (Figs. 1–3) in response to a greater proportion of N being rapidly hydrolyzed (i.e., from the uncoated DMPP urea, where N from the coated urea would usually be exposed to “benign” chemical conditions under pure PCU applications). Over time, the inhibitory effect of DMPP weakened as greater amounts of N were released from fertilizer bands containing blends with higher proportions of PCU and where the inhibitor to N ratio declined with time (i.e., progressively less of the applied N is “protected” in blends with greater proportions of PCU). By 60 DAI, treatments containing a CRF (pure or blended) demonstrated higher net NO3-N production (Figs. 5, S2) as more slowly released N became available and was nitrified.

Figure 5Concentration (mg N per kg soil) of mineral N species from N-fertilizer treatments in the Ferralsol during a 60 d incubation (DAI). Vertical bars represent the standard error of the mean.
In this study, N that could not be found in the urea or mineral N pools (Table 2) was highest for urea (39 % by 60 DAI) and DMPP urea (37 % by 60 DAI) treatments in the Ferralsol, with the majority (ca. 69 %) of this being lost within 10 DAI (Table 2). Since most of the N in these treatments remained as NH and the pH was significantly increased (Fig. 1), volatilization was likely the dominant loss pathway for this unaccounted-for N. These losses may have been an artifact of the incubation design, where only a small amount of soil covered the end (or top) of the fertilizer band. In field conditions, properly covered bands are typically not vulnerable to large volatilization losses (Rochette et al., 2013). The delayed delivery of N from the CRF N fertilizers (Fig. 5, Table 2) combined with smaller increases in the soil pH (Fig. 1) meant that the risk of volatilization was smaller in these treatments, and the proportion of unaccounted-for N was correspondingly lower (Table 2).
Table 2Mass N balance table for whole pots of N-fertilizer treatments in Ferralsol or Vertisol over time. Soil and granule N values are calculated by multiplying measured concentrations in extractions by the soil or recoverable granule mass. Unaccounted-for N (mg) is the difference in applied N from fertilizer treatments (1350 mg N per pot) and the native soil N concentration multiplied by the total volume of soil in each pot (Ferralsol = 143 mg N; Vertisol = 159 mg N) to that recovered in soil and granule extracts. The percent of unaccounted-for N is the “mg” value divided by total starting N (applied + native N) and then multiplied by 100.

3.3 N dynamics in the Vertisol
In the Vertisol, very little nitrification was observed in any N-fertilizer treatment at 10 DAI (Figs. 6, S2). This is likely an outcome of (i) minimal NH4-N diffusion to zones outside the chemically hostile conditions that formed around bands of uncoated fertilizers (i.e., urea, DMPP urea) in this high CEC soil and (ii) limited release of N from coated products. By 35 DAI, the production of NO3-N from urea and CRF bands was significantly greater than that of the other fertilizer treatments (Fig. 6). In pure CRF bands, the phenomenon was similar to that in the Ferralsol where the benign chemical conditions around the fertosphere did not inhibit nitrification of released N. In urea bands, the hostile conditions associated with urea hydrolysis had largely dissipated by 35 DAI in the Vertisol (Figs. 1–3), which meant, despite the somewhat reduced N distribution (cf. Ferralsol), higher concentrations of NH4-N were found outside the narrower zone of inhibition and were subject to rapid nitrification. In the Vertisol, this diffusion of N from the fertosphere likely occurred in response to steep concentrations gradients as aqueous NH3 (Fig. 3), since the high CEC of this soil (Table 1) would have restricted movement of N as NH4-N.
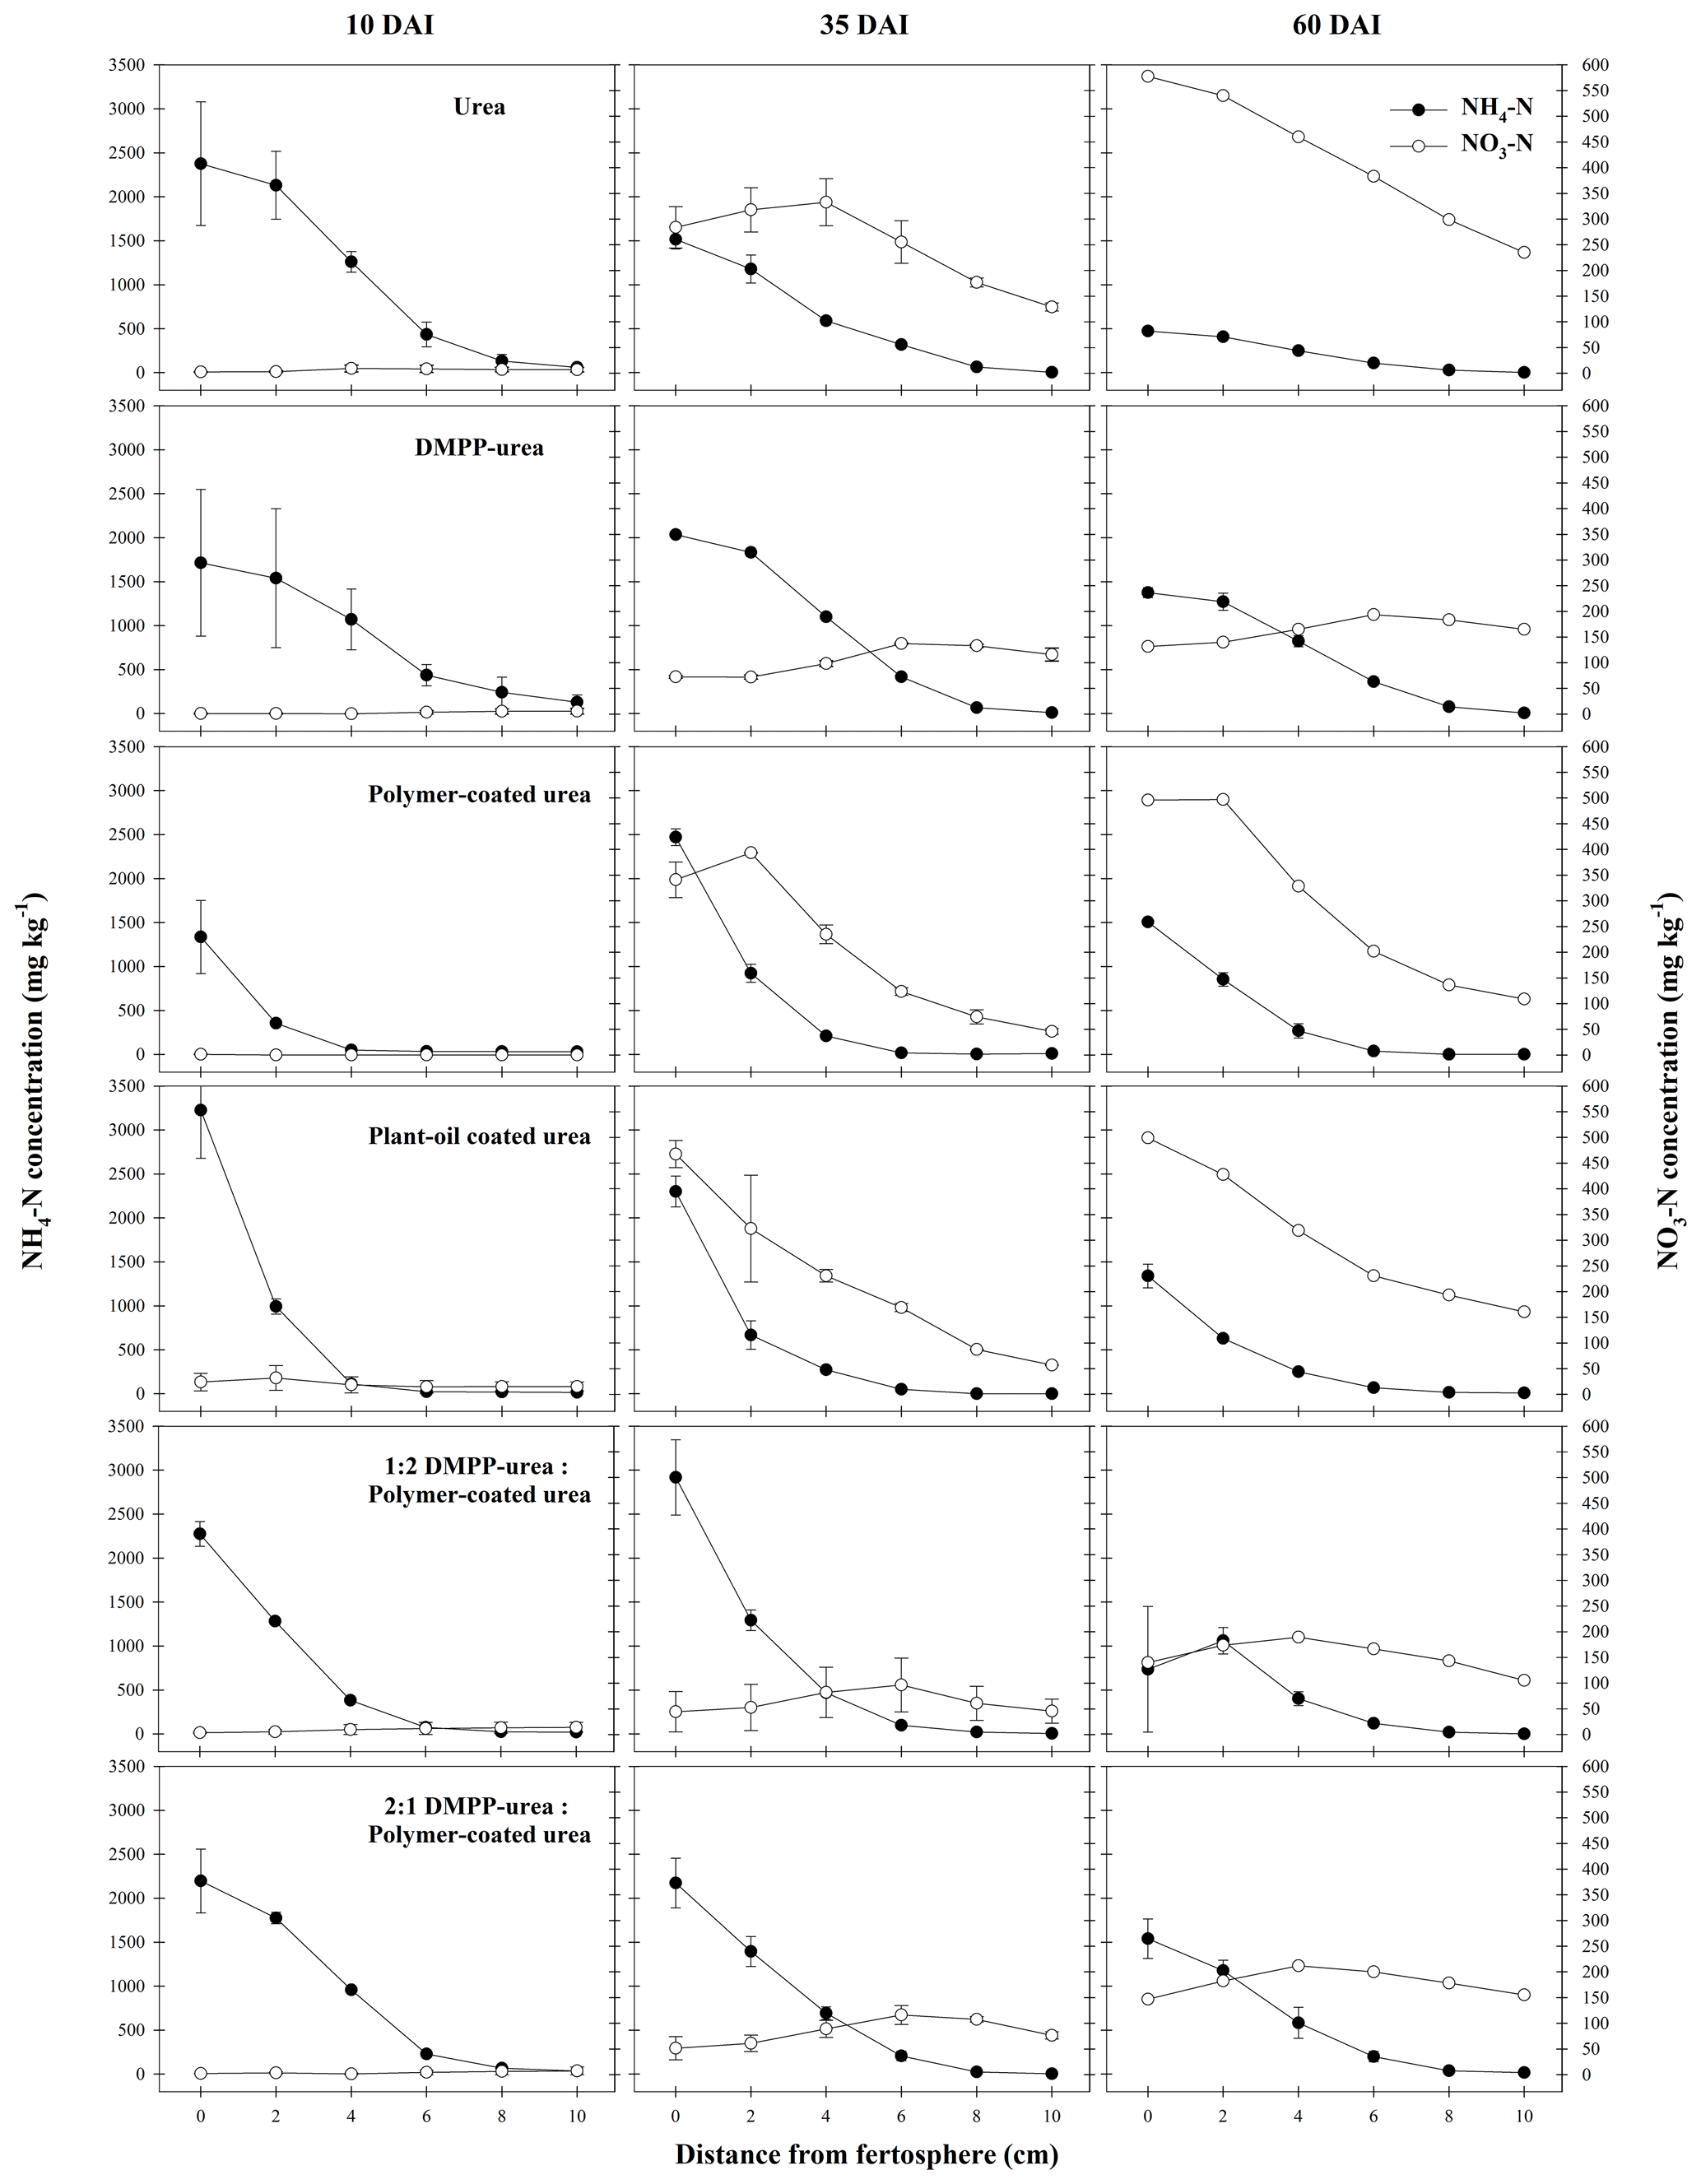
Figure 6Concentration (mg N per kg soil) of mineral N species from N-fertilizer treatments in the Vertisol during a 60 d incubation (DAI). Vertical bars represent the standard error of the mean.
Unlike the Ferralsol, NH4-N was preserved and NO3-N formation inhibited in the DMPP urea treatment when compared to urea (Fig. 6), with the variable efficacy of NI products between soil types previously reported by Janke et al. (2021). Effectively, the low permeability of the Vertisol compared to the Ferralsol (lower CEC and coarser texture) meant that the distribution of DMPP and NH4-N around DMPP urea bands was more closely aligned in the Vertisol, resulting in more complete and persistent inhibition of nitrification in this soil.
The efficacy of the DMPP urea in the Vertisol meant that the DMPP urea PCU blend treatments were also highly effective at reducing NO3-N formation in this soil. Total NO3-N production (cf. urea) was reduced by ca. 56 % for the 1:2 and 2:1 DMPP urea PCU treatments at 35 DAI and by 61 % (1:2) and 55 % (2:1) at 60 DAI (Fig. S2). This reduction was considerably greater at 35 DAI and comparable at 60 DAI to either the PCU or DMPP urea treatments (ca. 46 % and 53 % reduction at 35 and 60 DAI, respectively). The efficacy of the DMPP urea PCU blends in reducing NO3-N formation can be attributed to the inhibitory effect of DMPP on nitrification and the persistence of DMPP in the vicinity of the band while N was slowly diffusing out of PCU granules. Slightly higher rates of nitrification were recorded in 2:1 DMPP urea PCU bands (cf. 1:2 DMPP urea PCU). This was consistent with the greater proportion of non-coated fertilizer and initially higher NH4-N concentrations that contributed to more extensive diffusion of N (probably as aqueous NH3, Fig. 3) into zones beyond the distribution of DMPP. Overall, although small differences were observed, the ratio of DMPP urea to PCU in the blended treatments did not significantly affect the production of NO3-N (Fig. S2) in this soil.
The N that could not be found in the urea or mineral N pools in the Vertisol was generally slightly lower than the corresponding treatments in the Ferralsol by 60 DAI (Table 2). Exceptions occurred in the PCU and the 1:2 DMPP urea PCU treatments, where total unaccounted-for N was 10 % and 5 % higher, respectively. This corresponded to slightly lower amounts of N remaining within PCU granules applied to the Vertisol (cf. Ferralsol; Table 2) and suggests that quicker release of N from CRF products in the Vertisol may be linked to greater potential for N loss. As for the Ferralsol, the modification to soil chemistry at the start of the incubation suggests that volatilization may be a likely pathway of N loss from N-fertilizer treatments in the Vertisol (e.g., Figs. 1, 3, 6). However, N emissions as dinitrogen (N2) or nitrous oxide (N2O) may also have occurred in this soil, where the high clay content combined with a field capacity water content may have facilitated the formation of low-oxygen micro-sites that enabled denitrification. The Vertisol also has a considerable CEC (Table 1) and removal of N via sorption to soil particles cannot be discounted. Further, in both soils, consumption of N by the microbial biomass has not been accounted for. Thus, while some loss pathways may be proposed based on N transformations and soil chemistry, this study is unable to provide conclusive evidence on N loss pathways.
3.4 Effective use of EEFs varies with soil characteristics and loss conditions
These findings suggest that minimization of fertilizer-N losses arising from NO3-N (i.e., leaching, denitrification) will require different N fertilizer technology and management practices in different soil types. When fertilizers are banded at the rates used in this study (150 kg N ha−1 equivalent), there appears to be little advantage in using a CRF, DMPP urea or blends of the two (cf. urea) in soils of high permeability and poor chemical buffering (i.e., low CEC and pHBC, coarse texture) for modification of N dynamics to reduce potential N losses over a season. Similar findings were demonstrated in studies comparing N in soil solution (urea compared to DMPP urea; Janke et al., 2021) and leachate NO (urea compared to PCU; LeMonte et al., 2016) in sandy soils, with no significant differences found between urea and the EEFs. However, both CRF and stabilized products have been observed to lower gaseous N emissions in sandy soils (Awale and Chatterjee, 2017; Hyatt et al., 2010). Controlled-release products appeared to be especially effective on coarser-textured soils, predominantly through reduced NH3 volatilization which may be more problematic in these soils. In this study, the CRF treatments reported the highest recoveries of applied N in the mineral and urea N pools (72 %–82 % at 60 DAI; Table 2), possibly through reduced gaseous NH3 losses. Some benefits of these EEF treatments have been observed in sugarcane crops grown on sandy-textured soils in field trials, and these predominantly occurred in low yielding sites (Bell et al., 2021; Connellan et al., 2021) or where N loss conditions were high (Dowie et al., 2019). This suggests that in scenarios where NUE is poor due to large loss events (e.g., heavy rainfall and extensive leaching), EEFs may provide some protection against N loss, even in soils which may otherwise be poorly suited to banded EEF application.
In contrast, in soils where solute movement is restricted, and possibly where chemical changes are better buffered (i.e., high clay soils), our study indicates potential for significant reduction in losses by way of reduced NO formation with the use of banded EEFs and blends in the order of DMPP urea CRF blends (higher ratio of PCU may offer small but insignificant benefits) > DMPP urea = PCU > urea. This soil type observation is supported by field research, where a greater efficacy of banded DMPP urea PCU blends (Bell et al., 2021) or PCUs (DiBella et al., 2013) has been demonstrated in clay and/or high organic matter soils by reduced leaching losses and greater crop N uptake. However, the implications for reduced emissions from banded EEFs and blends in heavier-textured soils are less clear. In the Vertisol, there was a trend for greater N recovery as urea or mineral N over 60 DAI in soil solution (and granules, where appropriate) in the N-fertilizer treatments containing high proportions of DMPP (i.e., DMPP urea and 2:1 DMPP urea PCU; Table 2). This suggests that some small denitrification losses may have been observed around fertilizer treatments where NO readily formed (i.e., urea and PCU). Field studies on clay soils indicate that, despite mitigation of early N2O emissions from DMPP urea, PCU and blends of the two, the cumulative seasonal outcomes are variable depending on whether NO formation later in the season coincides with climatic conditions which facilitate denitrification (Schwenke and Haigh, 2019; Soon et al., 2011; Wang et al., 2016a).
Irrespective of the impact of soil characteristics on N-fertilizer dynamics, the timing of loss events plays a key role in the efficacy of the EEF product for mitigating N losses. Indeed, observations from field trials indicate the greatest benefits of EEFs appear to be in mitigating N losses that occur soon after fertilizer application (Bell et al., 2021; Connellan et al., 2021). Whilst some consideration for the wider context of these findings has been discussed in this section, the dynamics of DMPP urea, PCU and blends of the two reported in this study do not consider the impact of crop N demand. This study was designed to examine N dynamics in banded NI urea CRF mixtures in a broad context (i.e., not crop-specific), relative to granular urea and the individual EEF technologies. Therefore, while this study explores the principles underpinning the different N dynamics observed in blends of EEF technologies, the lack of plant N demand may limit the extrapolation of these findings to the broader portfolio of field trials examining the impacts of EEF technologies and blends on NUE (e.g., Bell et al., 2021; Connellan et al., 2021).
3.5 Potential for biodegradable CRF coatings
The POCU treatment demonstrated earlier and more rapid release of urea-N compared to PCU in both soils, although this was particularly obvious in the Vertisol (Fig. 4). Urea-N released from the POCU was rapidly hydrolyzed, resulting in higher NH4-N concentrations up to 35 DAI in the Ferralsol (Fig. 5) and up to 10 DAI in the Vertisol (Fig. 6). By 35 DAI, NH4-N concentrations in the 0–5 cm zone of the POCU band were slightly lower than that of PCU in the Vertisol. This suggests rapid nitrification of the NH4-N released earlier in the POCU treatment. In both soils, the nitrified N appeared to diffuse to zones further away from the band in response to established concentration gradients in both CRF treatments, with the distribution of NO3-N similar for both treatments by 60 DAI (Fig. 6).
These findings suggest that a proportion of these POCU granules may have experienced coating “failure”, whereby water penetration increased the osmotic pressure within granules, causing some of the POCU granules to rupture rather than swell. Typically, micropores within the coating of many CRFs are stretched and enlarged during the imbibement and swelling process, allowing release of the coated nutrient (now dissolved in water) from the granule (Shaviv, 2001). The hypothesis of POCU granule “failure” is consistent with the observation of a greater proportion of “burst” POCU granule coatings (i.e., POCU granules were split or contained tears) compared to PCU during granule recovery at sampling. In the Vertisol, the greater volumetric water content of this soil at field capacity (cf. Ferralsol; Table 1) may have contributed to more rapid water uptake and hence more frequent rupturing of POCU granules, resulting in the initially higher urea-N and NH4-N concentrations in this soil (Figs. 4, 6). Further experimentation is required to elucidate the exact processes contributing to the initial “failure” of some POCU granules and to determine the extent to which other mechanisms (e.g., microbial degradation, soil-granule contact) are also involved.
Despite the initial flush of N from apparently `failed' POCU granules, mineral N distribution (Figs. 5, 6) and the proportion of N remaining in granules (2 %–7 % difference, Table 2) was relatively similar for bands of POCU and PCU within each soil. This suggests that once moisture uptake by POCU granules has completed, the N release characteristics were very similar to those of PCU.
Banding NI urea and CRF technology in blends of differing proportions revealed that the NI concentration or proportion of CRF within the band did not have a significant impact on N dynamics. Both treatments slowed N release, and higher NI concentrations limited the distribution of N from these fertilizer bands (cf. urea bands). Consequently, NH4-N formed within blended bands was similarly protected against oxidization by inhibitory conditions associated with band chemistry and the NI, irrespective of blend proportions. The efficacy of N preservation in blended vs “pure” NI and CRF treatments varied depending on soil type, but in all instances the availability of N to meet potential plant demand was initially lower in treatments including the PCU. Poor synchrony of N availability to crop demand increases the risk of environmental losses, with the persistence of fertilizer N in soil once crop uptake has concluded vulnerable under wetter seasonal conditions. Importantly, soil characteristics appeared to play a large role in influencing the efficacy of EEFs and blends of NI urea CRF. When applied in concentrated fertilizer bands, these individual products and their blends are likely to be most effective in soils with lower permeability. This is due to better co-location of fertilizer N with any applied NI and inhibitory conditions associated with band chemistry.
The examined plant-oil-coated urea product initially released more N due to a higher prevalence of “burst” granules, which was likely an outcome of somewhat poorer tolerance of increased osmotic pressure within granules (cf. PCU). However, overall dynamics and proportions of N in mineral forms (NH and NO) were similar to those of PCU. This indicates that this technology may be a suitable option for managing the competing requirements of (i) a predictable N supply and (ii) avoiding the introduction of persistent polymers in the environment.
This study has provided fundamental understanding of the dynamics and efficacy of bands of blended NI urea and PCU fertilizers, relative to the individual blend constituents and to granular urea. It also offers preliminary evidence to continue with the development and testing of biodegradable CRFs as substitutes for the PCU products currently in use. Findings from this study may be utilized in agronomic decisions to reduce the impact of off-farm N losses and improve on-farm NUE.
Original data are available upon request. Data necessary for this study's findings are presented in the paper.
The supplement related to this article is available online at: https://doi.org/10.5194/soil-9-243-2023-supplement.
CKJ and MJB conceived and designed the experiments. CKJ performed the experiments and analyzed the data. CKJ and MJB prepared the manuscript, and both authors approved the submission of this paper.
The contact author has declared that neither of the authors has any competing interests.
Publisher’s note: Copernicus Publications remains neutral with regard to jurisdictional claims in published maps and institutional affiliations.
This research has been supported by the Australian Government (National Environmental Science Programme, projects 2.1.8 and 5.11, “Improved Water Quality Outcomes from On-Farm Nitrogen Management”).
This paper was edited by Steven Sleutel and reviewed by one anonymous referee.
Asher, C., Grundon, N., and Menzies, N: Getting ready to run pots experiments, in: How to unravel and solve soil fertility problems, edited by: Asher, C., Grundon, N., and Menzies, N., ACIAR Monography, Canberra, Australia, 25–36, 2002.
Association of American Plant and Food Control Officials: Official Publication Number 65, Association of American Plant Food Control Officials, https://www.aapfco.org/publications.html (last access: 20 February 2022), 2013.
Araujo, B. R., Romao, L. P. C., Doumer, M. E., and Mangrich, A. S.: Evaluation of the interactions between chitosan and humics in medica for the controlled release of nitrogen fertilizer, J. Environ. Mang., 190, 122–131, https://doi.org/10.1016/j.jenvman.2016.12.059, 2017.
Awale, R. and Chatterjee, A.: Enhanced efficiency nitrogen products influence ammonia volatilization and nitrous oxide emission from two contrasting soils, Agron. J., 109, 47–57, https://https://doi.org/10.2134/agronj2016.04.0219, 2017.
Azam, F., Benckiser, G., Muller, C., and Ottow, J.: Release, movement and recovery of 3,4-dimethylpyrazole phosphate (DMPP), ammonium, and nitrate from stabilized nitrogen fertilizer granules in a silty clay soil under laboratory conditions, Biol. Fertil. Soil., 34, 118–125, https://doi.org/10.1007/s003740100384, 2001.
Azeem, B., KuShaari, K., Man, Z. B., Basit, A., and Thanh, T. H.: Review on materials and method to produce controlled release coated urea fertilizer, J. Control. Release, 181, 11–21, https://doi.org/10.1016/j.jconrel.2014.02.020, 2014.
Bell, M. J., Webster, A. J., Skocaj, D. M., Masters, B., Dowie, J., Hill, N., and Moody, P. W.: Improved Water Quality Outcomes from On-Farm Nitrogen Management, Reef and Rainforest Research Centre Limited, Cairns, Report to the National Environmental Science Program, 155 pp., 2021.
Benckiser, G., Christ, E., Herbet, T., Weiske, A., Blome, J., and Hardt, M.: The nitrification inhibitor 3,4-dimethylpyrazole-phosphat (DMPP) – quantification and effects on soil metabolism, Plant Soil, 371, 257–266, 2013.
Best, E.: An automated method for the determination of nitrate nitrogen in soil extracts, Queensland J. Agr. Anim. Sci., 33, 161–166, 1976.
Brech, F.: Determination of selected elements in plant tissue digests, ICP Information Newsletter, 1, 195 pp., 1976.
Bremner, J.: Inorganic forms of nitrogen, in: Methods of Soil Analysis, Part 2. Chemical and Microbiological Properties, Agronomy Monograph 9.2, edited by: Black, C., American Society of Agronomy, Soil Science Society of America, Madison, Wisconsin, 1179–1237, 1965.
Byrnes, B. and Freney, J.: Recent developments of the use of urease inhibitors in the tropics, Fert. Res., 42, 251–259, https://doi.org/10.1007/BF00750519, 1995.
Chen, Q., Qi, L., Bi, Q., Dai, P., sun, D., Sun, C., Lui, W., Lu, L., Ni, W., and Lin, X.: Comparative effects of 3,4-dimethylpyrazole phosphate (DMPP) and dicyandiamide (DCD) on ammonia-oxidizing bacteria and archaea in vegetable soil, Appl. Microbiol. Biotechnol., 99, 333–341, https://doi.org/10.1007/s00253-014-6026-7, 2015.
Connellan, J., Thompson, M., Salter, B., Panitz, J., and Olayemi, M.: Cane farmer trials of enhanced efficiency fertiliser in the catchments of the Great Barrier Reef, Sugar Research Australia, Queensland, Australia, Final report 2016/807, 59 pp., 2021.
Creason, G., Schmitt, M., Douglass, E., and Henderickson, L.: Urease inhibtory activity associated with N-(n-butyl)thiophosphoric triamide is due to formation of its oxon analog, Soil Biol. Biochem., 22, 209–211, https://doi.org/10.1016/0038-0717(90)90088-H, 1990.
Dang, Y. P., Martinez, C., Smith, D., Rowlings, D., Grace, P., and Bell, M.: Maize production and nitrous oxide emissions from enhanced efficiency nitrogen fertilizers, Nutr. Cycl. Agroecosys., 121, 191–208, https://doi.org/10.1007/s10705-021-10171-4, 2021.
Dhakal, D. and Nelson, K. A.: Polymer-coated urea rates, timings, and ratio combinations with non-coated urea for corn, J. Plant Nutr., 42, 1072–1085, https://doi.org/10.1080/01904167.2019.1589498, 2019.
DiBella, L., Stacey, S., Benson, A., Royle, A., and Holberger, G.: An assessment of controlled release fertiliser in the Herbert cane growing region, Proceedings from the Australian Society of Sugar Cane Technologists, 35, 784–788, 2013.
Douglas, L. and Bremner, J.: Extraction and colourimetric determination of urea in soils, Soil Sci. Soc. Am. Pro., 34, 859–862, https://doi.org/10.2136/sssaj1970.03615995003400060015x, 1970.
Dowie, J., Thompson, M., and Anderson, A.: A three-year assessment of controlled-release and nitrification-inhibiting fertilisers in the Burdekin, Proceedings from the Australian Society of Sugar Cane Technologists, 41, 547–557, 2019.
Du, C., Zhou, J., and Shaviv, A.: Release characteristics of nutrient from polymer-coated compound controlled release fertilizers, J. Polym. Environ., 14, 223–230, https://doi.org/10.1007/s10924-006-0025-4, 2006.
Emerson, K., Russo, R., Lund, R., and Thurston, R.: Aqueous ammonia equilibrium calculations: Effect of pH and temperature, J. Fish. Res. Board Can., 32, 2379–2383, https://doi.org/10.1139/f75-274, 1975.
Erickson, R.: An evaluation of mathematical models for the effects of pH and temperature on ammonia toxicity to aquatic organisms, Water Res., 19, 1047–1058, https://doi.org/10.1016/0043-1354(85)90375-6, 1985.
Fu, Q., Clark, I. M., Zhu, J., Hu, H., and Hirsch, P. R.: The short-term effects of nitrification inhibitors on the abundance and expression of ammonia and nitrate oxidizers in a long-term field experiment comparing land management, Biol. Fert. Soils, 54, 163–172, https://doi.org/10.1007/s00374-017-1249-2, 2018.
Guardia, G., Marsden, K. A., Vellejo, A., Jones, D. L., and Chadwick, D. R.: Determining the influence of environment and edaphic factors on the fate of the nitrification inhibitors DCD and DMPP in soil, Sci. Total Environ., 624, 1202–1212, https://doi.org/10.1016/j.scitotenv.2017.12.250, 2018.
Guo, J., Wang, Y., Blaylock, A. D., and Chen, X.: Mixture of controlled release and normal urea to optimize nitrogen management for high-yielding (> 15 Mg ha−1) maize, Field Crop. Res., 204, 23–30, https://doi.org/10.1016/j.fcr.2016.12.021, 2017.
Halvorson, A. D. and Grosso, S. J. D.: Nitrogen placement and source effects of nitrous oxide emissions and yields of irrigated corn, J. Environ. Qual., 42, 312–322, 2013.
Hyatt, C. R., Venterea, R. T., Rosen, C. J., McNearney, M., Wilson, M. L., and Dolan, M. S.: Polymer-coated urea maintains potato yields and reduces nitrous oxide emissions in a Minnesota loamy sand, Soil Sci. Soc. Am. J., 74, 419–428, 2010.
IUSS Working Group WRB.: World Reference Base for Soil Resources 2014, update 2015, International soil classification system for naming soils and creating legends for soil maps, Worl Soil Resources Reports No. 106, FAO, Rome, ISBN: 978-92-5-108369-7, E-ISBN: 978-92-5-108370-3, 2014.
Janke, C. K., Moody, P., and Bell, M. J.: Biochemical changes and distribution of nitrogen from bands of stabilised N-fertilizers in contrasting soils, Geoderma, 382, 114770, https://doi.org/10.1016/j.geoderma.2020.114770, 2021.
Juliette, L., Hyman, M., and Arp, D.: Inhibition of ammonia oxidation in Nitrosomonas europaea by sulphur compounds: thioethers are oxidized to sulfoxides by ammonia monooxygenase, Appl. Environ. Microbiol., 59, 3718–3727, https://doi.org/10.1128/aem.59.11.3718-3727.1993, 1993.
Kingenta: Plant Oil Coated Urea 44-0-0 2M, http://en.kingenta.com/Goods/good_show/cid/28/sid/11.html, last access: 22 February 2022.
LeMonte, J. J., Jolley, V. D., Summerhays, J. S., Terry, R. E., and Hopkins, B. G.: Polymer coated urea in turfgrass maintains vigor and mitigates nitrogen's environmental impacts, PLoS One, 11, 0146761, https://doi.org/10.1371/journal.pone.0146761, 2016.
Lester, D. W., Bell, M. J., Bell, K. L., Migliorati, M. D. A., Scheer, C., Rowlings, D., and Grace, P. R.: Agronomic responses of grain sorghum to DMPP-treated urea on contrasting soil types in north-eastern Australia, Soil Res., 54, 565–571, https://doi.org/10.1071/SR15337, 2016.
Li, N., Ning, T., Cui, Z., Tian, S., Li, Z., and Lal, R.: N2O emission and yield in maize field fertilized with polymer-coated urea under subsoiling or rotary tillage, Nutr. Cycl. Agroecosys., 102, 397–410, https://doi.org/10.1007/s10705-015-9713-6, 2015.
Li, X., Li, Q., Xu, X., Su, Y., Yue, Q., and Gao, B.: Characterization, swelling and slow-release properties of a new controlled release fertilizer based on wheat straw cellulose hydrogel, J. Taiwan Inst. Chem. E., 60, 564–572, https://doi.org/10.1016/j.jtice.2015.10.027, 2016.
Martinez, C., Clarke, D., Dang, Y. P., Janke, C., and Bell, M. J.: Integrated field assessment of nitrogen release dynamics and crop recovery of band-applied controlled-release fertilisers, Plant Soil, 466, 257–273, https://doi.org/10.1007/s11104-021-05043-3, 2021.
McCarty, G.: Modes of action of nitrification inhibitors, Biol. Fert. Soil., 29, 1–9, https://doi.org/10.1007/s003740050518, 1999.
McCarty, G. and Bremmer, J.: Inhibition of nitrification in soil by acetylenic compounds, Soil Sci. Soc. Am. J., 50, 1198–1201, https://doi.org/10.2136/sssaj1986.03615995005000050021x, 1986.
McCarty, G. and Bremmer, J.: Inhibition of nitrification in soil by heterocyclic nitrogen compounds, Biol. Fert. Soil., 8 204–211, https://doi.org/10.1007/BF00266480, 1989.
McKenzie, R. H., Middleton, A. B., Pfiffner, P. G., and Bremer, E.: Evaluation of polymer-coated urea and urease inhibitor for winter wheat in Southern Alberta, Agron. J., 102, 1210–1216, https://doi.org/10.2134/agronj2009.0194, 2010.
Medina, R. and Radel, R.: Mechanisms of urease inhibition, in: Ammonia volatilization from urea fertilizers, edited by: Brock, B. and Kissel, D., National Fertilizer Development Centre, Alabama, 137–174, TVA Bulletin, Tennessee Valley Authority, ISBN: 9780870770036, 1988.
MicroSolv: Analysis of urea, fast, reproducible HLPC Method, Microsolv Technology Corporation, https://kb.mtc-usa.com/wp-content/uploads/2020/10/No-111-Analysis-of-Urea-1.pdf (last access: 19 February 2022), 2010.
Nash, P. R., Nelson, K. A., Motavalli, P. P., and Meinhardt, C. G.: Effects if polymer-coated urea application ratios and dates on wheat and subsequent double-crop soybean, Agron. J., 104, 1074–1084, https://doi.org/10.2134/agronj2011.0235, 2012.
Nauer, P. A., Fest, D. J., Vosser, L., and Arndt, S. K.: On-farm trial on the effectiveness of the nitrification inhibitor DMPP indicates no benefits under commercial Australian farming practices, Agr. Ecosyst. Environ., 253, 82–89, https://doi.org/10.1016/j.agee.2017.10.022, 2018.
Nelson, K. A., Paniagua, S. M., and Motavalli, P. P.: Effect of polymer coated urea, irrigation, and drainage on nitrogen utilization and yield of corn in a claypan soil, Agron. J., 101, 681–687, https://https://doi.org/10.2134/agronj2008.0201, 2009.
Noellsch, A. J., Motavalli, P. P., Nelson, K. A., and Kitchen, N. R.: Corn response to convention and slow-release nitrogen fertilizers across a claypan landscape, Agron. J., 101, 607–614, https://doi.org/10.2134/agronj2008.0067x, 2009.
Patil, M. D., Das, B. S., Barak, E., Bhadoria, P. B. S., and Polak, A.: Performance of polymer-coated urea in transplanted rice: effect of mixing ratio and water input on nitrogen use efficiency, Paddy Water Environ., 8, 189–198, https://doi.org/10.1007/s10333-010-0197-3, 2010.
Payne, K. M., Hancock, D. W., Cabrera, M. L., Lacy, R. C., and Kissel, D. E.: Blending polymer-coated nitrogen fertilizer improved Bermudagrass forage productions, Crop Sci., 55, 2918–2928, https://doi.org/10.2135/cropsci2014.12.0829, 2015.
Quemada, M., Baranski, M., Lange, M. N. J. N.-d., Vallejo, A., and Cooper, J. M.: Meta-analysis of strategies to control nitrate leaching in irrigated agricultural systems and their effects on crop yield, Agr. Ecosyst. Environ., 174, 1–10, https://doi.org/10.1016/j.agee.2013.04.018, 2013.
Rayment, G. and Lyons, D.: Soil Chemical methods: Australasia, CSIRO Publishing, Collingwood, Australia, ISBN: 9780643101364, 2010.
Rochette, P., Angers, D. A., Chantigny, M. H., Gasser, M., MacDonald, J. D., Pelster, D. E., and Bertrand, N.: Ammonia volatilization and nitrogen retention: how deep to incorporate urea?, J. Environ. Qual., 42, 1635–1642, 2013.
Rotondo, F., Rodrigo, C., Cantera, L., Pascua, I. D., Clavijo, L., and Dieste, A.: Lignin-based coatings for controlled P-release fertilizer consisting of granulated simple superphosphate, Holzforschung, 72, 637–643, https://doi.org/10.1515/hf-2017-0176, 2018.
Rowlings, D., Scheer, C., Liu, S., and Grace, P.: Annual nitrogen dynamics and urea fertilizer recoveries from a dairy pasture using 15N; effect of nitrification inhibitor DMPP and reduced application rates, Agr. Ecosys. Environ., 216, 216–225, https://doi.org/10.1016/j.agee.2015.09.025, 2016.
Schwenke, G. D. and Haigh, B. M.: Urea-induced nitrous oxide emissions under sub-tropical rain-fed sorghum and sunflower were nullified by DMPP, partially mitigated by polymer-coated urea, or enhanced by a blend of urea and polymer-coated urea, Soil Res., 57, 342–356, https://doi.org/10.1071/SR18285, 2019.
Searle, P.: Automated colorimetric determination of ammonium ions in soil extracts with “Technicon AutoAnalyzer II” equipment, New Zeal. J. Agr. Res., 18, 183–187, https://doi.org/10.1080/00288233.1975.10421021, 1974.
Shaviv, A.: Advances in controlled-release fertilizers, Adv. Agron., 71, 1–49, https://doi.org/10.1016/S0065-2113(01)71011-5, 2001.
Shaviv, A., Raban, S., and Zaidel, E.: Modeling Controlled Nutrient Release from Polymer Coated Fertilizers: Diffusion Release from Single Granules, Environ. Sci. Technol., 37, 2251–2256, https://doi.org/10.1021/es011462v, 2003.
Shi, X., Hu, H., Muller, C., He, J., Chen, D., and Suter, H. C.: Effects of the nitrification inhibitor 3,4-dimethylpyrazole phosphate on nitrification and nitrifiers in two contrasting agricultural soils, Appl. Environ. Microbiol., 82, 5236–5248, https://doi.org/10.1128/AEM.01031-16, 2016.
Soon, Y. K., Malhi, S. S., Lemke, R. L., Lupwayi, N. Z., and Grant, C. A.: Effect of polymer-coated urea and tillage on the dynamics of available N and nitrouse oxide emission form Gray Luvisols, Nutr. Cycl. Agroecosys., 90, 267–279, https://doi.org/10.1007/s10705-011-9428-2, 2011.
SIX EASY STEPS TOOLBOX: https://sugarresearch.com.au/growers-and-millers/nutrient-management/six-easy-steps-toolbox/, last access: 23 February 2022.
Thapa, R., Chatterjee, A., Awale, R., McGranahan, D., and Daigh, A.: Effect of enhanced efficiency fertilizers on nitrous oxide emission and crop yields: a meta-analysis, Soil Sci. Soc. Am. J., 80, 1121–1134, https://doi.org/10.2136/sssaj2016.06.0179, 2016.
Topp, G. C., Parkin, G. W., and Ferre, T. P. A.: Soil Water Content, in: Soil Sampling and Methods of Analysis, edited by: Carter, M. R. and Gregorich, E. G., CRC Press LLC, https://doi.org/10.1201/9781420005271, 2007.
Trenkel, M.: Slow-and controlled-release and stabilized fertilizers: an option of enhancing nutrient use efficiency in agriculture, International Fertilizer Industry Association (IFA), Paris, France, ISBN: 978-2-9523139-7-1, 2010.
Vadjung, C. and Saengsuwan, S.: Biodegradable IPN hydrogels based on pre-vulcanized natural rubber and cassava starch as coating membrane for environment-friendly slow-release urea fertilizers, J. Polym. Environ., 26, 3967–3980, https://doi.org/10.1007/s10924-018-1274-8, 2018.
Wang, S., Zhao, X., Xing, G., Yang, Y., Zhang, M., and Chen, H.: Improving grain yield and reducing N loss using polymer-coated urea in southeast China, Agron. Sustain. Dev., 35, 1103–1115, https://doi.org/10.1007/s13593-015-0300-7, 2015.
Wang, W., Reeves, S., Salter, B., Moody, P., and Dalal, R.: Effects of urea formulations, application rates and crop residue retention on N2O emissions from sugarcane fields in Australia, Agr. Ecosyst. Environ., 216, 137–146, https://doi.org/10.1016/j.agee.2015.09.035, 2016a.
Wang, W., Park, G., Reeves, S., Zahmel, M., Heenan, M., and Salter, B.: Nitrous oxide emission and fertiliser nitrogen efficiency in a tropical sugarcane cropping system applied with different formulations of urea, Soil Res., 54, 572–584, https://doi.org/10.1071/SR15314, 2016b.
Youden, W. J. and Steiner, E. H.: Statistical Manual of AOAC, Association of Official Analytical Chemists, Washington, DC, 1975.