the Creative Commons Attribution 4.0 License.
the Creative Commons Attribution 4.0 License.
 | 18 Jul 2022
Miniaturised visible and near-infrared spectrometers for assessing soil health indicators in mine site rehabilitation
Zefang Shen
Haylee D'Agui
Lewis Walden
Mingxi Zhang
Tsoek Man Yiu
Kingsley Dixon
Paul Nevill
Adam Cross
Mohana Matangulu
Yang Hu
Raphael A. Viscarra Rossel
Mining can cause severe disturbances to the soil, which underpins the viability of terrestrial ecosystems. Post-mining rehabilitation relies on measuring soil properties that are critical indicators of soil health. Soil visible–near-infrared (vis–NIR) spectroscopy is rapid, accurate, and cost-effective for estimating a range of soil properties. Recent advances in infrared detectors and microelectromechanical systems (MEMSs) have produced miniaturised, relatively inexpensive spectrometers. Here, we evaluate the spectra from four miniaturised visible and NIR spectrometers, some combinations, and a full-range vis–NIR spectrometer for modelling 29 soil physical, chemical, and biological properties used to assess soil health at mine sites. We collected topsoil samples from reference, undisturbed native vegetation, and stockpiles from seven mines in Western Australia. We evaluated the spectrometers' repeatability and the accuracy of spectroscopic models built with seven statistical and machine learning algorithms. The spectra from the visible spectrometer could estimate sand, silt, and clay with similar or better accuracy than the NIR spectrometers. However, the spectra from the NIR spectrometers produced better estimates of soil chemical and biological properties. By combining the miniaturised visible and NIR spectrometers, we improved the accuracy of their soil property estimates, which were similar to those from the full-range spectrometer. The miniaturised spectrometers and combinations predicted 24 of the 29 soil properties with moderate or greater accuracy (Lin's concordance correlation, ρc≥0.65). The repeatability of the NIR spectrometers was similar to that of the full-range, portable spectrometer. The miniaturised NIR spectrometers produced comparably accurate soil property estimates to the full-range portable system which is an order of magnitude more expensive, particularly when combined with the visible range sensor. Thus, the miniaturised spectrometers could form the basis for a rapid, cost-effective soil diagnostic capacity to support mine site rehabilitation and deliver significant positive economic and environmental outcomes.
- Article
(6715 KB) - Full-text XML
- BibTeX
- EndNote


Soil health underpins the viability of terrestrial ecosystems, whether natural or human-altered (e.g. agricultural, post-mining) and provides a variety of functions essential for life on Earth (Jeffrey, 2017; Timmis and Ramos, 2021). Healthy soil supports above- and below-ground biodiversity, plant growth, agricultural productivity, and a suite of ecological functions and ecosystem services (Timmis and Ramos, 2021). Consequently, returning functional soils to a site following disturbance is critical to achieving sustainable and resilient rehabilitation (e.g. reinstating a level of ecosystem productivity or functioning) or ecological restoration (e.g. assisting the recovery of an ecosystem that has been degraded, damaged, or destroyed; Gann et al., 2019). Some of the most severe disturbances to soil result from surface mining (Cooke and Johnson, 2002; Cross et al., 2017). Rehabilitation or ecological restoration is often a regulatory requirement for mining companies to undertake during mine closure (Manero et al., 2021). There is an increasing expectation that mining companies return functional, resilient, and biodiverse native ecosystems to lands where mining has occurred. However, rehabilitation or ecological restoration can be challenging on mined lands because the substrates generated by mining, such as tailings (fine particulate materials), waste rock, and salvaged topsoil (e.g. Stock et al., 2020), can be different from undisturbed homologues (Munoz-Rojas et al., 2016; Cross and Lambers, 2021; Cross et al., 2018). Different approaches to rehabilitation and ecological restoration practices such as landform design and contouring, topsoil return, seeding, and planting can significantly influence soil characteristics and other ecosystem attributes. Ensuring mined lands are placed on favourable ecological trajectories requires a fundamental understanding of the edaphic conditions of the pre-disturbance landscape and mined materials and how these conditions might influence soil properties and the capacity of soil to support ecological functioning.
Soil health, which we define as the capacity of soil to sustain biodiversity, productivity, and ecological functioning and to provide ecosystem services, represents an intricate series of interactions between important soil physical, chemical, and biological properties (Lehmann et al., 2020). Soil physical properties are essential for providing air, water, gaseous exchanges, and habitat; chemical properties for moderating soil reactions and nutrient transformations and availability; and biological properties for nutrient cycling (Lal, 2004). Soil health is fundamental to plant productivity and landscape stability (Turner et al., 2018). It is also essential to soil functioning (e.g. a medium for plant growth, habitat for soil organisms, carbon storage), which underpins most post-mining land uses, such as conservation and the reinstatement of native ecosystems to alternative uses such as agriculture. Assessing soil health by examining key physical, chemical, and biological indicators can help to guide, monitor, and evaluate ecological trajectories following restoration or rehabilitation (Rinot et al., 2019). Failure to understand and effectively manage soil health will likely result in undesirable trajectories with adverse and often cascading, long-term harmful impacts on biodiversity, ecosystem productivity, and resilience.
Assessment of soil health in post-mining rehabilitation and ecological restoration, when undertaken, remains typically an analysis of key indicators (e.g. soil nutrient concentrations, pH, electrical conductivity, cation exchange capacity) on composite samples collected from representative locations around a site. Assessment is generally undertaken periodically from the beginning of rehabilitation or ecological restoration activities to monitor changes in indicators over time, with collected soil samples analysed in a laboratory to provide average values of the soil properties. However, conventional assessment is time-consuming and expensive because laboratory analyses require elaborate methods and specialised equipment and procedures and can be prone to errors resulting from inappropriate sampling, transportation, preparation, or analysis (Viscarra Rossel and Bouma, 2016). These constraints often result in the collection of only a few samples, limiting spatial and temporal representation and the ability of sampling to characterise soil variability at a site adequately. Additionally, practitioners must wait for laboratory results to be returned following sample submission, limiting their ability to adapt management and intervention activities rapidly. Therefore, there is a need for a scientifically robust diagnostic capacity to rapidly, accurately, and inexpensively measure key soil properties that are indicators of soil health in the field.
Many soil properties that are considered key indicators of soil health, such as organic carbon, texture, water content, cation exchange capacity, pH, microbial biomass, and diversity, can be modelled with visible–near-infrared spectra (vis–NIR; 400–2500 nm) (e.g. Viscarra Rossel et al., 2006; Stenberg et al., 2010; Guerrero et al., 2010; Soriano-Disla et al., 2014; Yang et al., 2019). The modelling is possible because soil properties can be multivariately related to the wavelengths in the spectra, which contain information on the inherent composition of the soil, which comprises minerals, organic compounds, and water (Viscarra Rossel and Behrens, 2010). Thus, these spectra can describe soil qualitatively and quantitatively (Nocita et al., 2015). Broad, weak absorptions at wavelengths smaller than 1000 nm can result from chromophores and iron oxides; narrow, well-defined absorptions at wavelengths between 1400–1900 nm are due to hydroxyl bonds and water; absorptions at wavelengths around 2200 nm occur from clay minerals; and organic matter absorbs in different regions throughout the visible and NIR range. Vis–NIR spectroscopy also provides information on soil particle size and thus information on the soil matrix (Stenberg et al., 2010). Hence, in addition to soil properties, soil type and soil horizons can also be determined using vis–NIR spectra (Viscarra Rossel and Webster, 2011).
There are advantages to using the spectroscopic method. First, spectroscopic measurements are highly reproducible (Stenberg et al., 2010). Once spectroscopic models of soil properties are derived and validated, one can use them to estimate the values of those properties where those measurements are lacking and would be too expensive to make using conventional laboratory methods (Viscarra Rossel et al., 2006; Nocita et al., 2015). Spectroscopic models can be built with multivariate regressions, such as partial least-squares regression (PLSR) or machine learning methods such as support vector machines (SVMs), regression trees, or neural networks (Viscarra Rossel and Behrens, 2010) or, more recently, deep learning (e.g. Shen and Viscarra Rossel, 2021). Second, large databases of soil spectra are being developed to help meet the growing demand for soil information to evaluate and monitor soil at a range of scales (Viscarra Rossel and Webster, 2012; Orgiazzi et al., 2018; Viscarra Rossel et al., 2016; Shen et al., 2022). Third, as technologies develop, spectrometers have become cheaper, smaller, more portable, and accessible. Emerging infrared detector technologies are being used to produce miniaturised hand-held instruments that are rugged and affordable, also using microelectromechanical structures (MEMSs) (Christian and Ford, 2021; Johnson, 2015), thin-film filters, light-emitting diodes (LEDs), fibre optics, and high-performance detector arrays (Coates, 2014). As a result, there is growing interest in using miniaturised spectrometers for characterising soil properties (Tang et al., 2020; Ng et al., 2020; Sharififar et al., 2019). They provide a unique opportunity to develop a portable and cost-efficient soil health diagnostic capacity for mine site rehabilitation. However, these spectrometers have narrower spectral ranges and lower resolutions than portable or research-grade spectrometers, which are more commonly used to model soil properties (Stenberg et al., 2010; Soriano-Disla et al., 2014). A narrower spectral range and reduced spectral resolution might detriment a miniaturised spectrometer's capacity for estimating soil properties and developing a cost-effective soil health diagnostic solution. Therefore, we must thoroughly assess these spectrometers, the repeatability of their measurements, and their capacity to accurately estimate a wide range of soil physical, chemical, and biological properties deemed to be indicators of soil health. We have not found any published reports on such assessments in the literature.
Thus the objective of our study was to assess various commercially available miniaturised visible and NIR spectrometers (both independently and in combination) and one portable research-grade vis–NIR spectrometer for the capacity to estimate a wide range of soil chemical, physical, and biological properties typically used to assess soil health in Australian mine site soil rehabilitation. Specifically, our aims were to do the following:
-
evaluate the repeatability of the spectroscopic measurements with each spectrometer;
-
evaluate the modelling of 29 soil physical, chemical, and biological properties using the spectra from each spectrometer and combinations with seven statistical and machine learning algorithms;
-
quantify the accuracy of the model estimates and the effect of repeatability on the estimates; and
-
derive an overall score for each spectrometer and combinations, which accounts for their accuracy and repeatability.
The many soil properties and spectrometers and the assessment of repeatability and accuracy from modelling with various algorithms provide a comprehensive evaluation of spectroscopy for cost-effective mine site soil rehabilitation.
Seven mine sites in Western Australia were selected as study sites, representing a range of climatic conditions, soil types, vegetation assemblages, and commodity types (Table 1, Fig. 1).
Table 1Resource type mined, predominant soil type, dominant vegetation type, and climate type for each of the mine sites included in the study. Note that Mine F has requested non-disclosure of resource mined.
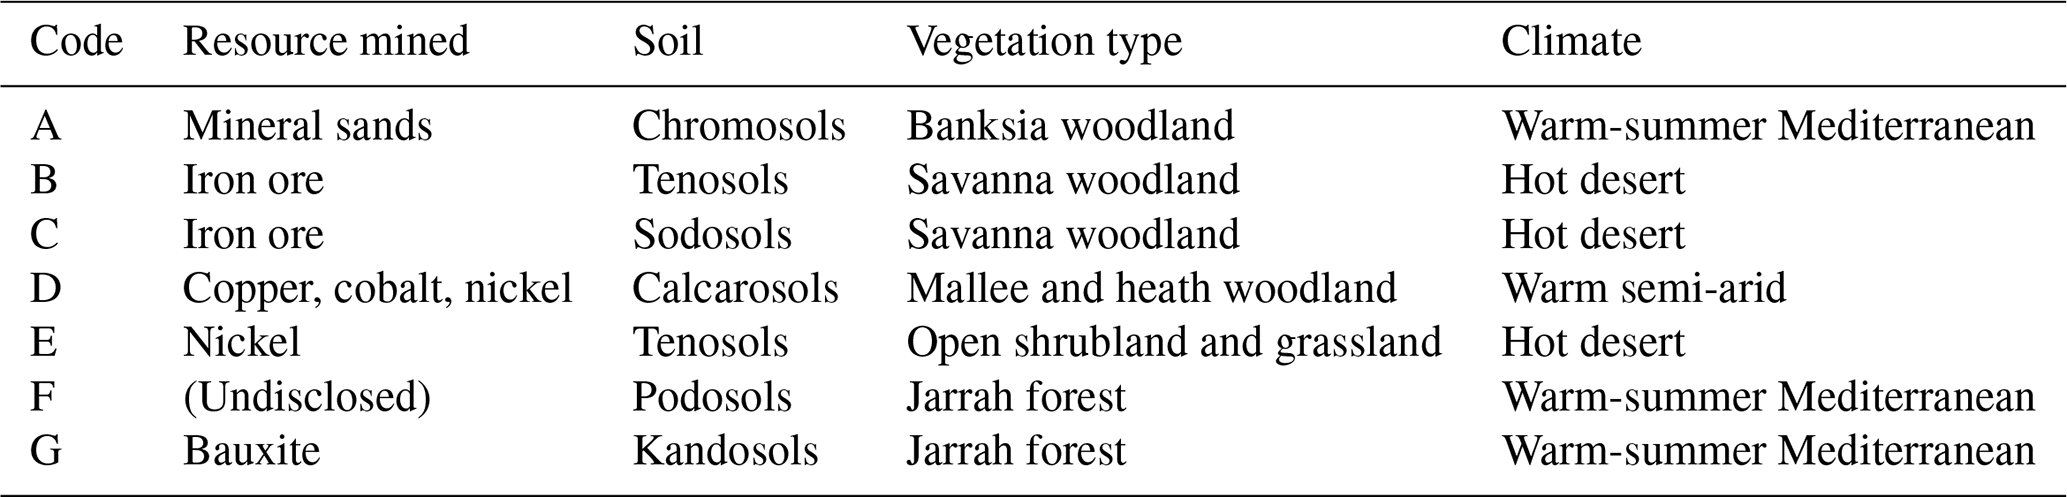
Sites included a mineral sands mine (Fig. 1a), two iron ore mines (Fig. 1b, c), a copper–cobalt–nickel mine (Fig. 1d), a nickel mine (Fig. 1e), a bauxite mine (Fig. 1g), and a mine for which the commodity will remain undisclosed (anonymity requested; Fig. 1f). The soil types are orders from the Australian Soil Classification (Isbell, 2002).
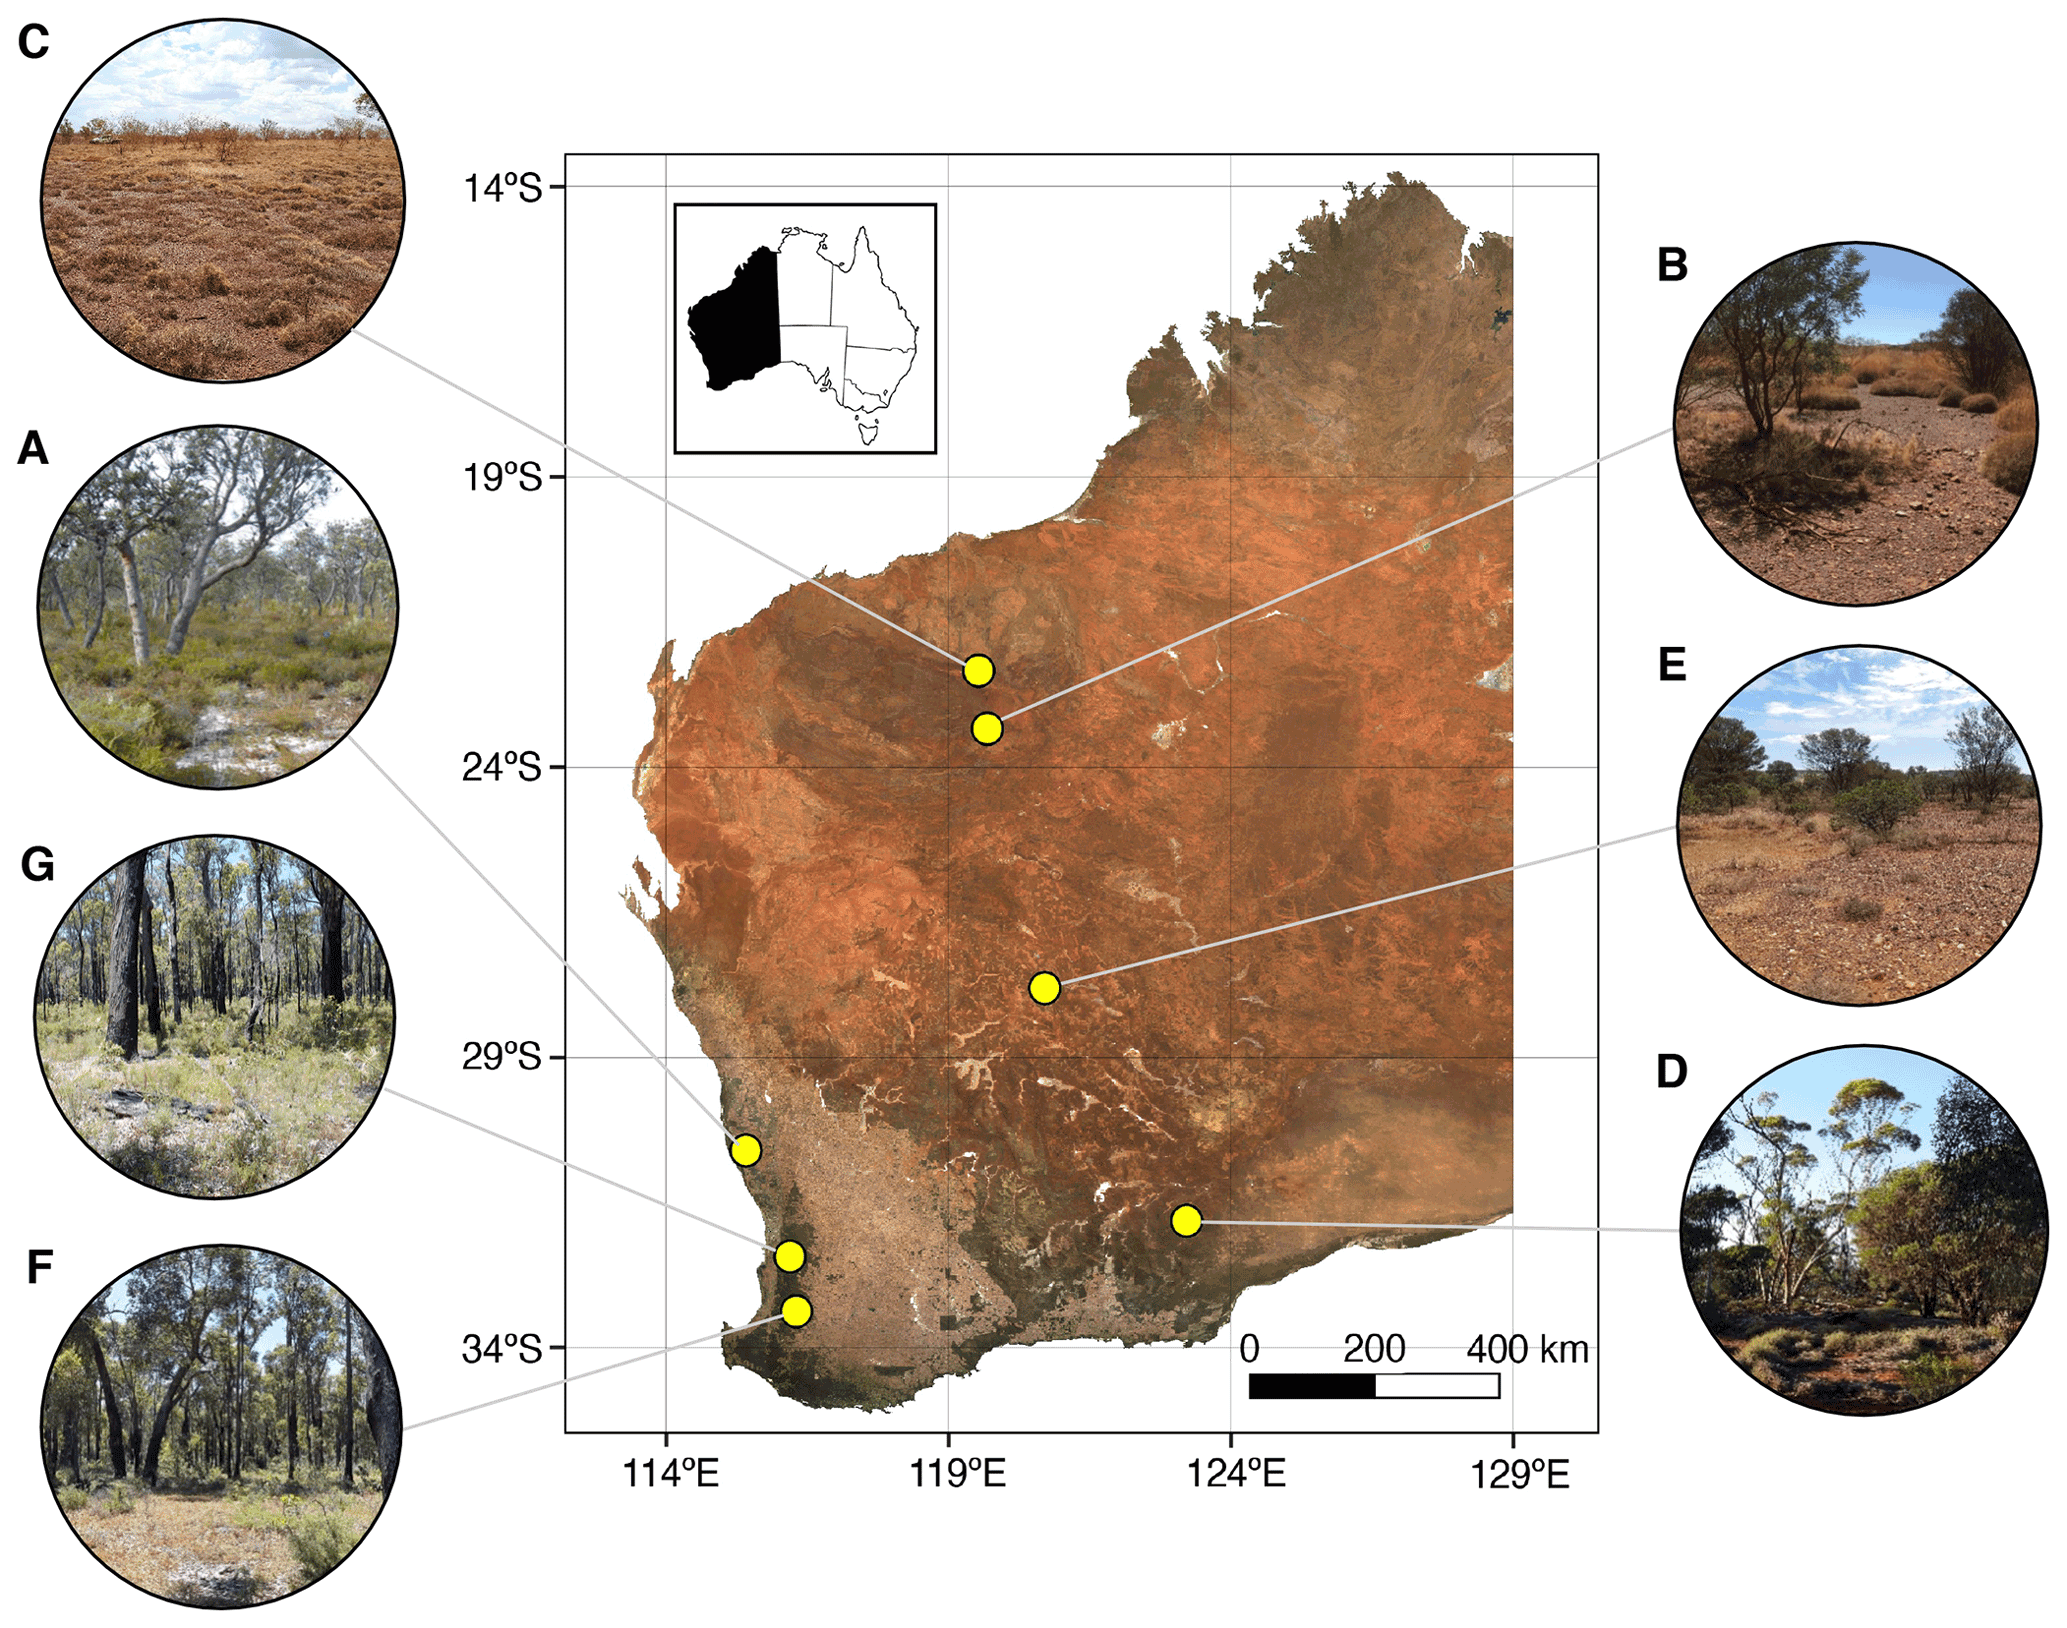
Figure 1Location of mine sites within Western Australia from which soil samples were collected for spectroscopic analysis. Soils were collected from a variety of vegetation types in different climatic regions, including from (a) a mineral sands mine within banksia woodland in a warm-summer Mediterranean region, (b, c) two iron ore mines within savanna woodland in the hot desert region, (d) a copper–cobalt–nickel mine within mallee woodland in the warm semi-arid region, (e) a nickel mine within open shrubland and grassland in the hot desert region, and (f, g) a bauxite mine and another undisclosed commodity mine both within jarrah forest in the warm-summer Mediterranean region. Inset: location of Western Australia within Australia.
2.1 Sampling design
We designed the sampling effort to cover a broad range of mining contexts. We sampled top-layer stockpiled and undisturbed reference soil samples from seven mines with differing soil types, climates, vegetation assemblages, and commodity. At each of the seven mine sites, three plots were established in undisturbed native vegetation (hereafter referred to as “reference plots”) and four in topsoil stockpiles (i.e. salvaged natural topsoil stockpiled for later re-spreading) of varying age (ages range from 3 months to 29 years) in summer 2018/2019. Five 5 m × 5 m subplots were established at each reference and stockpile plot, with five replicate soil samples collected at random from the top 0–20 cm soil layer in each subplot using a 5 cm diameter soil auger. At the youngest stockpile at each mine, five additional samples were taken from the 50–70 cm depth, which correspond roughly to the top layer of the original soil before stockpiling. The five soil samples were bulked and homogenised to produce one composite sample per subplot. Sterile nitrile gloves were worn when collecting soils, sampling equipment was sterilised with a bleach solution between all samples, and gloves were changed between plots to prevent cross-contamination. Subsamples were taken from each composite sample and stored at −20 ∘C until DNA could be extracted (see below), while the remainder of the composites were dried in an oven at 40 ∘C for 48 h before being sieved (2 mm gauge). Subsamples of the dried, composite soil were reserved for chemical analysis, assessment of carbon dioxide production, and analyses of soil microbial community composition. In total, 280 soil samples were collected from the seven mine sites. (i.e. At each mine there were three reference plots, four stockpile plots, and one young stockpile plot. Each plot consisted of five subplots, and one composite sample was collected from each subplot.)
2.2 Conventional soil analyses
To provide comparison data for the 29 soil chemical, physical, and biological soil properties to be assessed using spectroscopic methods, soil organic carbon content (Walkley and Black, 1934), potassium and phosphorus content (Colwell, 1965), pH (in a 1:5 soil to 0.01 M CaCl2 and H2O), electrical conductivity, sulfur, ammonium nitrogen, nitrate nitrogen, boron, trace elements (DTPA; copper, zinc, manganese, iron), and exchangeable cations (calcium, magnesium, sodium, potassium, aluminium) were determined for all composite samples using analytical chemistry methods sensu (Rayment and Lyons, 2010). Soil particle size (percentage sand, silt, clay) and bulk density (BD) were also assessed for each soil sample (Rai et al., 2017). Microbial activity of each soil sample was assessed using the Solvita 1-day CO2 test (Haney et al., 2008; Munoz-Rojas et al., 2016). The test was conducted as per the manufacturer’s instructions (2019 SOP; Woods End Laboratories Inc., 2018–2019); briefly, 30 cm3 of dried soil was re-wet with 9 mL of water and placed in a sealed container with a Solvita CO2 probe for 24 h, after which a digital colour reader (for use with the CO2 test; Solvita, Woods End Laboratories, USA) was used to measure the volume of carbon dioxide produced.
Soil microbial community composition was determined by extracting DNA from 250 mg of homogenised soil samples (DNeasy PowerSoil HTP 96 Kit; Qiagen, Germany). DNA quality and level of inhibition were checked through quantitative PCR (qPCR), with negative PCR controls included (Murray et al., 2015). Primer sets used targeted the V4 16S rRNA region for bacteria (Turner et al., 1999; Caporaso et al., 2011) and the Internal Transcribed Spacer 2 for fungi (Ihrmark et al., 2012; White et al., 1990). Single fusion sequencing (see the Supplement “DNA Sequencing and Bioinformatics Methodology”) was performed at the Trace and Environmental DNA laboratory, Curtin University (Bentley, WA) on the MiSeq platform (Illumina, USA) as per van der Heyde et al. (2021). Sequences were de-multiplexed and quality-filtered, and error rates were estimated and de-replicated to leave amplicon sequence variants. Taxonomy was assigned based on reference databases (SILVA (Quast et al., 2013) for bacteria and UNITE8.2 (Nilsson et al., 2019) for fungi). Alpha diversity and richness of fungal and bacterial taxa were calculated from sequence data using the Shannon index (Wagner et al., 2018).
The statistical distributions of electrical conductivity, organic C, total N, K (Colwell), B, S, Cu, Fe, Mn, exchangeable Mg and Na, ammonium nitrogen, nitrate nitrogen, and CO2 exhibited strong positive skews and were thus transformed using logarithms to approximate normal distributions prior to use in spectroscopic modelling.
2.3 Soil spectroscopy
For spectroscopic analysis, the ≤2 mm sieved composite subsamples were each mixed and then placed in a Petri dish. Diffuse reflectance spectra were recorded using five spectrometers with different spectral ranges, resolutions, dimensions, and costs (Table 2). We measured the soils following protocols described in Viscarra Rossel et al. (2016) (Appendix B). The spectrometers were switched on an hour before measurements, and the control software of each instrument was set up to record (and average) 30 readings per soil sample measurement and 50 readings per calibration measurement. Calibration was performed with a Halon white reference (Spectralon®) and dark internal reference. The spectrometers were recalibrated every 10 measures. We performed the spectroscopic measurements of the soil samples in two separate rounds (i.e. in replicate), by the same analyst and under the same laboratory conditions.
Table 2Spectral range, resolution, price, weight, and dimensions of miniaturised and portable spectrometers used in this study.
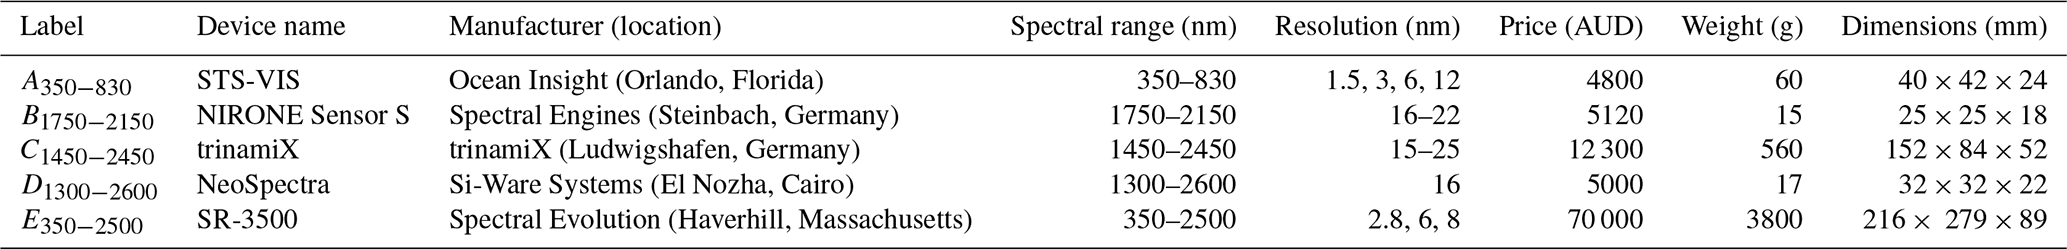
The reflectance (R) spectra of the soil samples recorded with each instrument were transformed to apparent absorbance using log and interpolated to 10 nm intervals to attain a consistent wavelength interval. Since some of the miniaturised spectrometers measured narrow and specific spectral ranges, we combined spectrometers A350−830 with B1750−2150, A350−830 with C1450−2450, and A350−830 with D1300−2600 to cover more of the vis–NIR range.
2.4 Spectroscopic modelling
Given the large number of soil properties, spectrometers, and algorithms and the assessment of both spectrometer repeatability and model accuracy, the experiments became extremely complex and computationally intensive. To improve the computational efficiency of the study, we aggregated the data from the 280 subplots into 56 plots by averaging the spectra and soil properties (Fig. 2). Subplot samples were similar, and we assumed that aggregating them would not seriously affect the variability in the data and the modelling. Conclusions drawn from the results of the 56 plot data were compared to results from the 280 subplot data but using only the best spectrometers and algorithm (see below, Sect. 2.4.4 “Assessment on data from subplots”).
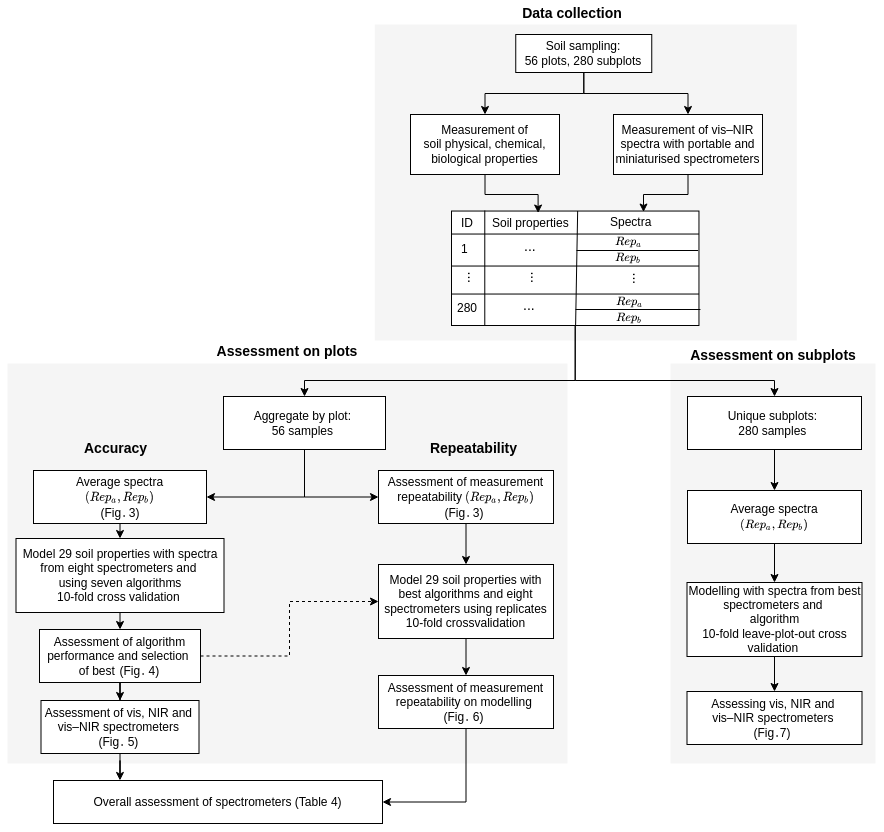
Figure 2Study design for data collection and spectroscopic modelling. Data collection describes the measurement of soil properties and collection of spectra. Assessment on plots shows the spectroscopic modelling for the assessment of algorithms and spectrometers. Assessment on subplots validates the modelling with the best algorithm and spectrometers on subplot data.
2.4.1 Assessment of algorithms with data from plots
Multivariate modelling is fundamental for assessing the spectrometers. This type of modelling, and particularly machine learning, is largely dependent on the data set used, and there is not a single “best” method for all applications. Using a single algorithm could lead to inaccurate conclusions. To prevent both over- or understating the capability of these spectrometers, we used seven statistical and machine learning algorithms that have been reported for soil spectroscopic modelling (Viscarra Rossel and Behrens, 2010; Liu et al., 2016; Yang et al., 2022; Song et al., 2021). These were partial least-squares regression (PLSR) (Wold et al., 2001), random forest (RF) (Breiman, 2001), support vector machines (SVMs) (Vapnik, 1999), Cubist (Quinlan, 1992), extreme gradient boosting (XGBoost) (Chen et al., 2015), and Gaussian process regression with linear (GPRL) and polynomial (GPRP) kernels (Rasmussen, 2003). They account for linear responses (PLSR) to more complex, non-linear responses (e.g. SVM), and the bases of the algorithms are fundamentally different: statistical (PLSR), tree-based (Cubist, RF, XGBoost), Gaussian process-based (GPRL and GPRR), and support vector methods. Viscarra Rossel and Behrens (2010) described these algorithms and their implementation in soil spectroscopic modelling.
The average spectra of the replicates from the 56 plot data were used for modelling (Fig. 2). The models were developed using 10-fold cross-validation, and their hyperparameters were optimised by minimising the root mean squared error (RMSE) with either grid search or using the differential evolution optimisation (Price et al., 2006), implemented in the R library DEoptim (Mullen et al., 2011). The optimal number of factors to use in the PLSR was determined using a grid search, implemented in the R library pls (Wehrens and Mevik, 2007). We implemented the SVM using a Gaussian radial basis function in the R library kernlab (Karatzoglou et al., 2004). Its hyperparameter C, which describes the cost or penalty on training accuracy and behaves as a regularisation parameter in the SVM, and γ, which defines the influence of training samples, were optimised using DEoptim. RF was implemented using the R library randomForest (Liaw and Wiener, 2002) and the hyperparameter mtry, which is the number of predictors randomly sampled as candidates at each decision tree split, was optimised with DEoptim. We implemented GPR using the R library kernlab and tested both linear and polynomial kernels. The linear method did not need optimising; however, for the polynomial kernel, we used DEoptim to optimise the degree of the polynomial and scale hyperparameter. The optimisation of hyperparameters in XGBoost, implemented using the R library xgboost, was also performed using DEoptim. The hyperparameters optimised were the number of iterations (nrounds), the learning rate (eta), maximum tree depth (max_depth), the regularisation parameter, which controls overfitting (γ), the number of predictors supplied to each tree (colsample_bytree), the minimum number of instances required in a child node (min_child_weight), and the number of samples (observations) supplied to a tree (subsample). Viscarra Rossel and Webster (2012) described the implementation of Cubist in spectroscopic modelling. Its hyperparameters, the number of committees (c) and neighbours (N), were optimised with DEoptim.
For each soil property, we calculated the mean, maximum, and minimum concordance correlation coefficient (Lin, 1989), ρc, of each algorithm and selected only the most accurate and consistent ones to compare the performance of the spectrometers and their combinations. The ρc is a unit-invariant coefficient that measures the difference between the measured and estimated values and their deviation from a 45∘ line of perfect agreement, evaluating both precision and bias. It ranges from −1 to 1, with 1 denoting perfect agreement. The ρc was used as the main metric for the assessments because it allows for the comparison across soil properties with different units possible. We used ρc<0.65 to denote poor agreement between the measured values of the properties and the estimates, to denote moderate agreement, for substantial agreement, and for near-perfect agreement. We removed algorithms with an average ρc below 0.65 as they performed poorly with most spectrometers and soil properties. Their removal improved the modelling and interpretability of our results and reduced redundancy in the experiments.
2.4.2 Assessment of spectrometers with data from plots
Accuracy
To compare the performance of the different spectrometers, we modelled the 29 soil properties using the five spectrometers and the three spectrometer combinations. We first selected the algorithms yielding the most consistent estimates (see above) for the soil properties and then calculated the average, minimum, and maximum ρc across the best algorithms to assess the spectrometers' and the combinations' accuracy for each property (Fig. 2).
To more explicitly quantify the estimation error with the spectrometer or spectrometer combinations that produced the best predictions (i.e. the largest ρc), we measured the RMSE, the mean error (ME), and the standard deviation of the error (SDE), which represent the inaccuracy, bias, and imprecision of the estimates, respectively. We note that the inaccuracy (RMSE) embraces both the bias (ME) and the imprecision (SDE) of the analysis so that RMSE2 = ME2 + SDE2. Because RMSE, ME, and SDE are unit-variant, they are not suitable for comparing errors across soil properties with differing units. They were used to quantify the overall inaccuracy (RMSE), the bias (ME), and the imprecision (SDE) of the estimates for each soil property.
Repeatability
We assessed the repeatability of the spectroscopic measurements by calculating the ratio of the difference between the replicates to the mean of the replicates (Fig. 2), defined as
where Repa and Repb represent the two spectroscopic replicate measurements. Repeatability values (% Difference) closer to zero are considered to represent more repeatable spectroscopic measurements.
To assess the impact of a spectrometer's repeatability on the spectroscopic modelling, we also modelled soil properties with each replicate (Repa and Repb) and calculated the absolute difference in ρc, Δρc, of the estimates (Fig. 2). We performed the spectroscopic modelling using the best algorithms (see above) and reported the mean, maximum, and minimum Δρc for each spectrometer and combination.
2.4.3 Overall assessment of the spectrometers
To assess the overall performance of each spectrometer and combination as a function of their accuracy and repeatability, we derived the index e:
where e is the overall performance index, N is the number of soil properties, , , and are the mean, maximum, and minimum ρc for the ith property from the best algorithms, and , , and are the mean, maximum, and minimum difference in ρc from the modelling with replicate measurements for the ith property with the best algorithms. The first two terms in Eq. (2) assess the overall accuracy and stability of the accuracy when the calibrations are performed using different algorithms. The third and fourth terms assess the effect of the spectrometers' repeatability on the spectroscopic modelling and its stability. All terms range from 0 to 1, and a higher value means better performance.
2.4.4 Assessment on data from subplots
To further verify results and conclusions from the 56 aggregated plot data, we also evaluated the performance of the spectrometers using data from the 280 subplots. When modelling the 280 subplot data (Fig. 2), we used only the algorithm that performed best in modelling the data from the plots. As the subplots originated from within the reference and stockpile plots, we performed the modelling and assessment using 10-fold plot-out cross-validation to prevent the risk of overfitting because soil properties and spectra from a reference or stockpile plot can be correlated.
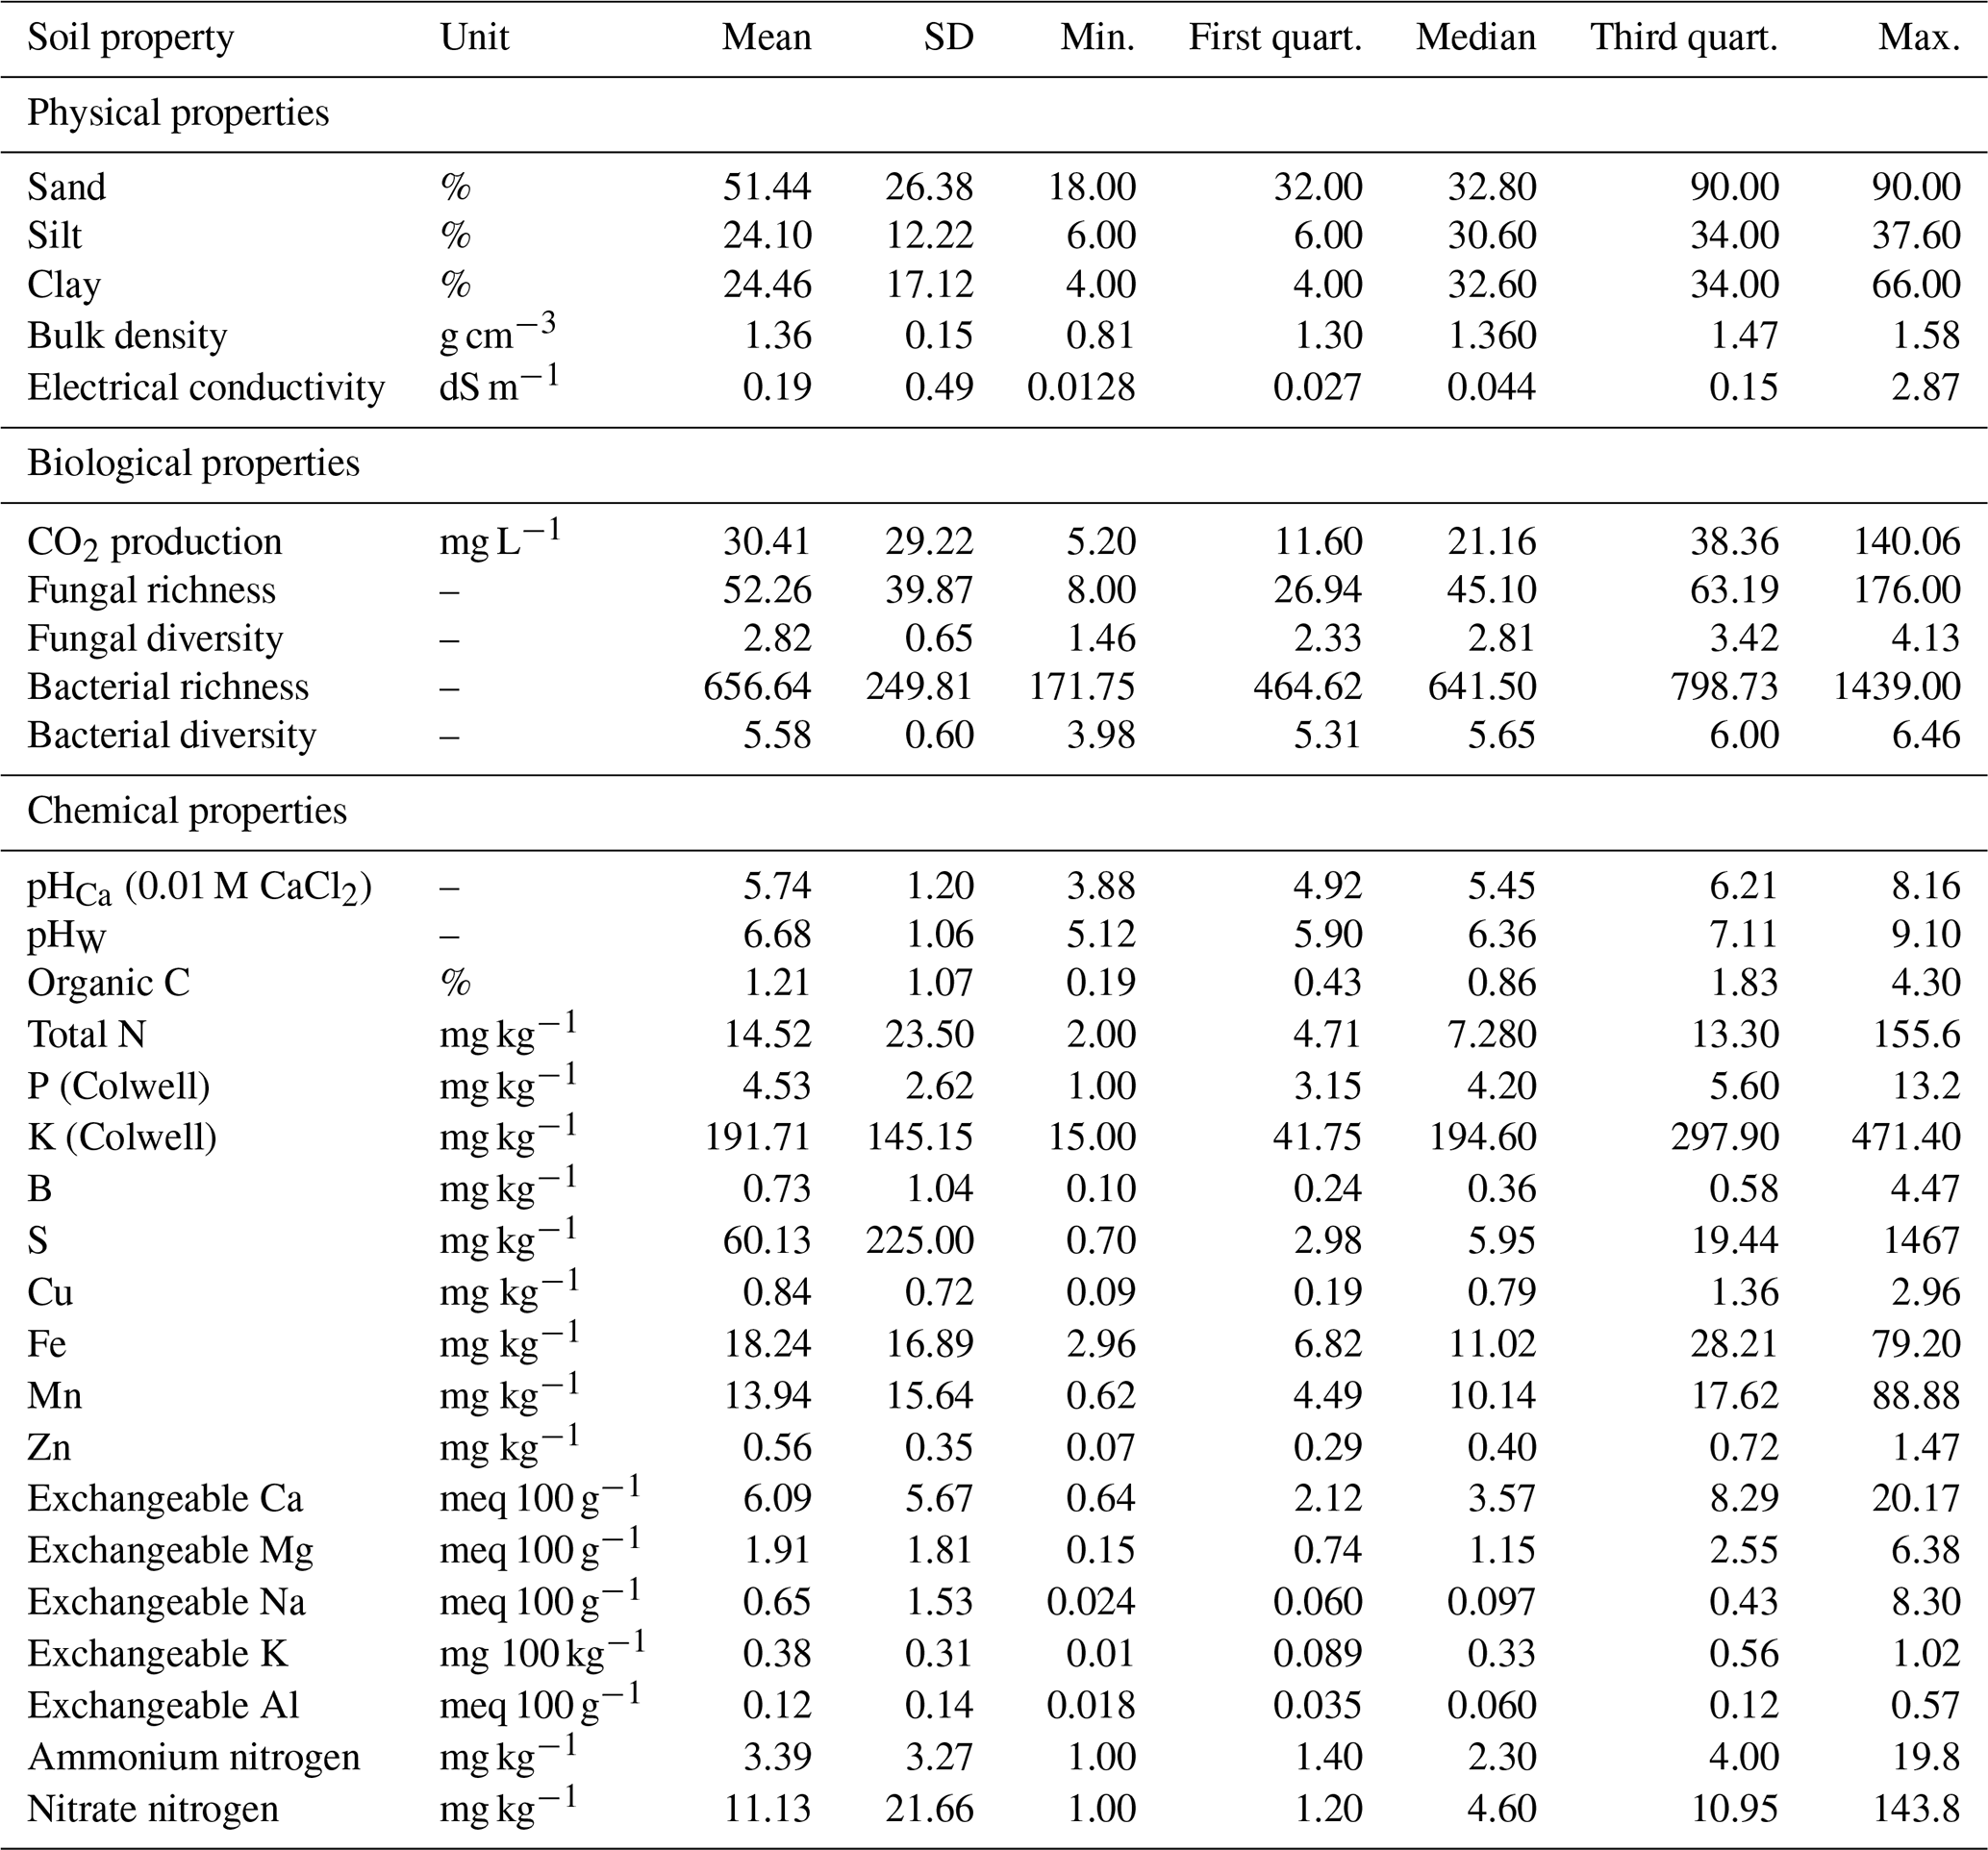
The soil samples varied markedly in their physical, chemical, and biological properties, providing a wide range of values for spectroscopic modelling. The soil samples were highly variable, with wide ranges in their physicochemical and biological properties. They represented soils that were in a good, healthy condition (reference sites) to soils that were degraded (stockpiles). For example, clay content ranged from 4 %–66 %, organic C from 0.19 %–4.3 %, pH 5.12 to 9.1, and microbial activity (CO2 flux) from 5–140 mg L−1 (Table 3).
Table 3Summary of the physical (n=5), chemical (n=19), and biological (n=5) properties (mean, SD, minimum, maximum, median, and first and third quartiles) of reference soil and stockpiled topsoil sampled from seven mine sites in Western Australia, as determined by conventional analytical methods.
The reflectance spectra from the different spectrometers and their combinations show features that are characteristic of soil spectra. For example, the feature near 1900 nm (Fig. 3) is due to combination and overtone vibrations of molecular water contained within soil minerals (Viscarra Rossel and Behrens, 2010).
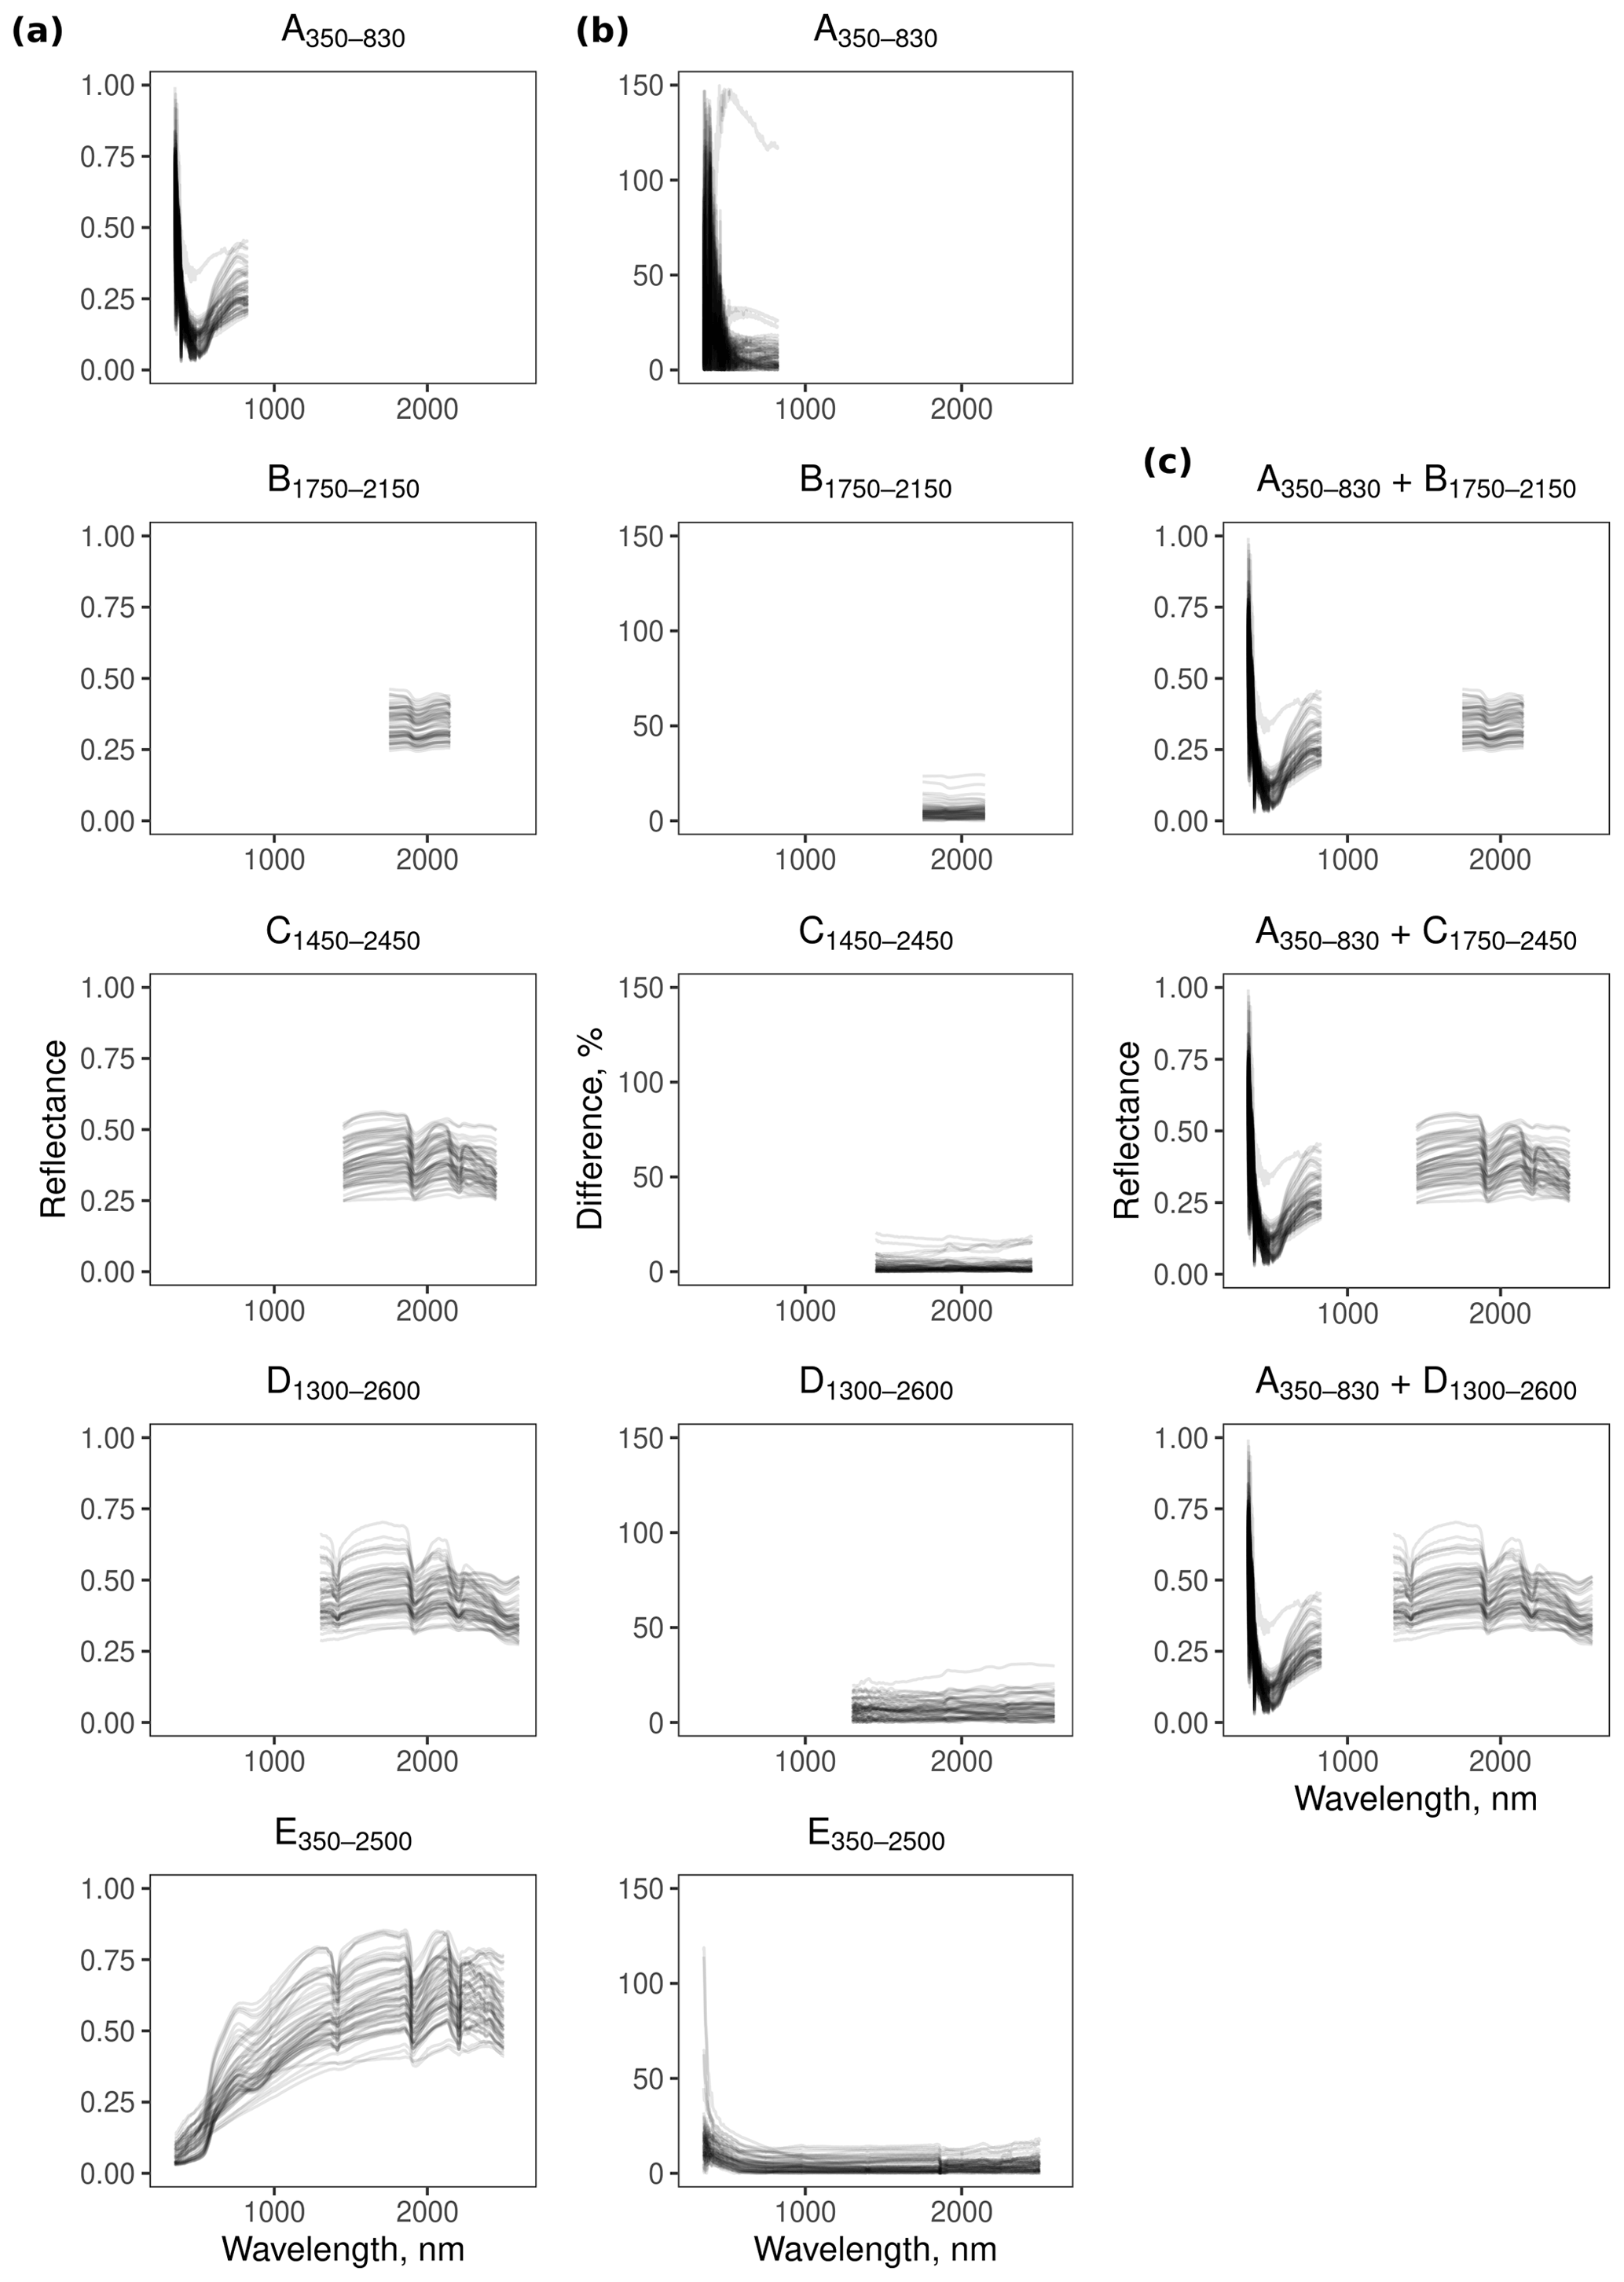
Spectrometer E350−2500 was more repeatable in the range between 600–2500 nm, with less than 18.7 % difference between the replicates. At wavelengths smaller than 600 nm, however, the difference between the replicates was large (Fig. 3). The repeatability of spectrometers B1750−2150 (<24.3 %), C1450−2450 (<20.6 %), and D1300−2600 (<30.9 %) was similar, with B1750−2150 and C1450−2450 being slightly more repeatable than D1300−2600. In contrast, replicate spectra from A350−830 were more imprecise in the 350–500 nm region (Fig. 3).
3.1 Assessment of the algorithms on data from plots
PLSR, GPRP, Cubist, and GPRL consistently produced more accurate estimates (mean ρc of 0.74, 0.74, 0.71, and 0.69 respectively) of the soil physical, chemical, and biological properties and with less variability (narrower minimum, maximum intervals) between spectrometers than SVM, RF, and XGBoost (mean ρc of 0.51, 0.54, and 0.58 respectively) (Fig. 4).
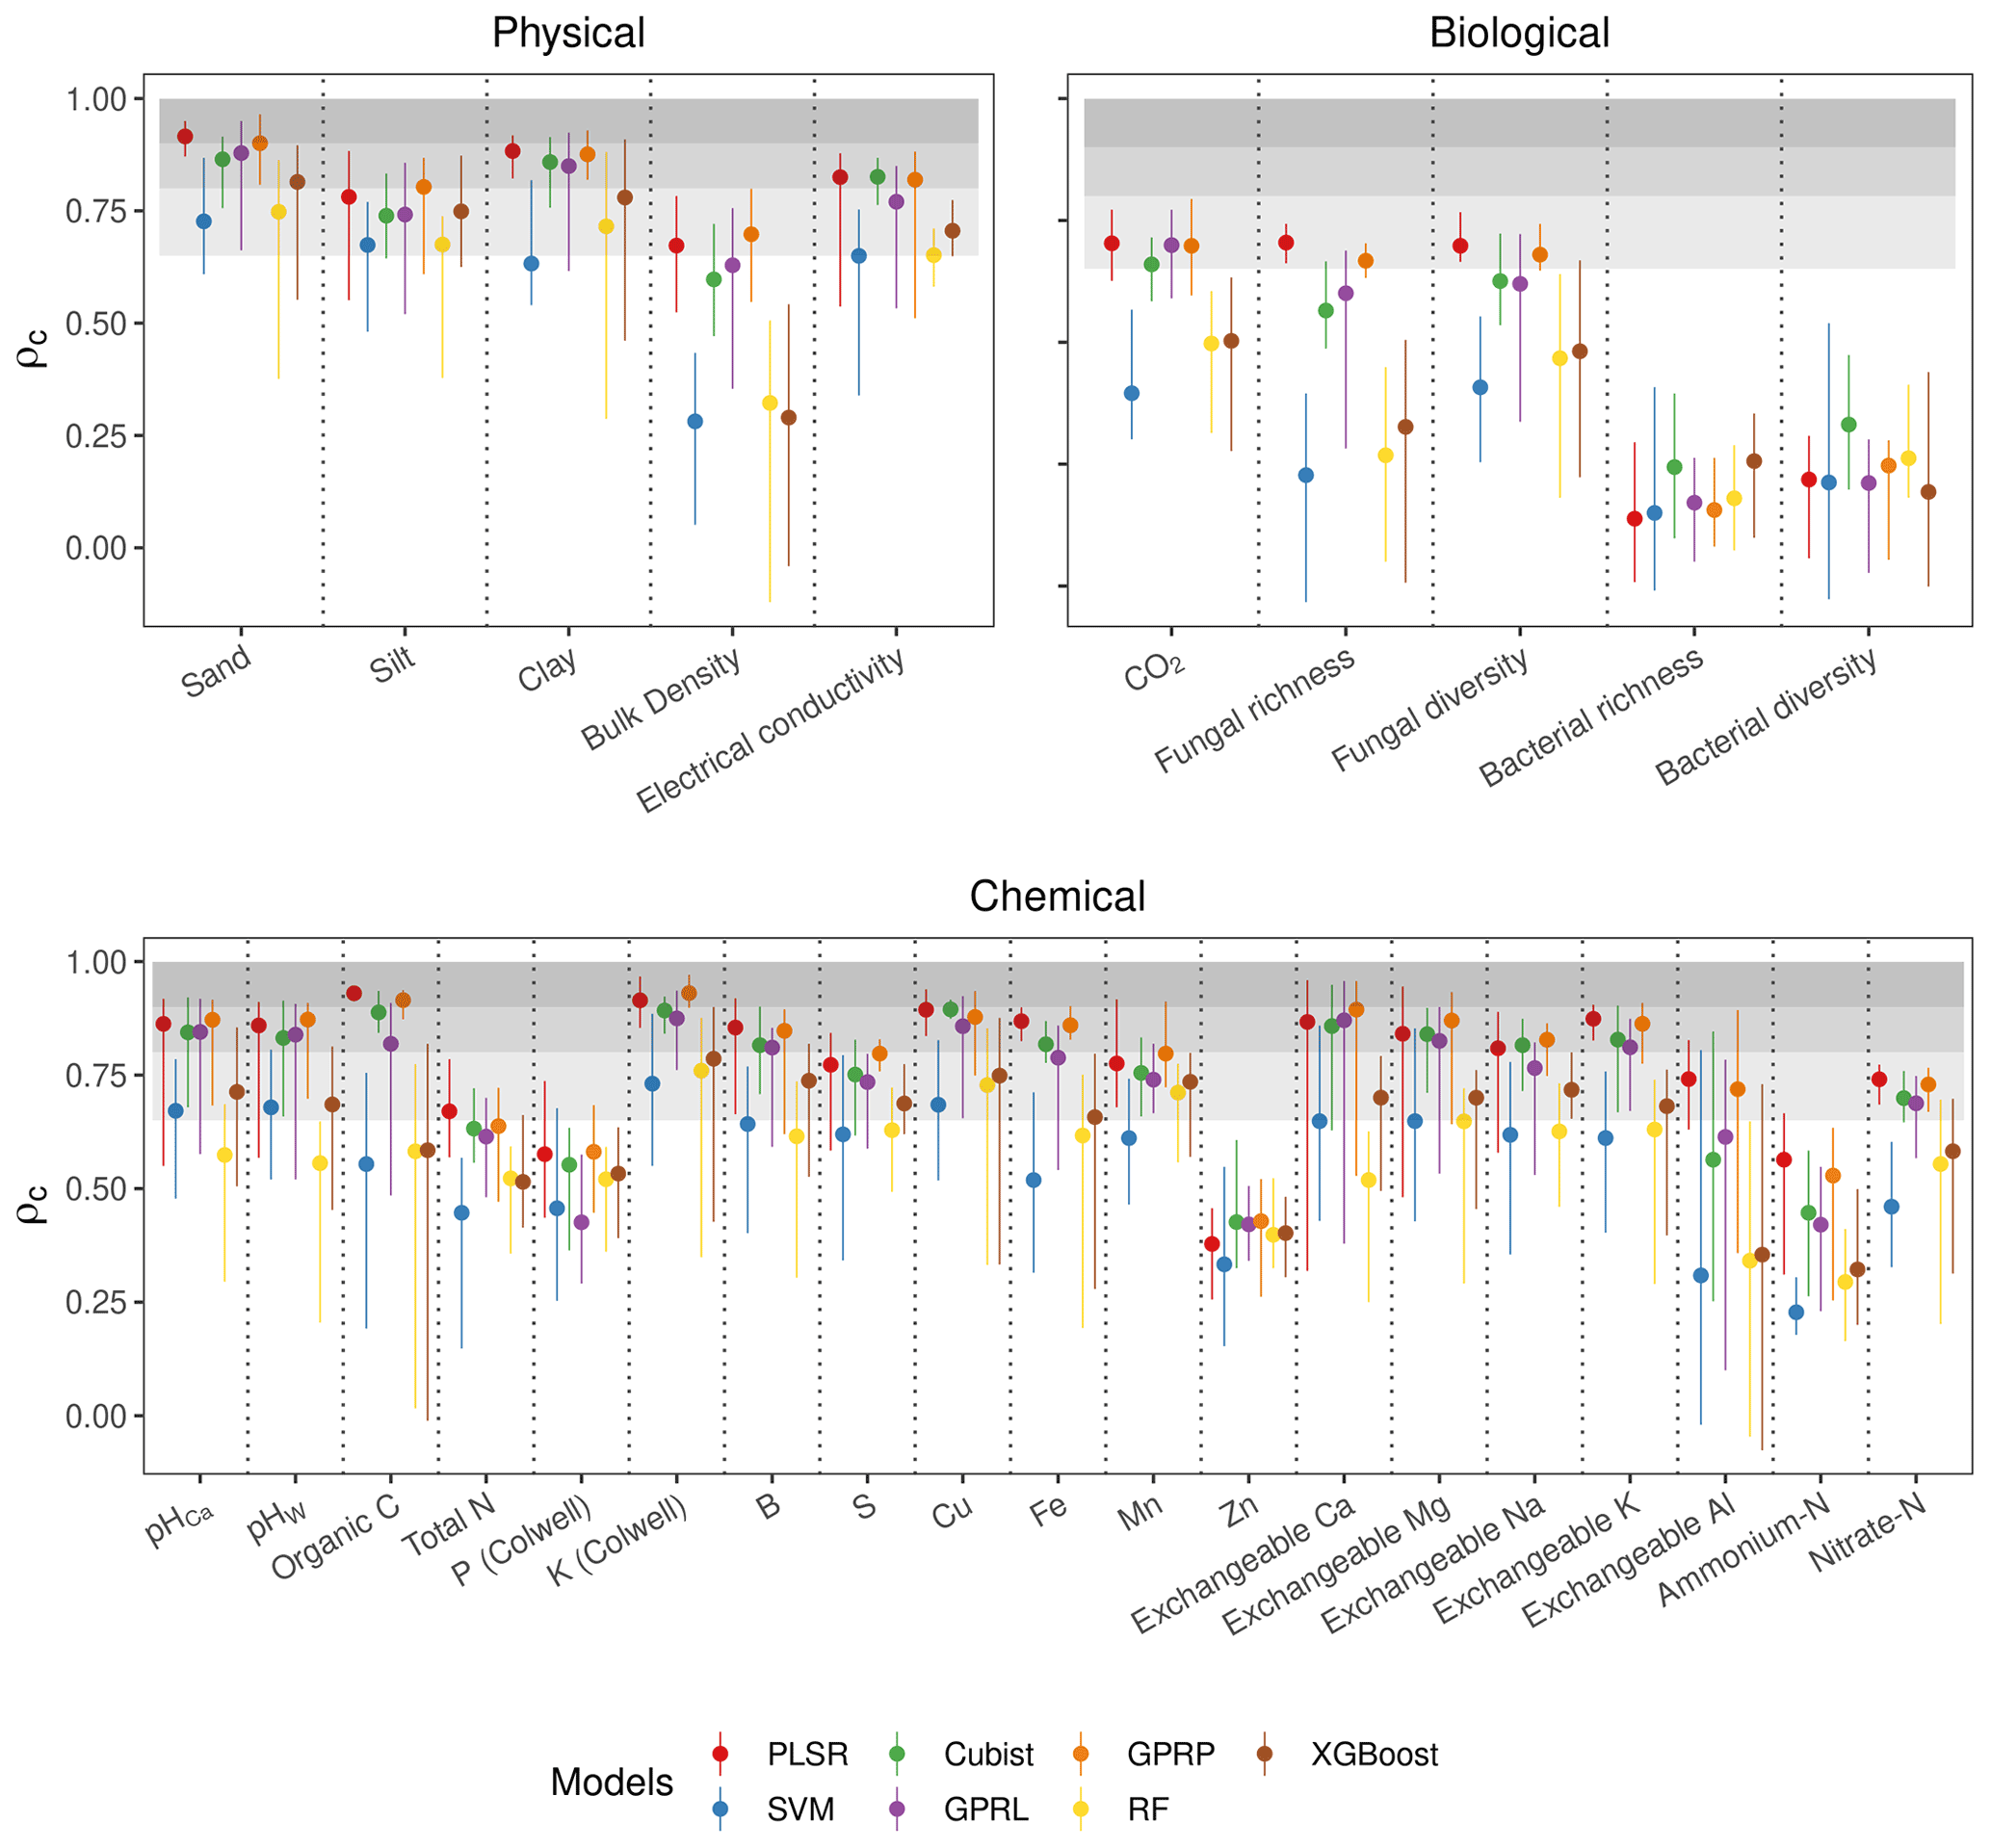
Figure 4Assessment of the accuracy from different algorithms. The mean ρc (points) and range (lines) extend the minimum and maximum values of ρc from the five spectrometers and three combinations. The three shaded grey bands indicate the accuracy level, which we classified as poor (ρc<0.65), moderate (), substantial (), and near-perfect ().
Of the soil physical properties, bulk density was most poorly estimated (ρc<0.65) (Fig. 4). All of the algorithms performed well for the rest of the physical properties (ρc≥0.65). The accuracy of the estimates of the biological properties varied. CO2 flux with PLSR, Cubist, GPRL, and GPRP produced ρc values between 0.65–0.8 (Fig. 4). Estimates of fungal diversity and richness with these algorithms varied, and only PLSR and GPRP produced mean values of ρc in the range between 0.65–0.8. All algorithms poorly estimated bacterial richness and diversity (ρc<0.65), although the Cubist estimates were markedly better (Fig. 4). The algorithms inaccurately estimated the chemical properties P, Zn, and ammonium nitrogen (ρc<0.65). The chemical properties, pHCa, pHW, organic C, K, B, Cu, Fe, exchangeable Ca, Mg, and K, were predicted with substantial accuracy (ρc≥0.8) by PLSR, Cubist, GPRP, and GPRL. The variability in the estimates of the exchangeable Ca, Mg, and Al was large compared to other chemical properties, arising from the performance of the different spectrometers (Fig. 4).
3.2 Assessment of spectrometers' accuracy on data from plots
In this section, we assess the different spectrometers and combinations, considering only the best algorithms: PLSR, Cubist, GPRL, and GPRP (see above and Fig. 4). Generally, combining visible and NIR spectrometers produced more accurate estimates of the soil's physical, biological, and chemical properties than only visible or NIR spectrometers (Fig. 5).The visible range spectrometer, A350−830, accurately estimated soil texture (sand, silt, and clay), but it was the least accurate for estimating chemical properties. The NIR spectrometers estimated most of the soil physical, chemical, and biological properties with moderate or greater accuracy (ρc≥0.65). The B1750−2150 spectrometer, with the narrowest spectral range, produced the least accurate estimates of the soil physical and biological properties (Fig. 5).
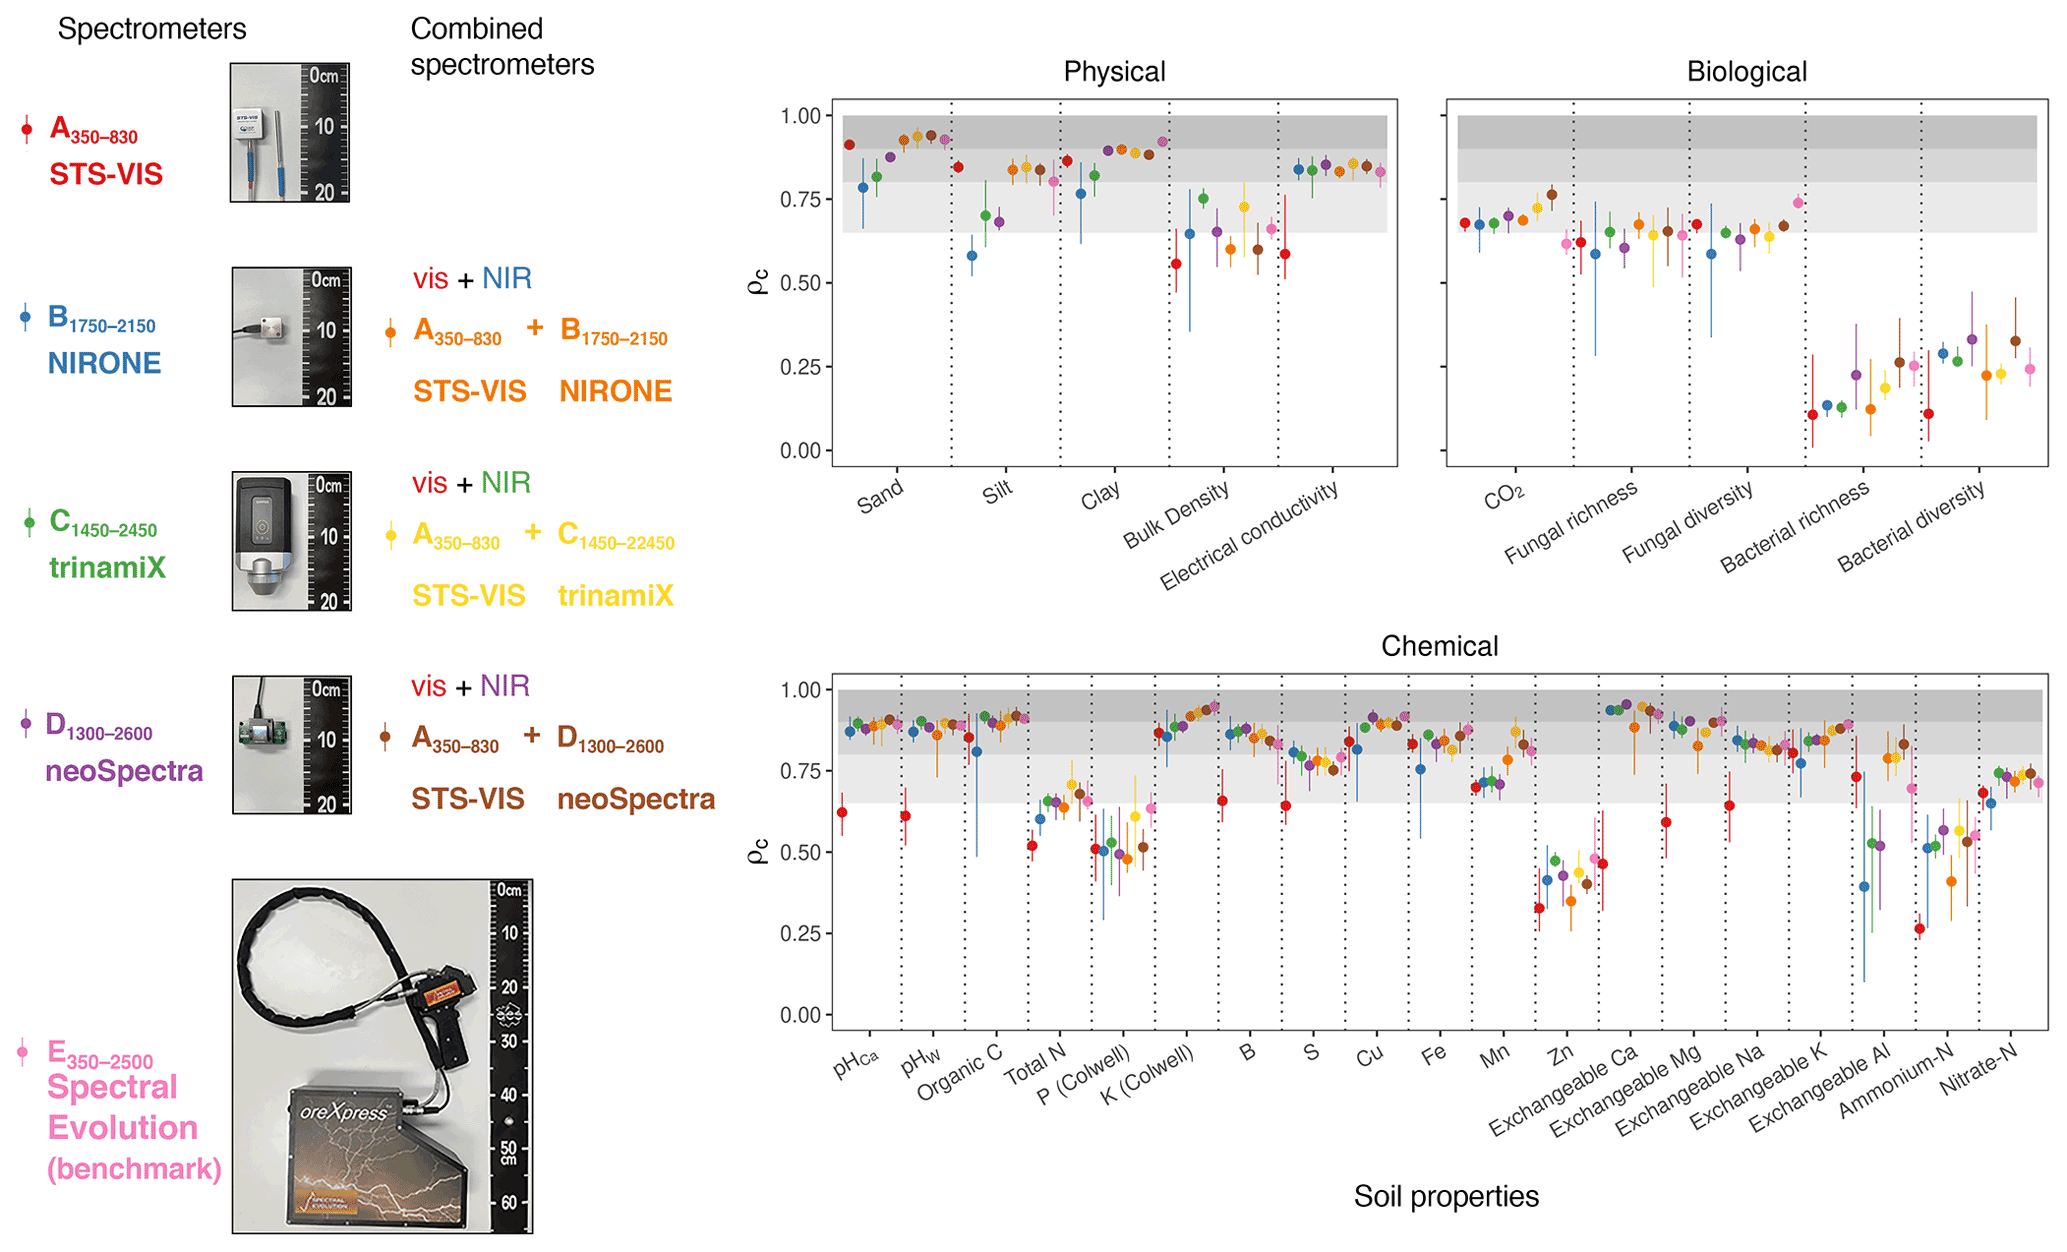
Figure 5Photographs of the miniaturised and portable spectrometers indicating their size (cm). The spectrometer names, spectral ranges, and combinations are colour-coded and correspond with colours of the symbols on the plots. Accuracy of the spectrometers and combinations. The discs show the mean ρc, and the range lines are the minimum and maximum values of ρc from the best four algorithms (PLSR, Cubist, GPRL, and GPRP). The grey bands indicate the level of accuracy (moderate, substantial, and near-perfect – see caption of Fig. 4).
The A350−830 spectrometer produced the best estimates of silt content, and its estimates of sand and clay were comparably accurate to those made using instruments that cover the NIR and vis–NIR ranges (Fig. 5). Estimates of sand and silt content using only the NIR range, with the B1750−2150, C1450−2450, and D1300−2600 spectrometers, were the least accurate. Estimates of soil electrical conductivity with the NIR and vis–NIR ranges were similar (, Fig. 5) and remarkably better than the visible range. The spectrometers that combine the visible and NIR ranges estimated the soil biological properties better. For instance, the combined and spectrometers produced the most accurate estimate of CO2; and the portable E350−2500 spectrometer produced better estimates of fungal richness and diversity, respectively (Fig. 5). Of the soil chemical properties that were estimated with at least moderate accuracy (ρc≥0.65), the NIR and vis–NIR range spectrometers, C1450−2450, D1300−2600, , , , and E350−2500, produced estimates with similar accuracy (Fig. 5), whereas the visible range spectrometer, A350−830, produced inaccurate results.
3.3 Assessment of the spectrometers' repeatability on data from plots
For all of the soil physical, chemical, and biological properties, the E350−2500 full-range vis–NIR portable spectrometer produced estimates that were generally the most repeatable (lowest mean Δρc; Fig. 6). The miniaturised NIR spectrometer (B1750−2150, C1450−2450, and D1300−2600) and combined vis–NIR (, , and ) produced similar and repeatable estimates of the soil properties.
Due to the poor repeatability of the A350−830 measurements (see Fig. 3), the estimates of the soil properties with the spectra from this instrument were the most uncertain, particularly the chemical properties (Fig. 6). For a number of properties that were not precisely estimated with the A350−830 instrument (e.g. bulk density, S, and Exchangeable Na and Al), combining it with a NIR spectrometer reduced the precision of the estimates from the spectrometer combinations (larger mean Δρc). For the soil properties that could not be estimated well with any spectrometer (e.g. bacterial richness and diversity, P, Zn, and ammonium nitrogen with ρc<0.65), the precision of the estimates was also poor.
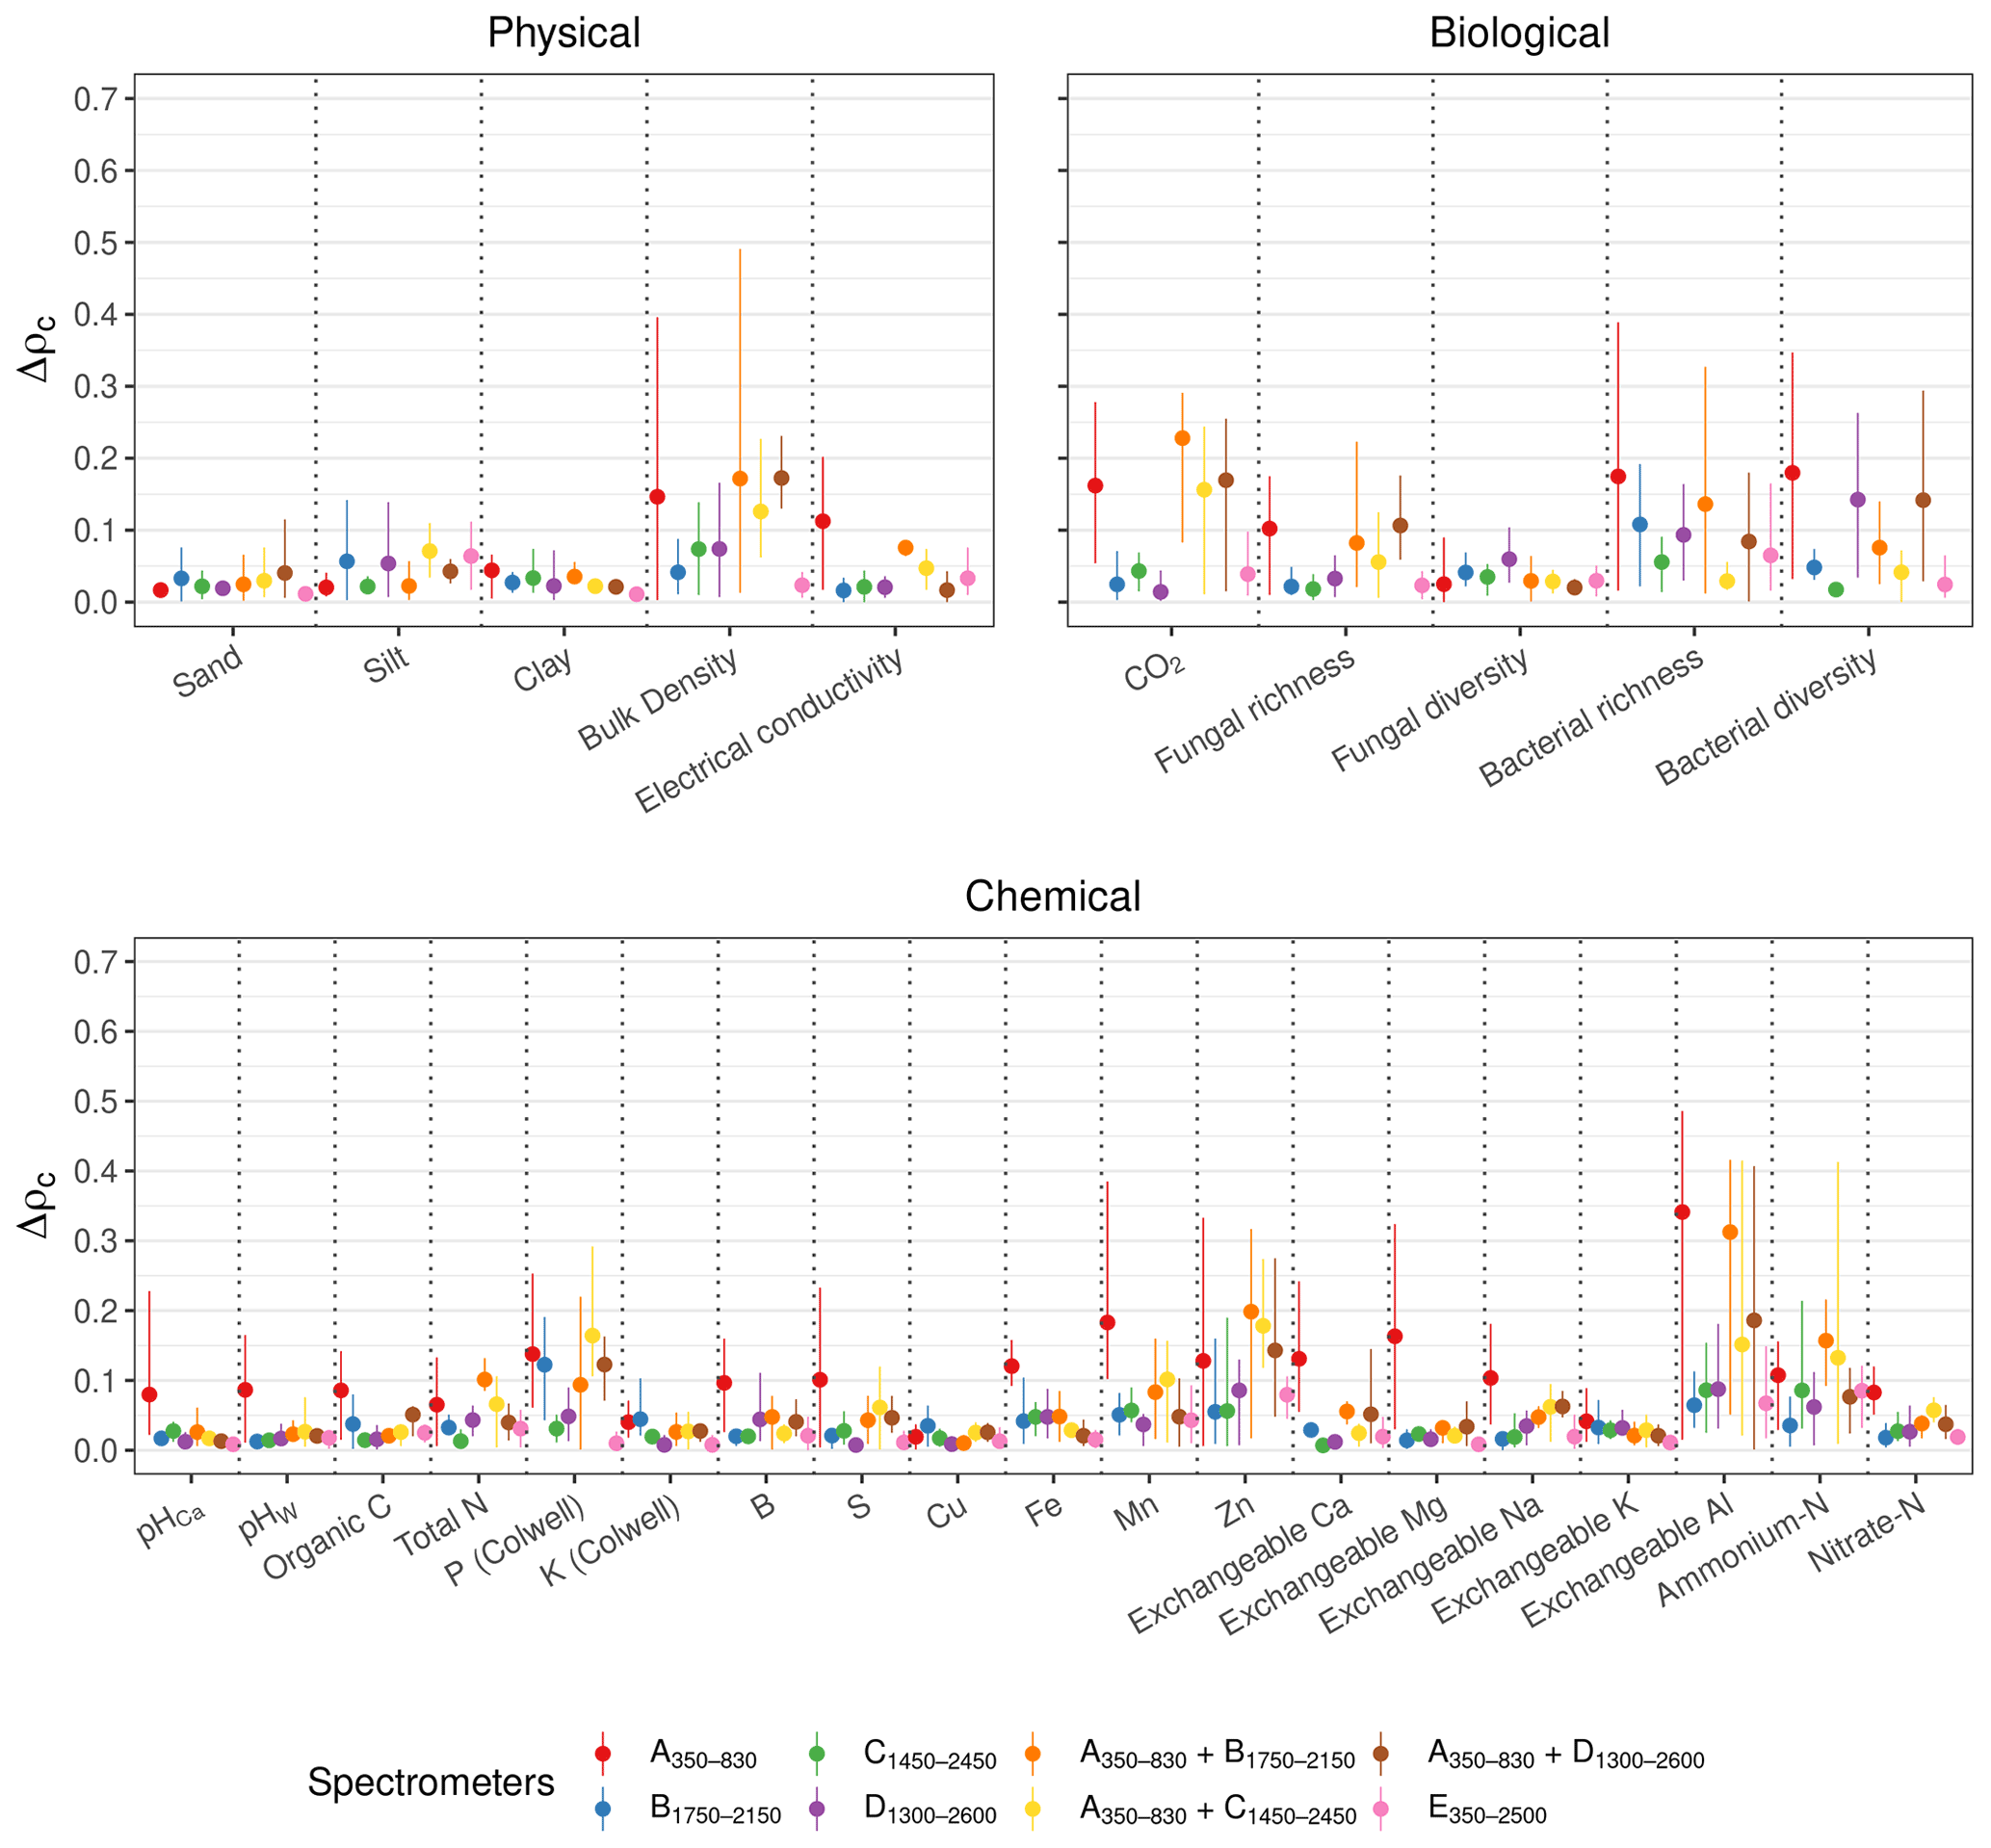
Figure 6Effect of the repeatability of the spectrometers on the spectroscopic modelling. Δρc represents the difference in ρc between the algorithms (with PSLR, Cubist, GPRL, and GPRP) of the replicates. The discs show the mean difference, and the lines represent the minimum and maximum of the difference. A small Δρc indicates good repeatability.
3.4 Overall assessment of the spectrometers
Spectrometers that cover the visible and NIR ranges were the most accurate and stable as shown by the higher accuracy and accuracy range scores, respectively (Table 4). The and spectrometers were as accurate as the full-range portable E350−2500 spectrometer. Spectrometers C1450−2450 and E350−2500 were the most repeatable, while A350−830 was the least repeatable (Table 4). The precision of the vis–NIR combinations , , and was affected by the poor repeatability of A350−830. Overall, the full-range vis–NIR spectrometer (E350−2500) had the highest e score (Table 4), followed by NIR spectrometers with wider spectral ranges (C1450−2450, D1300−2600) and vis-NIR combinations ( and ).
Table 4Overall assessment of the spectrometers and combinations. Columns show the accuracy and the stability (represented by the range of the accuracy) of the spectrometers when modelling with the different algorithms (PSLR, Cubist, GPRL, and GPRP) as well as the effect of the spectrometers' repeatability on the modelling and its stability. They correspond to the first, second, third, and fourth term in Eq. (2), respectively.

For each soil property, we derived the performance score, e, for all the spectrometers and combinations. The evaluation statistics of the spectrometer or combination with the largest e are shown in Table 5. The miniaturised spectrometers and combinations estimated 24 of the 29 soil properties with moderate or better accuracy (ρc≥0.65), except for P, Zn, ammonium nitrogen, and bacterial properties. The inaccuracy of the soil property estimates, quantified with the RMSE, was largely due to imprecision (SDE) and not bias (ME).
The visible range spectrometer A350−830 had the largest e for sand and silt, with ρc≥0.90 and , respectively (Table 5). The individual NIR spectrometers performed well on many chemical and some of the biological properties. The C1450−2450 spectrometer alone predicted one soil physical property, six chemical properties, and one biological property with moderate or better accuracy (ρc≥0.65). Some soil properties (e.g. clay, electrical conductivity, pHCa, K, Mn, exchangeable Na, K, and Al, and fungal diversity) were accurately estimated when the visible spectrometer was combined with a NIR spectrometer, for instance, the combined spectrometers.
Table 5Evaluation statistics for the miniaturised spectrometers and combinations showing the highest e score for individual soil properties.

3.5 Spectroscopic modelling with PLSR and 10-fold plot-out cross-validation on data from subplots
Compared to the other algorithms tested, PLSR generally produced more accurate estimates of the soil properties tested (see Fig. 4), so we used it for modelling the 280 data from the subplots (see Methods section, “Validation on data from subplots”). Since the A350−830 and B1750−2150 spectrometers generally produced the least accurate estimates (Fig. 5) and had the smallest e score (Table 4), we did not use them in this modelling. The 10-fold plot-out cross-validations of the soil properties from subplots (Fig. 7) were similar or slightly more conservative compared to those of the 10-fold cross-validation of the data from plots (Fig. 5), suggesting that our evaluation of the spectrometers is reliable.

The accuracy of the estimates with the combined and spectrometers was similar to the full-range portable E350−2500 spectrometer and better than the combined spectrometer (Fig. 7). The C1450−2450 and D1300−2600 spectrometers produced estimates with similar accuracy, but their estimates were less accurate than those from the and spectrometers, respectively.
4.1 Mine site soil rehabilitation requires cost-effective soil property measurements
Mining is vital to economic development in many countries. In Australia, for example, mining and energy exports are forecast to be worth around AU 288 billion in 2020/21, and over 184 billion of this from WA alone (Department of Industry, Science, Energy and Resources, 2021). However, the economic benefits of mining come at an environmental cost, and the collective footprint of mining in Australia is expected to exceed 4000 km2 by 2050 (EPA, 2014), and globally, it is currently 57 000 km2 and has been increasing at an unparalleled rate in the last decade. There is little historical evidence of capacity to effectively restore land at this scale (EPA, 2013), and regulatory bodies have urged the mining industry to engage in restoration science (EPA, 2014).
To rehabilitate and restore biodiverse, resilient ecosystems post-mining, we must first measure and diagnose, then reinstate and monitor the health of the soils. However, a lack of rapid, quantitative methods for assessing and monitoring soil properties that are indicators of soil health may at least partially underpin the continuing failure to deliver effective and cost-efficient restoration outcomes following mining. In this context, our results are encouraging because they present an opportunity for establishing a science-based diagnostic capacity to rapidly and cost-effectively estimate soil properties that are key for diagnosing soil health.
4.2 Miniaturised visible and NIR spectrometers can estimate key soil health indicators
We used miniaturised spectrometers to estimate 29 soil physical, chemical, and biological soil properties. Amongst these, soil organic carbon, K, P, pH, EC, B, Cu, Zn, Mn, Fe, Ca, Mg, Na, Al, sand, silt, clay, soil respiration (CO2 ), available N (ammonium and nitrate), and BD are tier 1 soil health indicators in routine soil testing programs (Karlen et al., 2019; Bünemann et al., 2018). Although less commonly included in soil health assessment frameworks, microbial community composition is an under-utilised yet valuable metric for soil health assessment (Fierer et al., 2021). Changes in soil microbial communities are associated with processes that are important for soil health, such as changes in P availability (Hermans et al., 2017), soil pH (Delgado-Baquerizo et al., 2018), labile organic carbon pools (Ramírez et al., 2020), and soil moisture levels (Isobe et al., 2020). Our aim was not to derive detailed interpretations of the soil health indicators or an overall soil health index or score. Instead, we tested 29 soil properties commonly used as key indicators of soil health and used the spectra from a range of miniaturised and portable spectrometers to model them. The spectroscopic models accurately estimated 24 out of 29 soil properties (Table 5). Therefore, the spectra from the miniaturised spectrometers can accurately estimate soil properties that are key indicators of soil health. These estimates can could then inform the assessment and diagnosis of soil health. These findings suggest using miniaturised spectrometers to develop a cost-effective soil health diagnostic capacity for mine site soil rehabilitation. In a future study, we might investigate the derivation of a soil health index based on the spectra or the estimated soil properties.
Some soil properties (bacterial richness and diversity, P, Zn, and ammonium nitrogen) could not be estimated well with any of the spectrometers or combinations (Fig. 5). Therefore, it might be necessary to investigate other methods to measure them. Although we could estimate 24 soil properties with moderate or greater accuracy (ρc≥0.65), the estimates are outcomes from empirical models that possess error (Table 5). However, the advantage of the spectroscopic method, compared to the more accurate conventional analytical measurements, is that spectroscopy is rapid and cost-effective (Li et al., 2022), allowing for many more (spatial and temporal) measurements, which on the whole might serve to better assess and monitor soil health. Another advantage of spectroscopy is that a single spectrum can be used to estimate many soil properties. These make soil spectroscopy well suited for large-scale soil rehabilitation where many data are needed but are too expensive and time-consuming to obtain using conventional soil analysis.
The accuracy of the estimates of electrical conductivity and most of the soil chemical properties from the A350−830 spectrometer was markedly poorer than the NIR spectrometers (Fig. 5), indicating that the 350–830 nm range does not hold sufficient chemical information to produce suitable models for estimating those soil properties. The poor repeatability of the A350−830 spectrometer’s measurements in the 350–500 nm range (Fig. 3) also affected the precision of the spectrometer combinations (reduced repeatability of the combinations in Table 4). With a more repeatable visible spectrometer, the spectrometer performance of the combined spectrometers would improve.
4.3 Soil assessment with the miniaturised spectrometers
Some studies have evaluated miniaturised NIR spectrometers for characterising soil properties (Tang et al., 2020; Ng et al., 2020; Sharififar et al., 2019) in agricultural and natural environments. However, our study presents a comprehensive assessment. We tested a diverse range of soil properties considered key indicators of soil health using many spectrometers (one visible, three NIR, three combinations, and a portable spectrometer) and seven statistical and machine learning algorithms; we evaluated the repeatability of the measurements and their effect on the models' estimates and the accuracy of the models. Our study also extends the application of miniaturise spectrometers in mine site soil rehabilitation.
How can the miniaturised spectrometers with coarser resolutions and narrower spectral ranges produce nearly as good or better results as the full-range, higher-resolution sensor? For different reasons. First, soil vis–NIR spectra are non-specific and highly collinear (Stenberg et al., 2010). Although the small spectrometers have restricted wavelength ranges, a well-selected spectral range can hold information on overtones and combination bands of important organic and mineral constituents that enable the development of accurate models. For example, spectrometer B1750−2150, with a very narrow range, could estimate many soil properties with moderate or greater accuracy (ρc≥0.65, Fig. 5). Table 5 shows the spectrometers with varying spectral ranges that could adequately estimate each soil property. Second, absorptions due to soil constituents in the vis–NIR range are broad (Viscarra Rossel and Behrens, 2010), and coarse spectral resolutions, like those of the miniature spectrometers (Table 2), are unlikely to affect the modelling, compared to the portable vis–NIR spectrometer with a finer spectral resolution.
4.4 Miniaturised soil spectroscopy can support soil rehabilitation
The portability and affordability (see Table 2) of the miniaturised spectrometers enable the cost-effective acquisition of soil information at greater temporal and spatial resolutions than conventional laboratory-based methods. Although spectroscopy produces less precise measures of soil properties than conventional laboratory analyses, it enables many more rapid and cost-effective measurements at the appropriate spatial and temporal resolution for rehabilitation and ecological restoration. Practitioners can then effectively identify the need for early interventions to establish positive soil health trajectories. Spectroscopy could also facilitate the evaluation of soil degradation, more timely identification and remediation of ecologically hostile conditions, and more effective monitoring of the change in soil properties in response to restoration activities. An additional significance of the miniaturised visible and NIR spectrometers is that they are, even in combination, much cheaper than the full-range portable instrument (Table 2). Because they are cost-effective, compact, and lightweight, they are being used in many diverse applications (Giussani et al., 2022; Pu et al., 2021).
Together with other sensors and environmental data, development and further testing of the miniaturised visible and NIR spectrometers could provide the mining industry and restoration practitioners with a rapid and cost-efficient methodology for diagnosing, assessing, and monitoring soil health. The information gained would ensure that soil management, whether in rehabilitation and restoration, is underpinned by quantitative information for evidence-based decision-making. In addition, the ability to reliably assess a wide range of soil properties that are key indicators of soil health enables rapid identification of when intervention is required, which could help deliver significant economic and environmental outcomes.
Achieving desired outcomes from rehabilitation and ecological restoration relies on characterising soil properties that affect soil health. Therefore, developing efficient, reliable, and cost-effective methods for measuring and monitoring soil properties that can indicate soil health is essential. We compared four miniaturised spectrometers (one visible and three NIR) and three vis + NIR combinations to a research-grade (benchmark), full-range vis–NIR instrument, which is an order of magnitude more expensive. Seven statistical and machine learning algorithms were used for modelling 29 soil physical, chemical, and biological properties, key indicators of soil health, to assess the spectrometers' predictive performance as a function of accuracy and repeatability. Four algorithms, PLSR, Cubist, GPRL, and GPRP, performed consistently well with the different spectrometers. The visible spectrometer was remarkably accurate for estimating sand, silt, and clay contents, and the NIR spectrometers could estimate most chemical, physical, and biological properties with moderate or greater accuracy (ρc≥0.65). However, none of the spectrometers could estimate bacterial richness or diversity. The visible sensor was the least repeatable, which affected its estimates and those with the combined spectrometers. The combined small vis + NIR spectrometers performed similarly to the benchmark spectrometer, and the miniaturised spectrometers and combinations could estimate 24 of the 29 soil properties with moderate or greater accuracy. Soil spectroscopy with these tiny sensors is cost-effective. It enables the collection of many more measurements at the required spatial and temporal resolutions, improving soil health diagnosis and ecologic rehabilitation and restoration. Thus, the information gained could inform decision-making to deliver positive environmental and economic outcomes.
The code used for the analyses presented in this work is available from the corresponding author on reasonable request.
The data used in this work are available from the corresponding author on reasonable request.
RAVR conceived the study. ZS and RAVR performed the data analysis and modelling with input from LW and MZ. HD, KD, and PN designed the soil sampling, and HD performed the sampling and lab analyses. TMY supplied two of the miniaturised spectrometers and with MM and YH performed the spectroscopic measurements. RAVR and ZS led the writing with input from HD, LW, MZ, and AC. KD and PN edited versions of the manuscript.
At least one of the (co-)authors is a member of the editorial board of SOIL. The peer-review process was guided by an independent editor, and the authors also have no other competing interests to declare.
Publisher’s note: Copernicus Publications remains neutral with regard to jurisdictional claims in published maps and institutional affiliations.
We thank the Pawsey Supercomputing Centre with funding from the Australian Government and the Government of Western Australia, for providing the computational resources to undertake this research. trinamiX GmbH (Ludwigshafen, Germany) is thanked for supplying us with their mobile NIR spectroscopy solution. BHP, Alcoa, and Tronox are thanked for their in-kind support. Liam Mallon, Grace Abbott, Douglas Laurie, and Jamie Fox are thanked for field assistance, Benjamin Moreira Grez and Mieke van der Heyde for molecular work, and Justin Valliere for assistance with the soil physicochemical properties. The traditional owners of the land on which this research was undertaken are acknowledged, and we pay our respects to Elders past, present, and emerging.
This research has been supported by the Research Office at Curtin University. Haylee D'Agui, Kingsley Dixon, Paul Nevill, and Adam Cross received funding from the ARC Centre for Mine Site Restoration (grant no. ICI150100041), Independence Group, Fortescue Metals Group, and a mine in Southwest WA that has requested anonymity.
This paper was edited by Raúl Zornoza and reviewed by two anonymous referees.
Breiman, L.: Random forests, Mach. Learn., 45, 5–32, 2001. a
Bünemann, E. K., Bongiorno, G., Bai, Z., Creamer, R. E., De Deyn, G., de Goede, R., Fleskens, L., Geissen, V., Kuyper, T. W., Mäder, P., Pulleman, M., Sukkel, W., van Groenigen, J. W., and Brussaard, L.: Soil quality – A critical review, Soil Biol. Biochem., 120, 105–125, https://doi.org/10.1016/J.SOILBIO.2018.01.030, 2018. a
Caporaso, J. G., Lauber, C. L., Walters, W. A., Berg-Lyons, D., Lozupone, C. A., Turnbaugh, P. J., Fierer, N., and Knight, R.: Global patterns of 16S rRNA diversity at a depth of millions of sequences per sample, P. Natl. Acad. Sci. USA, 108, 4516–4522, 2011. a
Chen, T., He, T., Benesty, M., Khotilovich, V., Tang, Y., Cho, H., and Chen, K.: Xgboost: extreme gradient boosting, R package version 0.4-2, 1, 1–4, 2015. a
Christian, S. M. and Ford, J. V.: NIR: 21st-Century Innovations, in: Handbook of Near-Infrared Analysis, CRC Press, 95–123, 2021. a
Coates, J.: A review of new small-scale technologies for near infrared measurements, Am. Pharm. Rev., 17, https://www.americanpharmaceuticalreview.com/Featured-Articles/ (last access: 14 July 2022), 2014. a
Colwell, J.: An automatic procedure for the determination of phosphorus in sodium hydrogen carbonate extracts of soils, Chem. Indust., 1965, 37–51, 1965. a
Cooke, J. A. and Johnson, M. S.: Ecological restoration of land with particular reference to the mining of metals and industrial minerals: A review of theory and practice, Environ. Rev., 10, 41–71, 2002. a
Cross, A. T. and Lambers, H.: Calcicole-calcifuge plant strategies limit restoration potential in a regional semi-arid flora, Ecol. Evol., 11, 6941–6991, https://doi.org/10.1002/ece3.7544, 2021. a
Cross, A. T., Stevens, J. C., and Dixon, K. W.: One giant leap for mankind: can ecopoiesis avert mine tailings disasters?, Plant Soil, 421, 1–5, 2017. a
Cross, A. T., Stevens, J. C., Sadler, R., Moreira-Grez, B., Ivanov, D., Zhong, H., Dixon, K. W., and Lambers, H.: Compromised root development constrains the establishment potential of native plants in unamended alkaline post-mining substrates, Plant Soil, 461, 163–179, https://doi.org/10.1007/s11104-018-3876-2, 2018. a
Delgado-Baquerizo, M., Oliverio, A. M., Brewer, T. E., Benavent-González, A., Eldridge, D. J., Bardgett, R. D., Maestre, F. T., Singh, B. K., and Fierer, N.: A global atlas of the dominant bacteria found in soil, Science, 359, 320–325, 2018. a
Department of Industry, Science, Energy and Resources: Commonwealth of Australia Resources and Energy Quarterly March 2021, Tech. Rep., Department of Industry, Science, Energy and Resources Australia, Canberra, Australian Capital Territory, Vol. 11, ISSN 1839-5007, 2021. a
EPA: Environmental Protection Authority Annual Report 2012–13, Tech. Rep., Environmental Protection Authority Western Australia, Perth, Western Australian, https://www.epa.wa.gov.au/sites/ (last access: 14 July 2022), 2013. a
EPA: Environmental Protection Authority Annual Report 2013–14, Tech. Rep., Environmental Protection Authority Western Australia, Perth, Western Australian, https://www.epa.wa.gov.au/sites/ (last access: 14 July 2022), 2014. a, b
Fierer, N., Wood, S. A., and de Mesquita, C. P. B.: How microbes can, and cannot, be used to assess soil health, Soil Biol. Biochem., 153, 108111, https://doi.org/10.1016/j.soilbio.2020.108111, 2021. a
Gann, G. D., McDonald, T., Walder, B., Aronson, J., Nelson, C. R., Jonson, J., Hallett, J. G., Eisenberg, C., Guariguata, M. R., Liu, J., Hua, F., Echeverría, C., Gonzales, E., Shaw, N., Decleer, K., and Dixon, K. W.: International principles and standards for the practice of ecological restoration. Second edition, Restor. Ecol., 27, 1061–2971, 2019. a
Giussani, B., Gorla, G., and Riu, J.: Analytical chemistry strategies in the use of miniaturised NIR instruments: An overview, Crc. Cr. Rev. Anal. Chem., 1–33, https://doi.org/10.1080/10408347.2022.2047607, 2022. a
Guerrero, C., Viscarra Rossel, R. A., and Mouazen, A.: Special issue “Diffuse reflectance spectroscopy in soil science and land resource assessment” Preface, Geoderma, 158, 1–2, 2010. a
Haney, R. L., Hossner, L. R., and Haney, E. B.: Soil microbial respiration as a tool to assess post mine reclamation, Int. J. Min. Reclam. Env., 22, 48–59, https://doi.org/10.1080/17480930701414584, 2008. a
Hermans, S. M., Buckley, H. L., Case, B. S., Curran-Cournane, F., Taylor, M., and Lear, G.: Bacteria as emerging indicators of soil condition, Appl. Environ. Microb., 83, e0282616, https://doi.org/10.1128/AEM.02826-16, 2017. a
Ihrmark, K., Bödeker, I. T. M., Cruz-Martinez, K., Friberg, H., Kubartova, A., J, S., Strid, Y., Stenlid, J., Brandström-Durling, M., Clemmensen, K. E., and Lindahl, B. D.: New primers to amplify the fungal ITS2 region – evaluation by 454-sequencing of artificial and natural communities, FEMS Microb. Ecol., 82, 666–677, 2012. a
Isbell, R. F.: The Australian Soil Classification, CSIRO Publishing, Collingwood, Victoria, revised ed edn., ISBN 978-0-643-06981-7, 2002. a
Isobe, K., Bouskill, N. J., Brodie, E. L., Sudderth, E. A., and Martiny, J. B.: Phylogenetic conservation of soil bacterial responses to simulated global changes, Philos. T. Roy. Soc. B, 375, 20190242, https://doi.org/10.1098/rstb.2019.0242, 2020. a
Jeffrey, M.: Restore the Soil: Prosper the Nation, Tech. Rep., https://www.agriculture.gov.au/sites/default/files/ (last access: 14 July 2022), 2017. a
Johnson, R. C.: 1st means spectrometer debuts, Electronic engineering times, https://www.eetimes.com/1st-mems-spectrometer-debuts (last access: 13 July 2022), 2015. a
Karatzoglou, A., Smola, A., Hornik, K., and Zeileis, A.: kernlab-an S4 package for kernel methods in R, J. Stat. Softw., 11, 1–20, 2004. a
Karlen, D. L., Veum, K. S., Sudduth, K. A., Obrycki, J. F., and Nunes, M. R.: Soil health assessment: Past accomplishments, current activities, and future opportunities, Soil Till. Res., 195, 104365, https://doi.org/10.1016/j.still.2019.104365, 2019. a
Lal, R.: Soil carbon sequestration to mitigate climate change, Geoderma, 123, 1–22, 2004. a
Lehmann, J., Bossio, D. A., Kögel-Knabner, I., and Rillig, M. C.: The concept and future prospects of soil health, Nat. Rev. Earth Environ., 1, 544–553, https://doi.org/10.1038/s43017-020-0080-8, 2020. a
Li, S., Viscarra Rossel, R. A., and Webster, R.: The cost-effectiveness of reflectance spectroscopy for estimating soil organic carbon, Europ. J. Soil Sci., 73, e13202, https://doi.org/10.1111/ejss.13202, 2022. a
Liaw, A. and Wiener, M.: Classification and regression by randomForest, R News, 2, 18–22, 2002. a
Lin, L. I.-K.: A concordance correlation coefficient to evaluate reproducibility, Biometrics, 45, 255–268, 1989. a
Liu, L., Ji, M., Dong, Y., Zhang, R., and Buchroithner, M.: Quantitative retrieval of organic soil properties from visible near-infrared shortwave infrared (Vis-NIR-SWIR) spectroscopy using fractal-based feature extraction, Remote Sens., 8, 1035, https://doi.org/10.3390/rs8121035, 2016. a
Manero, A., Standish, R., and Young, R.: Mine completion criteria defined by best-practice: A global meta-analysis and Western Australian case studies, J. Environ. Manage., 282, 111912, https://doi.org/10.1016/j.jenvman.2020.111912, 2021. a
Mullen, K., Ardia, D., Gil, D. L., Windover, D., and Cline, J.: DEoptim: An R package for global optimization by differential evolution, J. Stat. Softw., 40, 1–26, 2011. a
Munoz-Rojas, M., Erickson, T. E., Dixon, K. W., and Merritt, D. J.: Soil quality indicators to assess functionality of restored soils in degraded semiarid ecosystems, Restor. Ecol., 24, 43–52, https://doi.org/10.1111/rec.12368, 2016. a, b
Murray, D. C., Coghlan, M. L., and Bunce, M.: From Benchtop to Desktop: Important Considerations when Designing Amplicon Sequencing Workflows, PLOS ONE, 10, e0124671, https://doi.org/10.1371/journal.pone.0124671, 2015. a
Ng, W., Anggria, L., Siregar, A.F., Hartatik, W., Sulaeman, Y., Jones, E., and Minasny, B.: Developing a soil spectral library using a low-cost NIR spectrometer for precision fertilization in Indonesia, Geoderma, 22, e00319, https://doi.org/10.1016/j.geodrs.2020.e00319, 2020. a, b
Nilsson, R., Larsson, K., Taylor, A., Bengtsson-Palme, J., Jeppesen, T., Schigel, D., Kennedy, P., K, P., and Glöckner, F.: The UNITE database for molecular identification of fungi: handling dark taxa and parallel taxonomic classifications, Nucleic Acids Res., 47, 259–264, 2019. a
Nocita, M., Stevens, A., van Wesemael, B., Aitkenhead, M., Bachmann, M., Barth, B., Dor, E. B., Brown, D. J., Clairotte, M., Csorba, A., Dardenne, P., Dematte, J. A., Genot, V., Guerrero, C., Knadel, M., Montanarella, L., Noon, C., Ramirez-Lopez, L., Robertson, J., Sakai, H., Soriano-Disla, J. M., Shepherd, K. D., Stenberg, B., Towett, E. K., Vargas, R., and Wetterlind, J.: Soil Spectroscopy: An Alternative to Wet Chemistry for Soil Monitoring, Adv. Agron., 132, 139–159, 2015. a, b
Orgiazzi, A., Ballabio, C., Panagos, P., Jones, A., and Fernández-Ugalde, O.: LUCAS Soil, the largest expandable soil dataset for Europe: a review, Europ. J. Soil Sci., 69, 140–153, 2018. a
Price, K., Storn, R. M., and Lampinen, J. A.: Differential evolution: a practical approach to global optimization, Springer Science & Business Media, ISBN 978-3540209508, 2006. a
Pu, Y., Pérez-Marín, D., O’Shea, N., and Garrido-Varo, A.: Recent advances in portable and handheld NIR spectrometers and applications in milk, cheese and dairy powders, Foods, 10, 2377, https://doi.org/10.3390/foods10102377, 2021. a
Quast, C., Pruesse, E., Yilmaz, P., Gerken, J., Schweer, T., Yarza, P., Peplies, J., and Glöckner, F. O.: The SILVA ribosomal RNA gene database project: improved data processing and web-based tools, Nucleic Acids Res., 41, 590–596, 2013. a
Quinlan, J. R.: Learning with continuous classes, in: 5th Australian joint conference on artificial intelligence, Vol. 92, World Scientific, 343–348, 1992. a
Rai, R. K., Singh, V. P., and Upadhyay, A.: Soil Analysis, Planning and Evaluation of Irrigation Projects, 2017, 505–523, 2017. a
Ramírez, P. B., Fuentes-Alburquenque, S., Díez, B., Vargas, I., and Bonilla, C. A.: Soil microbial community responses to labile organic carbon fractions in relation to soil type and land use along a climate gradient, Soil Biol. Biochem., 141, 107692, https://doi.org/10.1016/j.soilbio.2019.107692, 2020. a
Rasmussen, C. E.: Gaussian processes in machine learning, in: Summer school on machine learning, Springer, 63–71, 2003. a
Rayment, G. and Lyons, D.: Soil Chemical Methods – Australasia, CSIRO Publishing, Canberra, ISBN 9780643101364, 2010. a
Rinot, O., Levy, G. J., Steinberger, Y., Svoray, T., and Eshel, G.: Soil health assessment: A critical review of current methodologies and a proposed new approach, Sci. Total Environ., 648, 1484–1491, https://doi.org/10.1016/J.SCITOTENV.2018.08.259, 2019. a
Sharififar, A., Singh, K., Jones, E., Ginting, F. I., and Minasny, B.: Evaluating a low-cost portable NIR spectrometer for the prediction of soil organic and total carbon using different calibration models, Soil Use Manage., 35, 607–616, 2019. a, b
Shen, Z. and Viscarra Rossel, R. A.: Automated spectroscopic modelling with optimised convolutional neural networks, Sci. Rep., 11, 1–12, https://doi.org/10.1038/s41598-020-80486-9, 2021. a
Shen, Z., Ramirez-Lopez, L., Behrens, T., Cui, L., Zhang, M., Walden, L., Wetterlind, J., Shi, Z., Sudduth, K.A., Baumann, P., Song, Y. , Catambay, K., and Viscarra Rossel R. A.: Deep transfer learning of global spectra for local soil carbon monitoring, ISPRS J. Photogramm., 188, 190–200, 2022. a
Song, Y., Shen, Z., Wu, P., and Viscarra Rossel, R.: Wavelet geographically weighted regression for spectroscopic modelling of soil properties, Sci. Rep., 11, 1–11, 2021. a
Soriano-Disla, J., Janik, L., Viscarra Rossel, R. A., Macdonald, L., and McLaughlin, M.: The Performance of Visible, Near-, and Mid-Infrared Reflectance Spectroscopy for Prediction of Soil Physical, Chemical, and Biological Properties, Appl. Spec. Rev., 49, 139–186, 2014. a, b
Stenberg, B., Viscarra Rossel, R. A., Mouazen, A. M., and Wetterlind, J.: Visible and near infrared spectroscopy in soil science, Adv. Agron., 107, 163–215, 2010. a, b, c, d, e
Tang, Y., Jones, E., and Minasny, B.: Evaluating low-cost portable near infrared sensors for rapid analysis of soils from South Eastern Australia, Geoderma, 20, e00240, https://doi.org/10.1016/j.geodrs.2019.e00240, 2020. a, b
Timmis, K. and Ramos, J. L.: The soil crisis: the need to treat as a global health problem and the pivotal role of microbes in prophylaxis and therapy, Microb. Biotech., 14, 769–797, 2021. a, b
Turner, B. L., Fuhrer, J., Wuellner, M., Menendez, H. M., Dunn, B. H., and Gates, R.: Scientific case studies in land-use driven soil erosion in the central United States: Why soil potential and risk concepts should be included in the principles of soil health, Int. Soil Water Conserv. Res., 6, 63–78, https://doi.org/10.1016/J.ISWCR.2017.12.004, 2018. a
Turner, S., Pryer, K. M., Miao, V. P. W., and Palmer, J. D.: Investigating deep phylogenetic relationships among cyanobacteria and plastids by small subunit rRNA sequence analysis, J. Eukar. Microb., 46, 327–338, 1999. a
van der Heyde, M., Bunce, M., Dixon, K., Wardell-Johnson, G., White, N., and Nevill, P.: Changes in soil microbial communities in post mine ecological restoration: Implications for monitoring using high throughput DNA sequencing, Sci. Total Environ., 749, 142262, https://doi.org/10.1016/j.scitotenv.2020.142262, 2021. a
Vapnik, V. N.: An overview of statistical learning theory, IEEE T. Neural Networ., 10, 988–999, 1999. a
Viscarra Rossel, R. and Webster, R.: Predicting soil properties from the Australian soil visible–near infrared spectroscopic database, Eur. J. Soil Sci., 63, 848–860, 2012. a, b
Viscarra Rossel, R. A., Behrens, T., Ben-Dor, E., Brown, D. J., Demattê, J. A. M., Shepherd, K. D., Shi, Z., Stenberg, B., Stevens, A., Adamchuk, V., Aïchi, H., Barthès, B. G. , Bartholomeus, H. M., Bayer, A. D., Bernoux M. , Böttcher, K., Brodský, L., Du, C. W., Chappell, A., Fouad, Y. , Genot, V., Gomez, C., Grunwald, S., Gubler, A., Guerrero, C., Hedley, C. B., Knadel, M., Morrás, H. J. M., Nocita, M., Ramirez-Lopez, L., Roudier, P., Rufasto Campos, E. M., Sanborn, P. , Sellitto, V. M. , Sudduth, K. A., Rawlins, B. G., Walter, C., Winowiecki, L. A., Hong, S. Y., and Ji, W.: A global spectral library to characterize the world's soil, Earth-Sci. Rev., 155, 198–230, 2016. a, b
Viscarra Rossel, R. A. and Behrens, T.: Using data mining to model and interpret soil diffuse reflectance spectra, Geoderma, 158, 46–54, 2010. a, b, c, d, e, f
Viscarra Rossel, R. A. and Bouma, J.: Soil sensing: A new paradigm for agriculture, Agr. Syst., 148, 71–74, 2016. a
Viscarra Rossel, R. A. and Webster, R.: Discrimination of Australian soil horizons and classes from their visible–near infrared spectra, European J. Soil Sci., 62, 637–647, 2011. a
Viscarra Rossel, R. A., Walvoort, D. J., McBratney, A. B., Janik, L. J., and Skjemstad, J. O.: Visible, near infrared, mid infrared or combined diffuse reflectance spectroscopy for simultaneous assessment of various soil properties, Geoderma, 131, 59–75, 2006. a, b
Wagner, B. D., Grunwald, G. K., Zerbe, G. O., Mikulich-Gilbertson, S. K., Robertson, C. E., Zemanick, E. T., and Harris, J. K.: On the Use of Diversity Measures in Longitudinal Sequencing Studies of Microbial Communities, Front. Microb., 9, 1037, https://doi.org/10.3389/fmicb.2018.01037, 2018. a
Walkley, A. and Black, I.: An examination of the Degtjareff method for determining soil organic matter, a proposed modification of the chromic acid titration method, Soil Sci., 37, 29–38, 1934. a
Wehrens, R. and Mevik, B.-H.: The pls package: principal component and partial least squares regression in R, J. Stat. Softw., 18, 1–23, https://doi.org/10.18637/jss.v018.i02, 2007. a
White, T. J., Bruns, T. D., Lee, S. B., and Taylor, J.: Amplification and direct sequencing of fungal ribosomal RNA Genes for phylogenetics, in: PCR Protocols: A Guide to Methods and Applications, edited by: Innis, M., Gelfand, D. H., Sminsky, J. J., and White, T. J., Academic Press, San Diego, USA, 315–323, 1990. a
Wold, S., Sjöström, M., and Eriksson, L.: PLS-regression: a basic tool of chemometrics, Chemometr. Intell. Lab., 58, 109–130, 2001. a
Yang, Y., Viscarra Rossel, R. A., Li, S., Bissett, A., Lee, J., Shi, Z., Behrens, T., and Court, L.: Soil bacterial abundance and diversity better explained and predicted with spectro-transfer functions, Soil Biol. Biochem., 129, 29–38, 2019. a
Yang, Y., Shen, Z., Bissett, A., and Viscarra Rossel, R. A.: Estimating soil fungal abundance and diversity at a macroecological scale with deep learning spectrotransfer functions, SOIL, 8, 223–235, https://doi.org/10.5194/soil-8-223-2022, 2022. a