the Creative Commons Attribution 4.0 License.
the Creative Commons Attribution 4.0 License.
 | 23 Jul 2020
Soil fertility along toposequences of the East India Plateau and implications for productivity, fertiliser use, and sustainability
Peter S. Cornish
Ashok Kumar
Sudipta Das
In common with other undulating landscapes in Asia, wetland rice (Oryza sativa) on the East India Plateau (EIP) was once confined to hydrologic discharge areas or lowlands, but progressive terracing has now allowed rainfed transplanted rice to encroach upon upland recharge areas, with potential effects on both hydrology and soil fertility. Hydrologic variation down the toposequence and its implications for rice production have been well documented but not the variation in soil fertility. Measurements of soil chemical fertility in seven of 24 EIP districts were used to evaluate variation between and within small watersheds stratified down the toposequence into six land classes that reflect hydrology and land use (three with rice and three without; 36 fields per watershed). We aimed to provide a basis for future research to improve the management of soil fertility. Soils overall were acid, with 14 % of fields requiring liming (pH < 5.0) and 44 % requiring management of further acidification (pH 5.0–5.4). Organic carbon (OC, mean 0.9 %) and cation exchange capacity (CEC; mean 10.7 cmolc kg−1) were low. Available phosphorus (P) was mostly very low (mean Bray P 4.3 mg kg−1) and extractable potassium (K) low to marginal (mean 88 mg kg−1). Non-rice soils generally had lower pH, OC, and CEC than rice soils but higher P and K. Amongst rice fields, those higher in the toposequence had lower pH, OC, and CEC but more P and K. These results are discussed in the context of nutrient flows in the landscape, leading to the conclusion that terracing uplands has reduced the delivery of sediment-bound P to lowlands where, even with organic P recycling, low inputs of inorganic fertiliser have led soil P to decline and become the primary constraint to the yield of wet season crops. Soil K is on the same trajectory. P and K fertiliser use must increase substantially to sustain the system, which is a challenge for risk-averse subsistence farmers. Field-specific recommendations are needed despite systematic toposequence differences because of variability between fields within land classes.
- Article
(1890 KB) - Full-text XML
- BibTeX
- EndNote


Much of the rainfed transplanted (lowland) rice (Oryza sativa) in southern and southeastern Asia is grown in toposequences where relatively small differences in elevation can lead to differentiation in hydrological conditions, soil properties, and often yield (Homma et al., 2003; Fuwa et al., 2007; Tsubo et al., 2007; Boling et al., 2008; Cornish et al., 2010, 2015a). These toposequence studies agree on the hydrologic changes down the toposequences but draw varying conclusions about soil fertility. They have all included relatively few locations, so site-specific factors may have determined the varying outcomes.
The present larger study of fertility down the toposequence involved seven watersheds on the East India Plateau (EIP), which rises south of the eastern Indo-Gangetic Plain and west of the coastal plain of the Bay of Bengal. The study built on hydrologic measurements and agronomic experiments in two case study watersheds, including water balance modelling that demonstrated the regional applicability of hydrologic differentiation in the landscape (Cornish et al., 2015a). A geographically broader evaluation of soil chemical fertility is required before extending the agronomic findings of Cornish et al. (2015b) regionally.
Transplanted rice on the EIP was once confined to hydrologic discharge areas or lowlands (Fig. 1). Mid-slopes and uplands are hydrologic recharge areas. Population pressure has led to hill slopes being terraced and bunded for transplanted rice, starting with foot slopes (medium lowland) and progressing to mid-slopes (medium upland) that now comprise the main rice area (Cornish et al., 2015a). Terracing permits lowland (wetland) rice technology to be used in uplands.
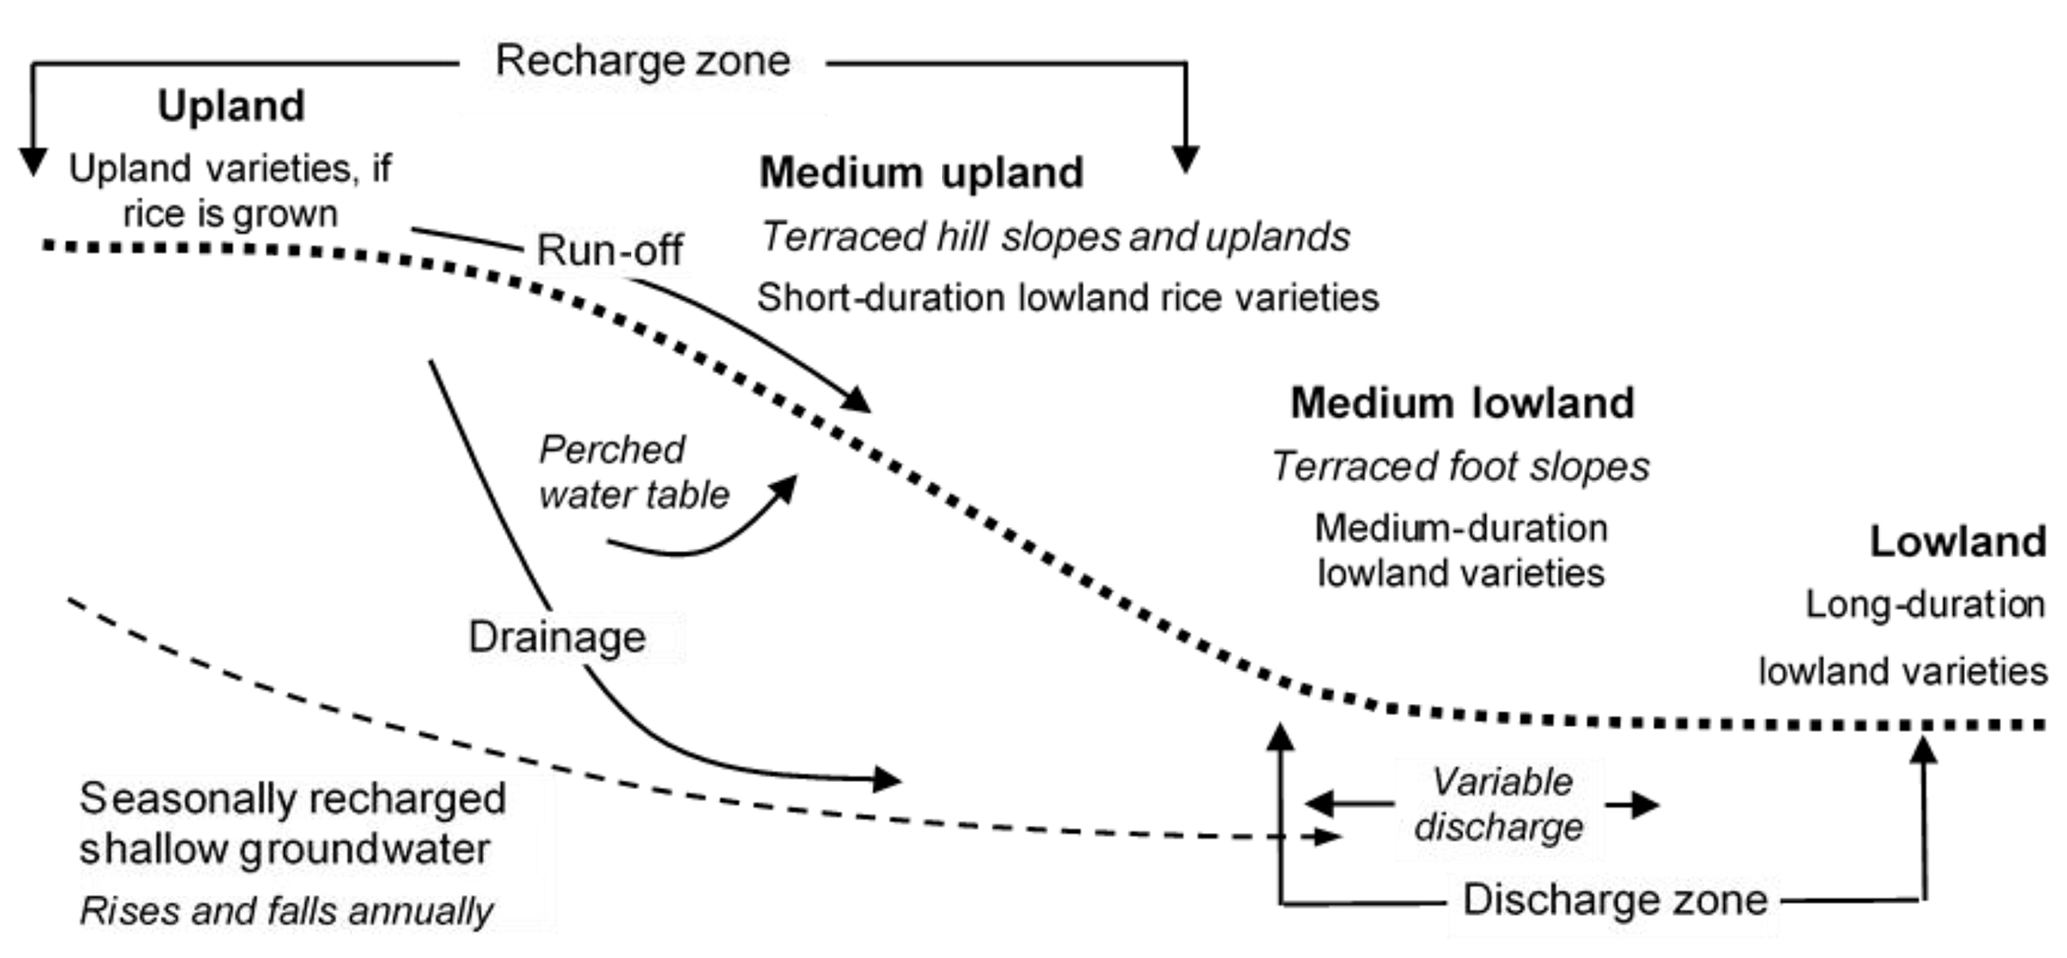
Figure 1EIP landscape schematic (after Cornish et al., 2015a). Vertical relief is typically 2–100 m and toposequence length 0.5–5 km. Discharge areas may be defined drainage lines, ill-defined low-lying areas, or ephemeral streams. Medium lowland is a discharge area in wetter years only. Lowlands receive both run-off and discharge and historically have been used for lowland rice. Terraced and bunded foot slopes and hill slopes comprise around 80 % of the present EIP rainfed rice area. Uplands may be categorised into several classes depending on the potential for crops (see text). Upland (non-transplanted) rice is uncommon.
Rice yield improvement on the EIP has been slow, with paddy yields for 2011–2015 averaging <1.9 t ha−1 (IRRI, 2019a). This is despite high precipitation (1100–1600 mm yr−1) and good agricultural potential (Sikka et al., 2009). The reasons for the low yield have received relatively little attention, but recent on-farm research and water balance modelling revealed that flooding requirements for transplanted rice are often not met on medium uplands, leading to frequent yield reductions and recurring crop failure (Cornish et al., 2015a). However, on this same land class, there is adequate soil water in all years for monsoon season crops that do not require ponding, including dry bed direct-seeded rice and vegetables (Cornish et al., 2015b). Hence, there is significant potential to raise rice yields and to diversify crops on land unsuited to transplanted rice. These authors observed that good nutrition would be needed to capture the opportunities provided by rainfall. However, fertiliser inputs are presently low in this region compared with elsewhere in India (FAO, 2005; Anonymous, 2013).
Soils of the EIP are often said to be acid and infertile (Edmonds et al., 2006; Sikka et al., 2009). These generalisations are based on 1:50 000 scale soil maps that sometimes include summaries of field data (Government of Jharkhand, 2020) and a small number of village-scale research studies (Itfikar et al., 2010; Cornish et al., 2010). Large-scale maps reflect the underlying geology and regional topography, but they do not reflect the local topography or the results of terracing and varying histories of rice culture. Any soil sampling behind the maps is grid based and not designed to identify topographic or land-use effects. Hence, the available maps inadequately reflect the current status of soil fertility in these landscapes. A more nuanced understanding of soil fertility and its variation in the landscape is needed to complement large-scale maps and to inform improved crop nutrient management, for example with fertiliser guidelines based on topographic position as Boling et al. (2008) and Homma et al. (2003) suggest.
This paper reports a study of soil fertility in six of the 24 districts in Jharkhand and one in western West Bengal. Earlier research in the Purulia district, West Bengal (Cornish et al., 2010), led to a focus on soil pH, organic carbon (OC), cation exchange capacity (CEC), and the macronutrients phosphorus (P) and potassium (K) as indicators of chemical fertility. Our aims were to test the hypothesis that toposequence position affects soil fertility and to provide a basis for future research and extension to improve the management of soil fertility and plant nutrition. We also examined if fertiliser recommendations could be tailored usefully to topographic position.
The East India Plateau (EIP) or Chota Nagpur Plateau is a series of plateaus, hills, and valleys in an undulating landscape with an average elevation ∼500 m and occasional higher peaks. It comprises much of the state of Jharkhand and parts of Chhattisgarh, West Bengal, Bihar, and Odisha and is classified as agroecological zone 12, a hot subhumid ecoregion with red and lateritic soils (FAO, 2005). The EIP has an area of 65 000 km2 with a population of ∼40 million people, 70 % of whom are farmers with <1 ha land fragmented into small fields along the toposequence. The region is predominantly low-input–low-output subsistence farming. Monoculture rice is grown in a rice–fallow system, although Cornish et al. (2015b) have demonstrated the potential to intensify cropping with a range of crops following rice in the non-rainy season.
The Government of Jharkhand (2020) provides a broad description of the physiography and geology of all districts, with summaries of soil properties based on 1.5 km grid samples. Soil parent materials are primarily igneous (granite) and metamorphic (gneiss and schist) rocks, with colluvium in valley floors. The soils are primarily hyperthermic and classified as moderately developed Alfisols, slightly developed Inceptisols, or undeveloped Entisols. Where rice is grown, soils could be classified as “Anthroposols” because of the cutting and filling associated with terracing and the subsequent effects of wet tillage and ponding on soil profile characteristics.
2.1 Site locations
Seven districts of the EIP were selected to represent variations in underlying geology and to give a wide geographic spread across Jharkhand and adjacent West Bengal. These were Godda and Dumka to the northeast of the capital of Jharkhand (Ranchi), Khunti and West Singhbhum to the south, Gumla to the east, and Lohardaga to the northeast of Ranchi. A further location was Bankura in West Bengal, to the east of previous sampling in the Purulia district (Cornish et al., 2010). Site selection within these districts was constrained by security issues, the need for reasonable access, and the desirability of having collaborating farmers to assist with local knowledge, field work, and interpretation of results. This effectively meant that sampling was constrained to villages where the non-governmental organisation Professional Assistance for Development Action (PRADAN) had a presence. Within each district, a micro-watershed, typically <5 km2, was selected following negotiations with local villagers.
2.2 Sampling
A stratified random sample of fields was taken within each watershed based on an assessment of local hydrology made together with villagers who recognise hydrologically distinct land classes and manage them accordingly, e.g. by choosing appropriate rice varieties (Fig. 1). Land classes include lowlands, medium lowlands, medium uplands, and uplands. Uplands are further categorised as (i) land near the homestead to which harvested materials are generally taken (this land may be cropped with vegetables), (ii) arable land near medium upland that is unsuitable for rice but may be suitable for other rainfed crops, and (iii) non-arable upland that is unsuitable for any crops and is usually grazed as common land. Non-arable upland may be too shallow or stony for crop production, under forest, or degraded by overgrazing and soil erosion. Degraded areas in the non-arable uplands were avoided. Non-degraded non-arable uplands provide an indication of inherent soil fertility because they have not been subjected to nutrient removal through cropping or extensive soil erosion that is evident on degraded uplands.
Fields were sampled in May 2010 prior to the monsoon. Six fields were selected at random within each of the six land classes in all seven watersheds, leading to a total of 252 fields. Care was taken to avoid fields located near trees or with other obvious anomalies. In each field, soil was sampled along a z-shaped transect at four locations from the vertical face of a hole dug to 100 mm depth. These samples were bulked and air-dried for later analysis at the Indian Institute of Soil Science (IISS), Bhopal.
Soil sampling in India is most commonly up to 150 mm, but in our experience primary tillage on the EIP is still undertaken with animals and is rarely deeper than 100 mm. We considered that deeper sampling would risk diluting the nutrient-enriched surface layer, resulting in unreasonably low values.
We did not have the resources to evaluate soil pH down the soil profiles, but unpublished data for soil profile pH are presented from the site of previous studies in the Purulia district (Cornish et al., 2010). A total of 54 rice fields along the toposequence were sampled, with a single 100 mm auger hole in the centre of each field in increments of 0–10, 10–30, 30–60, and 60–90 cm.
2.3 Soil analysis
For quality assurance, a subset of 30 samples was first provided “blind” to three laboratories for comparative analysis, before settling on IISS, Bhopal. Organic carbon (OC) was determined by the Walkley and Black (1934) method, cation exchange capacity (CEC) by Blakemore et al. (1987; only three of the six fields per watershed and/or land class), and pHw by glass electrode in a 1:5 water suspension. Plant-available soil P was analysed by the Bray-1 method (Bray and Kurtz, 1945). In India, the use of Bray-1 is confined to soils with pHw<7.2. A small number of samples had pHw>7.2 but none were calcareous. Exchangeable soil K was estimated by flame photometer after neutral normal ammonium acetate extraction (Spencer and Govaars, 1982), and the values (cmolc kg−1) were multiplied by 390 to arrive at extractable K (mg kg−1; Peverill et al., 1999). Available nitrogen (N) is agronomically important, but it was not assessed as it is universally very deficient without N fertiliser. According to the Government of Jharkhand (2020), boron (B) and sulfur (S) may be deficient in some soils but they were not assessed.
2.4 Design and analysis
The experimental design was a randomised complete block with subsampling (Steele and Torrie, 1980; Tangren, 2002), where watersheds were the blocks, land classes were the treatments, and subsamples were the fields within the land class. One-way analyses of variance (ANOVA) was also undertaken of individual watersheds across land classes and for individual land classes across watersheds. These analyses provided the standard errors (SEs) in tables of treatment means. Means and SEs are tabulated without applying statistical comparisons to individual means, following Riley (2001). The analysis of variance used S-Plus 6. Data were summarised in box plots using Excel in Office Professional Plus (2016), with the median and four quartile values from minimum to maximum shown by horizontal bars, the mean by an “x”, and outliers (>1.5× the interquartile range above the upper quartile and below the lower quartile) shown as open circles. Separate box plots were constructed for the combined non-rice and combined rice fields. Data for non-rice and rice fields were also compared using t tests in Excel.
For all analytes, the overall ANOVA revealed significant (P<0.01) main effects for blocks (watershed) and treatments (land class) and a significant (P<0.01) interaction. Watershed differences appeared to reflect differences in underlying geology, resulting in generally higher pH at Godda, lower pH and CEC at Khunti, and higher K at Gumla.
3.1 Soil pH
Surface soil pHw was generally low (Table 1) but not universally so. The variation in pHw was striking, ranging in non-rice fields from 4.35 to 6.34 and in rice fields from 4.44 to 7.77 (Fig. 2a). Non-rice upland soils on average were more acid than rice soils (mean pHw 5.35 vs. 5.72; P<0.01).
Table 1Soil pHw in seven EIP watersheds. Values are the mean of six fields, and SE is the standard error.
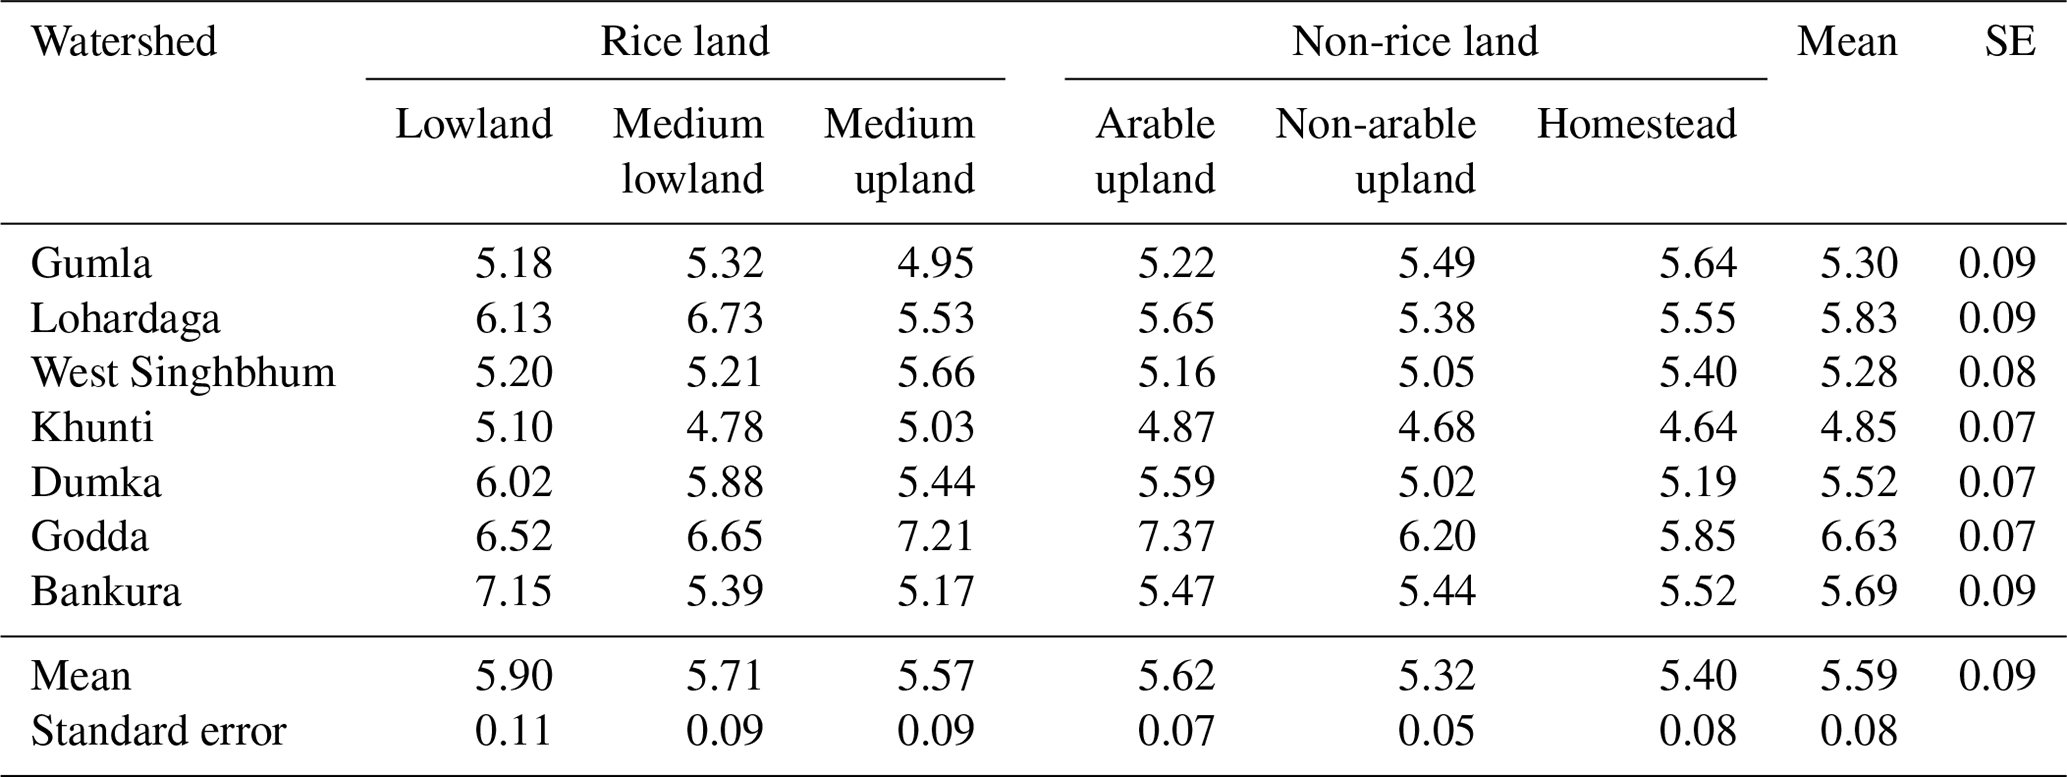
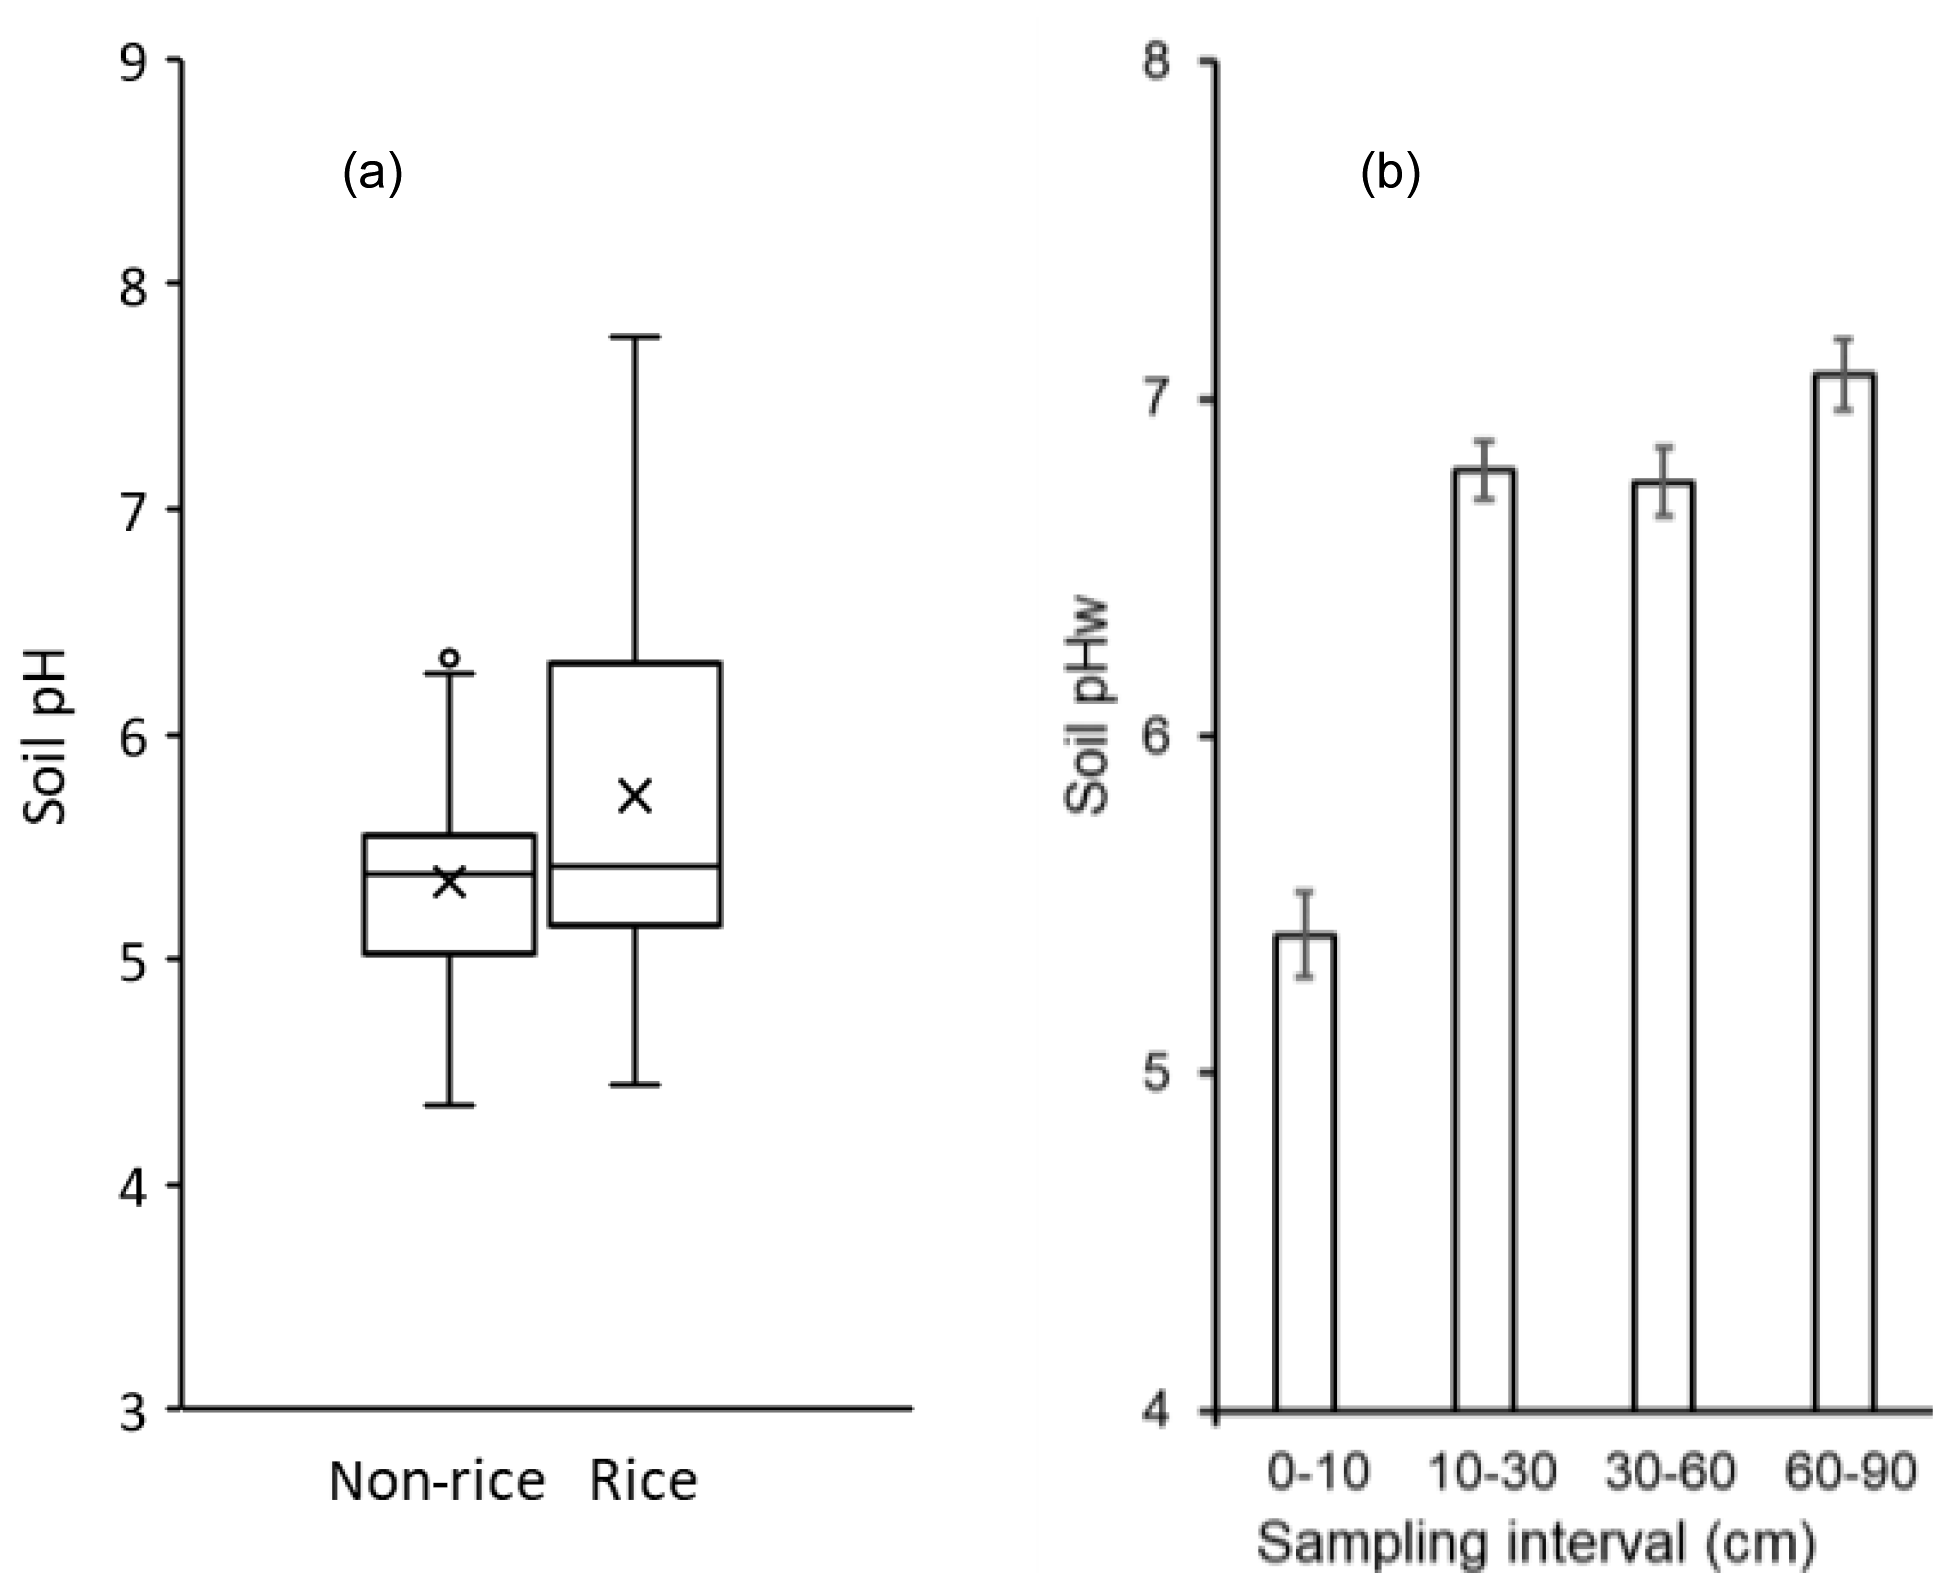
Figure 2Soil pHw in (a) surface soil across seven EIP watersheds and (b) the mean of 54 rice field soil profiles at the Purulia district (bars are standard errors of means).
Only 17 % of non-rice soils and 10 % of rice soils had a pHw<5.0 that would be classified as strongly acid. Multiple effects on crop growth occur at pHw<5.0 and remediation with lime should be considered (Peverill et al., 1999). Lowland rice may not require liming because the pH shifts towards neutrality with flooding (Seng et al., 2006), but rice land may still need liming if rice is followed by a non-flooded crop. A further 45 % of non-rice fields and 43 % of rice fields were in the range pHw 5.0–5.4, which is low enough to hamper some acid-sensitive crops.
Amongst rice soils, there was a trend towards higher pHw down the toposequence (Table 1), although less so than for the surface soil at Purulia (Cornish et al., 2010). The trend was consistent across watersheds, with the exception of West Singhbhum, where medium upland was inexplicably less acid than elsewhere in the watershed.
The results for soil profile pHw in rice fields at Purulia reveal an increase from pHw 5.4 in surface soil to pHw 7.1 in subsoil (Fig. 2b). If this result is regionally representative, then any remediation of soil acidity will concern only surface soil.
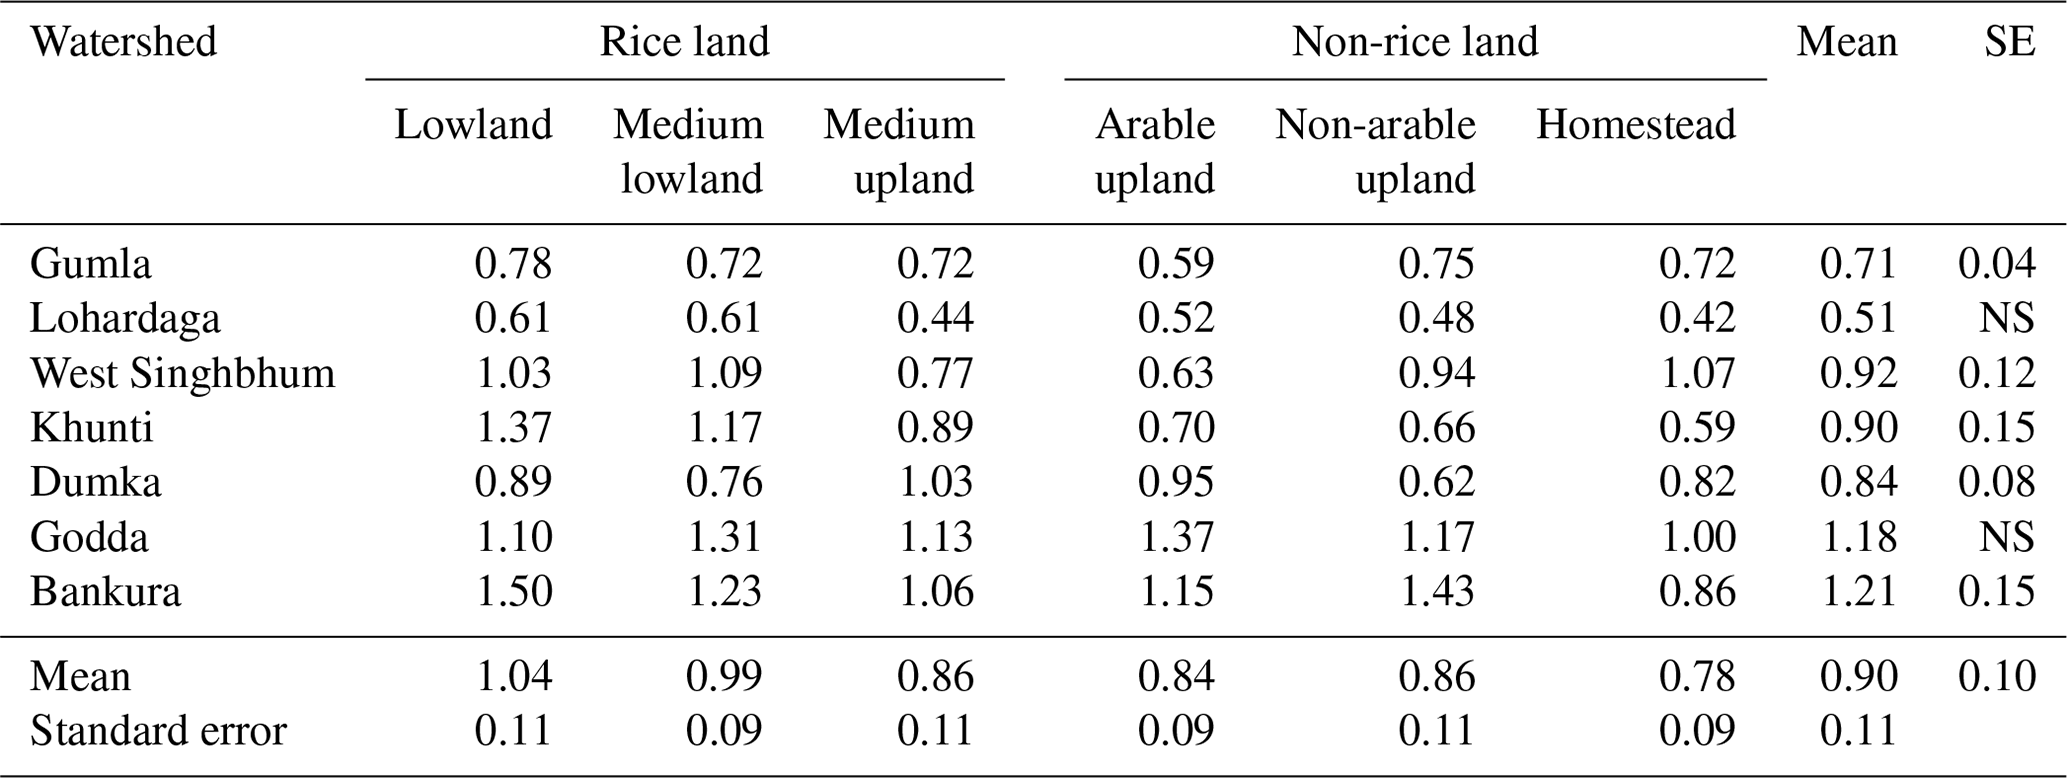
3.2 Soil organic carbon
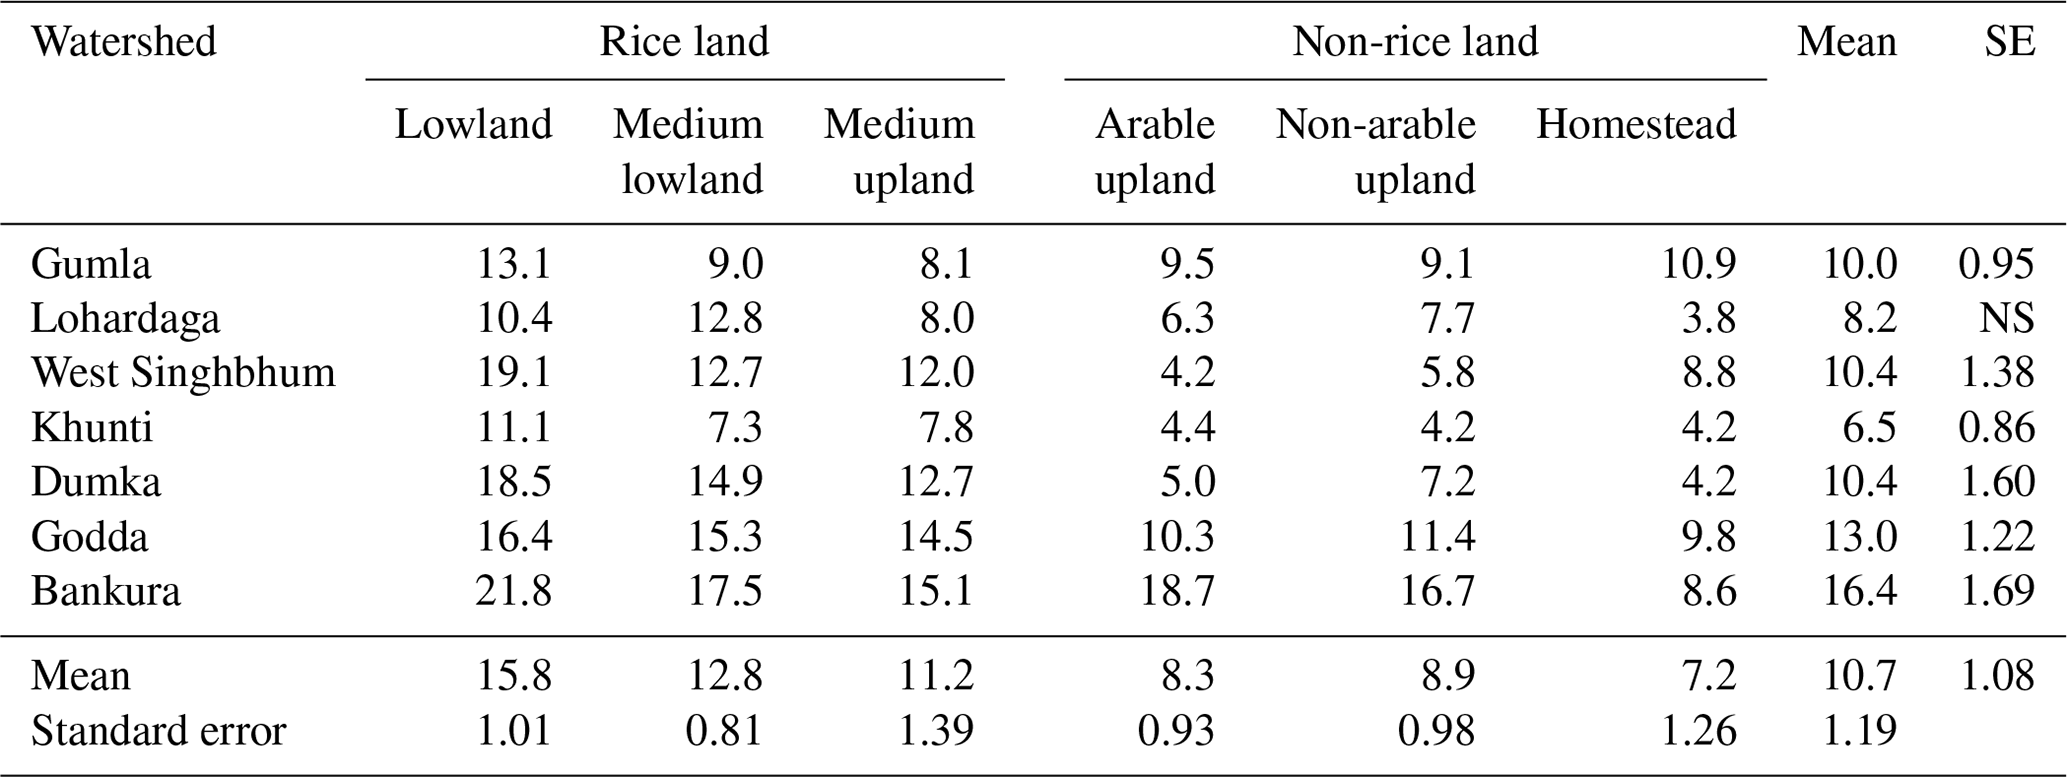
Mean OC in the surface soils of the seven EIP watersheds was 0.9 %, with a range among watersheds of 0.5 %–1.2 % (Table 2). These values are towards the lower end of OC reported globally for non-arid areas (FAO and ITPS, 2018). However, they are comparable to soil surveys in the region which classify them as medium to high in OC (Government of Jharkhand, 2020).
Table 2Organic carbon (%) in seven EIP watersheds.
NS – no significant treatment effect (P≥0.05).
Higher OC is associated with greater nutrient availability, structural stability, and water-holding capacity (Peverill et al., 1999). Critical values for OC are hard to define, although Kay and Angers (1999) suggest that surface soil OC < 1 % may constrain yields to less than the potential based on rainfall. Five of the EIP watersheds had OC ≤ 1 % through most of the toposequence.
The OC content of non-arable uplands was close to each watershed mean, despite these being relatively undisturbed, uncultivated areas where we expected to have amongst the highest OC in each watershed. Homestead lands also had no greater OC than elsewhere, despite homesteads being the destination for all harvested materials, including crop residues (refer to Sect. 4.2). Rice soils had higher mean OC than non-rice soils (0.96 vs. 0.83 %; P<0.01), but there was substantial variation (Fig. 3a). Amongst rice soils, there was a trend towards OC increasing down the toposequence (Table 2).
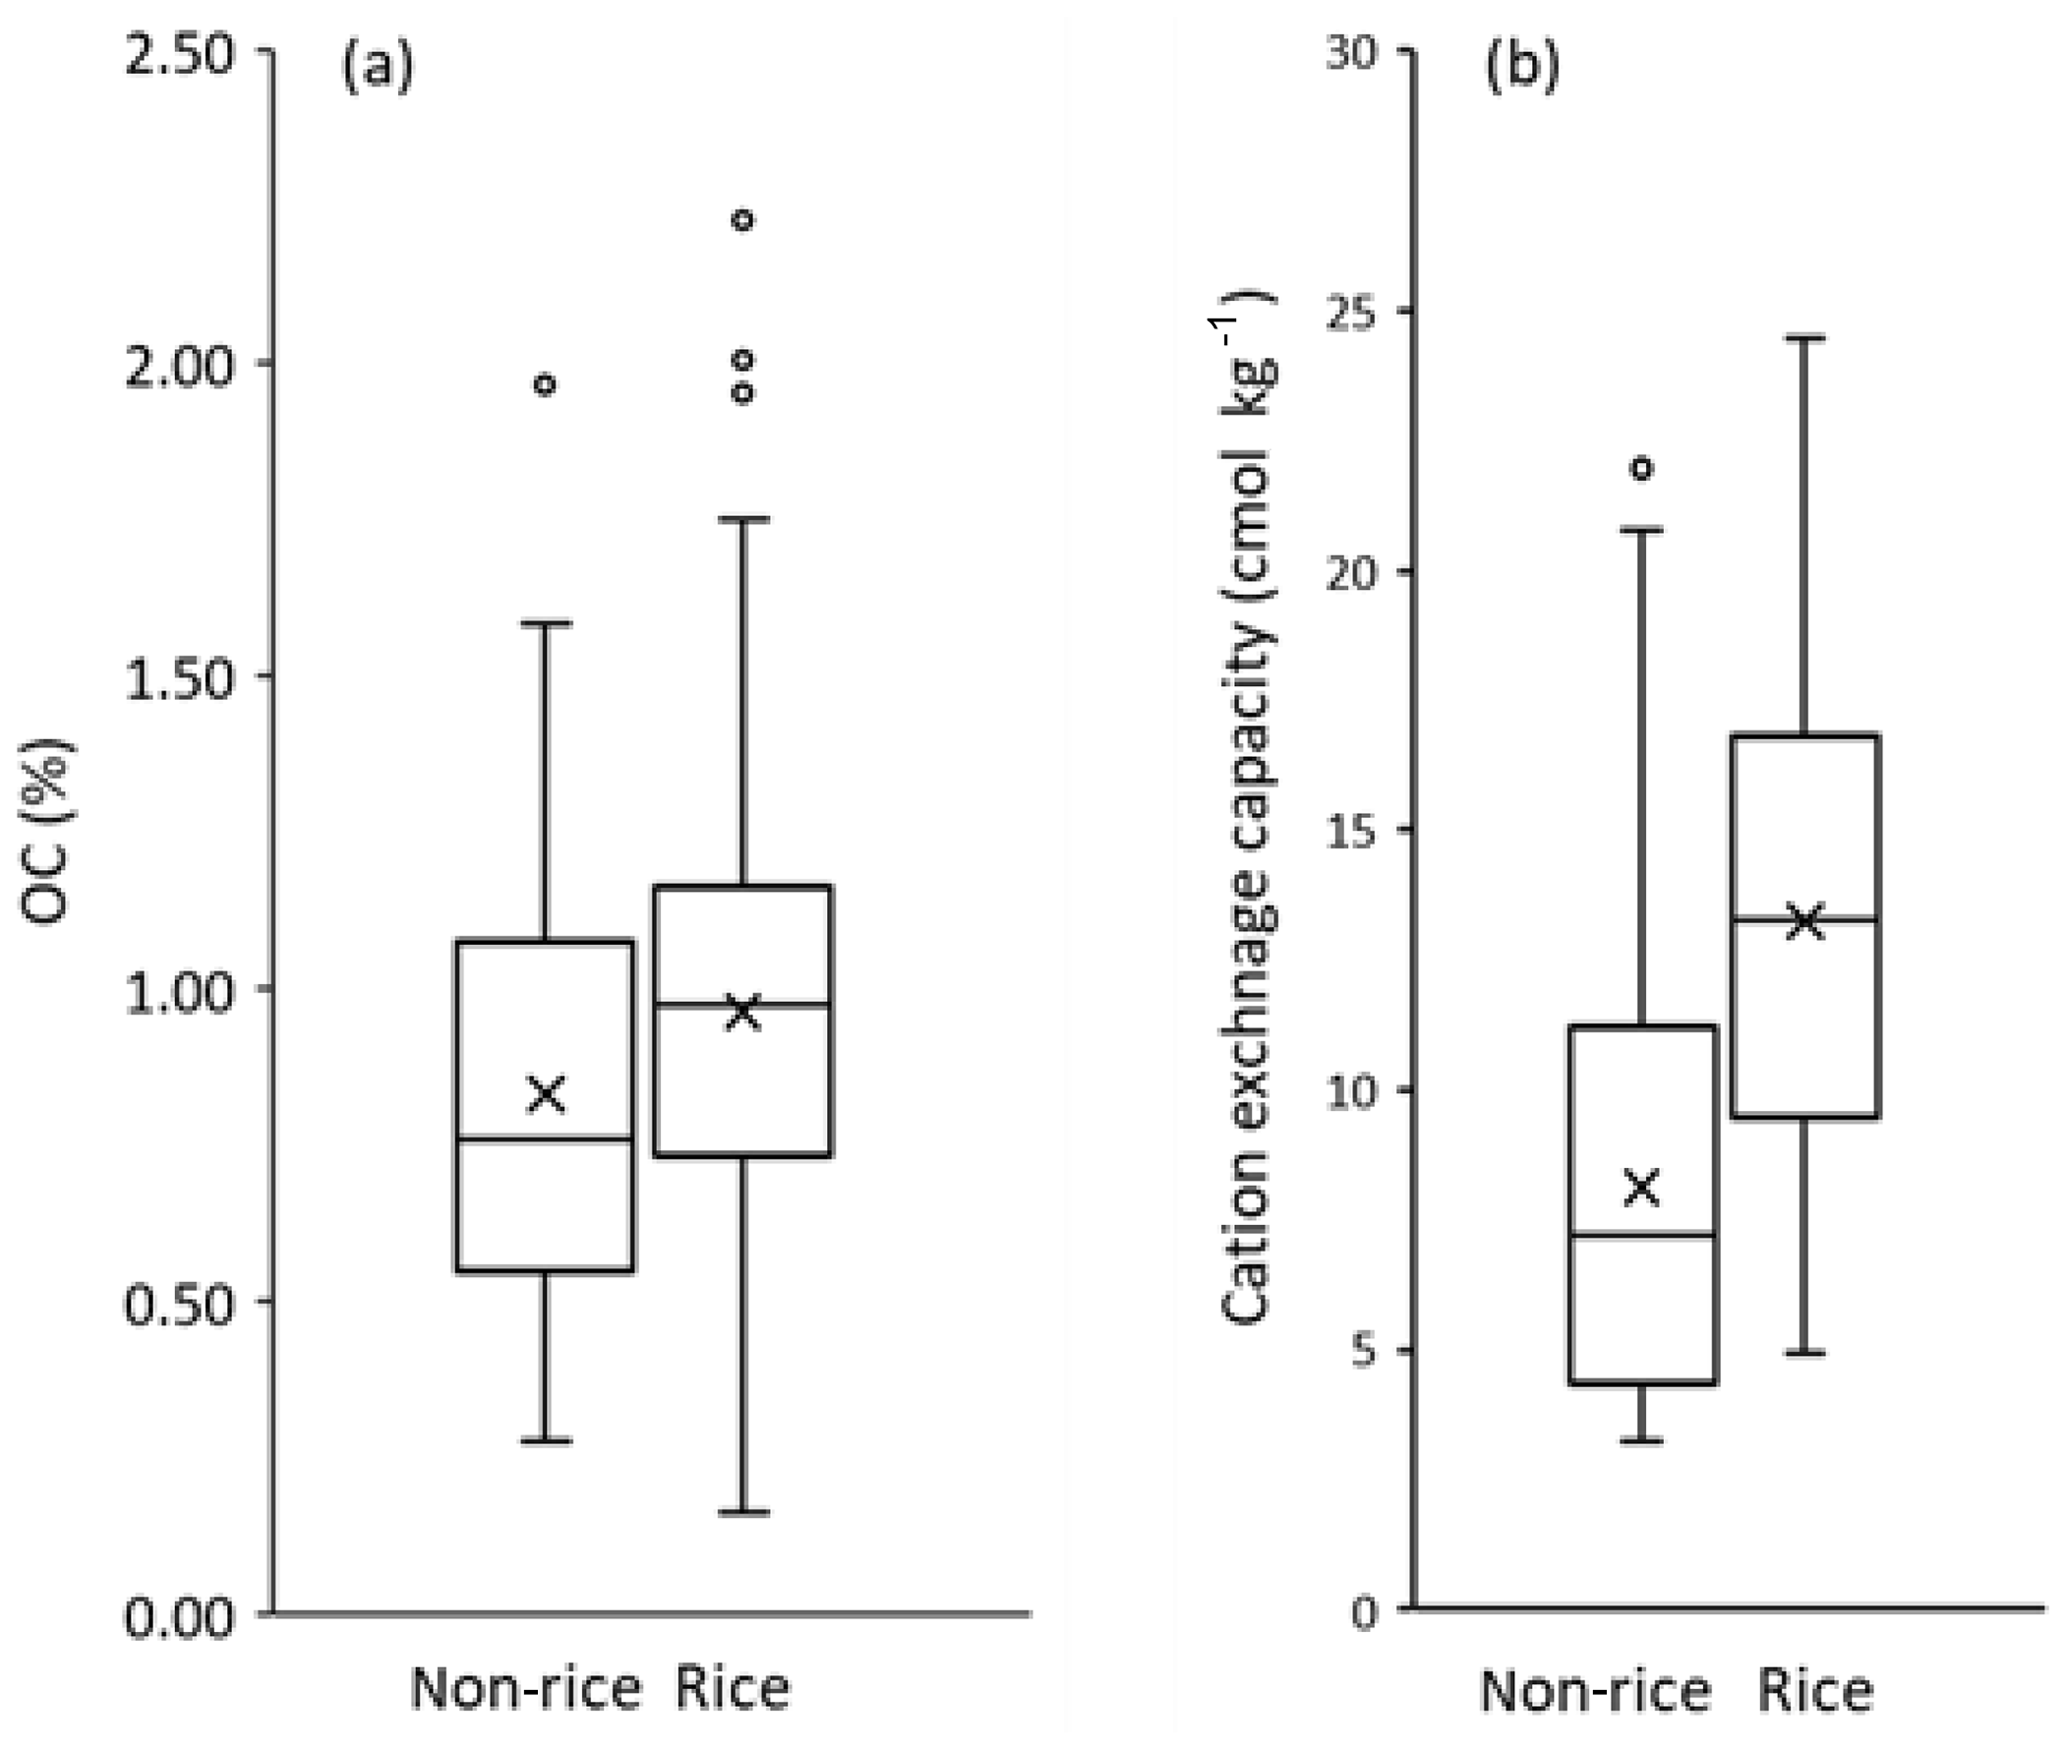
Figure 3(a) Soil organic carbon and (b) cation exchange capacity across seven EIP watersheds.
3.3 Cation exchange capacity (CEC)
Mean CEC over all fields was 10.7 cmolc kg−1, but it varied among watersheds from lows of 6.5 and 8.2 cmolc kg−1 at Khunti and Lohardaga, to a high at Bankura of 16.4 cmolc kg−1 (Table 3). The mean CEC of soils used for rice production (13.3 cmolc kg−1) was substantially higher (P<0.01) than for non-rice soils (8.1 cmolc kg−1; Fig. 3b), and the CEC of rice soils increased substantially down the toposequence (Table 3).
Table 3Cation exchange capacity (cmolc kg−1) of soils in seven EIP watersheds.
NS – no significant treatment effect (P≥0.05).
CEC is important as it influences nutrient (cation) retention and provides a buffer against soil acidification (Ketterings et al., 2007). To put the EIP values into perspective, most agricultural soils fall in a range between 2 and 40 cmolc kg−1, with CEC increasing with clay fraction, organic matter concentration, and pH (Peverill et al., 1999).
CEC across the seven watersheds increased significantly with OC (R2=0.45; P<0.01) and (weakly) with pHw (R2=0.22; P<0.05; Fig. 4), explaining much of the variation in CEC of rice-growing land (Fig. 3b).
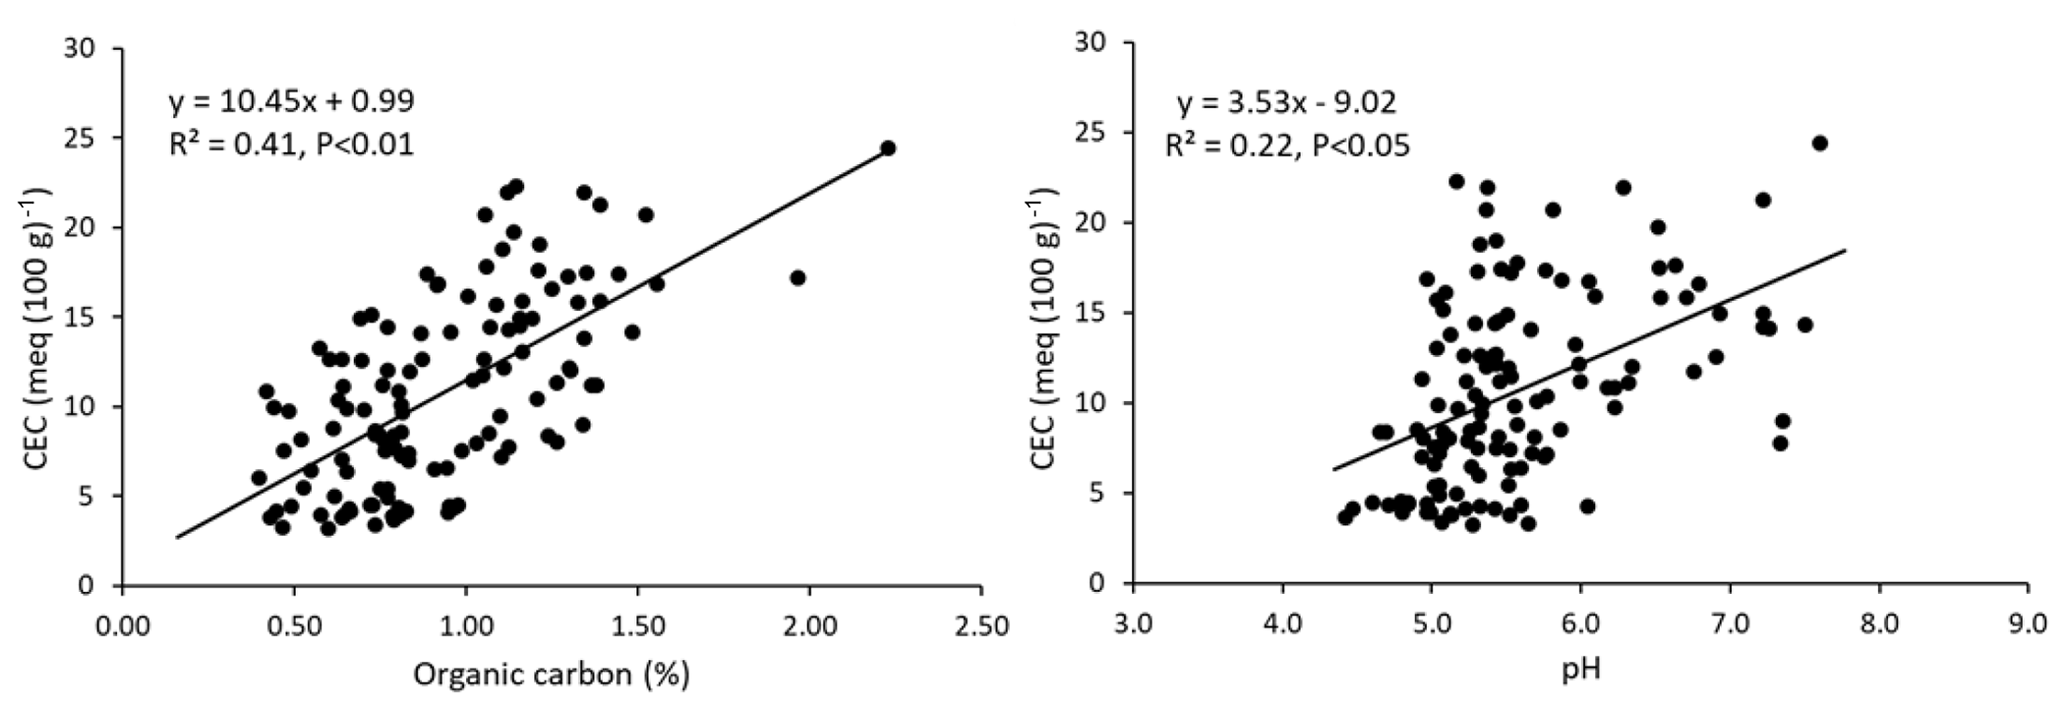
Figure 4The relationship between cation exchange capacity and organic carbon and pH in soils across seven EIP watersheds.
3.4 Available phosphorus
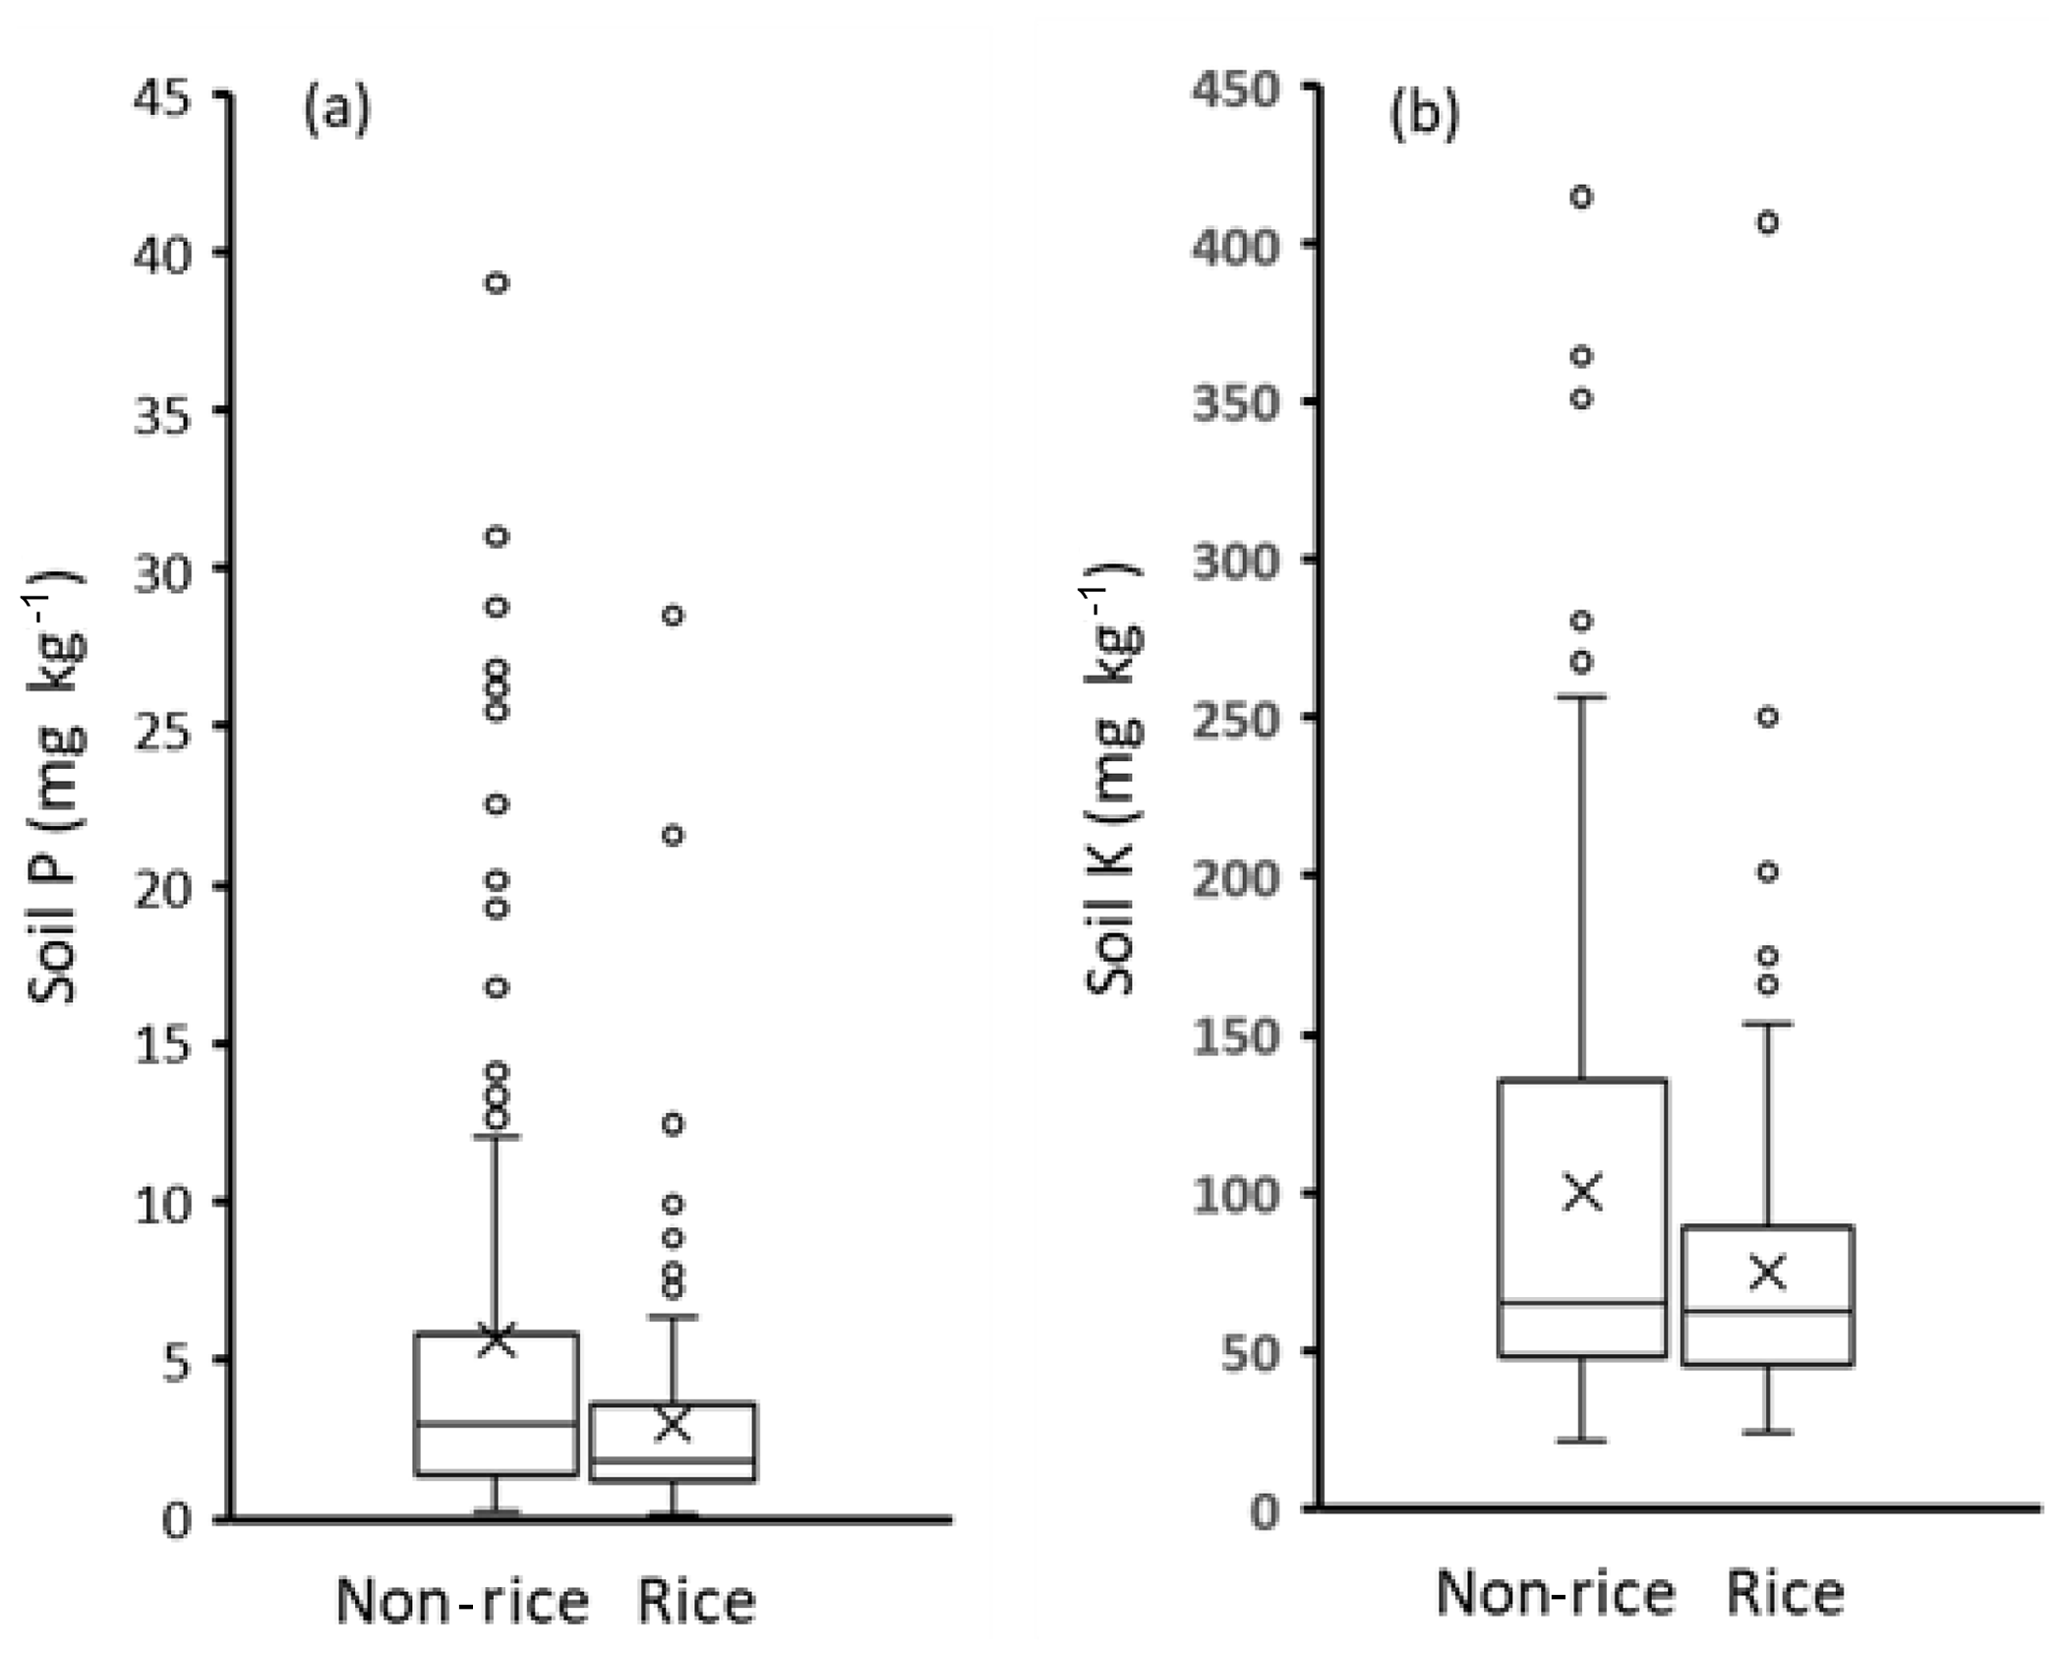
The mean concentration of available soil P averaged 4.3 mg kg−1 over all watersheds and land classes (Table 4). We expected higher soil P (and OC and CEC) in the absence of cultivation in non-arable uplands, but this was not the case, with mean P of only 3.2 mg kg−1. As with other soil fertility indicators, the results for soil P were highly variable, even within the land class. Soil P values overall varied from not detectable to 6.4 mg kg−1, excluding statistical outliers with up to 29 mg kg−1 (Fig. 5a).
Table 4Available soil P (Bray P; mg kg−1) in seven EIP watersheds.

NS – no significant treatment effect (P≥0.05).
Concentrations of P were highest in the arable uplands of Dumka and Godda and, less so, the homestead lands of Gumla and West Singhbhum and the medium uplands at West Singhbhum and Bankura. The relatively higher concentrations were found in small areas where maize (Zea mays) or vegetables were grown in the monsoon cropping season. This included two fields in medium upland in West Singhbhum and Bankura that had recently been converted from rice to vegetables. Maize and vegetables are generally fertilised with diammonium phosphate (DAP) or a compound fertiliser containing N, P, and K.
Available P in rice fields tended to decrease lower in the toposequence (Table 4). In lowlands, the area traditionally used for rice, the P concentration was 1.4 mg kg−1 across watersheds. Over all the rice fields, 75 % had P values < 3.6 mg kg−1 (Fig. 5a).
Crops respond to P fertiliser when Bray P is less than around 10 mg kg−1 for flooded rice and 20 mg kg−1 for other crops (Bado et al., 2008; Dodd and Mallarino, 2005; Mallarino et al., 2013; Sahrawat et al., 1997). When <5 mg kg−1, wetland rice yields, without fertiliser, may be less than a third of potential (Bado et al., 2008). The values for Bray P in Table 4 suggest that all crops grown anywhere in the landscape (except arable uplands at Godda and Dumka) will be very highly responsive to P fertiliser, even with the lower critical value for rice under flooded conditions (Seng et al., 2007). In short, these soils are almost universally acutely deficient in P. This is supported by limited on-farm research in the Purulia district of the eastern EIP showing large responses to P fertiliser in rice (Cornish et al., 2010) and even larger responses in mustard (Brassica juncea) and wheat (Triticum aestivum) following rice, where yields without P fertiliser were <10 % of well-fertilised fields (Cornish et al., 2015b).
3.5 Extractable soil potassium
The mean extractable K concentration was 88 mg kg−1. This varied among watersheds, from 50 to 164 mg kg−1, and among land classes, from 64 mg kg−1 in lowland to 128 mg kg−1 in arable upland (Table 5). Concentrations were highest in arable uplands in Khunti, Dumka, and Godda, homestead lands at Gumla, and medium upland at West Singhbhum (skewed by one high field). This pattern mirrored available soil P and, as previously noted, may reflect the use of fertilisers on maize and vegetables. Non-rice fields overall had more K than rice fields (100 vs. 75 mg kg−1; P<0.01; Fig. 5b). The K in rice fields generally decreased lower in the toposequence. The outliers in the non-rice fields in Fig. 5b were almost all associated with arable uplands at Godda, where high K seems to be a feature of this land class for unknown reasons (Table 5).
Table 5Extractable K (mg kg−1) in seven EIP watersheds.
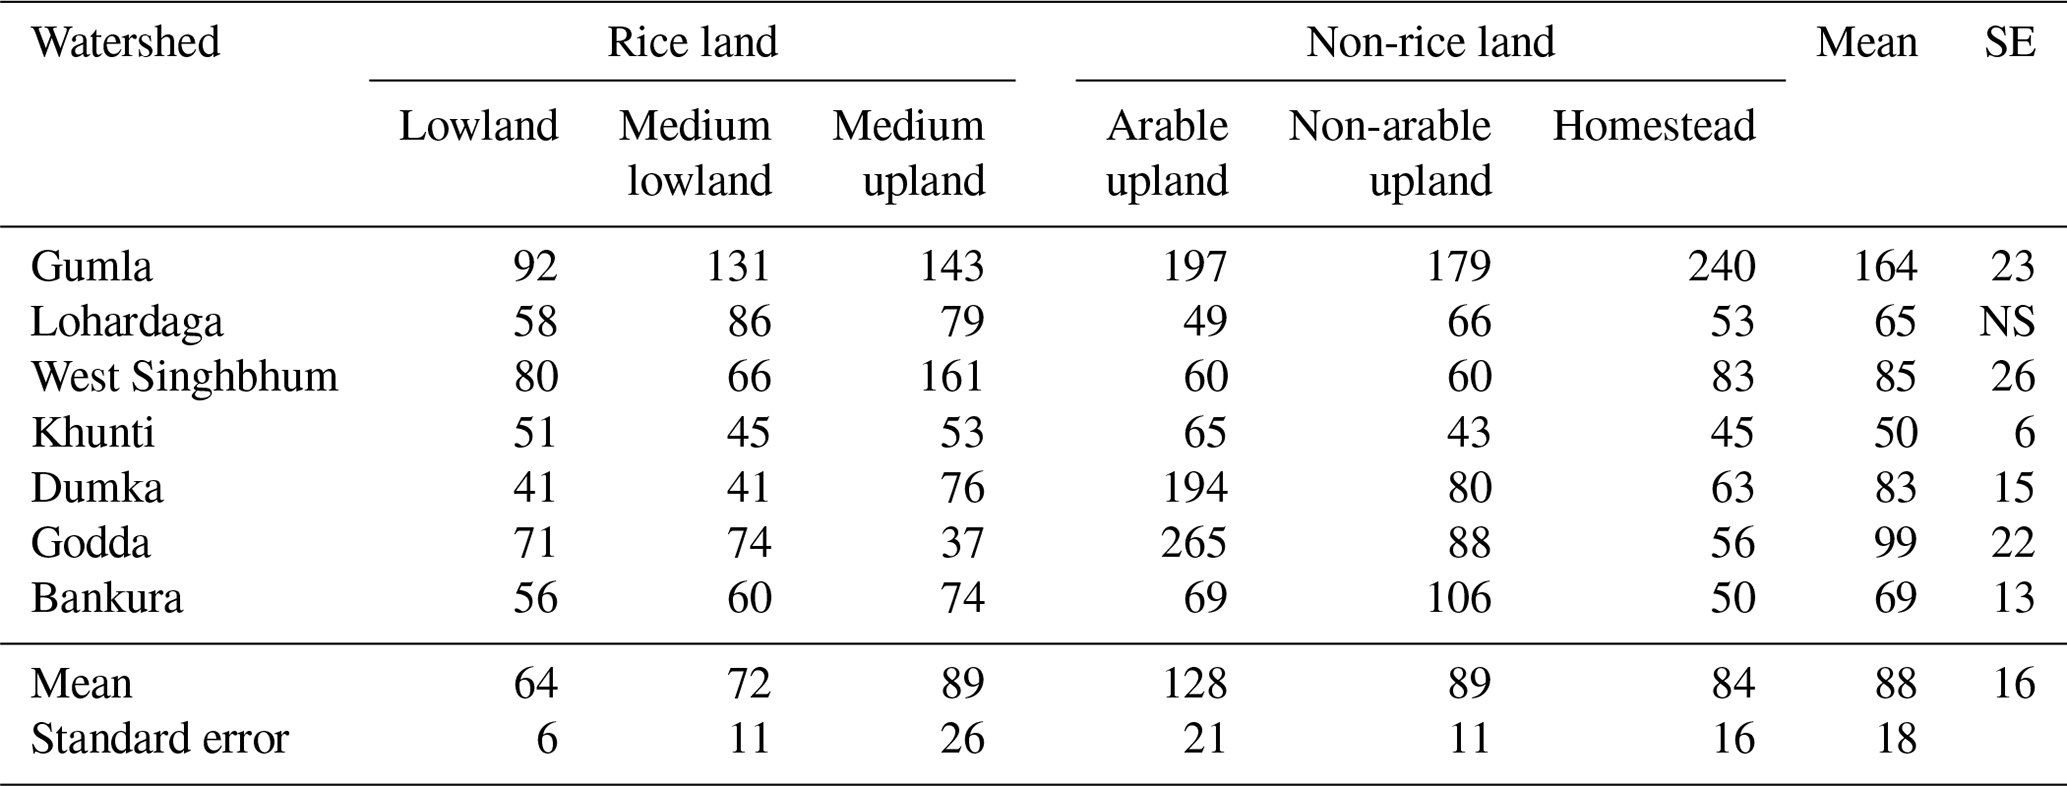
NS – no significant treatment effect (P≥0.05).
The data show large variation within and between watersheds, with half of all fields having less than ∼ 60 mg K kg−1. The significance of these values depends on the critical values used for interpretation. These depend on the extractant, soil type, sampling depth, crop species, and crop demand for K. Peverill et al. (1999) suggest categories of low (<80 mg kg−1), medium (80–200 mg kg−1), and high (>200 mg kg−1) but highlight the poor predictive power of soil K tests. A review of Australian field experiments suggests a critical value closer to 50–60 mg kg−1 for moderately acid soils based on bicarbonate-extractable K (Brennan and Bell, 2013). On this basis, extractable K would be low to marginal except for Gumla, the medium upland in West Singhbhum (skewed by one outlier), and arable uplands in Godda and Dumka.
The only significant relationship between any of the indicators was between P and K and it was weak (R2=0.34; Fig. 6).
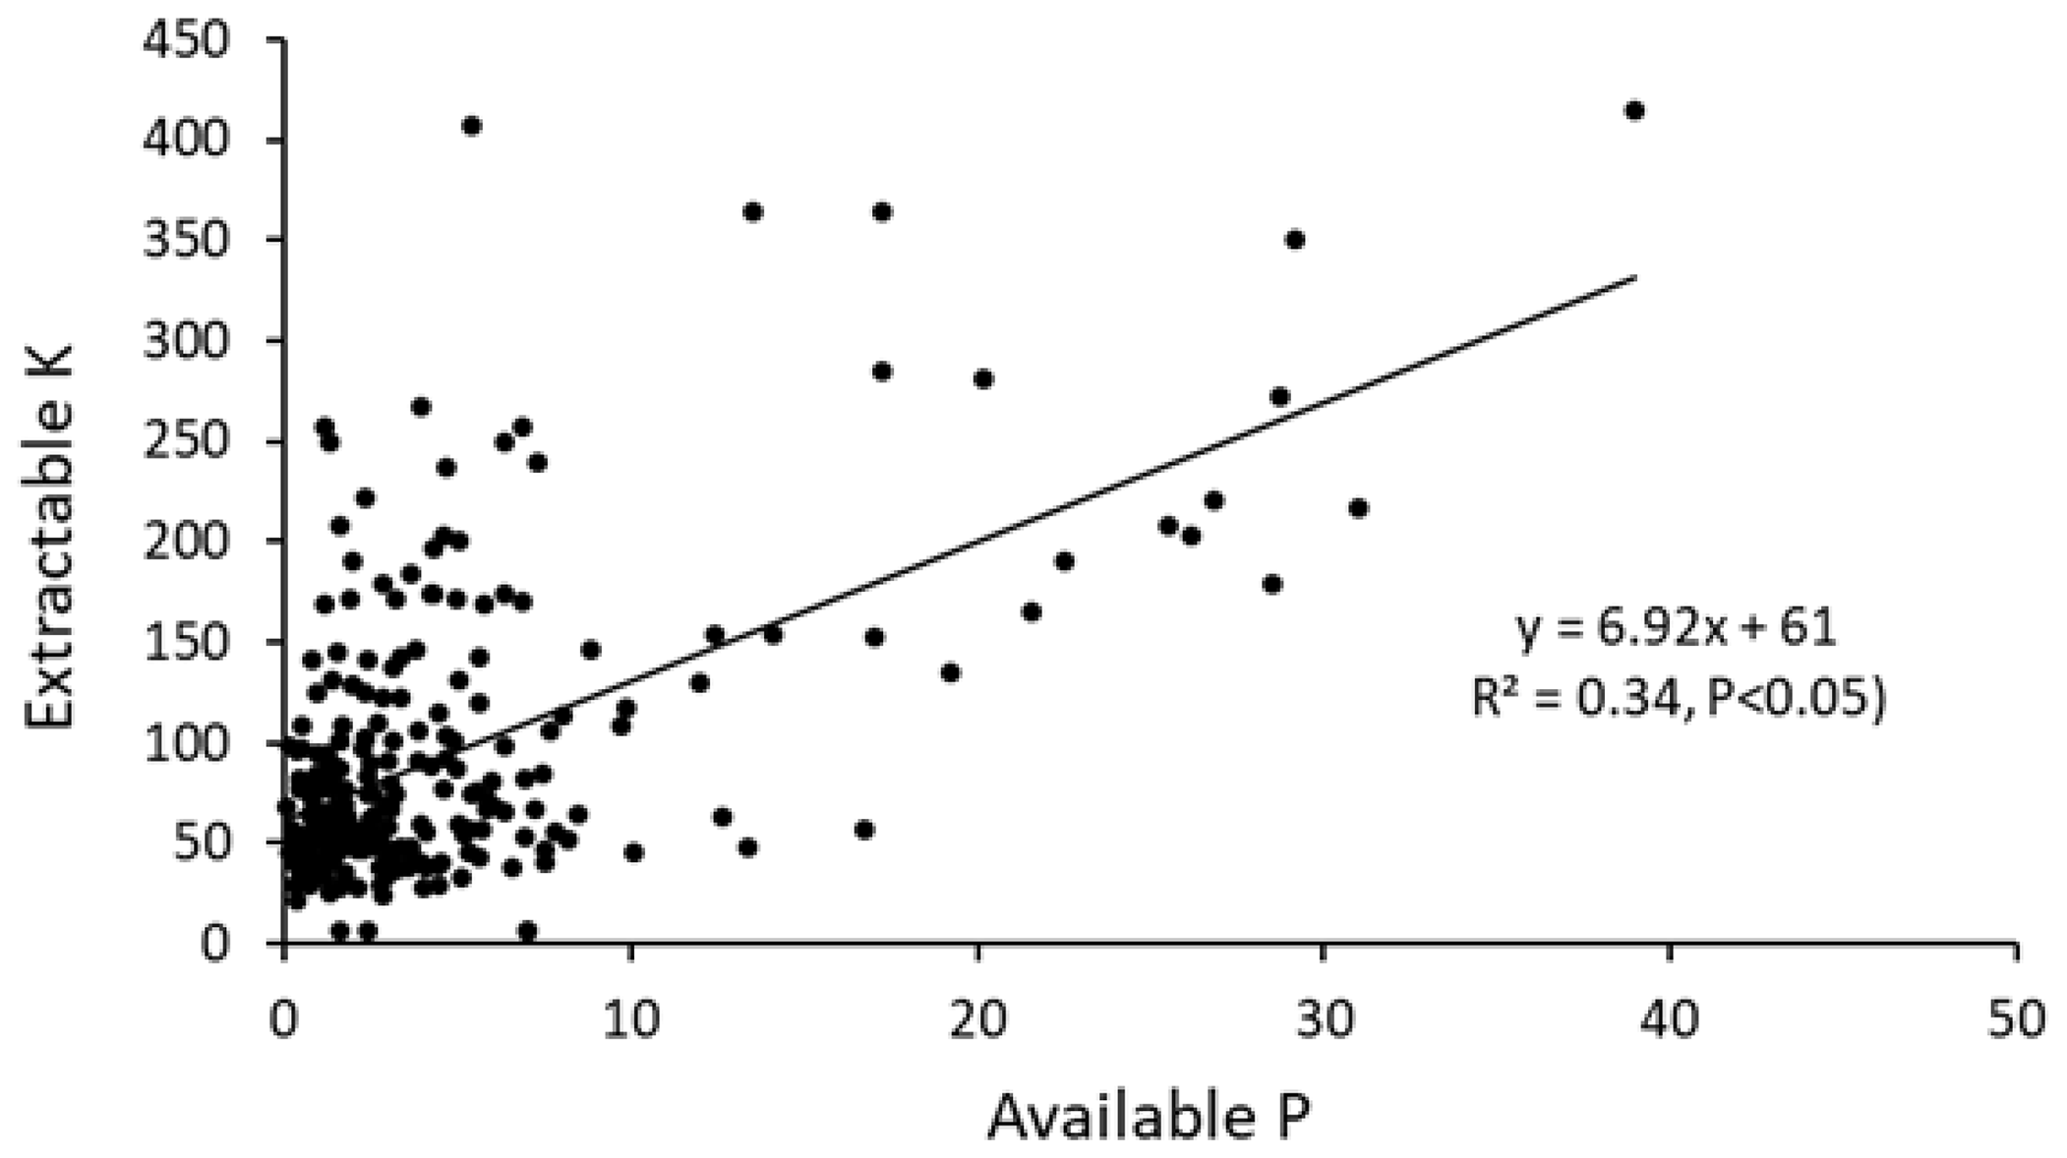
Figure 6The relationship between available P (mg kg−1) and extractable K (mg kg−1) in soils across seven EIP watersheds.
Prior to this study, published information on soil fertility on the EIP was restricted almost entirely to large-scale soil maps, leading to generalisations about acid, infertile soils (Edmonds et al., 2006; Sikka et al., 2009), and in turn to generalised fertiliser prescriptions. These generalisations fail to capture variation down the toposequence within watersheds and between individual fields. Our findings for uncultivated uplands confirm that the soils are inherently acid and infertile but also reveal systematic variations associated with land use and location in the toposequence.
4.1 Differences along the toposequence
Soils from the three classes of upland, where rice is not grown, had significantly lower pH, CEC, and OC, but more P and K, than the three classes of rice-growing fields lower in the toposequence. Amongst rice fields, those lower in the toposequence tended to be less acid and have higher OC and CEC but less P and K. The trends were generally consistent amongst the watersheds and consistent with the findings of Cornish et al. (2010) for two watersheds in the Purulia district. Farmers often refer to lowlands as their more fertile land, but the low soil P and K suggests their assessment might reflect the more reliable water rather than greater soil chemical fertility.
Our findings contrast with those of Fuwa et al. (2007), who reported fertility increasing down the toposequence in a single village. No details for sampling and analysis were provided. In another study, in four villages each in Thailand and Vietnam, Boling et al. (2008) reported higher OC and pH in rice fields lower in the landscape (as in our study), no trend in soil P, and an increase in soil K down the toposequence but only in Indonesia. Homma et al. (2003) also reported higher OC in lowland soils and attributed higher fertility to lowlands because of this but without measuring any soil nutrients.
Differing toposequence trends in these studies could reflect numerous variables, including underlying geology and native soil fertility, the degree of cutting and filling, the length of time used for rice, and the amounts of fertiliser used over that time. Amongst the EIP watersheds, only the underlying geology will have varied greatly. This relative homogeneity may explain the consistency of our findings across watersheds that were characterised by low inherent fertility (evident in uncropped uplands), low nutrient input, and long histories of rice in lowlands and medium lowlands but not in the medium uplands that are still being developed by marginal farmers to increase the area of wetland rice. Our findings will likely apply to any undulating landscape in Asia that produces rice and has the characteristics just described.
One of our aims was to evaluate the possibility of basing fertiliser recommendations on topographic position, as suggested by Homma et al. (2003) and Boling et al. (2008). Our data show that this is not feasible because of the large variability between fields within land class and/or topographic position, implying the need to avoid broad prescriptions and to manage nutrients and fields individually. However, field-specific management raises the question of how farmers can vary inputs to meet crop requirements in the absence of soil testing, which they cannot afford even if it is available and reliable. The answer may lie in simple farmer “test strips” (Cornish et al., 2015b) or the “omission trial” recommended by IRRI (2019b). These can be used effectively by farmers, given some technical support and a participatory learning process (Pretty, 1995).
4.2 Nutrient flows in the landscape and effects on soil fertility and rice yields
The vast majority of smallholders on the EIP are subsistence farmers, so almost all food is produced for home consumption and little is exported from the farm (and watershed). Nutrients removed from cropped land and grazed and/or forested areas are relocated to homestead areas where the grain is consumed, straw is utilised for roof thatch, animal bedding and feed, and the manure collected from grazed land is used for fertiliser or for fuel (along with firewood). Organic materials and ash collected from around the homestead are then partially returned to cropped areas as manure, compost and ash. These nutrient flows are shown in Fig. 7. Upland soil erosion is a significant potential source of nutrients for crops lower in the landscape, and animal carcases are a significant sink if they no longer cycle within the farming system within relevant timeframes. Nutrient import in subsidised food may be significant for the poorest families.
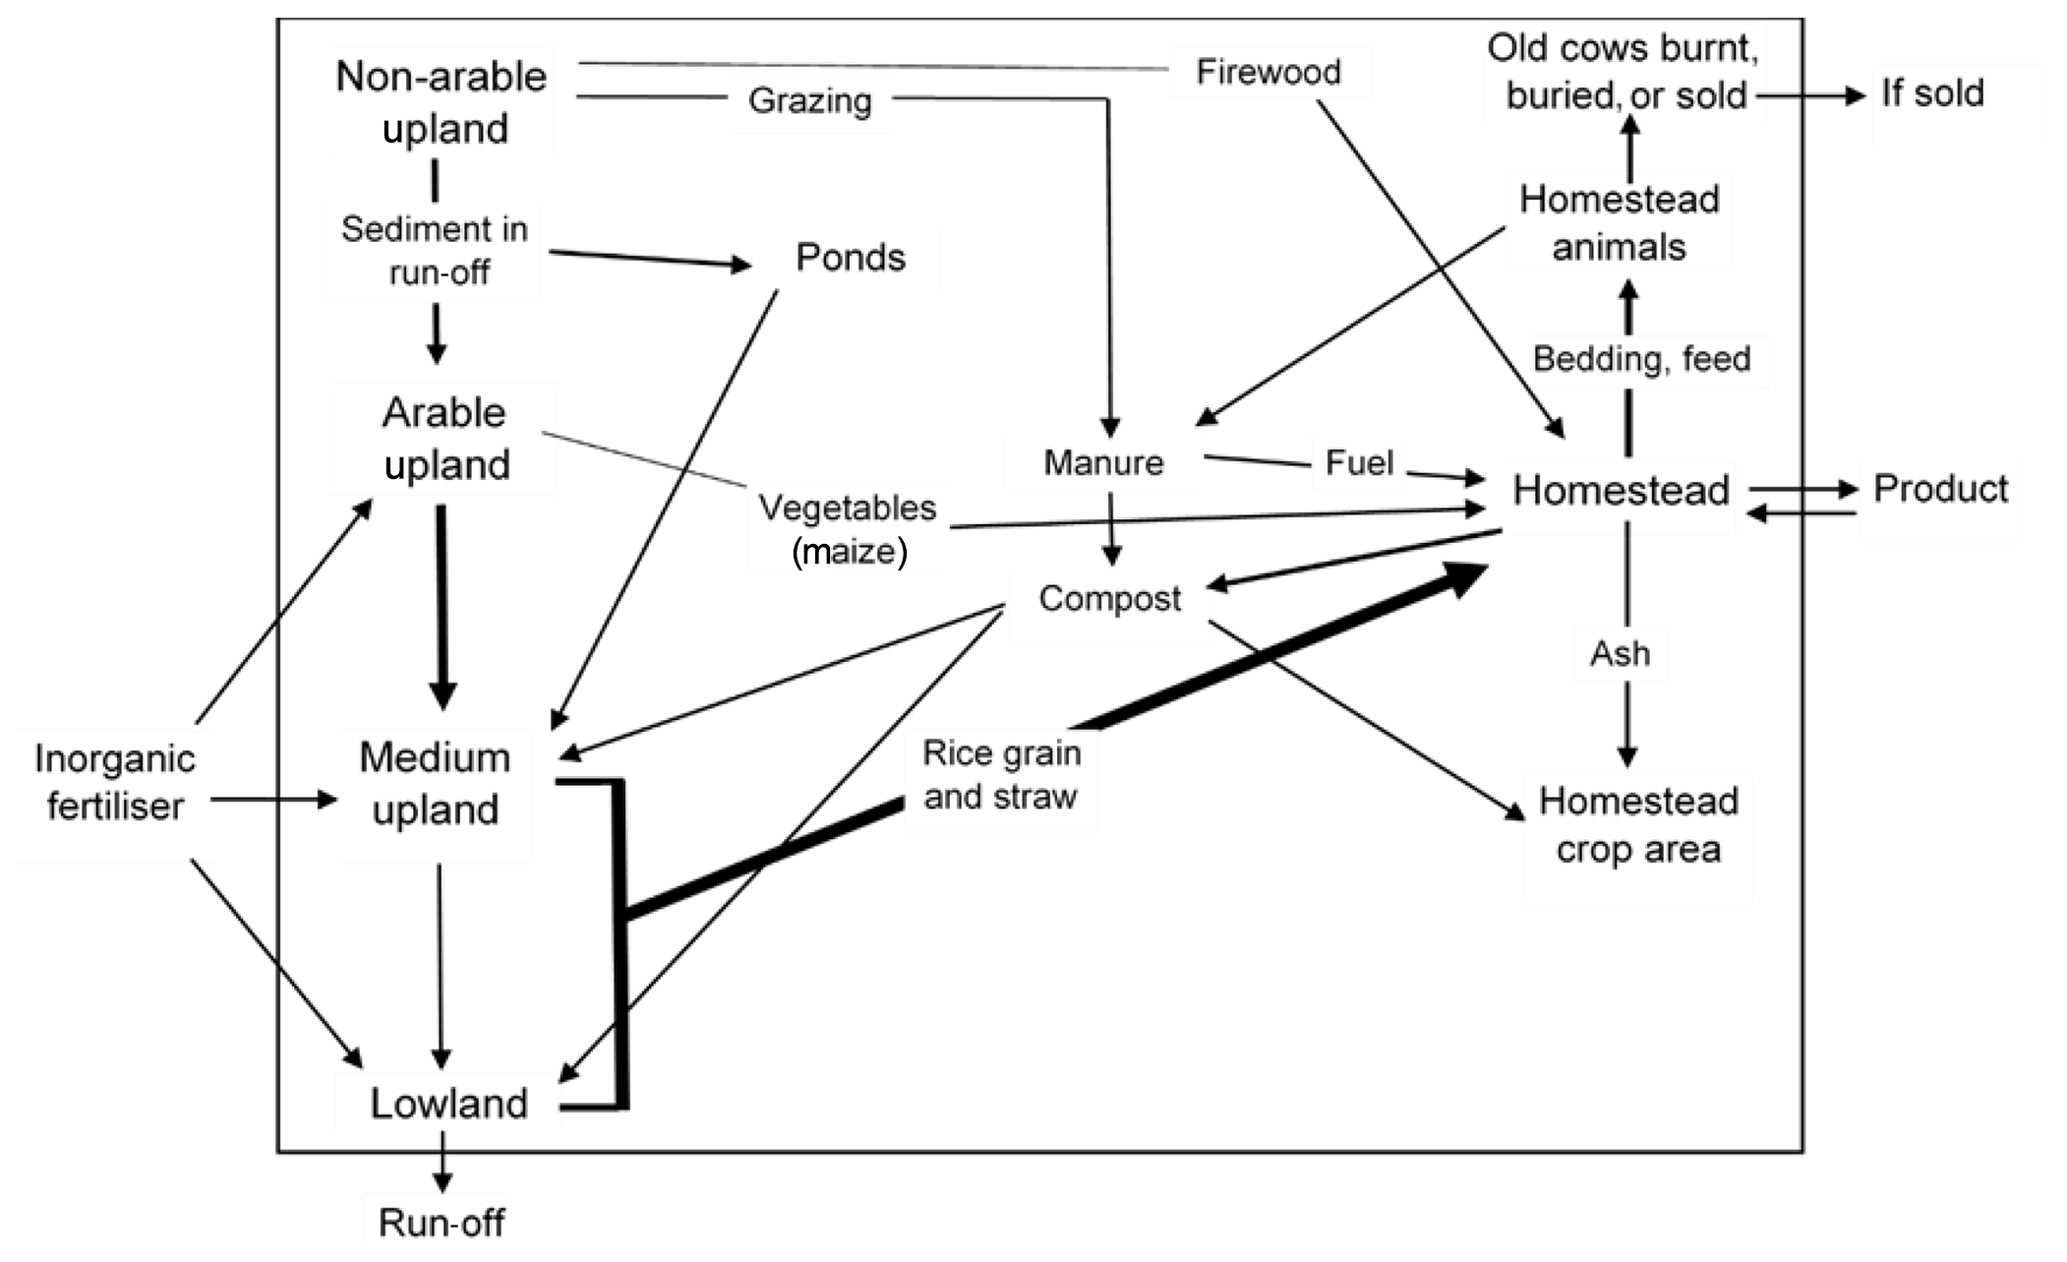
Figure 7Indicative nutrient flows. Line weight reflects relative magnitude (see text for details).
Whilst these systems appear to be relatively “closed” compared to market-oriented agriculture, nutrients are still lost in run-off and in the small amounts of produce sold (sometimes including old cows and other animals). Nutrients may also be imported in fertiliser, but these inputs are relatively small compared to elsewhere in India (FAO, 2005; Anonymous, 2013), with rates estimated from these reports to be 40 kg N ha−1, 5 kg P ha−1, and 8 kg K ha−1 per rice crop.
Given that the homestead is the focus of nutrient flows, we expected to find OC, CEC, P, and K to be highest in this land class. However, P and K tended to be highest in arable uplands and some homestead lands, whilst OC and CEC were highest in rice land. Our tentative explanation is that farmers prioritise rice for their compost (in addition to inorganic fertiliser), as it is the foundation of food security. Other crops receive mainly inorganic fertilisers, as finances allow. The use of compost on rice land will result in relatively higher OC and CEC (Figs. 3–4), whilst using inorganic fertilisers and ash on non-rice crops, such as maize and vegetables, will help to maintain relatively higher soil P (Fig. 5a) and K (Fig. 5b) where these crops are grown, i.e. around the homestead (e.g. Gumla and Lohardaga), arable uplands (Dumka and Godda), and selected medium upland fields converted from rice to vegetables (West Singhbhum and Bankura).
That arable uplands had more P and often K than non-arable uplands (except Bankura) suggests that rates of inorganic fertiliser were sufficient to maintain the nutrient balance, albeit at low concentrations of P and K with low yields. In rice, it appears that recycled nutrients in compost, plus the small inputs of inorganic fertiliser, are not sufficient to balance the removal, and further declines in soil nutrient content might be expected with current practices. Further research on field and watershed-scale nutrient balances are required to evaluate these propositions.
Low fertility resulting from inadequate fertiliser appears to be the primary cause of low rice yields in the region (<1.9 t ha−1; IRRI, 2019a), rather than insufficient water. There is reliable water during the wet season for rice in lowlands and in all areas for crops that do not depend on flooding (Cornish et al., 2015a–b).
We now consider which of the major nutrients (N, P, and K) is the main constraint to yield. Flooded rice has historically been grown as a subsistence crop on alluvial or colluvial lowlands with no external inputs. Yields were sustained with N from free-living N fixation (Watanabe and Roger, 1984) and P from sediment in run-off from uplands. The N fixation is hard to quantify, but long-term field studies suggest N uptake from crops with no N fertiliser is ∼80 kg ha−1 per crop (Watanabe and Roger, 1984), which is sufficient for grain yields of ∼4 t ha−1 if rice requires 15–20 kg N t−1 grain (IRRI 2019b). Farmers in the region also apply, on average, 40 kg N ha−1 per crop, sufficient for a further 1.0 t ha−1 with a fertiliser efficiency of 0.5 (IRRI, 2019b). If N was the primary nutritional constraint to the yield, then average yields should be at least 4 t ha−1 but they are <1.9 t ha−1. This suggests that N may not be the primary nutritional constraint, although it is generally assumed to be so in rice (IRRI, 2019b).
From our soil analyses (Table 4), we hypothesise that P is most likely the primary nutritional constraint to rice yields in most fields, unless P fertiliser is supplied at high rates. Current rates average only ∼5 kg P ha−1 for subsistence farmers (FAO, 2005; Anonymous, 2013), which, even with 100 % fertiliser efficiency, is enough for a crop of only 2 t ha−1 (IRRI, 2019b), i.e. the present regional rice yield. We also note that acute P deficiency may inhibit free-living N fixation (Watanabe and Roger, 1984).
We hypothesise that P fertiliser is required now, although it was not required in the past, because progressive terracing of hill slopes has intercepted run-off from uplands, leading to sediment deposition and depriving lowlands of their traditional source of P. With reduced sediment P input, and with low rates of fertiliser P, a rundown of soil P is inevitable and unsustainable. This will be most evident in lowlands as that is the oldest cropped land and now the least likely to receive sediment-bound P. Substantially increased P fertiliser inputs are needed to efficiently use the available water and the N described above.
K appears worthy of further attention, even if it is not currently the primary nutritional constraint. K concentrations appear to be low to marginal, and present practices return insufficient K to rice land to maintain soil K. Rice removes ∼5 kg K t−1 grain, unless straw is retained (IRRI, 2019b), suggesting a fertiliser replacement value of 20 kg K per crop if yields are 4 t ha−1. Farmers, on average, apply 8 kg K per crop so a rundown of soil K seems inevitable. The greatest risk of K deficiency is in the lowlands that have been cropped for the longest period of time and have the lowest concentrations of extractable K (Table 5). In the absence of reliable dose-response data and critical soil K values, there would be merit in farmers using test strips to assess responses to K fertiliser, giving priority to lowlands. Or they could simply commence with K replacement on the lowland.
It is clear that higher yields and sustainable crop production will only be achieved with substantially increased fertiliser use. This will present a challenge to risk-averse subsistence farmers who also have limited access to credit for inputs. The field test strips and omission trials referred to earlier could assist farmers with assessing nutrient responses on their own land and help them gain confidence whilst taking manageable risks. Any assessments of soil fertility might be extended to include boron, as soil surveys (Government of Jharkhand, 2020) suggest this nutrient may sometimes be deficient, but we did not assess this.
4.3 Soil acidity
Results confirm the widely held belief that EIP soils are acid (e.g. Edmonds et al., 2006; Sikka et al., 2009), although there is significant variation amongst the watersheds with some near neutral (Godda) and others requiring remediation (e.g. Khunti). Uniform recommendations to lime EIP soils would be inappropriate because only 14 % of all fields had pHw<5.0. Although lime would not normally be considered for lowland rice at this pH, any non-rice crops following rice may require lime.
A further 44 % of soils are moderately to slightly acid (pHw 5.0–5.4), and for these fields there is a need to at least minimise further soil acidification. A major cause of soil acidification is the use of ammonium-based fertiliser (Helyar and Porter, 1987), such as diammonium phosphate (DAP), which is widely used as a pre-plant fertiliser for all types of crops, albeit at low rates currently. Our results suggest that inputs of N should be restricted to urea, which is less acidifying. This would require P to then be supplied as superphosphate, which is essentially non-acidifying (Helyar and Porter, 1987). We also recommend that K, if required, be applied as muriate of potash or potassium sulfate, allowing farmers to vary individual nutrients according to requirements and minimise soil acidification. The use of superphosphate and potassium sulfate will also help to address any concern about S, which is not addressed here.
Fortunately, pHw increased with depth at the one watershed where this was studied, and it is unlikely that subsoil amelioration will be needed (Helyar and Porter, 1987).
Fields without rice, higher in the toposequence, had lower pHw, OC, and CEC but higher P and K than rice fields. Amongst rice fields, those lower in the toposequence were less acid and had higher OC and CEC but less P and K. These toposequence differences may apply to other undulating landscapes in Asia exhibiting the characteristics of our present study, i.e. low inherent fertility, low nutrient inputs, and a long history of rice in lowlands and medium lowlands, but not in medium uplands that are still being developed as marginal farmers seek to increase their area of wetland rice.
Despite these toposequence differences, fertility indicators varied so much within areas defined by land class and hydrology that toposequence position cannot be used to better target fertiliser recommendations.
For most arable fields and for all crop types, yield improvement requires the application of much higher rates of P and possibly K fertiliser (N is deficient but was not studied). We hypothesise that for many years rice was grown successfully on inherently infertile lowland soils, without inorganic fertiliser, because eroded sediment from uplands annually renewed the soil P (and other nutrients), a source now diminished by the terracing of uplands. This has led to declining soil P and the need to greatly increase fertiliser rates. Soil K is not so critically deficient, but it too is declining and K replacement needs to be considered.
The present cropping system is clearly unsustainable, at least with respect to P and K management, and unable to efficiently use the available water or even the N supplied in rice fields by the free-living N fixation.
Soils are mostly acid but only 14 % of fields (pHw<5.0) warrant liming. A further 44 % are at risk of further acidification, so we recommend replacing fertilisers containing , such as DAP, with less-acidifying sources such as urea (for N) and superphosphate (for P and S), enabling farmers to target fields with the N, P, and K required, with minimal effect on soil pH. We caution, however, that the constant removal of straw and grain from rice fields, and the leaching of nitrate N, are additional processes of acidification that will continue.
Variation within fertility indicators and weak associations between them show that nutrient use needs to be field specific. We suggest introducing farmers to strip tests or omission trials, allowing them to make their own field-by-field assessment of nutrient and lime requirements. Engaging risk-averse farmers in a participatory learning process should help them to take the difficult and expensive decision to substantially increase fertiliser rates.
Data are freely available for download from the Harvard Dataverse (https://doi.org/10.7910/DVN/UUEF6J, Cornish, 2019).
PSC was the overall project leader. All authors contributed to experimental design. AK led the development of site selection criteria, site selection, and discussions with farmers. SD oversaw all sample collection, processing, and despatch to the laboratory. PC prepared the paper, with comments from AK and SD.
The authors declare that they have no conflict of interest.
K. Sammi Reddy, from the Indian Institute of Soil Science, arranged for soil analyses. Shivendra Kumar, from the Indian Council of Agricultural Research (Ranchi), arranged for assistance with the field sampling. PRADAN provided invaluable assistance with sample processing prior to analysis. Many farmers participated in the research, and without access to their land, their ideas, and their assistance, this work would not have been possible.
This research has been supported by the Australian Centre for International Agricultural Research (grant no. LWR/2002/100).
This paper was edited by John Quinton and reviewed by Richard Bell and one anonymous referee.
Anonymous:. Indian fertilizer scenario 2013, Department of Fertilizers, Government of India, available at: https://vdocuments.mx/indian-fertilizer-scenario-2013.html (last access: 31 March 2019), 2013.
Bado, B. V., DeVries, M. E., Haefele, S. M., Marco, M. C. S., and Ndiaye, M. K.: Critical Limit of Extractable Phosphorous in a Gleysol for Rice Production in the Senegal River Valley of West Africa, Comm. Soil Sci. Plant Anal., 39, 202–206, 2008.
Blakemore, L. C., Searle, P. L., and Daly, B. K.: Methods for chemical analysis of soils, New Zealand Soil Bureau Scientific Report 80, 103, 1987.
Boling, A., Tuong, T. P., Suganda, H., Konboon, Y., Harnpichitvitaya, D., Bouman, B. A. M., and Franco, D. T.: The effect of toposequence position on soil properties, hydrology, and yield of rainfed lowland rice in Southeast Asia, Fld. Crop. Res., 106, 22–33, 2008.
Bray, R. H. and Kurtz, L. T.: Determination of total, organic and available forms of phosphorus in soils, Soil Sci., 59, 39–45, 1945.
Brennan, R. F. and Bell, M. J.: Soil K-crop response calibration relationships, Crop Pasture Sci., 64, 514–522, 2013.
Cornish, P.: Soil fertility along toposequence, https://doi.org/10.7910/DVN/UUEF6J, Harvard Dataverse, V1, 2019.
Cornish, P. S., Kumar, A., and Khan, M. A.: East India Plateau – Basket case or food basket?, in: Food Security from Sustainable Agriculture, edited by: Dove, H. and Culvenor, R. A.m Proc. 15th Australian Agronomy Conference, Lincoln New Zealand, 15–18 November 2010.
Cornish, P. S., Karmakar, D., Kumar, A., Das, S., and Croke, B.: Improving crop production for food security on the East India Plateau. I. Rainfall-related risks in rice and opportunities for improved cropping systems, Agr. Syst., 137, 166–179, 2015a.
Cornish, P. S., Choudhury, A., Kumar, A., Das, S., Kumbakhar, K. Norrish, S., and Kumar, S.: Improving crop production for food security and improved livelihoods on the East India Plateau. II. Crop options, alternative cropping systems and capacity building, Agr. Syst., 137, 180–190, 2015b.
Dodd, J. R. and Mallarino, A. P.: Soil-Test Phosphorus and Crop Grain Yield Responses to Long-Term Phosphorus Fertilization for Corn-Soybean Rotations, Soil Sci. Soc. Am. J., 69, 1118–1128, 2005.
Edmonds, C., Nobuhiko, F., and Banik, P.: Poverty reduction in the `Tribal Belt' of Eastern India, Asia Pacific Issues, East-West Centre, Working Paper No. 81, 2006.
FAO: Fertilizer use by crop in India. Food and Agriculture Organization of the United Nations Viale delle Terme di Caracalla 00100 Rome, Italy, available at: http://www.fao.org/3/a0257e/A0257E00.htm#TOC (last access: 31 March 2019), 2005.
FAO and ITPS: Global Soil Organic Carbon Map (GSOCmap) Technical Report. Rome, 162 pp., available at: http://www.fao.org/3/I8891EN/i8891en.pdf (last access: 29 June 2019), 2018
Fuwa, N. Edmonds, C., and Banik, P.: Are small-scale rice farmers in Eastern India really efficient? Examining the effects of micro-topography on technical efficiency estimates, Agr. Econ., 36, 335–346, 2007.
Government of Jharkhand: Soil maps, Department of Agriculture, Animal Husbandry and Cooperative, available at: http://www.sameti.org/default1_soilmap.htm (last access: 22 July 2020), 2020.
Helyar, K. R. and Porter, W. M.: Soil acidification, its measurement and the processes involved, in: Soil Acidity and Plant Growth, edited by: Robson, A. D., Yeates, J. S., Porter, W. M., Academic Press, Australia, 61–102, 1987.
Homma, K., Horie, T., Shiraiwa, T., Supapoj, N., Matsumoto, N., and Kabaki, N.: Toposequential variation in soil fertility and rice productivity of rainfed lowland paddy fields in mini-watershed (Nong) in Northeast Thailand, Pl. Prod. Sci., 6, 147–153, 2003.
Iftikar, W., Chattopadhayay, G. N., Majumdar, K., and Sulewski, G. D.: Use of village-level soil fertility maps as a fertilizer decision support tool in the red and lateritic soil zone of India, Better Crops, 94, 10–12, available at: http://www.ipni.net/publication/bca.nsf/0/E029D2AFDC87CA83852579A4007A4B52/$FILE/BCSA 2010 pg 18-20.pdf (last access: 17 July 2020), 2010.
IRRI: World Rice Statistics, International Rice Research Institute, Los Banās, Philippines, available at: http://ricestat.irri.org:8080/wrsv3/entrypoint.htm (last access: 20 March 2019), 2019a.
IRRI: Knowledge Bank, Module 4. Nutrient management, Lesson 3, available at: http://www.knowledgebank.irri.org/ericeproduction/IV.3_Nutrient_calculator.htm (last access: 1 April 2019), 2019b.
Kay, B. D. and Angers, D. A.: Soil structure, in: Handbook of Soil Science, edited by: Sumner, M. E., 229–276, CRC Press, Boca Raton USA, 1999.
Ketterings, Q., Reid, S., and Rao, R.: Cation Exchange Capacity (CEC), Agronomy Fact Sheet Series, Fact Sheet 22. Cornell University Cooperative Extension, available at: http://nmsp.cals.cornell.edu/publications/factsheets/factsheet22.pdf (last access: 29 June 2019), 2007.
Mallarino, A. P., Sawyer, J. E., and Barnhart, S. K.: A general guide for crop nutrient and limestone recommendations in Iowa. Dept Agronomy, Iowa State University Extension and Outreach, available at: https://store.extension.iastate.edu/Product/pm1688-pdf (last access: 30 March 2019), 2013.
Peverill, K. I., Sparrow, L. A., and Reuter, D. J.: Soil Analysis: An Interpretation Manual, CSIRO Publishing, Victoria Australia, 1999.
Pretty, J. N.: Participatory learning for sustainable agriculture, World Dev., 23, 1247–1263, 1995.
Riley, J.: Presentation of statistical analyses, Exp. Agr., 37, 115–123, 2001.
Sahrawat, K. L., Jones, M. P., and Diatta, S.: Extractable phosphorus and rice yield in an Ultisol of the humid forest zone in West Africa, Comm. Soil Sci. Plant Anal., 28, 711–716, 1997.
Seng, V., Bell, R. W., and Willett, I. R.: Effect of Lime and Flooding on Phosphorus Availability and Rice Growth on Two Acidic Lowland Soils, Comm. Soil Sci. Plant Anal., 37, 313–336, 2006.
Sikka, A., Kumar, A., Upadhyana, A., Kundu, D. K., Dey, P., Sarkar, A. K., and Islam, A.: Development and policy issues for optimum use of soil and water in Eastern Region, Bull. Indian Soc. Soil. Sci., 26, 55–66, 2009.
Spencer, K. and Govaars, A. G.: The potassium status of pastures in the Moss Vale district, New South Wales, CSIRO Division of Plant Industry Tech. Paper 38, 1982.
Steel, R. G. D. and Torrie, J. H.: Principles and procedures of statistics, 2nd edition, McGraw HIll, New York, 1980.
Tangren, J.: A field guide to Experimental designs. Washington State University, Tree Fruit Research and Extension Centre, available at: http://www.tfrec.wsu.edu/ANOVA/index.html (last access: 25 March 2019), 2002.
Tsubo, M., Fukai, S., Tuong, T. P., and Ouk, M.: A water balance model for rainfed lowland rice fields emphasising lateral water movement within a toposequence, Ecol. Model., 204, 503–515, 2007.
Walkley, A. and Black, I. A.: An examination of the Degtjareff method for determining soil organic matter and a proposed modification of the chromic acid titration method, Soil Sci., 37, 29–38, 1934.
Watanabe, I. and Roger, P. A.: Nitrogen fixation in wetland rice field, 237–276, in: Current Developments in Biological Nitrogen Fixation, edited by: Subba Rao, N. S.. Oxford SI IBH Publishing Co. New Delhi, Bombay, Calcutta, 1984.