the Creative Commons Attribution 4.0 License.
the Creative Commons Attribution 4.0 License.
 | 27 Apr 2020
Adsorption to soils and biochemical characterization of commercial phytases
María Marta Caffaro
Karina Beatriz Balestrasse
Gerardo Rubio
Commercial phytases are widely used in poultry production, but little is known about their potential use as biofertilizer for agricultural crops as an alternative to reduce the use of synthetic fertilizers. Four purified phytases isolated from Aspergillus niger and Escherichia coli were characterized biochemically and in terms of their adsorption to soils belonging to the Mollisol order. Three different organic P substrates were used to measure enzyme activity under a wide range of pH (2.3 to 9) and temperatures (−10 to 70 ∘C) conditions: phytic acid, p-nitrophenyl-phosphate (pNP) and glyceraldehyde-3-phosphate (G3Phosphate). Phytases had a low affinity for the solid phase: 23 %–34 % of the added amount was adsorbed after 1 h of incubation. Phytases from A. niger showed a higher capacity to release P (13 % on average) than phytases from E. coli. All phytases were active throughout the pH and temperature ranges related to optimum crop production. At pH values commonly found in agricultural soils (5.5–7), A. niger phytases released P with the following substrate ranking with respect to effectiveness: pNP > phytic acid > G3Phosphate. E. coli phytases, in comparison, released P following with the following substrate ranking with respect to effectiveness: pNP ∕ phytic acid > G3Phosphate. The results obtained are promising in terms of the use of phytases as a complement to P fertilization in agricultural settings and encourage further studies under field conditions.
- Article
(806 KB) - Full-text XML
- BibTeX
- EndNote


Phosphorus (P) is the second-most important nutrient limiting agricultural crop productivity worldwide. Most strategies for enhancing P nutrition of agricultural crops aim to maintain soils at a convenient P critical level so that yields are not constrained by this nutrient and environmental pollution risks are avoided or minimized (Simpson et al., 2011).
The most widely used practice to overcome soil P deficiencies is the application of inorganic P fertilizers produced from phosphate rock (PR). However, world PR reserves that can economically be extracted are estimated to be depleted in the next 50–100 years (Cordell et al., 2009). Several strategies have been suggested to increase P utilization efficiency and reduce PR-derived fertilizer consumption (Fernandez and Rubio, 2015). Richardson et al. (2011) categorizes these strategies into three groups: (i) root-foraging strategies that reduce the critical P requirements for plant growth; (ii) P-mining strategies that enhance the P availability from sparingly available sources in soil; and (iii) physiological strategies that lead to higher yields per unit of P uptake.
Soil P is comprised of inorganic and organic forms. Phosphates present in the soil solution are the main source of P for higher plants. Due to the strong interaction with the soil matrix, the concentration of phosphates in the soil solution is very low (< 10 µM; Dalal, 1977). In general, the soil organic P content varies over a wide range (between 30 % and 70 % of total soil P; Cabello et al., 2016). The predominant soil organic P fractions are usually phytates (Harvey et al., 2009; Steffens et al., 2010), followed by nucleic acids, phospholipids and sugar phosphates (Tiessen, 2008). Phytates and other organic P forms cannot be directly utilized by plants and need to be mineralized before being suitable for plant uptake. The discovery of phytate-degrading compounds has changed the conventional perception that phytate was a recalcitrant molecule in the environment (Harvey et al., 2009).
Phytases are enzymes released by bacteria, fungi, plants and animals (Jorquera et al., 2008) and are able to catalyze the release of P from phytates. Phytases have the ability to release the six Pi molecules that are contained in phytate (Misset, 2002). Although phytases are distributed throughout the soils, higher concentrations are found in the rhizosphere (Li et al., 2008). The high capacity of Aspergillus niger and Escherichia coli to secrete phytases has promoted their use as a source of these enzymes in commercial production by the industry (Misset, 2002). A. niger phytases are mainly extrinsic (Azeem et al., 2015), and they are classified as 3-phytases because they primarily dephosphorylate the phosphate group located at position 3. E. coli phytases are mainly membrane-associated proteins and have been classified as 6-phytase (Azeem et al., 2015). The classification as 3- or 6-phytases is related to which phosphate group is attacked first and would be determined by conformational differences in the β-domain of each phytase (Konietzny and Greiner, 2002).
Besides being a key fraction of soil organic P, phytates are present in other natural components. For example, 60 %–90 % of P in cereal and oil grains is present in phytic acid forms (63 % in soybean, 77 % in wheat and 83 % in maize; Lott et al., 2000). One of the most common uses of these grains is for livestock feed (Misset, 2002). However, the microbial population of the digestive tract of monogastric animals (e.g., poultry) is unable to utilize phytate as a P source. The benefit of adding phytases to poultry diet to enhance phytic acid P utilization was demonstrated some time ago and is currently a widespread practice in poultry nutrition management (El-Sherbiny et al., 2010). Using phytases from different microorganisms (i.e., Aspergillus spp. and E. coli) may also entail environmental benefits, as it can reduce the P content of poultry manure.
The extensive use of phytases in livestock and aquaculture production contrasts with the practically null use in agriculture. There are very few reports in which phytases have been studied to enhance soil P availability (e.g., Findenegg and Nelemans, 1993; Liu et al., 2018). Adding phytases to P-poor soils increased biomass accumulation of maize by around 32 % (Findenegg and Nelemans, 1993). Undoubtedly, phytase research appears to be a promising path to increase soil P use efficiency (Menezes-Blackburn et al., 2016; Liu et al., 2018). Some reports indicate that the adsorption of phytases to the soil matrix may reduce their affinity for substrates containing P (George et al., 2005; Yang and Chen, 2017). When pH increases, clay charge changes, decreasing the phytase affinity (Ruyter-Hooley et al., 2015).
In this work, we evaluated the performance of four commercially available phytases, two extracted from A. niger and two from E. coli, as candidates to be used as a biological fertilizer to release inorganic P from organic P sources. Our working hypotheses were as follows: (i) the four commercially available phytase products have the ability to release P from different organic P sources, with preference for phytic acid, but differ with respect to the pH and temperature levels required to reach their optimum activity; and (ii) the retention of commercial phytases in the soil solid phase is associated with the soil clay content.
2.1 Enzyme preparation
Four phytases were used in our experiments: two isolated from A. niger from two different batches of Habio phytases (Sichuan Habio Bioengineering Co., Ltd, Sichuan, PRC), referred to here as A. niger 1 and 2, respectively; and two isolated from E. coli (TS Smizyme phytase, Quimtia EDF, Buenos Aires, Argentina and Ronozyme, DSM Nutritional Products, Argentina), referred to as E. coli 1 and 2, respectively. These enzymes were in a powdered format with a concentration of 5000 U g−1 and were provided free of charge by the companies that produce or import them. A total of 200 mg of each phytase was suspended in a solution composed of 20 mL of 360 mM CaCl2, 1 mM buffer pH 5.5 sodium acetate and 100 mg g−1 TWEEN 20. The solution was mixed for 30 min at 4 ∘C and subsequently centrifuged at 6900 g for 30 min at the same temperature. The final concentration of enzymes in the solution was 10 mg enzyme mL−1.
2.2 Phytase adsorption on soils
To test hypothesis (ii), soil samples (0–20 cm) were taken from seven representative soils of the Pampean region, the most productive area of Argentina (Table 1). All soils belong to the Mollisol order (Rubio et al., 2019). A total of 1 g of each soil and 20 mL of phytase solution (17.6 nkat g−1 of soil, specific activity 8.3 nkat mg−1 protein) was placed in respective 50 mL screw-capped polyethylene tubes at room temperature (22 ∘C). After shaking the tubes on a flat bed shaker (75 oscillations min−1), subsamples of soil slurry (500 µL) were taken for phytase activity measurements at 5, 10, 15, 30 and 60 min. To obtain a representative sample of the suspension, aliquots of soil slurry were taken using a pipette tip after vigorously mixing the soil suspension. An aliquot (150 µL) of the soil slurry was used to measure the enzyme activity (here called soil suspension). The remaining portion of the sample was centrifuged at 15 000 g for 5 min, and the supernatant was taken to measure the phytase activity (here called soil solution).
Table 1Characteristics of seven representative soils of Argentina's Pampa region used to test phytases adsorption to soils.

Phytase activities in aliquots of soil solutions and suspensions were measured at a 1:1 sample to buffer ratio. Assays were performed against phytic acid substrate for 60 min at 37 ∘C at a final concentration of 2 mM and were buffered to pH 5.5 with 15 mM MES (George et al., 2005). Reactions were stopped with an equal volume of 10 % TCA (300 µL in soil slurry experiments and 700 µL in soil solution experiments). Samples were centrifuged at 3800 g for 5 min prior to the determination of the P concentration in the supernatant using the Murphy–Riley method (Murphy and Riley, 1962). Phytase activity retained in the solid phase was determined by calculating the difference between the phytase activity of the soil suspension and the activity of the soil solution. The phytase activity of the soil suspension was calculated as the difference between the soil suspension with enzyme minus the soil suspension without enzyme. To determine which soil characteristics (Table 1) affected phytase distribution between the soil solid and liquid phases, a linear regression and a correlation analysis between Vmax (the maximum distribution of the enzyme in the soil solid phase) and k (the rate at which distribution peaks) with soil characteristics were performed.
2.3 Biochemical characterization and optimum pH and temperature levels
To test hypothesis (i), we performed the biochemical characterization of four purified phytases. This characterization included total protein (Lowry et al., 1951), enzymatic activity as a function of pH and temperature, the kinetic parameters Vmax and Km, and adsorption to seven selected soils.
Phytase activity was measured using three substrates containing 10 mM P : 2 mM phytic acid, 10 mM p-nitrophenyl-phosphate (pNP) and 10 mM glyceraldehyde-3-phosphate (G3Phosphate). In this experiment, the incubation temperature was 25 ∘C according to Hayes et al. (1999).
To evaluate the performance of the enzymes along a pH range (2.3–9.0), 200 µL of each enzyme solution was diluted with 400 µL of 50 mM glycine hydrochloride (pH 2.3–4.4), 50 mM sodium acetate (pH 3.6–5.8), 50 mM MES-KOH (pH 5.2–7.3) and 50 mM Tris HCl (pH 6.1–9.0), respectively, as a reaction buffer. To evaluate the performance of the enzymes along a temperature range (−10–70 ∘C), 200 µL of each enzyme solution was diluted with 400 µL MES (pH 5.5) buffer. For both pH and temperature studies, the incubation time was 1 h, and the reaction was terminated by the addition of 10 % trichloroacetic acid (TCA). In the temperature studies, the buffer containing the substrates was heated until the desired temperature was reached. At this point the enzyme was added and the incubation time began. Measurements were performed in triplicate. The activities were tested against three blanks: (i) the reaction buffer without enzyme or substrate; (ii) the reaction buffer with enzyme without substrate; and (iii) the reaction buffer without enzyme with substrate. When the substrates were phytic acid and G3Phosphate, the phytase activity was measured using the Murphy–Riley method (Murphy and Riley, 1962). For the p-Np substrate, the enzymatic activity was measured at 412 nm which is the absorbance value of p-nitrophenol (Hayes et al., 1999). The concentration of the three substrates was determined as the concentration of the whole sample minus the concentration of the reaction blank.
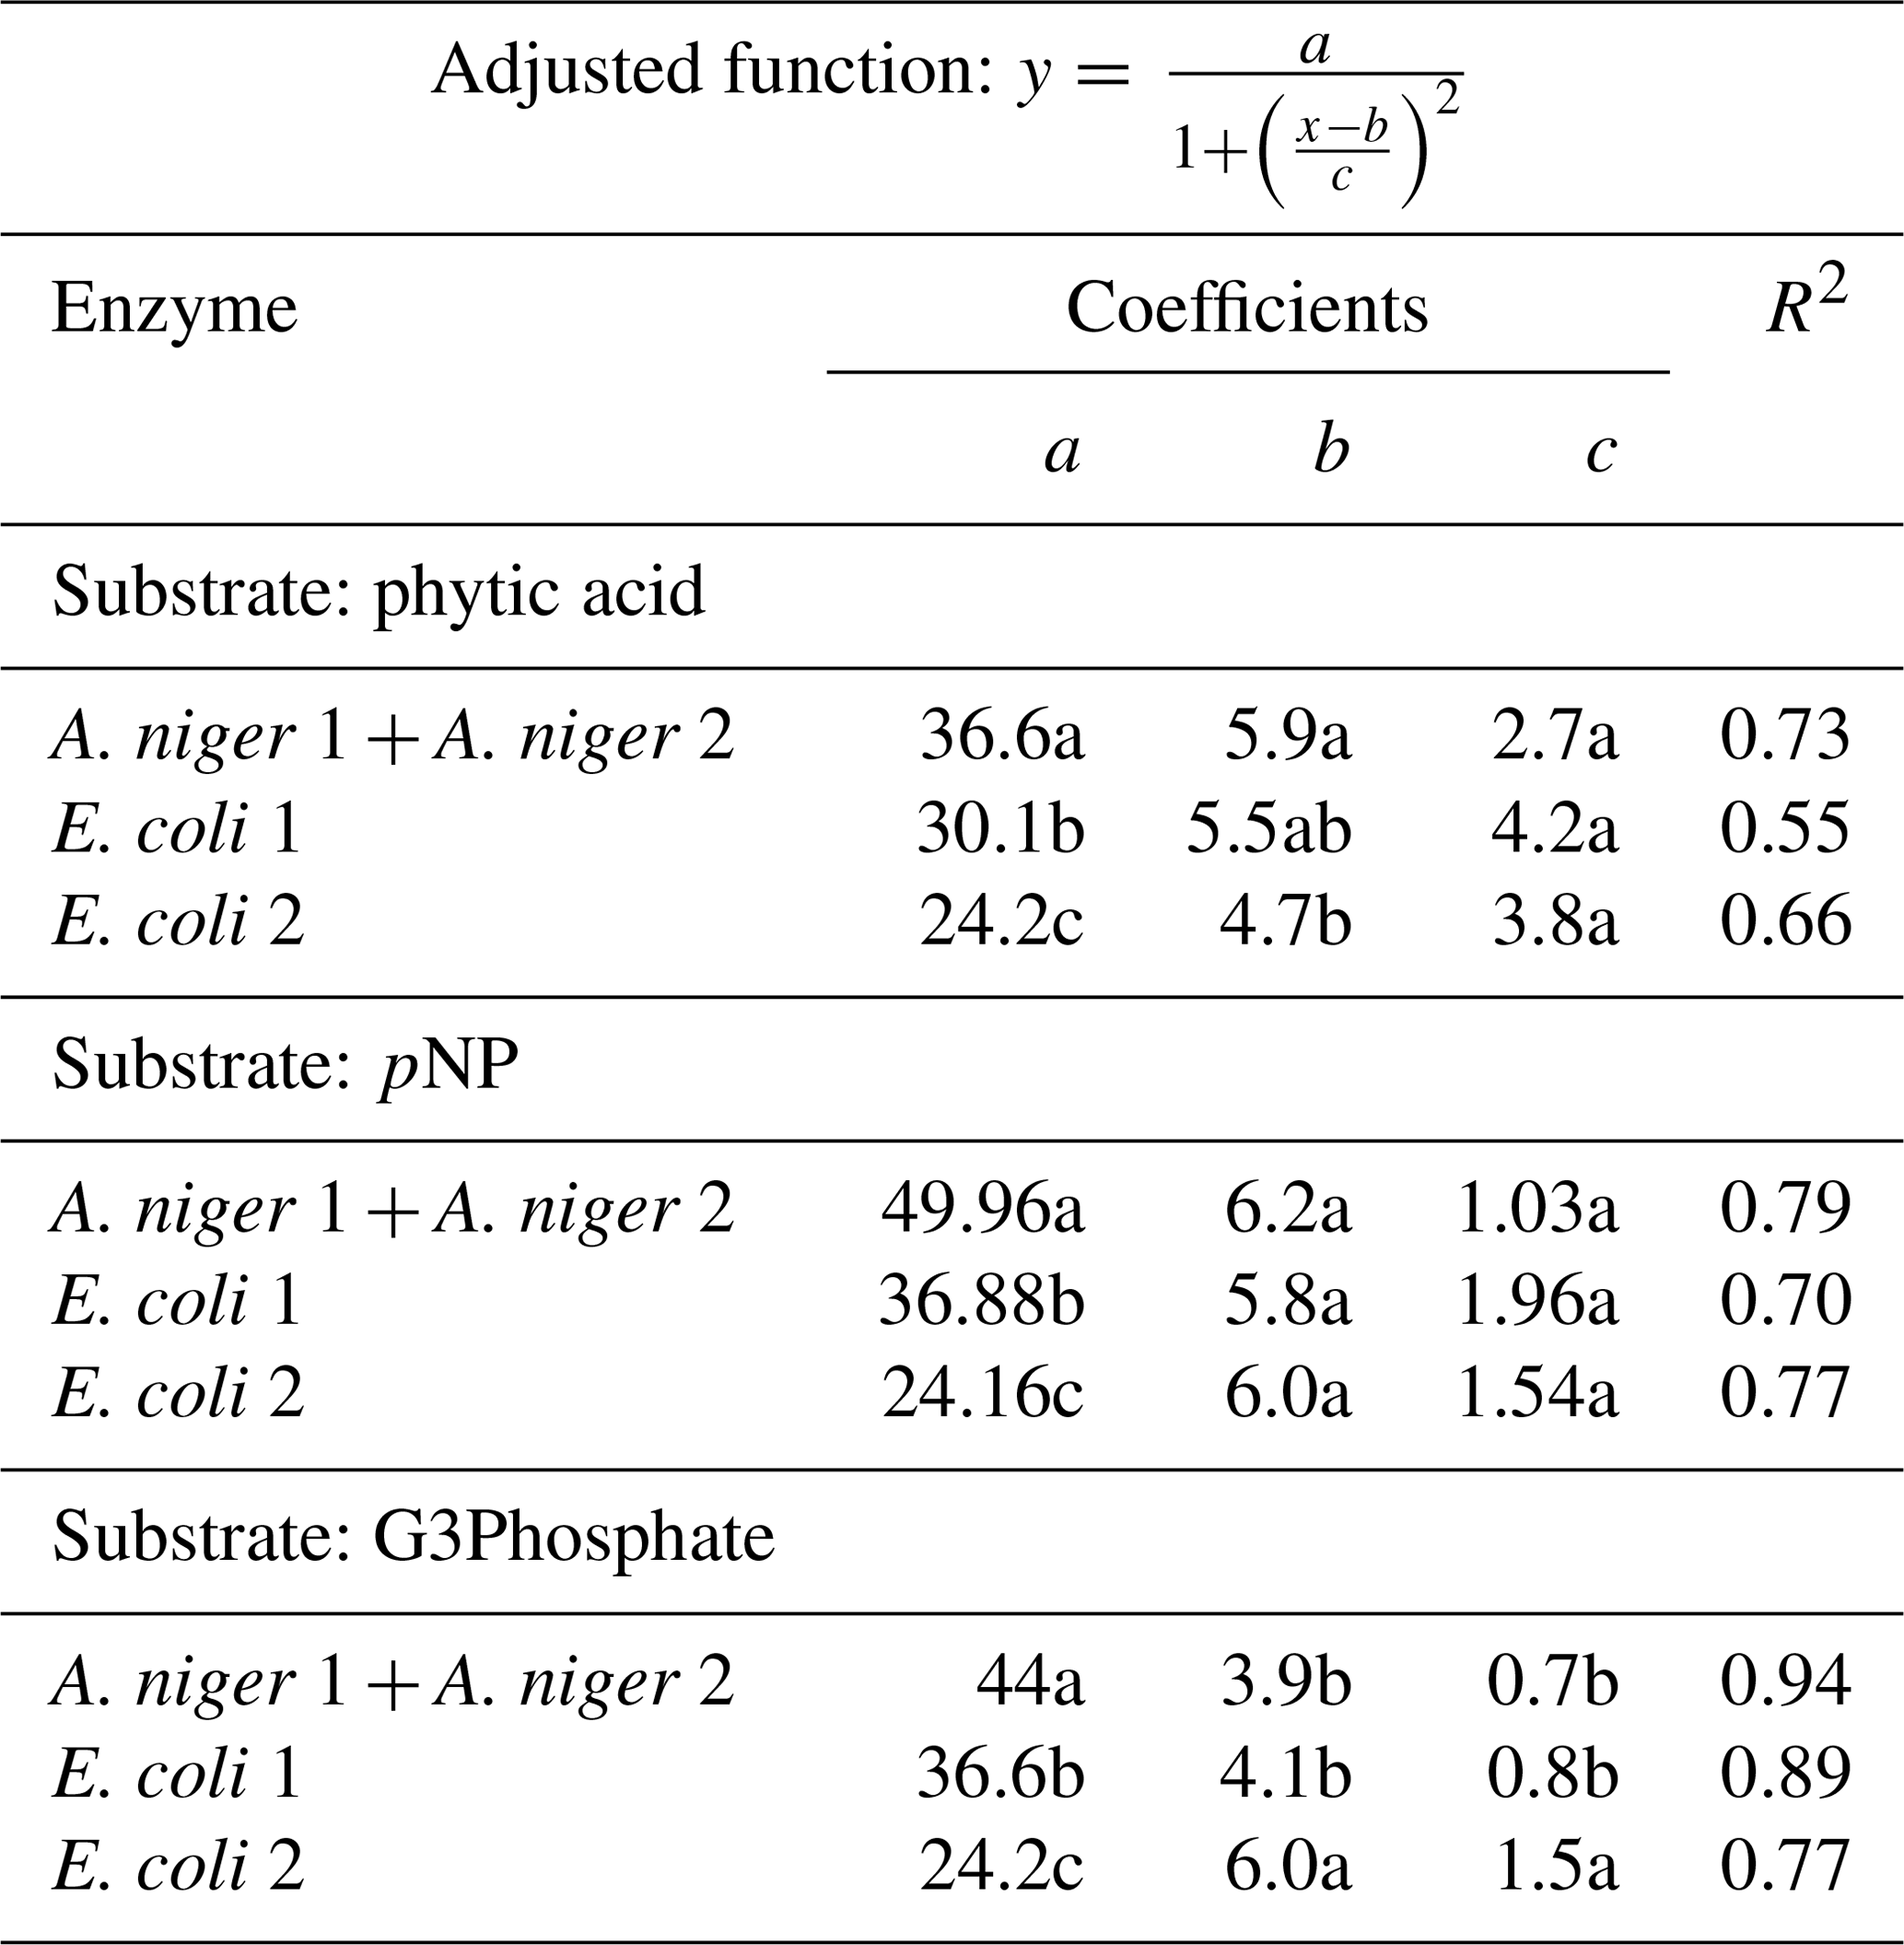
Table 2Coefficients of the adjusted Lorentzian peak functions for phytase activity at different pH levels (see graphs in Fig. 2). The substrates used were phytic acid, pNP and G3Phosphate. Four purified phytases (two isolated from A. niger and two from E. coli) were evaluated. In cases where significant differences between enzymes (analyzed using F tests) were not found, a unique curve was fitted. Different letters correspond to significant differences between treatments (P<0.05, least significant difference, LSD, procedure).
To estimate Vmax and Km, 200 mg of each phytase was suspended in solutions containing 0, 6.25, 12.5, 25, 50 and 100 mM of P for 1 h with phytic acid, G3Phosphate and pNP as substrates. The reaction was stopped by the addition of 10 % TCA. The kinetic parameters were determined using the Lineweaver–Burk graphical method.
2.4 Statistical analysis
In order to find the pH and temperature values at which phytases showed the maximum activity, different peak functions were adjusted using TableCurve 2D demo version. Experimental data of enzyme activity at different pH values or temperatures were expressed as the percentage of P released from each substrate and fitted to a Lorentzian peak model for each treatment calculated following Eq. (1):
where a is the maximum percentage of P released, b is the pH value where the enzyme has maximum activity (a P release peak), c estimates the standard deviation of the distribution and x is the pH value. Parameters of each Lorentzian distribution for each enzyme and substrate were compared using F tests (Mead et al., 1993). In cases where nonsignificant differences between enzymes were found (F tests in Statistix 9, student version), a unified curve was fitted. The parameters and the functions obtained were compared using t tests.
Results obtained from the experiments regarding phytase distribution between soil solid and liquid phases were expressed as enzyme activity per soil gram (nkat g soil−1). Exponential decay equations for the enzyme distribution in the liquid phase were fitted according to Eq. (2):
where y0 is the minimum enzyme activity in the soil liquid phase, k is the relative exchange rate between the liquid phase and the solid phase, and x is the time considered.
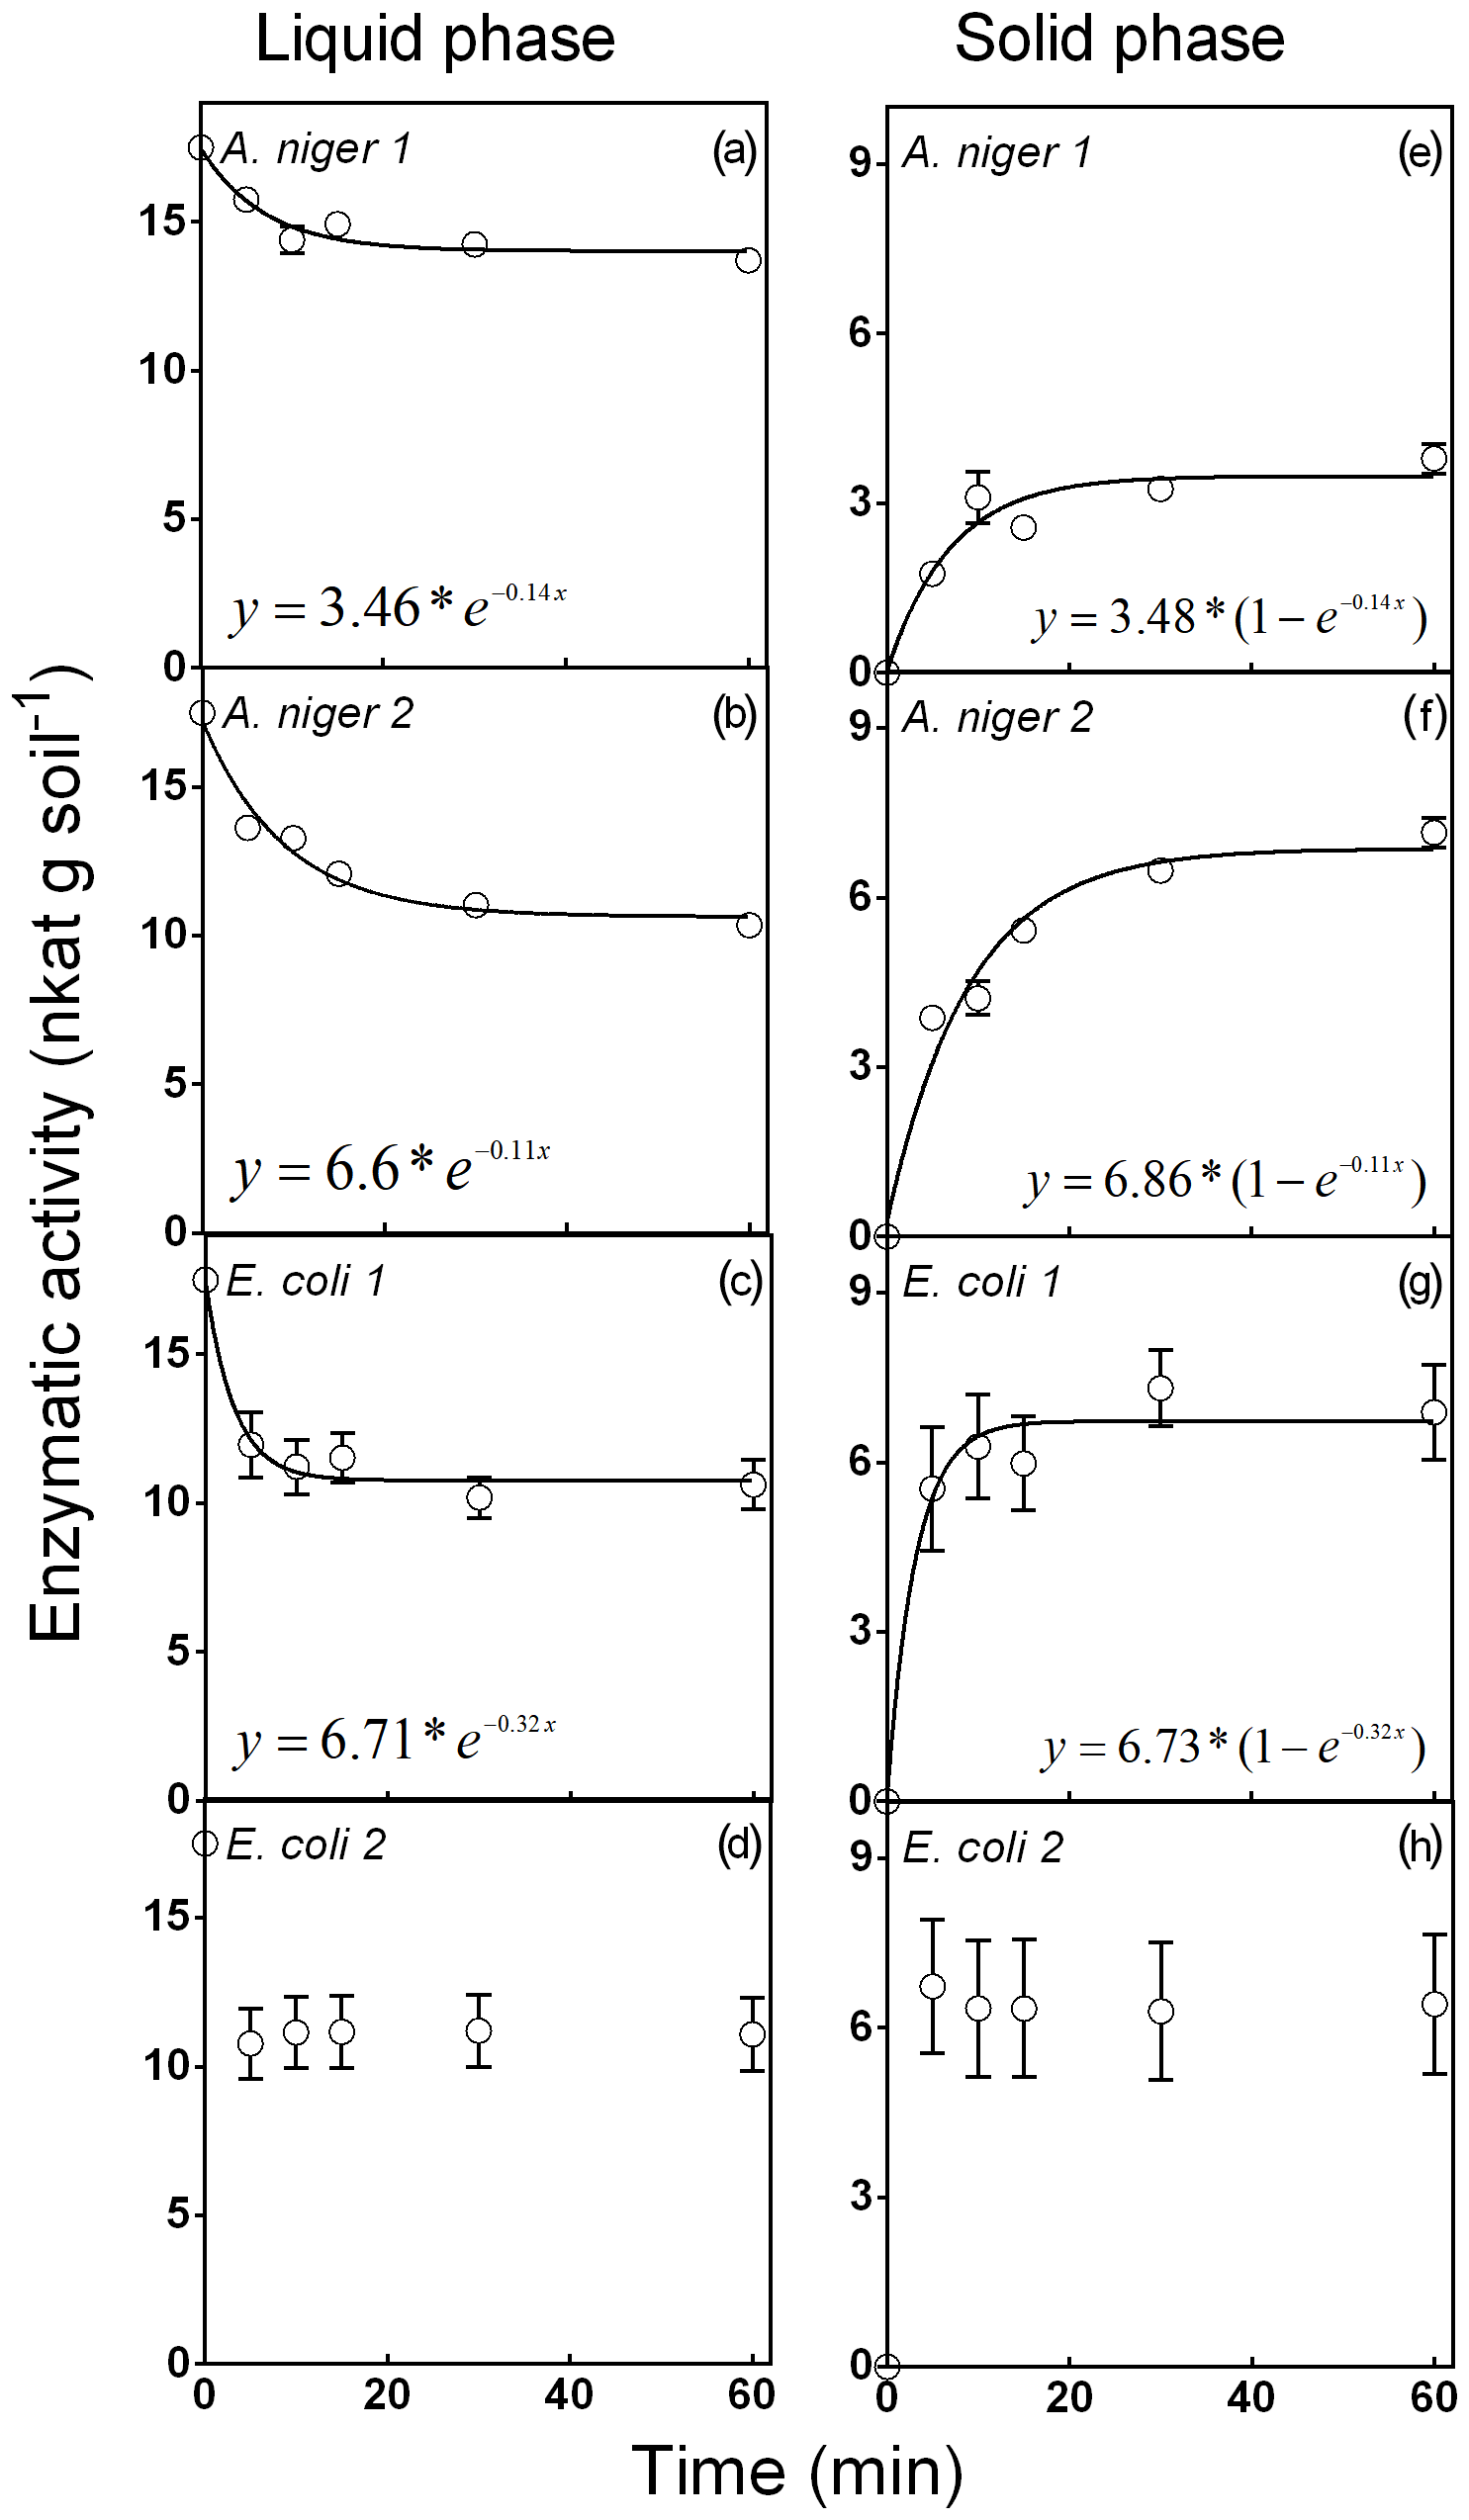
Figure 1Phytase activity distributed in the liquid and solid phases for the phytase soil adsorption experiment. Four purified phytases (two isolated from A. niger and two from E. coli) were evaluated. Experiments were performed with the seven soils described in Table 1. Each point represents the average of three observations minus the controls described in Sect. 2. Bars represent the standard error of the mean.
Exponential increase equations for the enzyme distribution in the solid phase were fitted according to Eq. (3):
where ymax is the maximum enzymatic activity in the solid phase of the soil, k is the relative exchange rate between the liquid phase and the solid phase, and x is the reaction time. All functions where fitted using TableCurve 2D software.
In cases where significant differences between enzymes (analyzed using F tests) were not found, a unique curve was fitted. To determine the soil property effect on enzyme adsorption, the distribution of the enzymes between the solid and liquid soil phases were adjusted using linear functions between the enzyme activity and each analyzed soil property (Table 1).
3.1 Phytase adsorption on soils
Figure 1 shows the distribution of phytases between the liquid and solid phases in seven different soils of the Pampean region (Mollisol order, Table 1). These results did not support hypothesis (ii), as the retention of phytases by the soil solid phase did not have a clear association with the analyzed soil properties, including the soil clay content. Therefore, it was possible to fit a single model after pooling the data from the seven sites (Fig. 1). A. niger 1 showed the lowest adsorption to the solid phase (around 19 % of the original substrate P content; Fig. 1e). This value remained stable after 30 min of incubation. A. niger 2 showed the highest adsorption to the solid phase (40 % at 10 min; Fig. 1f). E. coli 1 (Fig. 1g) showed a 39 % binding to the solid phase at 60 min, whereas E. coli 2 presented a 37 % binding to the soil solid phase at 5 min (Fig. 1h). This early maximum fixation prevented the fitting of a consistent and representative function.
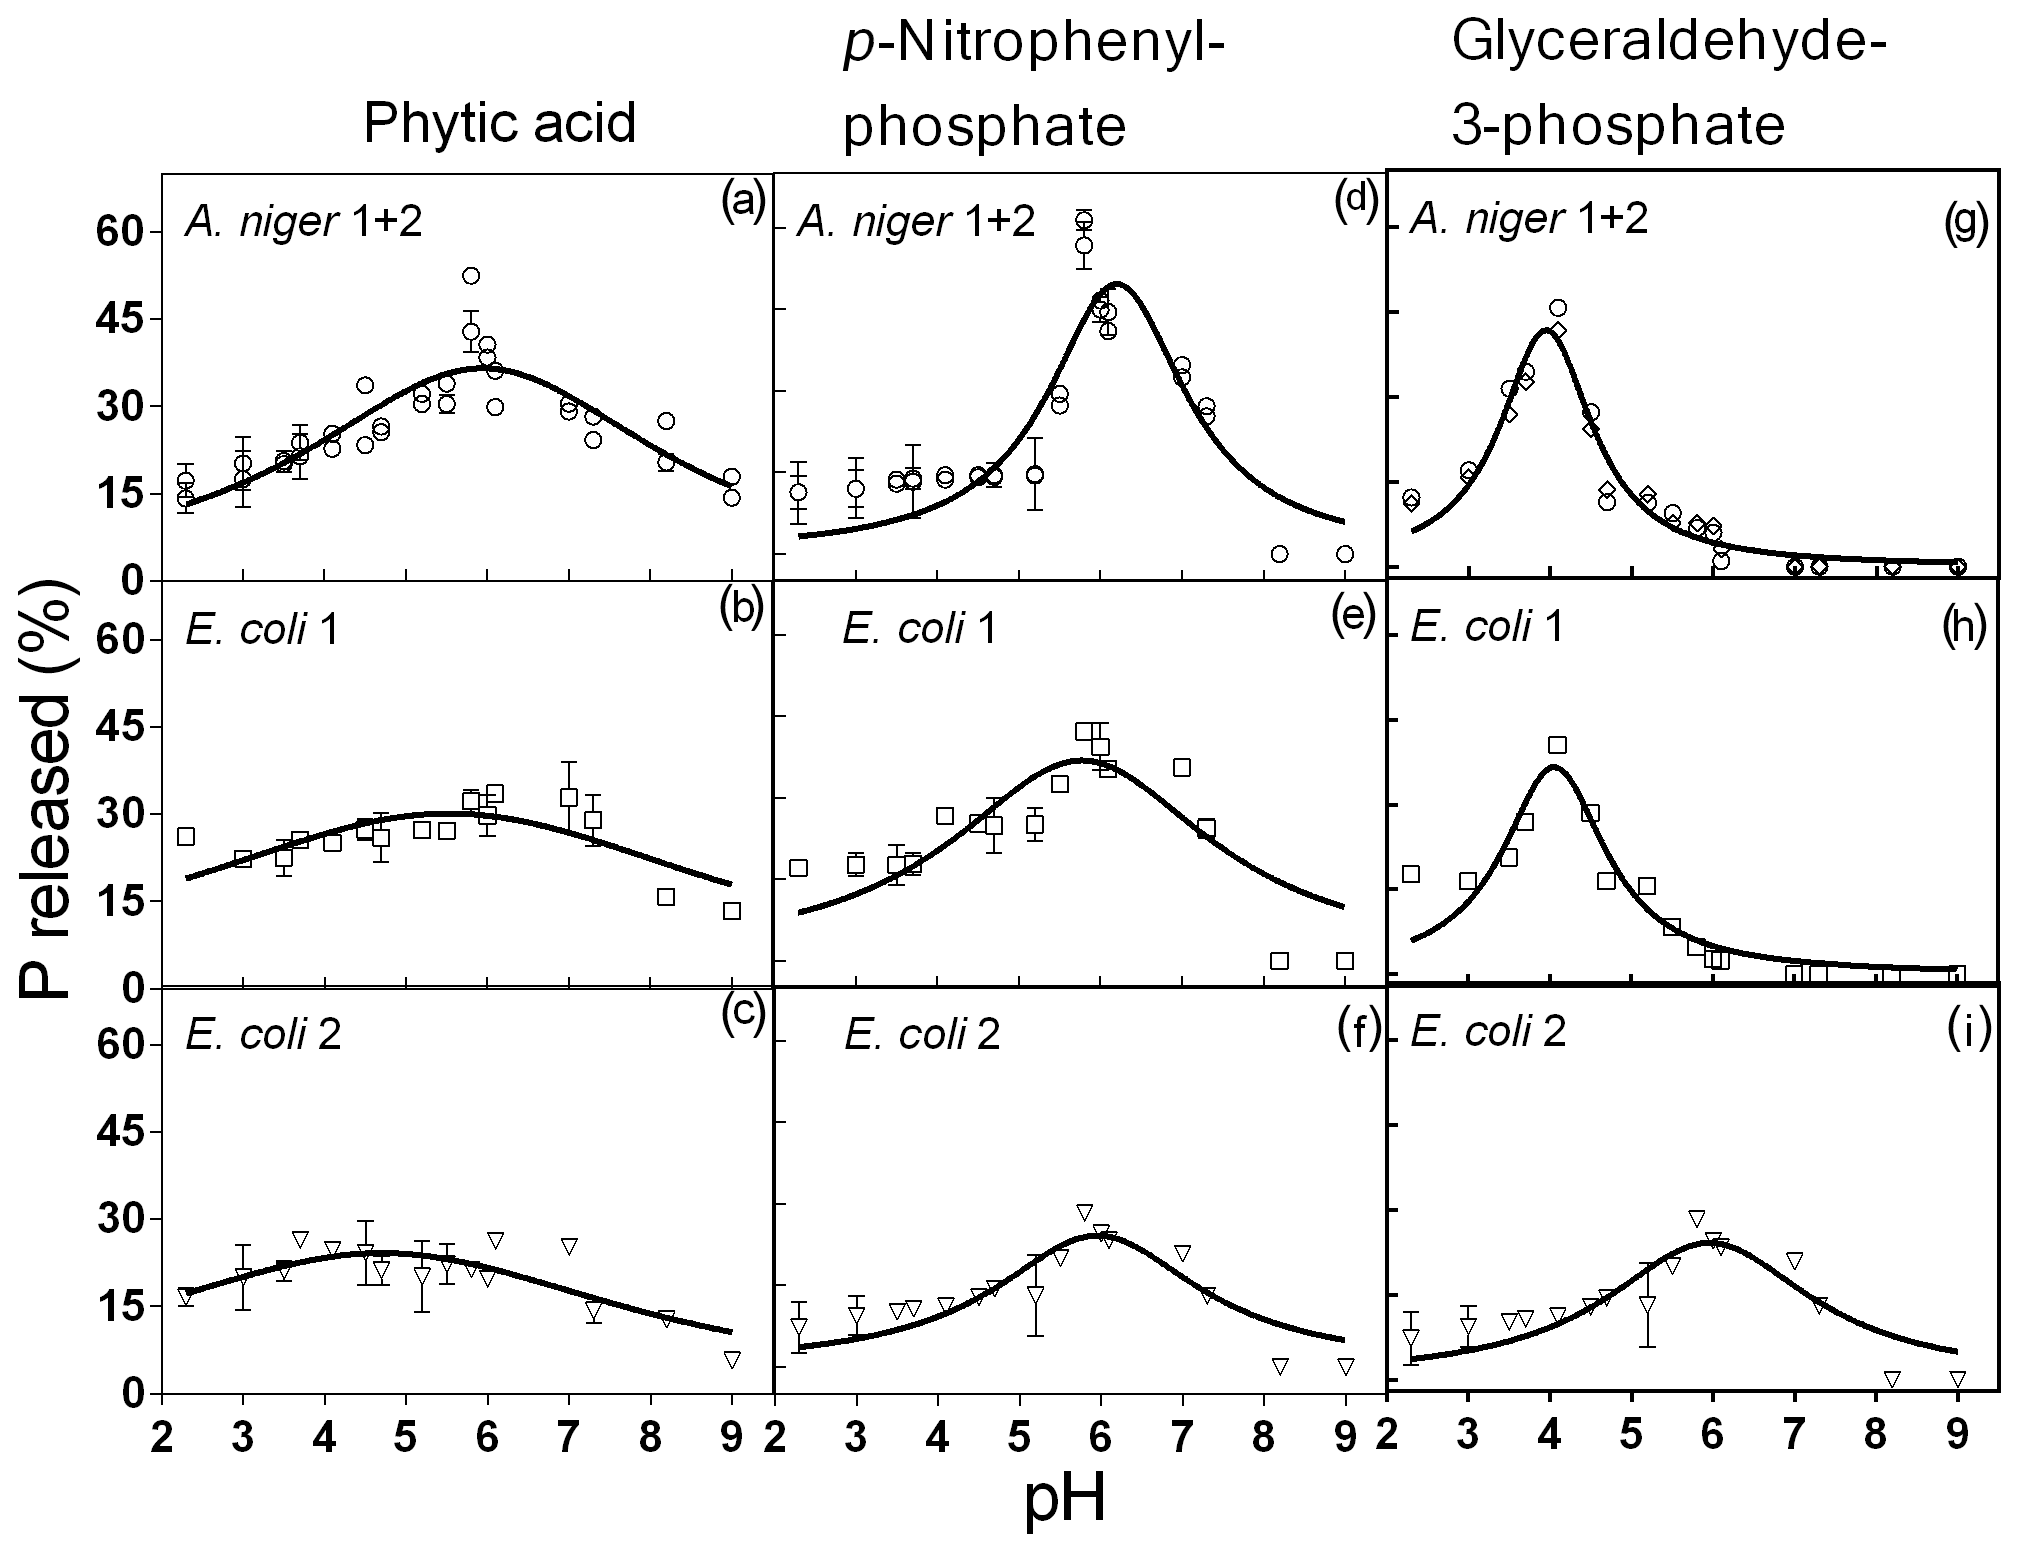
Figure 2Phytase activity measured at different pH levels with phytic acid, pNP and G3Phosphate as substrates. Four purified phytases (two isolated from A. niger and two from E. coli) were evaluated. In cases where significant differences between enzymes (analyzed using F tests) were not found, a unique curve was fitted. Each point represents the average of three observations minus the controls described in Sect. 2. Bars represent the standard error of the mean. The coefficients of each adjusted model are given in Table 2.
No linear relationship was observed between the parameter k and the analyzed soil characteristics for any of the four enzymes. For Vmax, we observed no linear relationship between soil characteristics for A. niger 1 or 2 or for E. coli 2. For E. coli 1, we found a significant correlation between the calcium content and Vmax (data not shown). Our results contrast with those reported by Yang and Chen (2017), who observed that soils showed a great variation in their capacity to retain phytases to the solid phase of the soil (19 %–40 % in our work vs. 17 %–93 % in Yang and Chen) and that sandy soils had the lowest phytase fixation. However, the fact that the seven Mollisols used in this work did not have a wide range of textures should be taken into account. There is a trade-off between phytase retention to the soil matrix and phytase activity, and the outcome of this would determine the real contribution of the enzyme to the soil P availability. A low retention of phytases implies more enzyme in the soil solution and, eventually, a faster release of soil organic P. Conversely, phytases in soil solution could be denatured by soil microorganisms (Yang and Chen, 2017), whereas retained phytases would be released gradually, providing additional available P at later stages (Mezeli et al., 2017).
3.2 Biochemical characterization
Protein analysis indicated that A. niger 1, A. niger 2, E. coli 1 and E. coli 2 phytases had 4.2, 5.4, 8.2 and 2, 13.01 µg enzyme mg−1 of product, respectively. In both pH and temperature experiments, no significant differences were observed between A. niger 1 and 2 in terms of released inorganic P; thus, data from both phytases were pooled to perform the analyses.
3.2.1 Effect of pH on enzyme activity
All four enzymes were effective in releasing P from phytic acid throughout the entire pH range tested. A. niger optimum activity was observed at a pH of 5.9, which is a value slightly higher than those reported in earlier reports (5–5.5; Konietzny and Greiner, 2002; Menezes-Blackburn et al., 2015; Sariyska et al., 2005). A 37 % release of the original P contained in the substrate was observed at the peak activity section of the pH range (Fig. 2a). In E. coli 1 and E. coli 2 phytases (Fig. 2b, c), the peak activity was observed at a pH of 5.5 and 4.7, with a 30 % and 24 % release of the initial P, respectively. Optimum pH values for E. coli were in line with previous reports (4.5–5; Konietzny and Greiner, 2002; Menezes-Blackburn et al., 2015). The maximum value of Pi released differed between Po sources (see coefficient a in Table 2), whereas the optimum pH for enzyme activity only differed between A. niger 1+2 and E. coli 2 (coefficient b in Table 2).
Table 3Coefficients of the adjusted Lorentzian peak functions for phytase activity at different temperature levels (see graphs in Fig. 3). The substrates used were phytic acid, pNP and G3Phosphate. Four purified phytases (two isolated from A. niger and two from E. coli) were evaluated. In cases where significant differences between enzymes (analyzed using F tests) were not found, a unique curve was fitted. Different letters correspond to significant differences between treatments (P<0.05, LSD procedure).
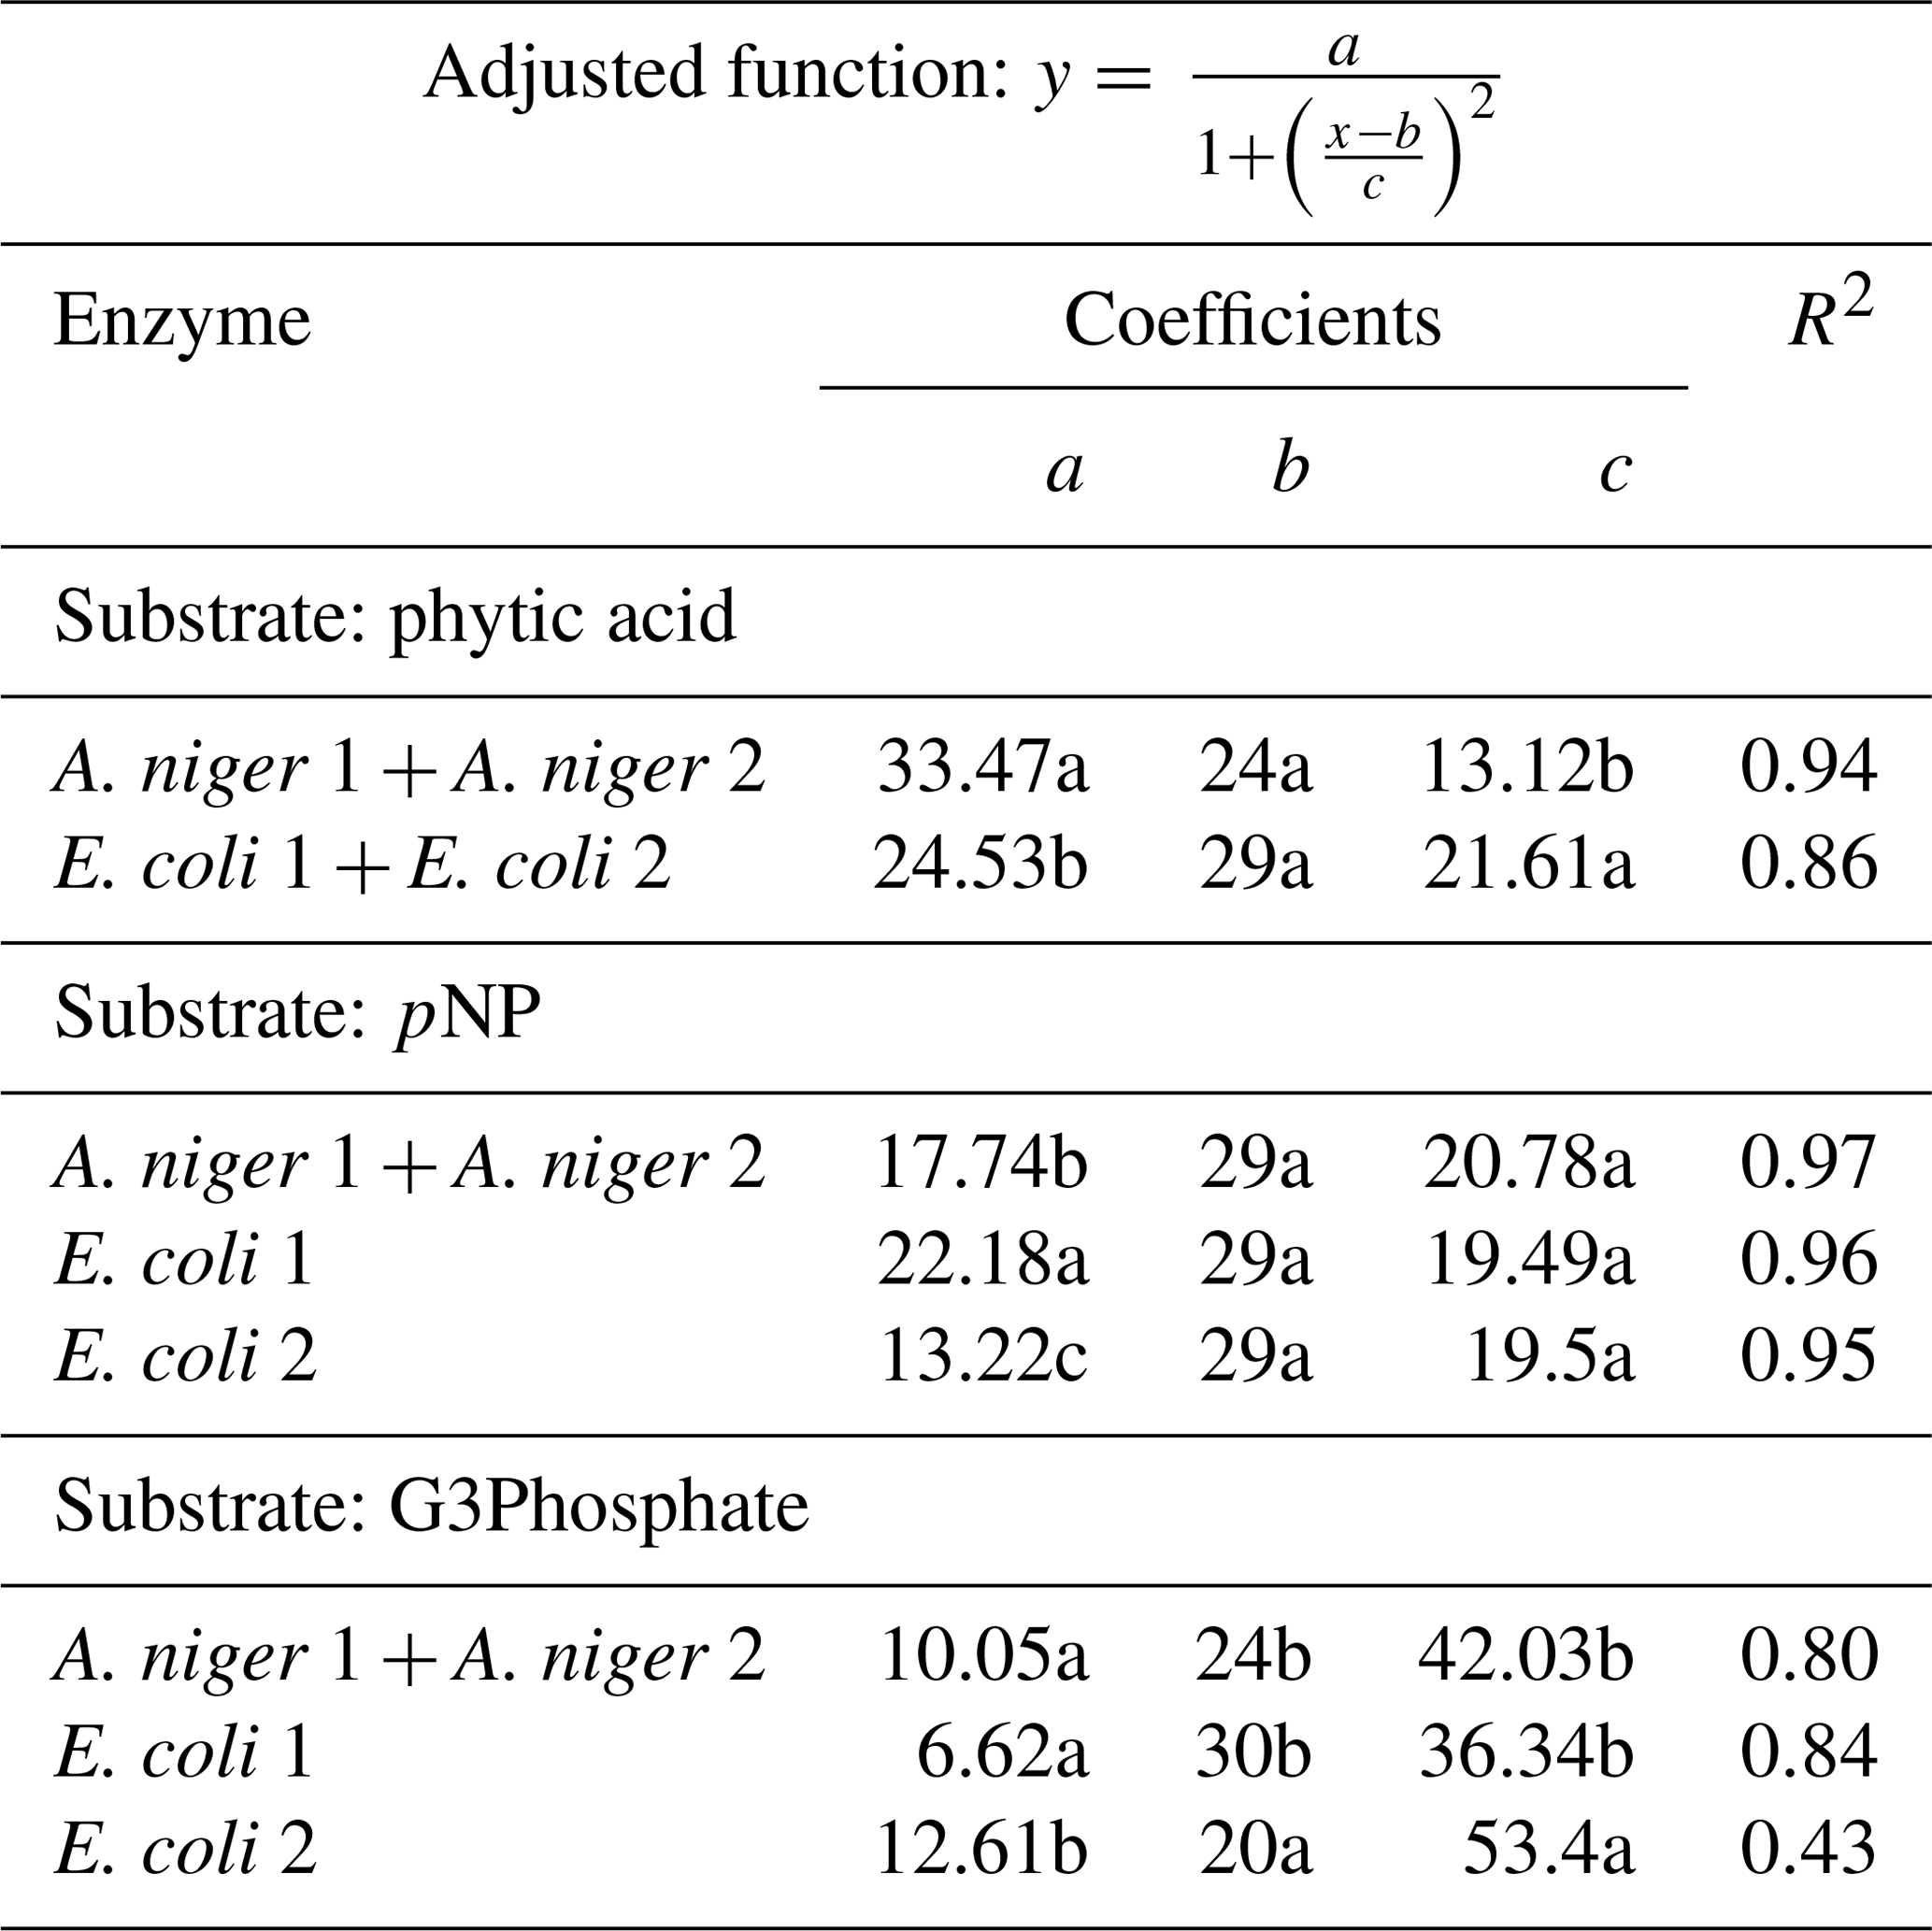
Probably due to the hydrolysis of the substrate, pH values higher than 7.8 were detrimental to the release of Pi from pNP in A.niger. The peak activity of A. niger phytases was verified at a pH of 6.2 (Fig. 2g), with a 50 % P release. For E. coli 1, the maximum release of P was 37 % at a pH of 5.8 (Fig. 2h), whereas for E. coli 2, the values were 24 % and a pH of 5.9 (Fig. 2i). The comparison of the functions for the four enzymes revealed that they only differed with respect to the a coefficient (Table 2), which represents the maximum P release. We did not find previous reports determining the optimum pH for enzyme activity using pNP as the organic P source.
For the G3Phosphate substrate, P release sharply decreased at pH values higher than 6 in A. niger and E. coli 1 enzymes as well as at pH values higher than 8 in E. coli 2. A. niger, E. coli 1 and E. coli 2 enzymes showed a peak of activity at pH 3.9, 4 and 6, with a P release of 42 % (Fig. 2d), 37 % (Fig. 2e) and 24 % (Fig. 2f), respectively. No statistical differences were observed in the fitted coefficients between A. niger 1+2 and E. coli 1 functions, but these coefficients differed from those found for E. coli 2, revealing the particular shape of the function (Fig. 2i; coefficients a, b and c in Table 2). As mentioned for pNP, we did not find previous reports determining the optimum pH for enzyme activity using G3Phosphate as organic P source. Therefore, hypothesis (i) is only partially accepted, as although all four purified phytases had the ability to use the three substrates, they released more P from pNP than from phytic acid.
3.2.2 Effect of temperature on enzyme activity
The four enzymes remained active and could release Pi from the substrates throughout the whole temperature range evaluated (Fig. 3). When the substrate was phytic acid, both species of A. niger (1+2) showed the same response to temperature and, consequently, their functions were unified. The same occurred with the E. coli 1 and 2 phytases. A. niger showed maximum activity at 24 ∘C (Fig. 3a), releasing 33 % of the original P contained in the substrate. For E. coli enzymes (Fig. 3b), the peak was detected at 29 ∘C, with a 25 % P release. The three coefficients of the function fitted for each pair of enzymes showed significant differences (Table 3), which reflects the fact that A. niger had the maximum release of P, although at a lower temperature than in E. coli. No difference between the four tested enzymes was found in the amount of P released. Data obtained on enzyme activity with phytic acid as the substrate agree with Hayes et al. (1999), who found maximum activities in the 0–40 ∘C range. Other authors (Azeem et al., 2014; Sariyska et al., 2005) have found maximum activities between 55 and 65 ∘C.

Figure 3Phytase activity measured at different temperature levels with phytic acid, pNP and G3Phosphate as substrates. Four purified phytases (two isolated from A. niger and two from E. coli) were evaluated. In cases where significant differences between enzymes (analyzed using F tests) were not found, a unique curve was fitted. Each point represents the average of three observations minus the controls, as described in Sect. 2. Bars represent the standard error of the mean. Coefficients of each adjusted model are observed in Table 3.
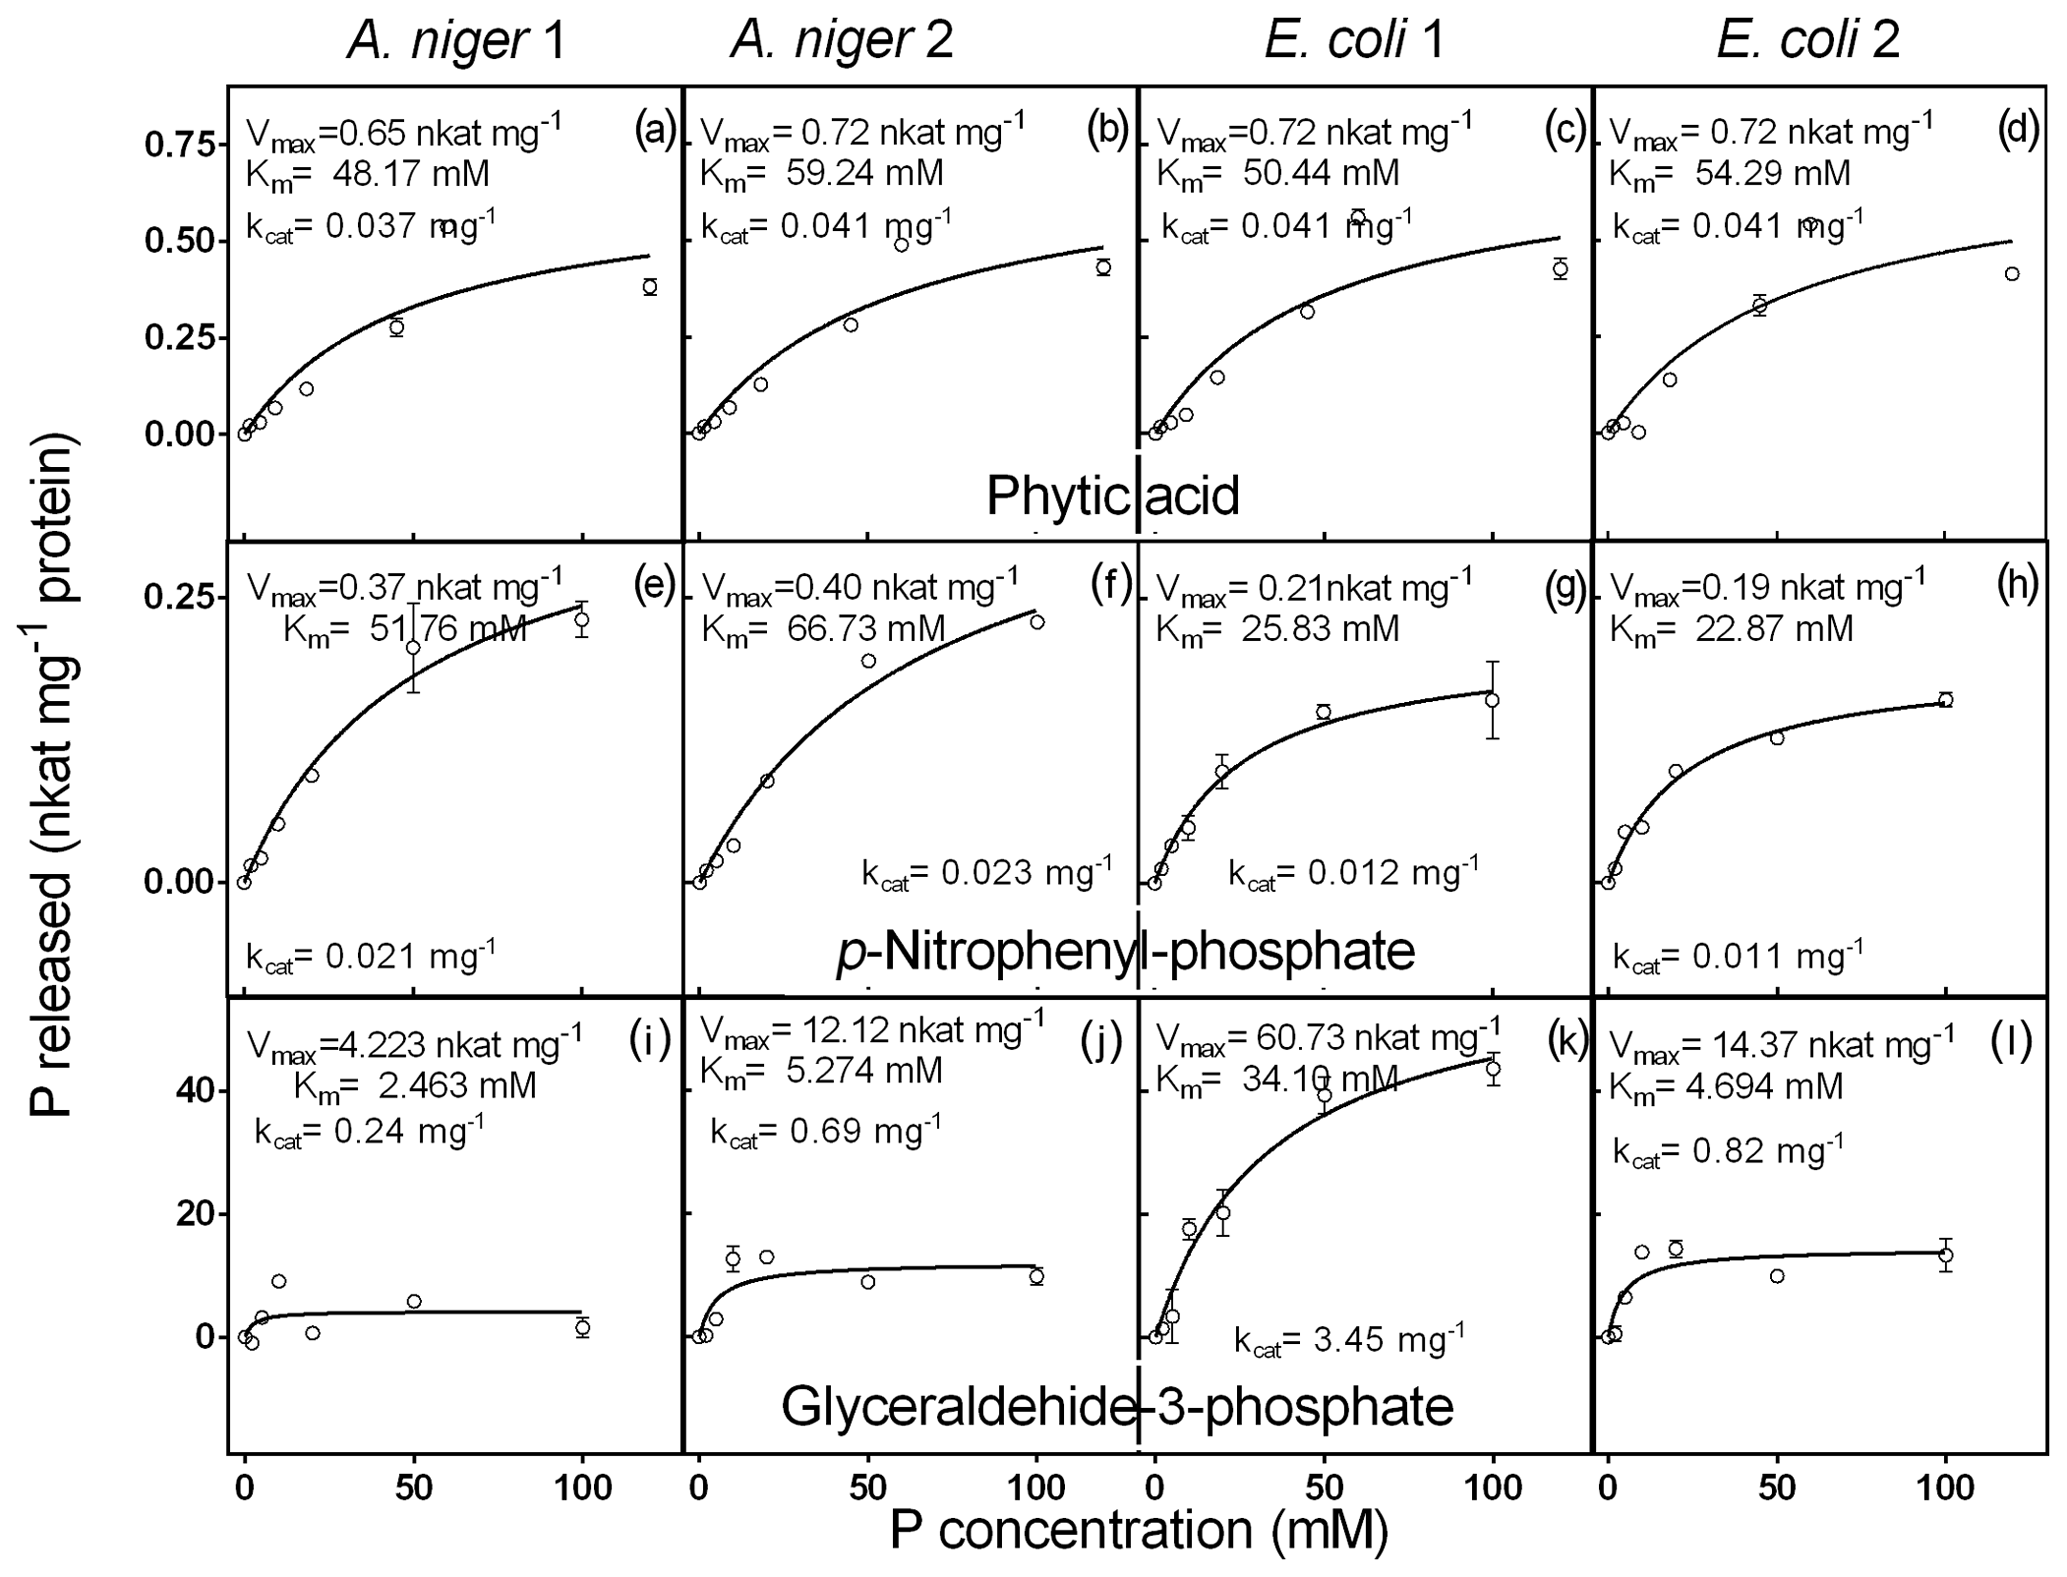
Figure 4Kinetic parameters for phytic acid, pNP and G3Phosphate as substrates of purified phytases (two isolated from A. niger and two from E. coli). The activity was determined at different concentrations of P (0 to 100 mM) contained in phytic acid substrate. Each point represents the average of three observations minus the controls, as described in Sect. 2. Bars represent the standard error of the mean.
When pNP was used as the substrate, the four enzymes showed a somewhat equivalent range of optimum temperatures to those found for phytic acid. For this substrate, the two A. niger enzymes showed peak activity at 29 ∘C, releasing 17 % of the substrate P (Fig. 3f). E. coli 1 phytase (Fig. 3g) released 22 % of P at 29 ∘C, and E. coli 2 (Fig. 3h) also displayed peak activity at 29 ∘C but had lower P release (13 %). When comparing the coefficients of the fitted curves, they only differed with respect to the a coefficient (Table 3), representing the maximum P released.
When G3Phosphate was used as the substrate, the two A. niger enzymes showed similar behavior (Fig. 3c) with a peak activity at 24 ∘C and a 10 % release of the P contained in the substrate. The E. coli 1 enzyme released 7 % of the substrate P at 30 ∘C (Fig. 3d), and E. coli 2 (Fig. 3e) showed maximum activity at 20 ∘C, releasing 13 % of the original P. No difference was observed between adjusted coefficients of the A. niger 1+2 and E. coli 1 functions, but they differed from the E. coli 2 coefficients (coefficients a, b and c in Table 3). We did not find previous reports determining the optimum temperature for phytase activity using pNP and G3Phosphate as the organic P sources.
3.2.3 Kinetic parameters
The response of the four enzymes to increasing concentrations of phytic acid is shown in Fig. 4a–d. A. niger 2, E. coli 1 and 2 did not differ with respect to the Vmax value (0.7 nkat mg−1), whereas A. niger 1 showed a slightly lower value (0.6 nkat mg−1). Km values of the four enzymes covered a narrow range (48–59 mM). A. niger 1 had the highest affinity (48.2 mM), followed by E. coli 1 (50.4 mM), E. coli 2 (54.3 mM) and A. niger 2 (59.2 mM). The Km values for phytic acid observed in our experiments were somewhat lower than those found by Konietzny and Greiner (2002) and Menezes-Blackburn et al. (2015). These differences could be related to the methodological approach, i.e., the buffer and temperature conditions. For example, some inhibitory effects of the Ca2+ concentration of the buffer on the enzyme activity can affect the kinetic parameters (Vohra and Satyanarayana, 2003; Nannipieri et al., 2012). However, despite the relatively low enzyme affinity for phytic acid, the proportion of P released at optimum conditions was high (24 % to 41 % after 1 h of incubation, Fig. 2).
Phytase activity of the purified enzymes in response to increasing concentrations of pNP showed a very narrow range of Vmax values (0.2 to 0.4 nkat mg−1; Fig. 4). E.coli 2 had the lowest Vmax and the highest substrate affinity (0.2 nkat mg−1 and 22.8 mM), followed by E. coli 1 (0.2 nkat mg−1 and 25.8 mM), A. niger 1 (0.4 nkat mg−1 and 51.7 mM) and A. niger 2 (0.4 nkat mg−1 and 66.7 mM). These Km values are higher than those found by Soni et al. (2010) for A. niger phytases.
Finally, when G3Phosphate was used as the substrate (Fig. 4e, f, g, h), a wide range of Vmax values (4.2–60.7 nkat mg−1) was observed for the four enzymes. A. niger 1 showed the lowest value (4.2 nkat mg−1), followed by A. niger 2 (12.1 nkat mg−1), E. coli 2 (14.3 nkat mg−1) and E. coli 1 (60.7 nkat mg−1). Km values of the enzymes also had a wide range (2.4 to 34.1 mM). A. niger 1 showed the highest affinity for this substrate (2.5 mM), followed by E. coli 2 (4.6 mM), A. niger 2 (5.2 mM) and E. coli 1 (34.1 mM). We did not find reports in the literature where the kinetic parameters of phytases were evaluated using G3Phosphate as the substrate.
The results obtained partially support hypothesis (i), as the selected phytases showed a great ability to release P from different organic P sources; however, A. niger 1 and 2 and E. coli 1 released more P from pNP than phytic acid, whereas E. coli 2 had no preference for any particular substrate. Regarding the activity of phytases at different pH and temperature levels, phytases exhibited some differences in their pH and temperature levels with respect to reaching their optimum activity. In contrast, our results did not support the hypothesis (ii), as the retention of phytases by the soil solid phase did not have a clear association with the analyzed soil properties. In this regard, the fact that the seven selected soils belonged to the Mollisol order must be taken into account. After being added to the soil, tested phytases showed an adsorption to the soil solid phase that ranged from 20 %–40 %. Those phytases that remained in the solution could release Pi from the organic P of the soil, whereas phytases that remained adsorbed to the soil solid phase could be released later. All of the phytases studied remained active at the optimum soil pH range of the most productive agricultural soils (5–7). Similarly, optimal temperatures for phytase activity were also within the temperature range that is more suitable for most agricultural crops (20–30 ∘C). Our results suggest that purified phytases may constitute a feasible tool to complement P fertilization. Therefore, further experiments should be performed to evaluate the enzyme performance under field conditions and to establish the ability of phytases to release inorganic P from organic soil P sources, their interaction with soil microorganisms and to test if crops can capitalize on the eventual provision of the inorganic P released.
All data used in this work are given in the tables and figures. Original data are available upon request. Details for this study's replication are given in Sect. 2.
MMC, KBB and GR designed the experiments and the data analysis method. MMC performed the experiments and analyzed the data with GR. MMC prepared the paper with the contribution from all co-authors.
The authors declare that they have no conflict of interest.
This research has been supported by CONICET (grant no. PIP 0351), ANPCYT (grant no. PICT 3431) and the University of Buenos Aires.
This paper was edited by Jeanette Whitaker and reviewed by two anonymous referees.
Azeem, M., Riaz, A., Chaudhary, A. N., Hayatm, R., Hussain, Q., Tahir, M. I., and Imran, M.: Microbial phytase activity and their role in organic P mineralization, Arch. Agron. Soil Sci., 61, 751–766, https://doi.org/10.1080/03650340.2014.963796, 2015.
Cabello, M. J., Gutierrez Boem, F. H., Quintero, C. E., and Rubio, G.: Soil characteristics involved in phosphorus sorption in Mollisols, Soil Sci. Soc. Am. J., 80, 1585–1590, https://doi.org/10.2136/sssaj2016.07.0235n, 2016.
Cordell, D., Drangert, J. O., and White, S.: The story of phosphorus: Global food security and food for thought, Glob. Environ. Change, 2, 292–305, https://doi.org/10.1016/j.gloenvcha.2008.10.009, 2009.
Dalal, R. C.: Soil organic phosphorus, Adv. Agron., 29, 83–113, https://doi.org/10.1016/S0065-2113(08)60216-3, 1977.
El-Sherbiny, A. E., Hassan, H. M. A., Abd-Elsamee, M. O., Samy, A., and Mohamed, M. A.: Performance, bone parameters and phosphorus excretion of broilers fed low phosphorus diets supplemented with phytase from 23 to 40 days of age, Int. J. Poult. Sci., 9, 972–977, https://doi.org/10.3923/ijps.2010.972.977, 2010.
Fernandez, M. C. and Rubio, G.: Root morphological traits related to phosphorus-uptake efficiency of soybean, sunflower, and maize, J. Plant Nutr. Soil Sci., 178, 807–815, https://doi.org/10.1002/jpln.201500155, 2015.
Findeneg, G. and Nelemans, J.: The effect of phytase on the availability of P from myo-inositol hexaphosphate (phytate) for maize roots, Plant Soil, 154, 189–196, https://doi.org/10.1007/bf00012524, 1993.
George, T. S., Richardson, A. E., and Simpson, R. J.: Behaviour of plant-derived extracellular phytase upon addition to soil, Soil Biol. Biochem., 37, 977–988, https://doi.org/10.1016/j.soilbio.2004.10.016, 2005.
Harvey, P. R., Warren, R. A., and Wakelin, S.: Potential to improve root access to phosphorus: the role of non-symbiotic microbial inoculants in the rhizosphere, Crop Pasture Sci., 60, 144–151, https://doi.org/10.1071/CP08084, 2009.
Hayes, J. E., Richardson, A. E., and Simpson, R. J.: Phytase and acid phosphatase activities in extracts from roots of temperate pasture grass and legume seedlings, Funct. Plant Biol., 26, 801–809, https://doi.org/10.1071/PP99065, 1999.
Jorquera, M., Martinez, O., Maruyama, F., Marschner, P., and Mora, M. L.: Current and future biotechnological applications of bacterial phytases and phytase-producing bacteria, Microb. Environ., 23, 182–191, https://doi.org/10.1071/PP99065, 2008.
Konietzny, U. and Greiner, R.: Molecular and catalytic properties of phytate-degrading enzymes (phytases), Int. J. Food Sci. Tech., 37, 791–812, https://doi.org/10.1046/j.1365-2621.2002.00617.x, 2002.
Li, Y. F., Luo, A. C., Wei, X. H., and Yao, X. G.: Changes in phosphorus fractions, pH, and phosphatase activity in rhizosphere of two rice genotypes, Pedosphere, 18, 785–794, https://doi.org/10.1016/S1002-0160(08)60074-0, 2008.
Liu, L. Li, A., Chen, J., Su, Y., Li, Y., and Ma, S.: Isolation of a phytase-producing bacterial strain from agricultural soil and its characterization and application as an effective eco-friendly phosphate solubilizing bioinoculant, Commun. Soil Sci. Plant Anal., 49, 984–994, https://doi.org/10.1080/00103624.2018.1448863, 2018.
Lott, J., Ockenden, I., Raboy, V., and Batten, G.: Phytic acid and phosphorus in crop seeds and fruits: A global estimate, Seed Sci. Res., 10, 11–33, https://doi.org/10.1017/S0960258500000039, 2000.
Lowry, O. H., Rosebrough, N. J., Farr, A. L., and Randall, R. J.: Protein measurement with the Folin phenol reagent, J. Biol. Chem., 193, 265–275, 1951.
Mead, R., Curnow, R. N., and Hasted, A. M. (Eds.): Statistical Methods in Agriculture and Experimental Biology, 2nd Edn., Chapman & Hall, London, 1993.
Menezes-Blackburn, D., Gabler, S., and Greiner, R.: Performance of seven commercial phytases in an in vitro simulation of poultry digestive tract, J. Agr. Food Chem., 63, 6142–6149, https://doi.org/10.1021/acs.jafc.5b01996, 2015.
Menezes-Blackburn, D., Inostroza, N. G., Gianfreda, L., Greiner, R., Mora, M. L., and Jorquera, M. A.: Phytase-producing Bacillus sp. inoculation increases phosphorus availability in cattle manure, J. Soil Sci. Plant Nutr., 16, 200–210, https://doi.org/10.4067/S0718-95162016005000016, 2016.
Mezeli, M. M., Menezes-Blackburn, D., George, T. S., Giles, C. D., Neilson, R., and Haygarth, P. M.: Effect of citrate on Aspergillus niger phytase adsorption and catalytic activity in soil, Geoderma, 305, 346–353, https://doi.org/10.1016/j.geoderma.2017.06.015, 2017.
Misset, O.: Phytase, in: Handbook of Food Enzymology, edited by: Whitaker, J., Voragen, A., and Wong, D., Boca Raton, CRC Press, 687–706, https://doi.org/10.1201/9780203910450, 2002.
Mullaney, E. J. and Ullah, A. H. J.: Phytases: Attributes, Catalytic Mechanisms and Applications, in: Inositol Phosphates: Linking Agriculture and the Environment, edited by: Turner, B. L., Richardson, A. E., and Mullaney, E. J., CAB International, Oxfordshire, Oxford UK, 97–110, https://doi.org/10.1017/S002185960700737X, 2007.
Murphy, J. and Riley, J. P.: A modified single solution method for the determination of phosphate in natural waters, Anal. Chim. Ac., 27, 31–36, https://doi.org/10.1016/S0003-2670(00)88444-5, 1962.
Nannipieri, P., Giagnoni, L., Renella, G., Puglisi, E., Ceccanti, B., Masciandaro, G., Fornasier, F., Moscatelli, M. C., and Marinari, S.: Soil enzymology: classical and molecular approaches, Biol. Fertil. Soils, 48, 743–762, https://doi.org/10.1007/s00374-012-0723-0, 2012.
Richardson, A. E., Lynch, J. P., Ryan, P. R., Delhaize, E., Smith, F. A., Smith, S. E., Harvey, P. R., Ryan, M. H., Veneklaas, E. J., and Lambers, H.: Plant and microbial strategies to improve the phosphorus efficiency of agriculture, Plant Soil, 349, 121–156, https://doi.org/10.1007/s11104-011-0950-4, 2011.
Rubio, G., Pereyra, F. X., and Taboada, M. A.: Soils of the Pampean Region, in: The Soils of Argentina. World Soils Book Series, edited by: Rubio, G., Lavado, R. S., and Pereyra, F. X., Springer Int. Publ., 81–100, https://doi.org/10.1007/978-3-319-76853-3, 2019.
Ruyter-Hooley, M., Larsson, A. C., Johnson, B. B., Antzutkin, O. N., and Angove, M. J.: Surface complexation modeling of inositol hexaphosphate sorption onto gibbsite, J. Colloid Interface Sci., 440, 282–291, https://doi.org/10.1016/j.jcis.2014.10.065, 2015.
Sariyska, M., Gargova, S., Koleva, L., and Angelov, A.: Aspergillus niger phytase: Purification and characterization, Biotechnol. Biotec. Eq., 19, 98–105, https://doi.org/10.1080/13102818.2005.10817235, 2005.
Simpson, R. J., Oberson, A., Culvenor, R. A., Ryan, M. H., Veneklaas, E. J., Lambers, H., Lynch, J. P., Ryan, P. R., Delhaize, E., and Smith, F. A.: Strategies and agronomic interventions to improve the phosphorus-use efficiency of farming systems, Plant Soil, 349, 89–120, https://doi.org/10.1007/s11104-011-0880-1, 2011.
Steffens, D., Leppin, T., Luschin-Ebengreuth, N., Min Yang, Z., and Schubert, S.: Organic soil phosphorus considerably contributes to plant nutrition but is neglected by routine soil-testing methods, J. Plant Nutr. Soil Sci., 173, 765–771, https://doi.org/10.1002/jpln.201000079, 2010.
Tiessen, H.: Phosphorus in the global environment, in: The Ecophysiology of Plant-Phosphorus Interactions, edited by: White, P. J. and Hammond, J. P., Springer Science + Business Media B.V. Berlín, Alemania, 1–8, https://doi.org/10.1007/978-1-4020-8435-5_1, 2008.
Vohra, A. and Satyanarayana, T.: Phytases: Microbial sources, production, purification, and potential biotechnological applications, Crit. Rev. Biotechnol., 23, 29–60, https://doi.org/10.1080/713609297, 2003.
Yang, X. Z. and Chen, L. J.: Distribution of exogenous phytase activity in soil solid–liquid phases and their effect on soil organic P hydrolysis, J. Plant Nutr. Soil Sci., 180, 39–48, https://doi.org/10.1002/jpln.201600421, 2017.