the Creative Commons Attribution 4.0 License.
the Creative Commons Attribution 4.0 License.
 | 15 Nov 2019
Short-range-order minerals as powerful factors explaining deep soil organic carbon stock distribution: the case of a coffee agroforestry plantation on Andosols in Costa Rica
Tiphaine Chevallier
Kenji Fujisaki
Olivier Roupsard
Florian Guidat
Rintaro Kinoshita
Elias de Melo Viginio Filho
Peter Lehner
Alain Albrecht
Soil organic carbon (SOC) constitutes the largest terrestrial C stock, particularly in the Andosols of volcanic areas. Quantitative information on distribution of SOC stocks is needed to construct a baseline for studying temporal changes in SOC. The spatial variation of soil short-range-order minerals such as allophane usually explains the variability of topsoil SOC contents, but SOC data for deeper soil layers are needed. We found that within a 1 km2 Costa Rican basin covered by coffee agroforestry, SOC stocks in the upper 200 cm of soil were highly variable (24 to 72 kg C m−2). Topsoil SOC stocks were not correlated with SOC stocks present in deeper layers. Diffuse-reflectance mid-infrared (MIR) spectroscopy made possible the analysis of a large number of samples (69 soil profiles, i.e. 598 soil samples) for ammonium-oxalate and sodium-pyrophosphate-extractable forms of Al, Fe, and Si, as well as SOC content and bulk density. Using the MIR spectra, we identified two different soil materials, which were identified as allophanic and halloysitic soil material. Allophanic soil occurred on top of the halloysitic soil. The thickness of the allophanic soil material, rich in SRO minerals and related to a young andic A horizon, explained the variability of SOC. This study illustrates that knowledge of topography and pedogenesis is needed to understand and extrapolate the distribution of SOC stocks at landscape scales.
- Article
(3927 KB) - Full-text XML
-
Supplement
(211 KB) - BibTeX
- EndNote


Soil organic carbon (SOC) not only contributes importantly to soil fertility and productivity, but is also a larger pool of C than the world's vegetation and atmosphere combined (Lal, 2004). Those facts suggest that SOC is a potential sink for atmospheric CO2, especially in soils whose formerly high levels of SOC have become depleted through land use. Therefore, many benefits may accrue from quantitative research on spatial patterns of SOC stocks at scales ranging from landscapes down to individual experimental plots.
Among the many factors that affect those patterns are soil type, climate, topography, and vegetation biomass (Batjes, 2014; Jobbagy and Jackson, 2000). High spatial variations in SOC content can occur even at small scales (metres) (Gessler et al., 2000; Chevallier et al., 2000), and such variations increase the uncertainty of comparisons among SOC stocks under different land-management practices (Costa Junior et al., 2013). In addition, most calculations of global-level C budgets have not taken deep SOC into account because SOC at those levels is not considered to contribute much to the exchange of C between soil and the atmosphere. However, authors are now paying increased attention to dynamics and estimated storage capacities of deep SOC that underlies different ecosystems (Bounouara et al., 2017; Cardinael et al., 2015; Mathieu et al., 2015; Rasse et al., 2006; Shi et al., 2013). In a global review for tropical regions, Batjes (2014) estimated SOC stocks in the 0–200 cm depth range at 616 to 640 Pg C versus 201–213 Pg C in the 0–30 cm range. Attempting to decrease experimental uncertainty by measuring SOC at smaller spatial intervals can be impractical because of the time and expense of standard SOC analyses. Therefore, development of accurate, low-cost techniques is needed for quantifying SOC contents at the necessary spatial, horizontal, and vertical scales.
As a soil type on which to test those techniques, Andosols have three attractive traits: they store a disproportionate amount of soil carbon; their SOC patterns are spatially complex both vertically and horizontally (Mora et al., 2014); and their soil constituents associated with SOC in Andosols might be used as proxies for quantifying SOC contents via diffuse-reflectance mid-infrared spectroscopy (MIRS) (Kinoshita et al., 2016). Although Andosols represent only about 0.84 % of the terrestrial soils, they store approximately 5 % of the global soil C (Matus et al., 2014). Derived from volcanic material, they have high levels of short-range-order (SRO) minerals, e.g. allophane or imogolite; high SOC concentrations (Batjes, 2014; Feller et al., 2001; Torn et al., 1997); high water retention; and low bulk densities (Shoji et al., 1996). They can store up to 3 times as much SOC as non-Andosols. Clear correlations have been found between SOC content and allophane content (Basile-Doelsch et al., 2005) or aluminium organic matter complexes (Alp) (Percival et al., 2000; Shen et al., 2018). As explanations for the high SOC contents, most authors have posited that SOC in Andosols is stabilized against decomposition by some combination of (i) acidic condition; (ii) Al toxicity; (iii) SOC adsorption on the mineral surfaces (Mayer and Xing, 2001); (iv) complexation, precipitation, and formation of organo-metal (Al∕Fe) complexes, also called Al∕Fe humus complexes (Percival et al., 2000; Scheel et al., 2007; Torn et al., 1997); and (v) entrapment in the mesoporosity (Mayer, 1994) with a particular network structure (Chevallier et al., 2010; Mayer et al., 2004; McCarthy et al., 2008).
SOC in the deeper levels of Andosols has not been studied extensively. Volcanic regions with high percentages of Andosols (compared to the other soil types) showed some of the lowest degrees of vertical stratification of SOC stocks, but with a high degree of uncertainty. The ratio of SOC stocks at 0–30 cm to those at 0–100 cm has been evaluated as 0.48, with a coefficient of variation of 29 % (Batjes, 2014). The SRO mineral distribution in volcanic regions can be complex both vertically and horizontally (Churchman et al., 2016), especially in humid areas where (i) an active volcano produces thin, intermittent ash deposits, (ii) soil erosion causes movement of soil materials (Zehetner et al., 2003), and (iii) the ash weathers on slopes in zones from which Si is leached away (thereby enabling SRO minerals to form and persist) alternating with zones in which Si accumulates (thereby causing the formation of aluminosilicates like halloysite). Factors (ii) and (iii), especially, can combine to produce terrains in which older, SRO-depleted soils become overlain by newer, SRO-rich topsoils.
Previous work (Kinoshita et al., 2016) at the study site described in this article (a 1 km2 volcanic micro-watershed) showed that spatial variations in organo-Al complex and allophane contents mainly explained the high spatial variation of SOC contents of topsoils (from 48 to 172 g C kg−1 soil at 0–5 cm depth). Kinoshita et al. (2016) did not sample deeper layers of soil at the site. However, Kinoshita et al.'s correlations between SRO and SOC, together with Mora et al.'s (2014) data on the potentially complex distributions of SRO minerals in volcanic soils, suggested that deep-soil SOC stocks may be not related to topsoil SOC stocks. Thus, we hypothesized that SOC stocks would be highly variable as SRO mineral content along soil profiles and that deep SOC stocks may be not correlated with topsoil SOC stocks. Testing those hypotheses required the analysis of hundreds of soil samples from soil profiles (0–200 cm) at widely distributed locations within the site. The results provided a large database with which to test an additional hypothesis: that signatures of SRO minerals in MIR spectra of soil samples would be useful proxies to predict the type of soil material (andic vs. halloysitic soil material), SOC, and bulk density (Bd).
Several authors have shown that diffuse-reflectance MIR spectroscopy is a time- and cost-effective analysis to quantify SOC contents. Therefore, MIR spectroscopy has become increasingly popular for spatial mapping of SOC (Ben-Dor et al., 2009; Clairotte et al., 2016; Nocita et al., 2015; Visacarra Rossel et al., 2016). Especially in the MIR region, each of a soil's mineral constituents affects spectra in a characteristic way. For example, absorbance peaks of allophane and imogolite, two SRO minerals that are specific to Andosols, are near 1000 cm−1. In contrast, the absorbance peaks of polymerized silicates are near 350 cm−1 (Parfitt, 2009). As SRO minerals control soil Bd (Shoji et al., 1996) and SOC content (Torn et al., 1997), SRO signatures in MIRS spectra may be useful proxies for soil Bd and SOC. Therefore, MIR spectroscopic analysis could replace soil extractions (Janik et al., 1998) and be used to classify soil samples as Andosols or non-Andosols. Based upon those classifications, MIRS could be appropriate for spatial mapping of SROs and SOCs in volcanic areas where soil age, type, and andic properties vary. In summary, the three hypotheses tested were that (1) spatial distribution of SOC stocks at depths down to 200 cm can vary dramatically in volcanic areas, even within a small watershed; (2) surface SOC stocks in volcanic areas are not reliable predictors of stocks that might exist down to depths of 200 cm; and (3) MIRS is an effective and reliable technique for classifying soil materials according to some characteristics of andic soils associated with contents of SRO minerals.
2.1 Site description
Previous authors have studied the site and described it in detail (Kinoshita et al., 2016; Gómez-Delgado et al., 2011). It is a 0.9 km2 watershed located in the central Caribbean area of Costa Rica. More specifically, it is located within the Aquiares Coffee Farm (83∘43′35′′ W; 9∘56′35′′ N) in the Reventazón River basin on the slope of the Turrialba volcano. The site's elevation ranges from 1020 to 1280 m a.s.l., and the mean slope is 11.31∘. Mean annual precipitation was 3014 mm between 1973 and 2009. The climate is tropical humid without a dry season; the mean annual temperature is 19.5 ∘C. According to Mora-Chinchilla (2000), volcanic avalanche deposits form the geology of the area, which was originally produced by the collapse of a 1.3 km wide strip of the south-eastern slope of the Turrialba volcano. The Turrialba deposits are mainly andesitic volcanic ashes. Indications of lava flows, agglomerates, lahars, and ashes are also present. Thin ash deposits still occur regularly; the last was in mid-2016. The site's soils are classified as Andosols (Payan et al., 2009), with pH 5 at the surface and 6 below 1 m (data not shown).
Before the introduction of the coffee in 1975, the watershed's lands were occupied by housing and gardens – including a cardamom plantation – all of which had replaced a pristine forest. Since 1975, the vegetation has consisted of coffee trees (Coffea arabica L., var Caturra, 6300 trees ha−1) and Erythrina poeppigiana leguminous shade trees at a density of 7.4 trees ha−1. The Aquiares farm is intensively managed, with regular pruning and applications of fertilizer (214±44 ). Its management of pests and weeds complies with Rainforest Alliance™ standards. Coffee yields were 1375±341 (1994–2011).
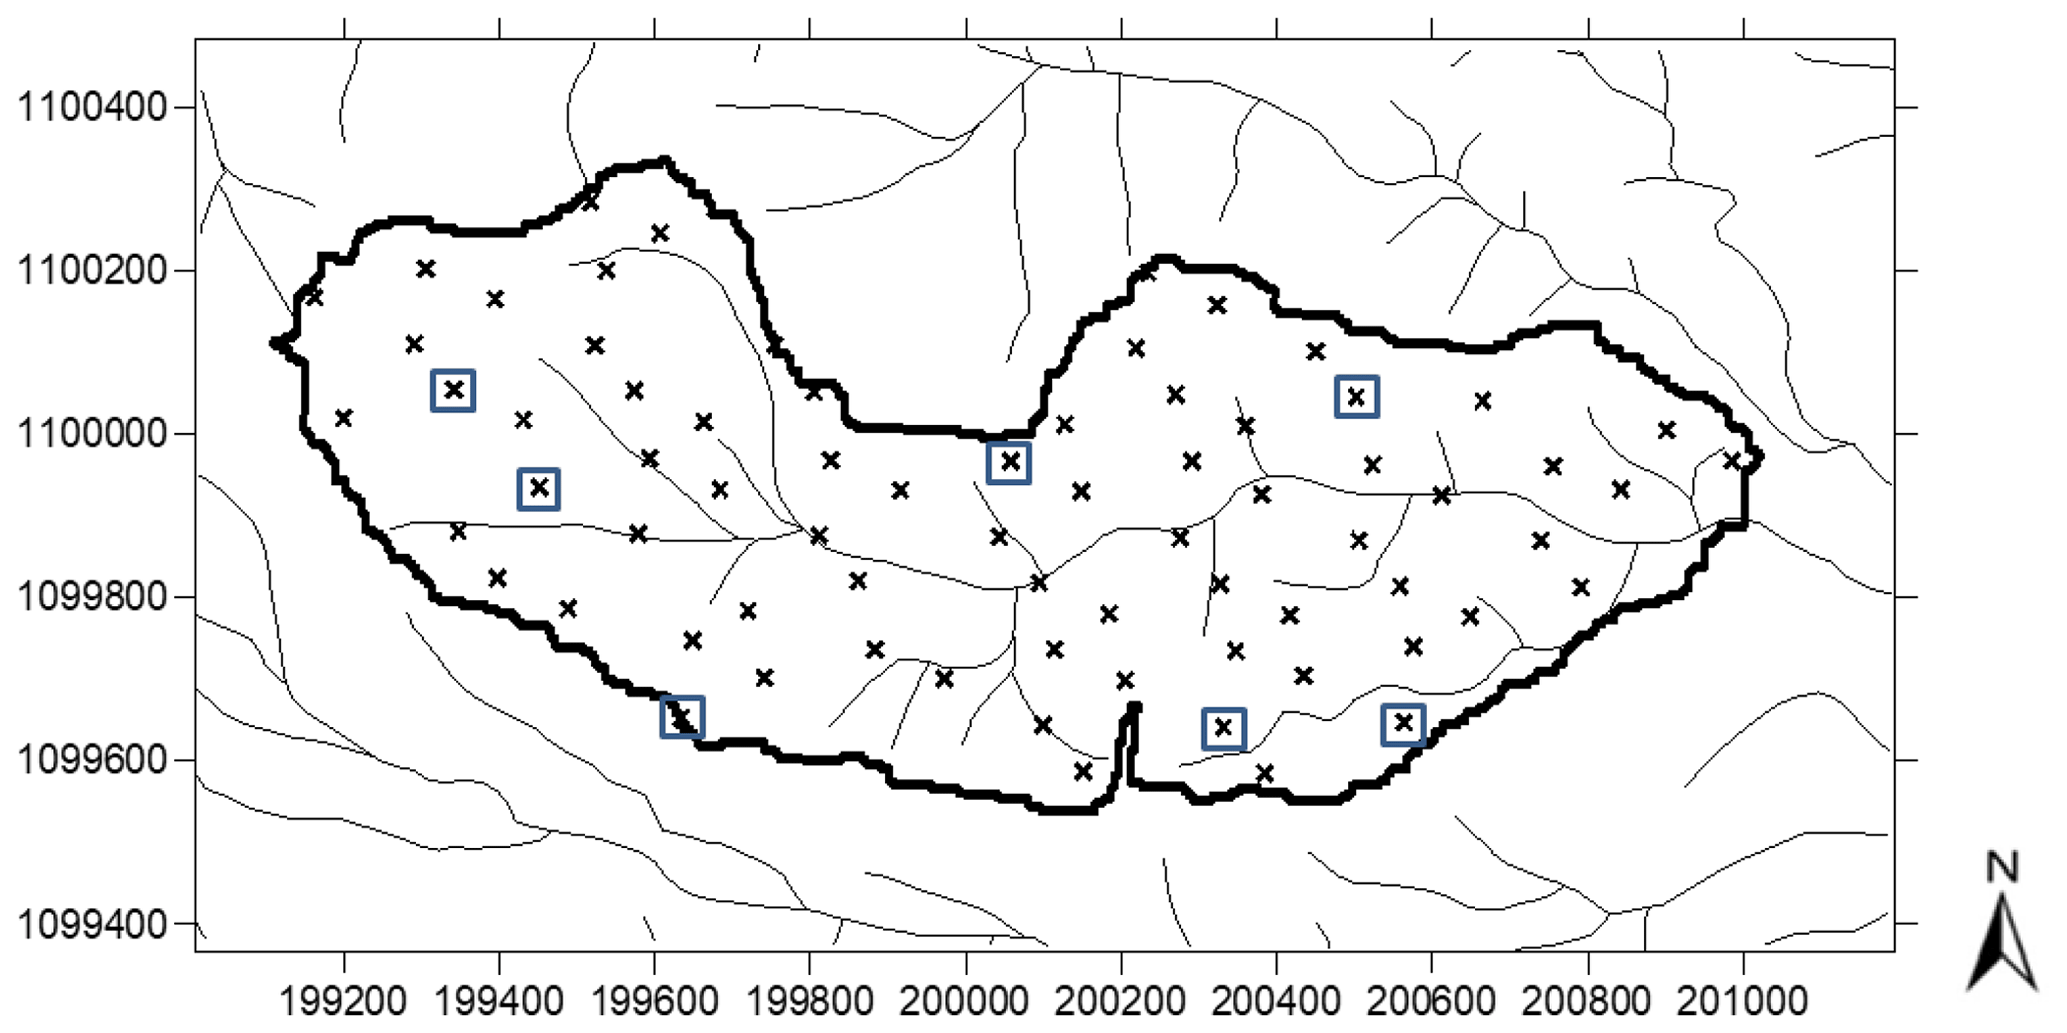
Figure 1Map of the study site: a 1 km2 micro-watershed. “X” symbols mark the 69 sampling locations. The seven squares show where pits were dug down to a depth of 2 m for bulk-density measurements. Thin lines indicate permanent stream channels. Numbers along the axes are UTM coordinates. See Gómez-Delgado et al. (2011) for more geographical details.
2.2 Soil sampling
2.2.1 Soil-profile samples for MIRS and chemical analyses
Taking into account Kinoshita et al.'s (2016) data on the spatial variation of SOC contents in the study site's topsoils, we chose 69 sampling points, all of them within an inter-row of coffee plants (Fig. 1). At each location, after removing surface plant residues, we used a hand-driven, 5 cm diameter steel auger to extract the soil profile down to the lithic contact or 200 cm. Each soil profile thus consisted of 4 to 10 20 cm thick soil samples, depending on the soil depth at each location. The soil samples (a total of 598) were then oven-dried at 40 ∘C for 72 h and ground to <200 µm for MIRS and chemical analyses.
2.2.2 Samples for Bd determination
Because digging soil pits for bulk density is tedious, and because the spatial variability of Bd may be less than that of SOC contents, at least in non-Andosols (Don et al., 2007), we collected samples for Bd determination at only 7 of the 69 locations identified in Sect. 2.2.1. The seven locations were chosen because of their locations and the spectral characteristics of their corresponding MIRS samples (see Sect. 2.4.1). For logistical reasons, the soil pits for bulk density could not be dug at exactly the same points where MIRS samples had been obtained. However, every pit was dug at a distance of less than 100 cm from the corresponding MIRS-sample location. Each pit was dug at depth intervals of 20 cm to a depth of 200 cm. Four replicates were sampled from each soil layer of each pit.
2.3 Acquisition and pre-processing of MIR spectra
For each of the 598 soil samples, we acquired a reflectance spectrum in the MIR region at 934 wavenumbers between 4000 and 400 cm−1, at 3.86 cm−1 intervals. The spectrophotometer (a Fourier transform Nicolet 6700, by Thermo Fischer Scientific, Madison, WI, USA) was equipped with a silicon carbide source, a Michelson interferometer as the dispersive element, and a deuterated triglycine sulfate detector. Soil samples were placed in a 17-well plate and then scanned using an auto-sampler (soil surface area scanned: ca. 10 mm2). The resulting MIR spectrum for each sample was the sum of 32 co-added scans. The body of the plate was used as a reference standard; it was scanned once per plate. Reflectance was converted to absorbance. Twenty wavenumbers were removed due to noisy spectra. The data set that resulted from acquisition and pre-processing consisted of 598 mean MIR spectra.
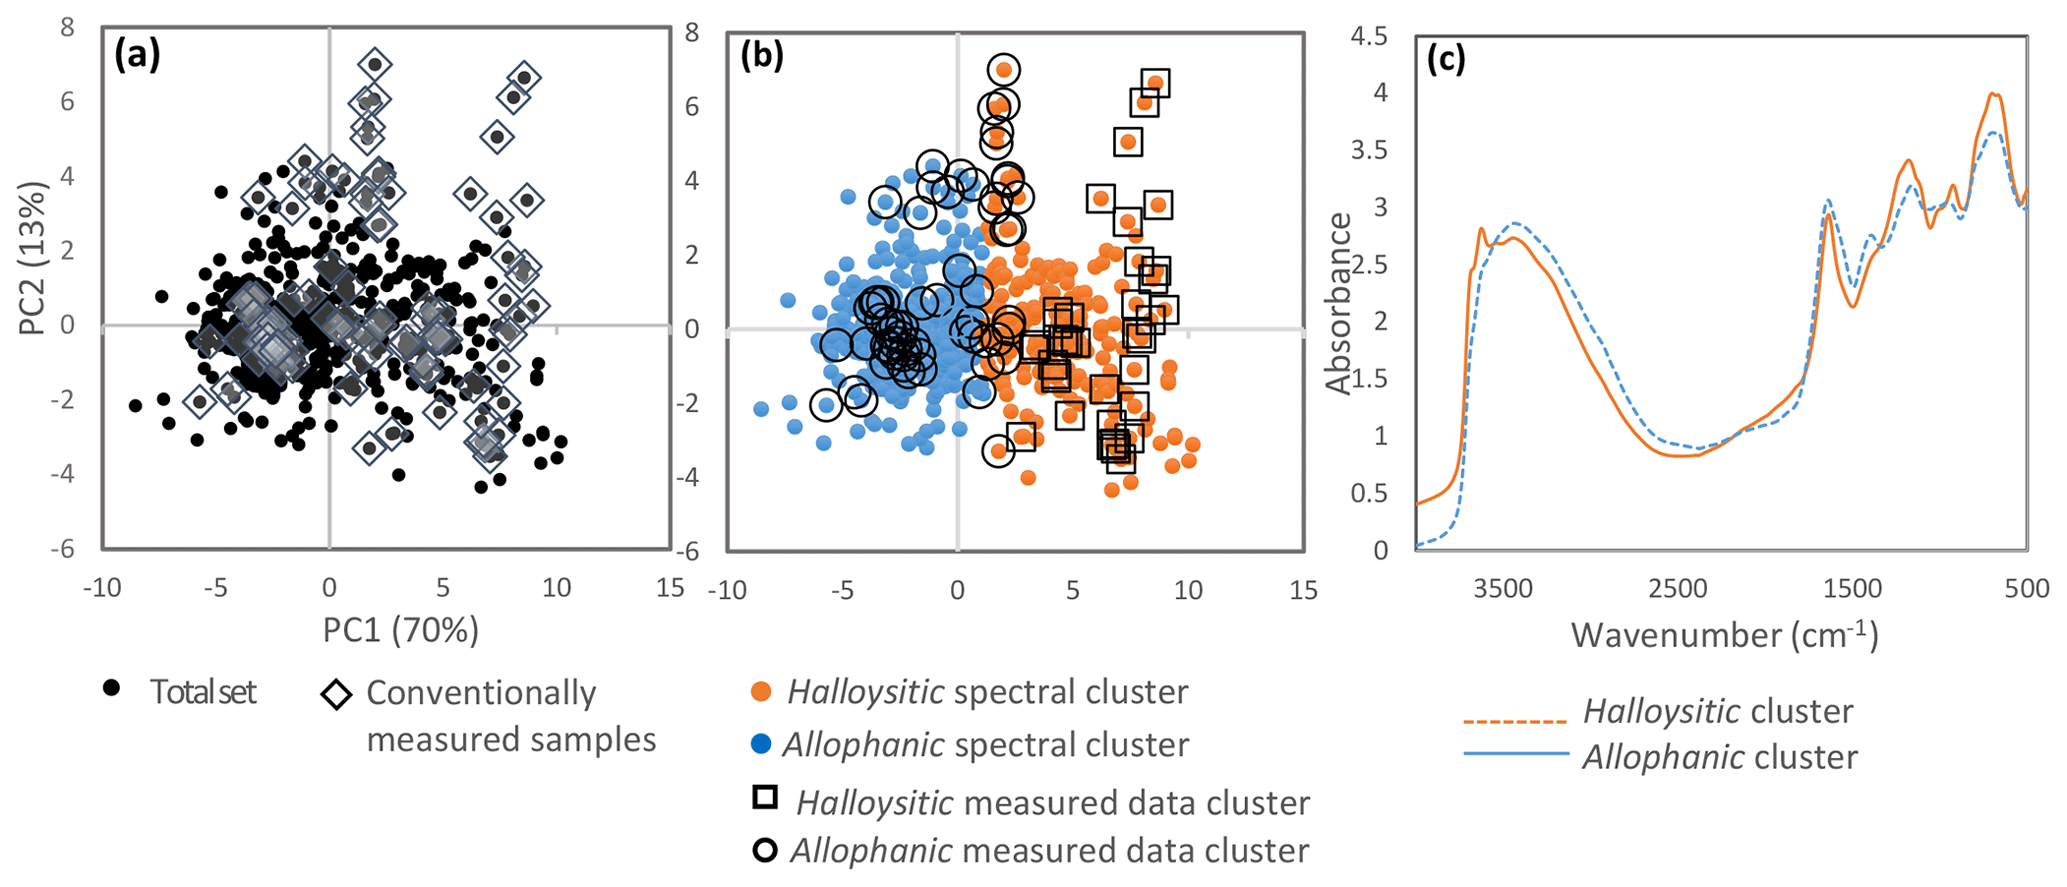
Figure 2Mid-infrared (MIR) spectra analyses for the total set of soil samples (n=598) and for the samples (n=98) that were chemically analysed conventionally to determine contents of Alo, Alp, Feo, and Sio. (a) Principal component analysis (PCA) of all spectra. Diamond shapes identify the 98 conventionally analysed samples. (b) PCA and identification of two clusters built either on the PCA of all the 598 MIR spectra (solid blue and red points) or on the PCA of the compositions of the 98 conventionally analysed samples (empty circles and squares). (c) Average MIR spectra of the soil samples from allophanic and halloysitic spectral clusters.
2.4 Laboratory soil analysis
2.4.1 Chemical analyses
Of the 69 soil profiles described in Sect. 2.2.1, we selected 10 spatially dispersed 200 cm soil profiles (comprising a total of 98 soil samples) as being representative of the total sample set from a spectral viewpoint (Fig. 2a). The 98 soil samples were analysed for SOC contents and extractable Al, Si, and Fe. The SOC contents were determined with a CHN elemental analyser (Carlo Erba NA 2000, Milan, Italy). Al, Si, and Fe associated with active amorphous constituents and organo-metal ligands (Alo, Sio, and Feo) were extracted with ammonium oxalate solution (Blakemore et al., 1981) as follows. Soil samples (0.5 g) were shaken for 4 h in the dark in 50 mL of a solution of 0.2 M ammonium oxalate and 0.2 M oxalic acid at pH 3. Then, after centrifuging and filtration, we measured the Alo, Sio, and Feo in the filtrate by ICP-AES.
Al and Fe associated with soil organic matter (Alp and Fep) were estimated by extraction with sodium pyrophosphate solution (Blakemore et al., 1981). We caution that pyrophosphate has been reported to extract different forms of Fe, some of which are not specifically related to organo-Fe complexes (Parfitt and Childs, 1988). For this analysis, soil samples (0.5 g) were shaken for 16 h in 50 mL of a 0.1 M sodium pyrophosphate solution at pH 10. After centrifuging and filtration, sodium-pyrophosphate-extractable Alp and Fep in the filtrate were determined by ICP-AES.
The data set that resulted from this task consisted of the 98 samples' respective contents of SOC; Sio; Alo and Alp; and Feo and Fep.
2.4.2 Bulk density (Bd)
Bulk densities were determined according to the soil-core method, using a bevelled cylinder (98 mL). The four replicates (Sect. 2.2.2) of each soil sample were oven-dried for 48 h at 105 ∘C and sieved at 2 mm to remove coarse fragments such as stones and living roots. Those fragments represented less than 1 % of each soil sample mass and therefore were considered negligible. The Bd of each soil sample was calculated as the average of the Bds of the sample's four replicates.
The data set that resulted from this task consisted of 66 Bd values, one value for each of the 10 soil depths at the seven sampling locations, except where the sampling pit could not be dug to the full 200 cm depth.
2.5 Development of models relating MIR spectra to Bd and contents of Alo, Alp, Sio, Feo, and SOC
2.5.1 Models for contents of Alo, Alp, Sio, Feo, and SOC
From the data sets for MIRS (Sect. 2.3) and laboratory analyses (Sect. 2.4.1), we developed predictive models for contents of Alo, Alp, Sio, Feo, and SOC. One model was developed for each constituent, for a total of five models. All of the models were based upon 69 samples, from seven soil profiles, that were common to both data sets. The other 29 samples that were common to both data sets were used for validating the models, as described below. The models were developed by fitting the samples' MIR absorbance spectra (with no mathematical pre-treatments) to the samples' measured contents of each of the five constituents. Fitting was done via modified partial least-squares regressions. The accuracy of each prediction model was determined by external validation using laboratory analyses and MIRS spectra of the above-mentioned 29 samples, which were from three different soil profiles. The accuracy was quantified by computing (i) the coefficient of determination (R2), (ii) the root mean square error (RMSE) between predicted and measured values, and (iii) the ratio (denoted as RPD) of the standard deviation of the value set to RMSE.
We also tested four additional calibration models for predicting SOC contents. These models were based on two spectral classes and two conventionally measured data classes. One model was built for each combination of spectral class and soil-type class. The two spectral classes and two soil-type classes were defined via two analyses. The first was a principal component analysis (PCA) and a K-means clustering analysis of the 598 soil spectra. The second was a PCA and a K-means clustering analysis of the 98 samples conventionally analysed data: Alo, Alp, Sio, Feo, Alo+0.5Feo, allophane, and (Terra et al., 2018). Because these models were built on a small number of soil samples (about 30 or 60 soil samples in one cluster), the accuracy of the prediction models was determined by cross validation, using the leave-one-out method.
2.5.2 Model for Bd
This model was based upon the 66 measured Bd values (Sect. 2.4.2) and the MIR absorbance spectra of soils from the seven corresponding sites. To build the model, we used modified least-squares regressions to fit the MIR absorbance spectra to the Bd values. Our Bd-prediction model (built on spectral signatures of soil samples passed through a 200 µm sieve) did not pretend to predict Bd sensu stricto, which is a physical property determined by soil constituents and their arrangements, i.e. the soil structure. Instead, it used specific vibrational processes of the SRO minerals and organo-metal complexes as proxies for predicting Bd. Because only 66 Bds were measured, we could not build two different models based on clusters (as we had done for SOC contents). Hence, we assessed the accuracy of the Bd-prediction model by cross validation, using the leave-one-out method.
2.6 Data analysis
2.6.1 Data calculations
In the case of samples whose contents of Alo, Alp, Sio, Feo, SOC, and Bds had not been measured analytically, we estimated those contents from the samples' MIR spectra, using the models described in Sect. 2.5. Then for each of the 598 soil samples, we calculated the following.
-
The degree of weathering of the volcanic glass is calculated as , with Alo and Feo in grams per 100 g of soil (Shoji et al., 1996).
-
Grams of allophane per 100 g of soil are calculated as , with Sio, Alo, and Alp given in grams per 100 g of soil (Mizota and Van Reewijk, 1989).
-
The atomic Al:Si ratio in the soil aluminosilicates is calculated as , with Sio, Alo, and Alp given in grams per 100 g of soil (Parfitt and Wilson, 1985, quoted in Parfitt and Childs, 1988). A ratio of Al:Si of about 2 is characteristic of imogolite, proto-imogolite, and Al-rich allophane. Ratios lower than 2 indicate Si-rich allophane and the presence of significant amounts of crystallized minerals (Levard et al., 2012).
-
SOC stock (kg C m−2) is calculated as SOC stock = with “e”, which refers to the 20 cm thickness of each of the 598 soil samples.
2.6.2 Statistical analyses
Effects of spectral cluster and soil depth on SRO minerals, organo-metal complexes and SOC contents, Bd, and SOC stocks were analysed with linear mixed models that considered soil profile a random effect. The t test was used to assess the effect of spectral cluster on the variable to be explained for each depth. A random forest regression model was used to evaluate and order the importance of SRO minerals and organic-metal complexes, spectral cluster, and soil depth for SOC contents. Random forest is a machine-learning technique based on randomly built decision trees. At each node, a subset of covariates is also randomly chosen. Random forest was used instead of multiple-linear-regression methods because it allows use of both categorical and numeric covariates, collinearity between covariates, and non-linear relationships between covariates and the variable to be explained. % IncMSE was used to assess the relative importance of covariates in explaining variability of SOC content. For a given covariate, % IncMSE is the difference between the mean standard error (MSE) of the model with permutation of this covariate and the model without that permutation. The larger the % IncMSE, the more important this covariate in predicting SOC content. We used R software (R Core Team, 2016) for the statistical analyses. Results were given for the 598 soil samples, but statistics on the conventionally measured variables can be found in the Supplement (Tables S1, S2, and Fig. S3).
2.6.3 Spatial maps
Golden Software Surfer V 8.0 was used for spatial mapping of the predicted SOC stocks, allophane contents, and thickness of the allophanic soil material layer (see Sect. 3.1.2 for a definition). The digital elevation model (DEM) used in some of the mapping was created from a vertical-resolution, digital-terrain model obtained from the TERRA-1998 project (scale ; CENIGA, 1998). The vertical and vertical resolutions of that model were 5 and 10 m respectively.
Table 1Validation statistics of modified partial least-squares (mPLS) regression for the models used to predict SOC and extractable Al, Si, and Fe contents from MIR spectra.
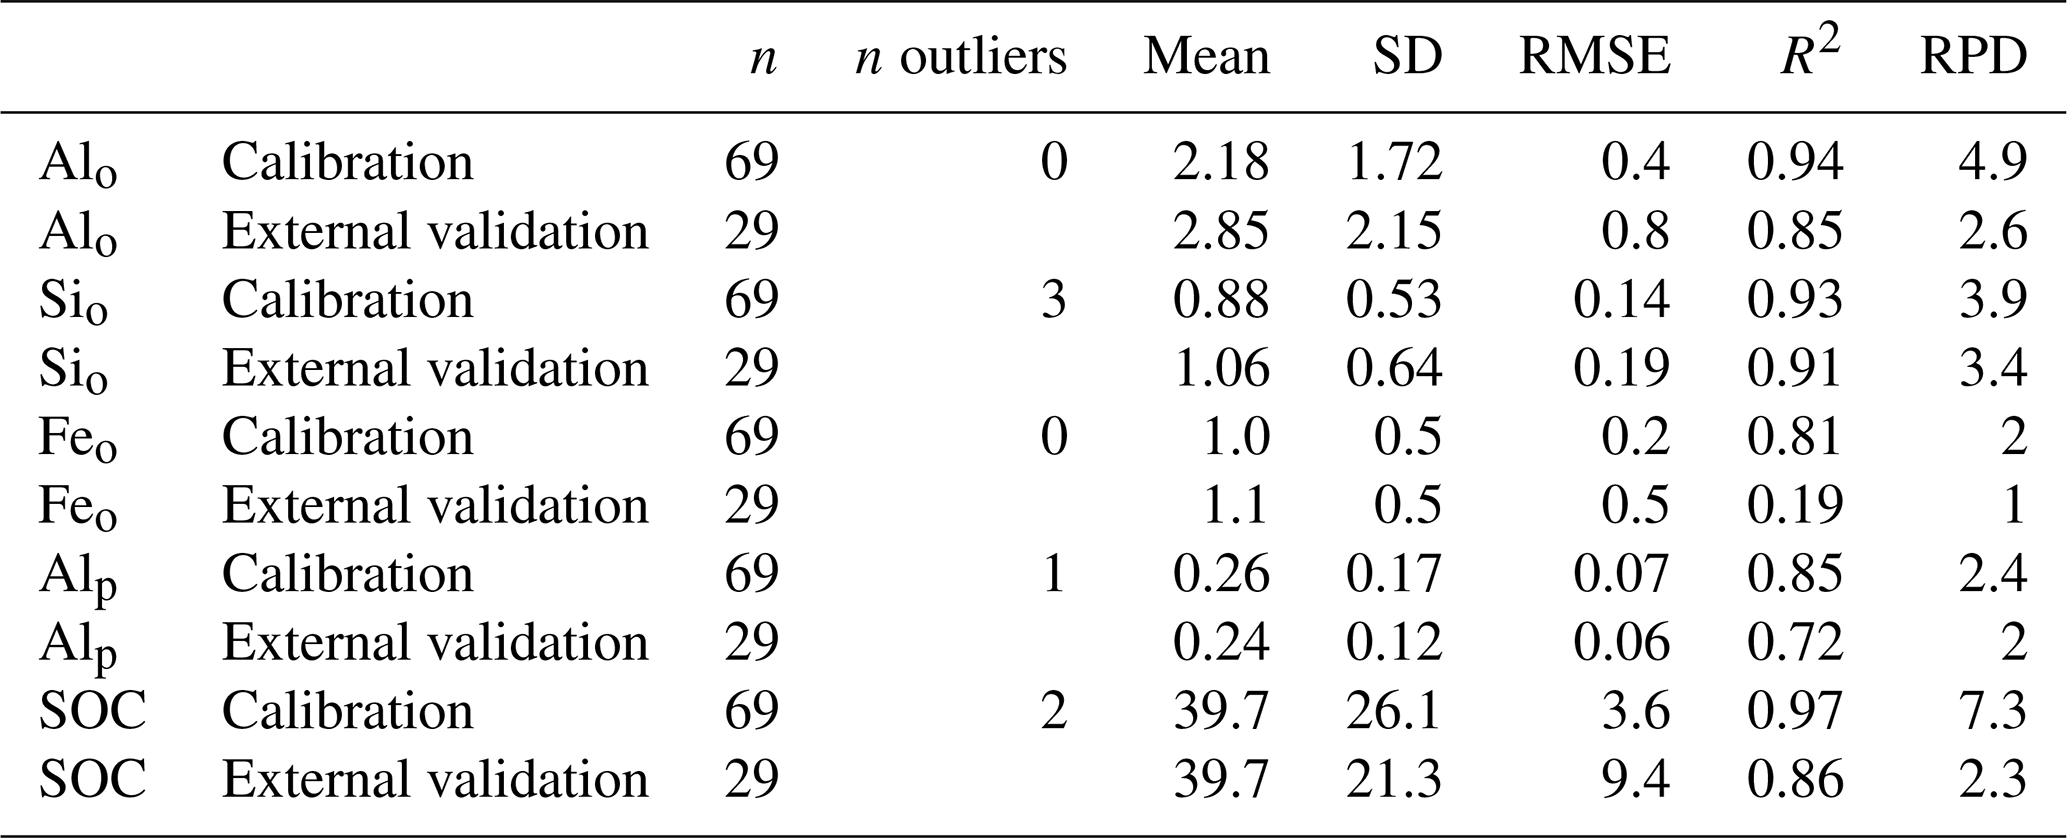
n: number of soil samples for calibration. Mean and standard deviation (SD) of the measured Alo, Sio, Feo, and Alp population (in g 100 g−1 soil) and SOC content (g kg−1) used for model calibration. RMSE: root mean square error, R2: cross-validation determination coefficient, RPD: ratio of SD to RMSE, SD: standard deviation.
3.1 Extractable Al, Si, and Fe
3.1.1 Prediction of extractable Al, Si, and Fe contents (SRO minerals and organo-metal complexes)
The five models for predicting contents of extractable Al, Si, and Fe from MIR spectra gave accurate results for the whole set of soil samples (Table 1) with RPD>2 (Chang et al., 2001). Our attempts to develop a prediction model for Fep content proved unsuccessful, probably because pyrophosphate extraction does not discriminate sufficiently among forms of Fe (Parfitt and Childs, 1988). The model for predicting Alp contents from MIR spectra gave negative values ( g Alp 100 g−1 soil) for 9 samples, all of which were among the 500 that were not analysed conventionally. Most of those nine samples were from two specific soil profiles (i.e. two locations). By convention, we set the Alp contents of those nine to zero when calculating their other soil characteristics. All other predicted contents of extractable Al, Si, and Fe contents were positive.
In previous published studies, Soriano-Disla et al. (2014) found that contents of oxalate-extractable forms could be predicted from MIR spectra, but Misnany et al. (2009) found otherwise. Our results indicated that MIR spectroscopy seems to be a promising tool for predicting contents of extractable Al, Si, and Fe in volcanic soils and thus contents of SRO minerals and organo-Al complexes, provided that the specific prediction models are based upon conventional analyses of a large set of representative samples. That was likely due to the specific peaks of imogolite and allophane in the MIR range (Parfitt, 2009). However, further studies are needed, especially on pyrophosphate-extractable elements.
3.1.2 Clustering according to soil type based upon MIR spectra, versus conventional analyses
MIR spectra for the 598 soil samples formed two distinct clusters (“blue” and “orange” in Fig. 2b), as did the conventionally analysed data of the 98 samples (“circle” and “square” in Fig. 2b). The data from the measured cluster represented by circle showed andic properties and were called the allophanic measured cluster by comparison to the other measured cluster represented by squares and called the halloysitic measured cluster. A comparison of the clusterings of the 98 samples that were analysed both conventionally and by MIRS is revealing. For the most part, samples whose MIR spectra are in the “blue” spectral cluster (see Fig. 2b) fell in the allophanic measured cluster, while samples whose spectra are in the “orange” spectral cluster fell in the halloysitic measured cluster. That correlation held true for all but 18 of the 98 samples. The conventionally analysed data of all 18 of those samples are in the measured allophanic cluster, but their spectra fall in the “orange” spectral cluster. In Fig. 2b, those samples are identifiable as the ones whose andic-property symbol is a circle that surrounds an “orange” spectral symbol. All of those occurrences along the border between the two spectral clusters reveal that the allophanic and halloysitic measured clusters overlap slightly. This study of the clusterings shows that MIR spectra depended upon some of the characteristics of andic soil samples and also shows a graduation of the two soil materials. Because of the above-described strong correlations between spectral clusters and measured clusters, we will denote the orange spectral cluster as the halloysitic spectral cluster and the blue spectral cluster as the allophanic spectral cluster from this point onward.
Table 2Organo-Al complexes and SRO mineral contents (means±standard deviation) of the predicted data of all soil samples (All) and for those in allophanic and halloysitic spectral clusters. Letters indicate significant differences among soil depth at p<0.05.
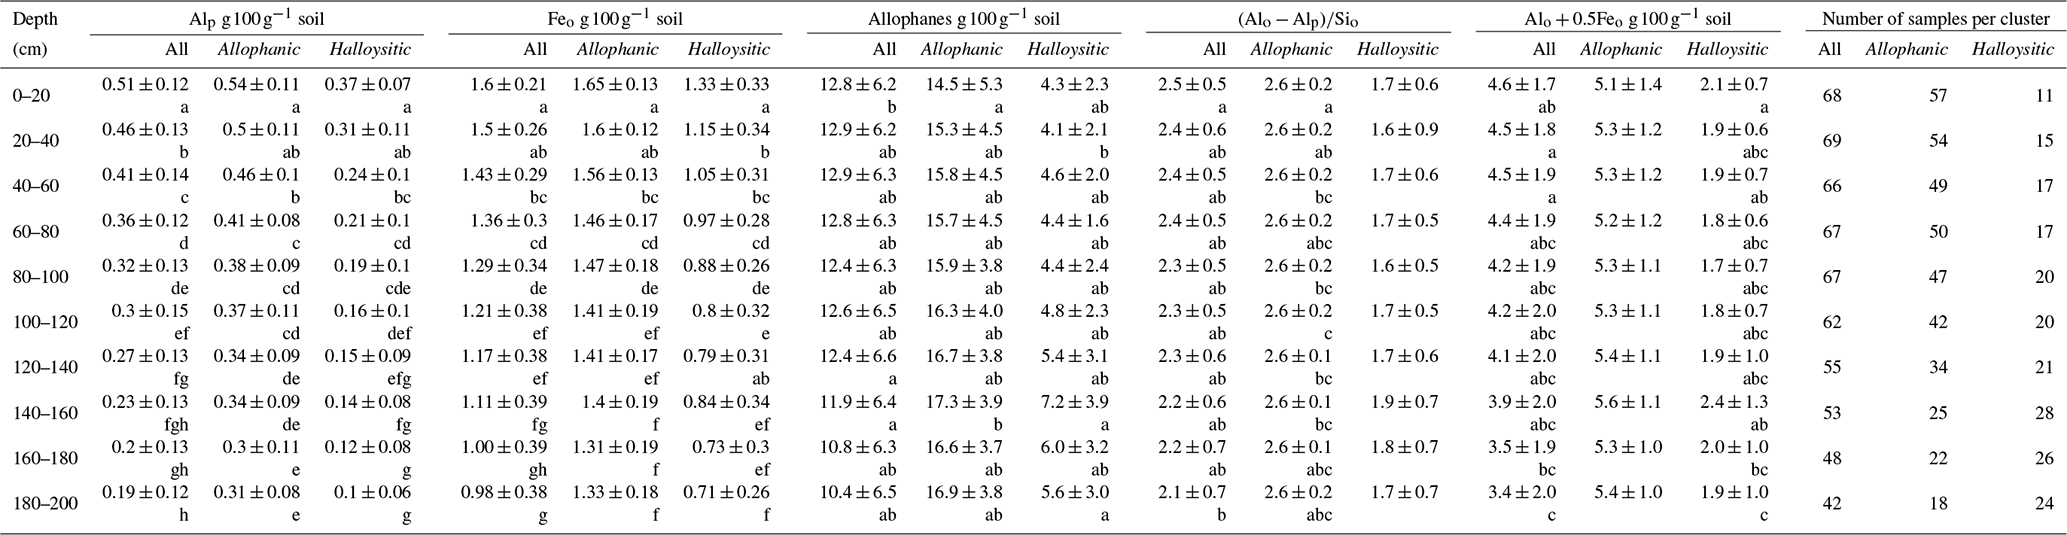
Further analyses confirmed that the variations in andic characteristics of all 598 soil samples were essentially explained by the spectral clustering and secondarily by the soil depth. The two spectral classifications (allophanic and halloysitic) were powerful for organizing and describing the two categories of soil materials (Table 2). Allophanic soil materials, corresponding to the soils in the allophanic spectral cluster, are rich in organo-Al complexes (0.42±0.12 g Alp 100 g−1 soil) and SRO minerals: allophane (15.8±4.4 g allophane 100 g−1 soil), Alo+0.5Feo (5.3±1.2 g 100 g−1 soil), and amorphous Al, Si, and Fe (4.5±1.1 g Alo 100 g−1 soil, 1.6±0.4 g Sio 100 g−1 soil, 1.5±0.2 g Feo 100 g−1 soil). These soils have Alp:Alo ratios of about 1.0±0.4 and Al:Si ratios of about 2.6±0.2. In contrast, halloysitic soil materials, corresponding to the soils in the halloysitic spectral cluster, are poor in organo-Al complexes (0.18±0.11 g Alp 100 g−1 soil) and SRO minerals: allophane (5.3±2.9 g allophane 100 g−1 soil), Alo+0.5Feo (1.9±0.9 g 100 g−1 soil), and amorphous Al, Si, and Fe (1.5±0.8 g Alo 100 g−1 soil, 0.7±0.3 g Sio 100 g−1 soil, 0.9±0.3 g Feo kg−1 soil). Their Alp:Alo ratios are highly variable (about 1.7±1.5) and their Al:Si ratios are about 1.7±0.6. In a given cluster, the Alp and Feo content and the Alp:Alo ratio decrease with depth, but not the allophane content, Al:Si ratio, or the quantity Alo+0.5Feo.
Chemical extraction provides no structural information, but it does help distinguish between crystalline and SRO minerals. The literature (Levard et al., 2012) notes that SRO minerals like Al-rich allophanes, proto-imogolite, and imogolite predominate in volcanic-ash soils with % and Al:Si ratios >2, such as in the allophanic cluster. Surprisingly, and especially in the surface soil, ratios of Alp to Alo are greater than 1, with high allophane contents (from 5 to 20 g allophane per 100 g soil), indicating a co-existence of allophane and Al-organo complexes, which may be due to some combination of the soil pH (approximately 5, i.e. near the boundary between allophane and Al∕Fe-organo complexes) and the regular inputs of organic materials and ashes from the surface (Mizota and Van Reewijk, 1989). By contrast, in the halloysitic cluster, a lower Al:Si ratio should sign a high Si activity in solution and likely formation of halloysite (Parfitt et al., 1997). However, in both types of soil materials, the high Alp:Alo ratio revealed that the majority of active Al groups were present mainly as organo-Al complexes, especially near the surface.
Even though the soil reflectance and andic characteristics varied continuously through soil samples (Fig. 2b), we observed that a two-cluster classification of MIR spectra was powerful for describing the horizontal and vertical variation of andic soil properties. However, MIR does not provide such definitive results for soils in other contexts and at a global scale (Visacarra Rossel et al., 2016) because most of the world's soil types are complex mixtures of materials from diverse origins and because the criteria for global soil taxonomic classifications include parameters with no direct influence upon spectral character. When applied to soil materials sharing the same weathering and pedogenesis processes, vis-NIR spectra (Terra et al., 2018) or MIR spectra seem to be useful tools for soil survey and classification. In volcanic areas where strong variations in mineralogy occur (e.g. SRO minerals may dehydrate to form phyllosilicates), MIR spectra seem to be especially well adapted. These differences in mineralogy and proportion of SRO minerals in the allophanic and halloysitic materials cause changes in MIR spectra in reflectance intensity and absorption features in particular at the bands near 3620 and 3700 cm−1, which are characteristic of halloysite (Hidalgo et al., 2010; Fig. 2c). Hence, the effects of mineral weathering or pedogenesis pathways upon MIR spectra of volcanic-derived soil samples were clear enough for building two different soil-material clusters (allophanic vs. halloysitic) using PCA and K-means algorithms based upon spectral data distance.
3.1.3 Three types of soil profiles in the watershed
Both types of material were encountered at every soil depth, but allophanic materials predominated near the surface (n=57 on 68 samples at 0–20 cm), while halloysitic material predominated at depth (n=24 on 42 soil samples at 180–200 cm) (Table 2). These results confirmed the common observation that allophane is associated with halloysite (Ross and Kerr, 1934, quoted in Parfitt, 2009). Both minerals may be derived directly from volcanic glass, and halloysite can also form via weathering of allophane (Parfitt, 2009; Torn et al., 1997; Wada, 1989). The allophane : halloysite ratio depends upon the chemistry and regularity of ash depositions as well as upon the concentration of Si in solutions which depend on precipitation and drainage (Churchman et al., 2016).
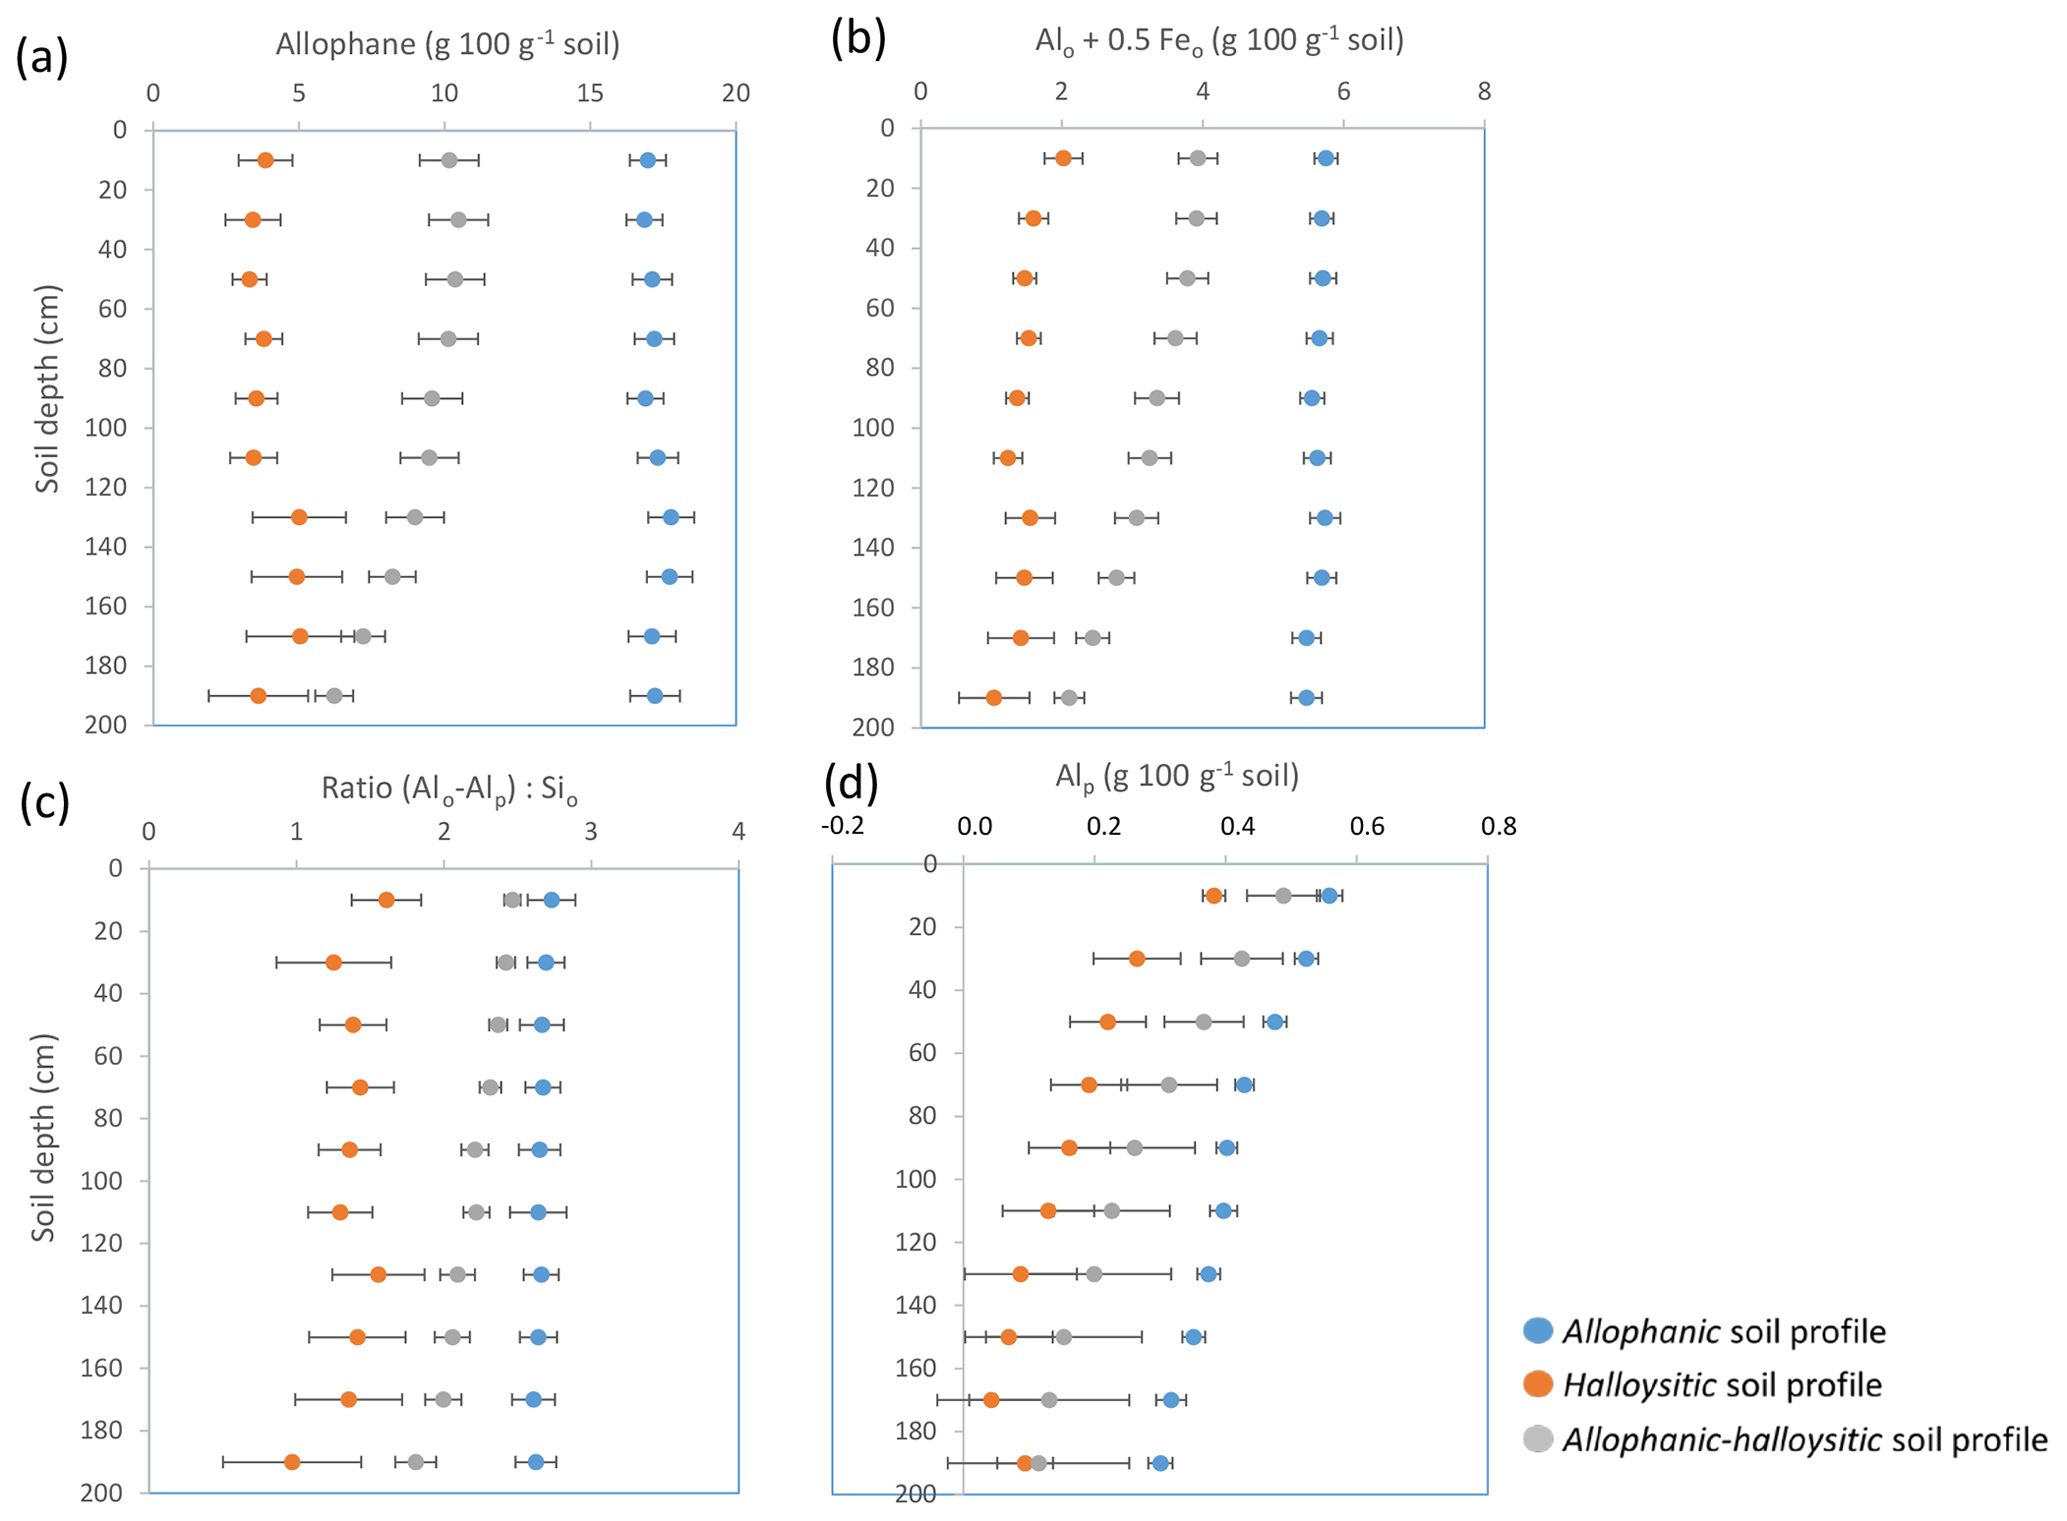
Figure 3The three types of soil profiles, according to four characteristics of andic soils (a allophane content, b Alo+0.5Feo index, c Al:Si ratio, and d organo-Al complexes or Alp content). The allophanic soil profile shown is the mean soil profile of 35 soil profiles; the halloysitic soil profile is the mean soil profile of 8 soil profiles and the allophanic–halloysitic soil profile is the mean soil profile of 26 soil profiles. Error bars are error types.
Of the 69 sampled soil profiles (0–200 cm), 35 were denoted as “allophanic profiles”, i.e. every sample's spectrum fell in the allophanic cluster. The soil was composed of allophanic materials down to 200 cm. The samples from eight profiles (the “halloysitic profiles”) were exclusively of the halloysitic spectral class, and 26 soil profiles (the allophanic–halloysitic profiles) contained soil of both types (Fig. 3).
Of the 26 allophanic–halloysitic profiles, 20 had soils of the allophanic spectral class at the surface and soils of the halloysitic spectral class at depth. In five of the other allophanic–halloysitic profiles, no clear relationship between depth and spectral class was present. The thickness of the allophanic material at sites with allophanic–halloysitic soil profiles was taken as being equal to the depth at which halloysitic material first appeared in the soil profile. Calculated in this way, the thickness of allophanic material varied from 0 cm in the halloysitic soil profiles to 200 cm in the allophanic soil profiles (Fig. 4a).
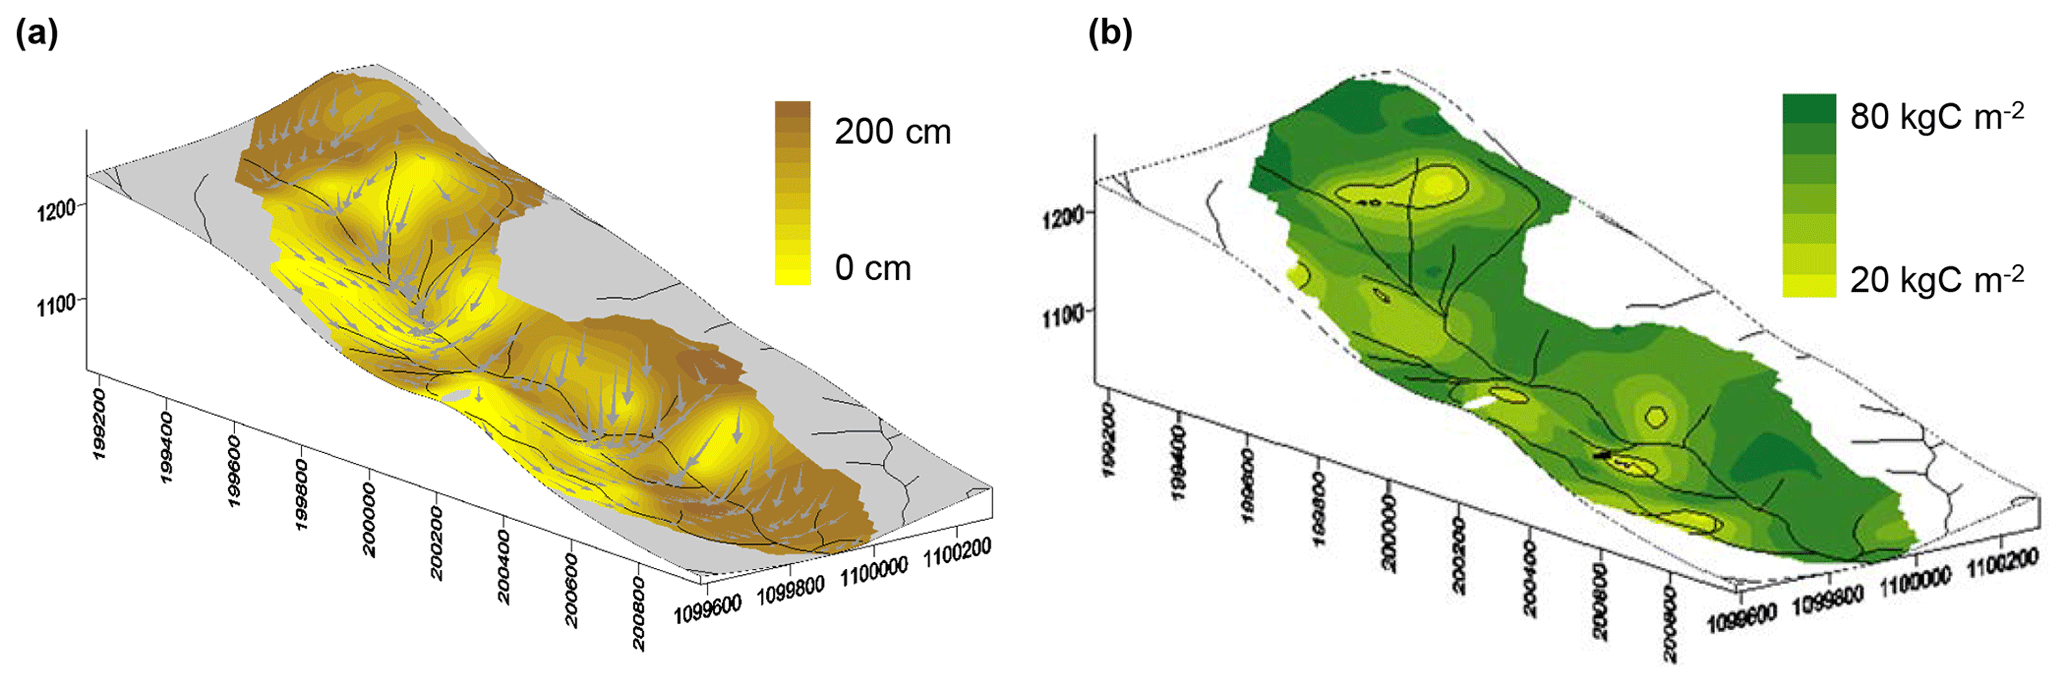
Figure 4(a) Map of the thickness of the allophanic soil material layer (in centimetres) in the Aquiares watershed; the fine grey arrows show directions and steepness of elevation gradients: longer arrows indicate steeper slopes. (b) Map of SOC stocks (kg C m−2) in the upper 2 m of soil. Altitudes above sea level are in metres; x and y axes show UTM coordinates.
In this micro-watershed, allophanes predominated over halloysite because total annual rainfall was above 3000 mm (Parfitt et al., 1983) and because the study site does not experience a pronounced dry season. Therefore, a high leaching rate (Gómez-Delgado et al., 2011; Benegas et al., 2014; Welsh et al., 2018) of Si probably resulted in the formation of materials in which Al groups predominate (). A majority of soil profiles (35) were indeed rich in SRO minerals and organo-mineral (Al∕Fe) complexes down to 200 cm. In 26 other profiles, contents of SRO minerals and amorphous materials were also present but decreased with depth (Fig. 3). In these allophanic–halloysitic soil profiles, allophane contents (10 g 100 g−1 soil) were intermediate between the allophane contents in allophanic soil profiles (>15 g 100 g−1 soil) and in halloysitic soil profiles (<5 g 100 g−1 soil) (Fig. 3). This coexistence of allophane and halloysite marked a transition from the allophanic soils to the halloysitic soils. This transition could be explained by formation of halloysite at microsites within an allophane matrix (Aomine and Wada, 1962, quoted in Parfitt, 2009), when periods of leaching alternate with periods of desiccation (Churchman et al., 2016). The resulting fluctuations in activity of Si in soil solutions could cause differential formation of amorphous and crystalline weathering products. A transition zone attributable to that phenomenon has been observed in pedons along the slopes of volcanoes in Ecuador at intermediate altitudes (Zehetner et al., 2003). However, the variations in the soil profile types observed in the present study occurred over much shorter distances than in Zehetner's study. Only 20 % of the soil profiles in the watershed were of the halloysitic type, in which halloysite minerals predominated at all depths. Halloysite could be the result of an older soil development from allophane weathering on older tephras or the result of silica-rich environments, such as in buried soil layers that receive silica from overlying soil layers or in zones where restricted drainage prevents removal of Si via leaching (Churchman et al., 2016). This is more likely to occur in Si-rich, rhyolitic tephras than in basaltic ones (Dahlgren et al., 2004). Even if in the last millennia, most of the volcanic deposits at Turrialba have been andesitic ashes that varied little in composition over time (Meijer and Buurman, 2003), recent investigations found rhyolitic materials and multistage magmas in which rhyolite is mixed with end members of basaltic andesite (Devitre et al., 2018).
As climate, paleoclimate, and composition of volcanic ejecta were identical over the studied 1 km2 micro-watershed, we assumed that the thickness and composition of different soil materials likely resulted from an integration through time of several pedogeomorphic processes: (i) regular new ash deposits, (ii) deeper weathering of parent materials, (iii) hydrological dynamics (i.e. Si leaching or accumulation of Si), and (iv) soil erosion (Gessler et al., 2000); i.e. in unstable landscape positions, the erosion of topsoil could have removed allophanic soil materials and exposed the older halloysitic subsoils (Zehetner et al., 2003). The influence of the site's topography upon hydrology, pedogenesis, and topsoil erosion (Fig. 4a) was superimposed upon the general weathering trend and could contribute to explaining the spatial variation of the different soil profiles and allophanic material thickness in the micro-watershed.
Table 3Cross-validation statistics of modified partial least-squares regression for the models of prediction by MIRS of soil organic carbon contents (g C kg−1 soil) after calibration on all of the soil samples (All) or on two clusters defined by their MIRS spectra, or by their conventionally measured data (Alo, Alp, Sio, Feo, Alo+0.5Feo, allophane, .
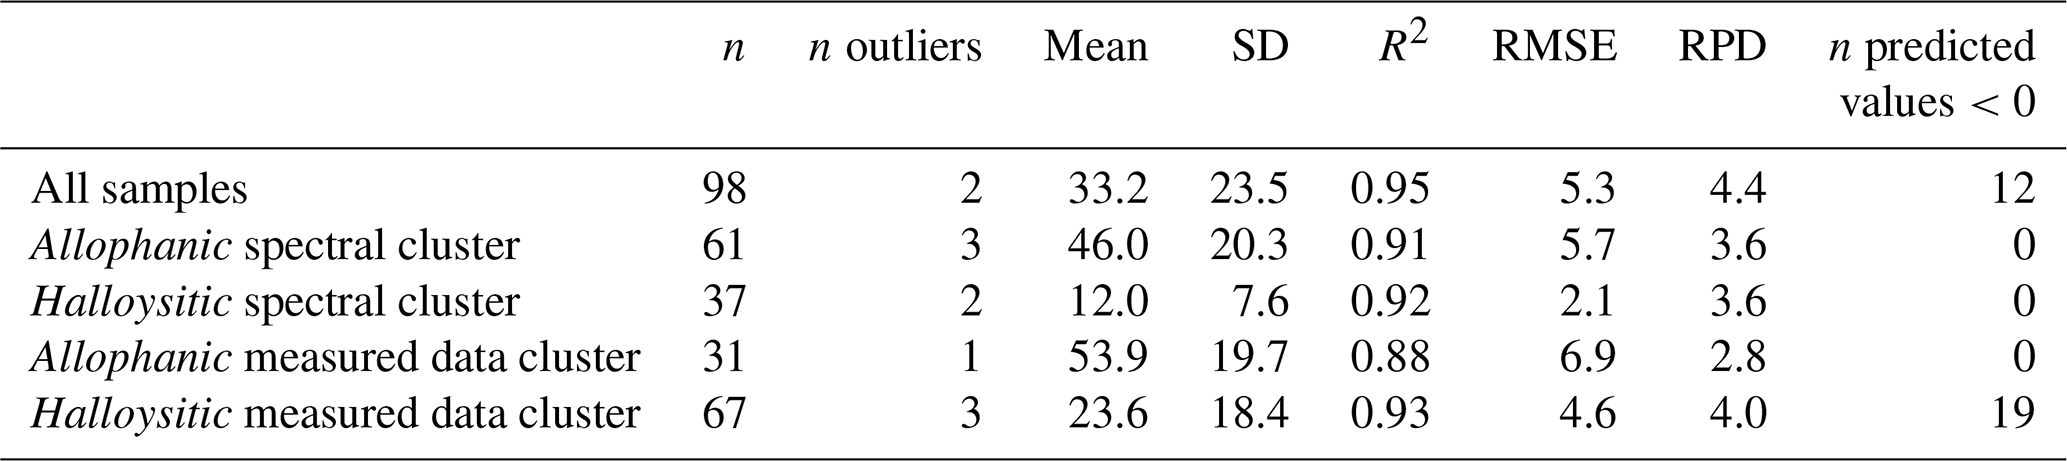
n: number of soil samples, mean, and standard deviation (SD) of the measured SOC population used for model calibration. R2: coefficient of regression, RMSE: root mean standard error, and RPD: ratio of standard error of prediction and SD between measured and predicted SOC contents from the cross-validation populations.
3.2 SOC contents
3.2.1 Prediction of SOC contents from MIR spectra
The model built on the whole data set yielded better results (higher R2, higher RPD and smaller RMSE) than those using two soil groups separately (Table 3). The SOC predictions have been considered accurate according to the usual criteria (Chang et al., 2001) and are comparable in performance to those developed by McDowell et al. (2012) for Hawaiian soil samples. However, this model predicted negative SOC contents for 12 samples, which all belonged to the halloysitic spectral class. Negative predicted SOC contents have been seen previously in an Andosol data set in McDowell et al. (2012), who noted difficulties in predicting low SOC contents accurately. Those difficulties could be explained by the presence of different soil materials, with their own properties to stabilize SOC. Consequently, we preferred the SOC-content predictions made by the models that were built on soil clusters that were differentiated by their MIRS spectra and thus their type of soil material. For these models, which did not predict any negative SOC contents, the predictions of low SOC contents were better with a decreasing RMSE from 5 to 2 g C kg−1 soil for samples in the halloysitic cluster (Table 3).
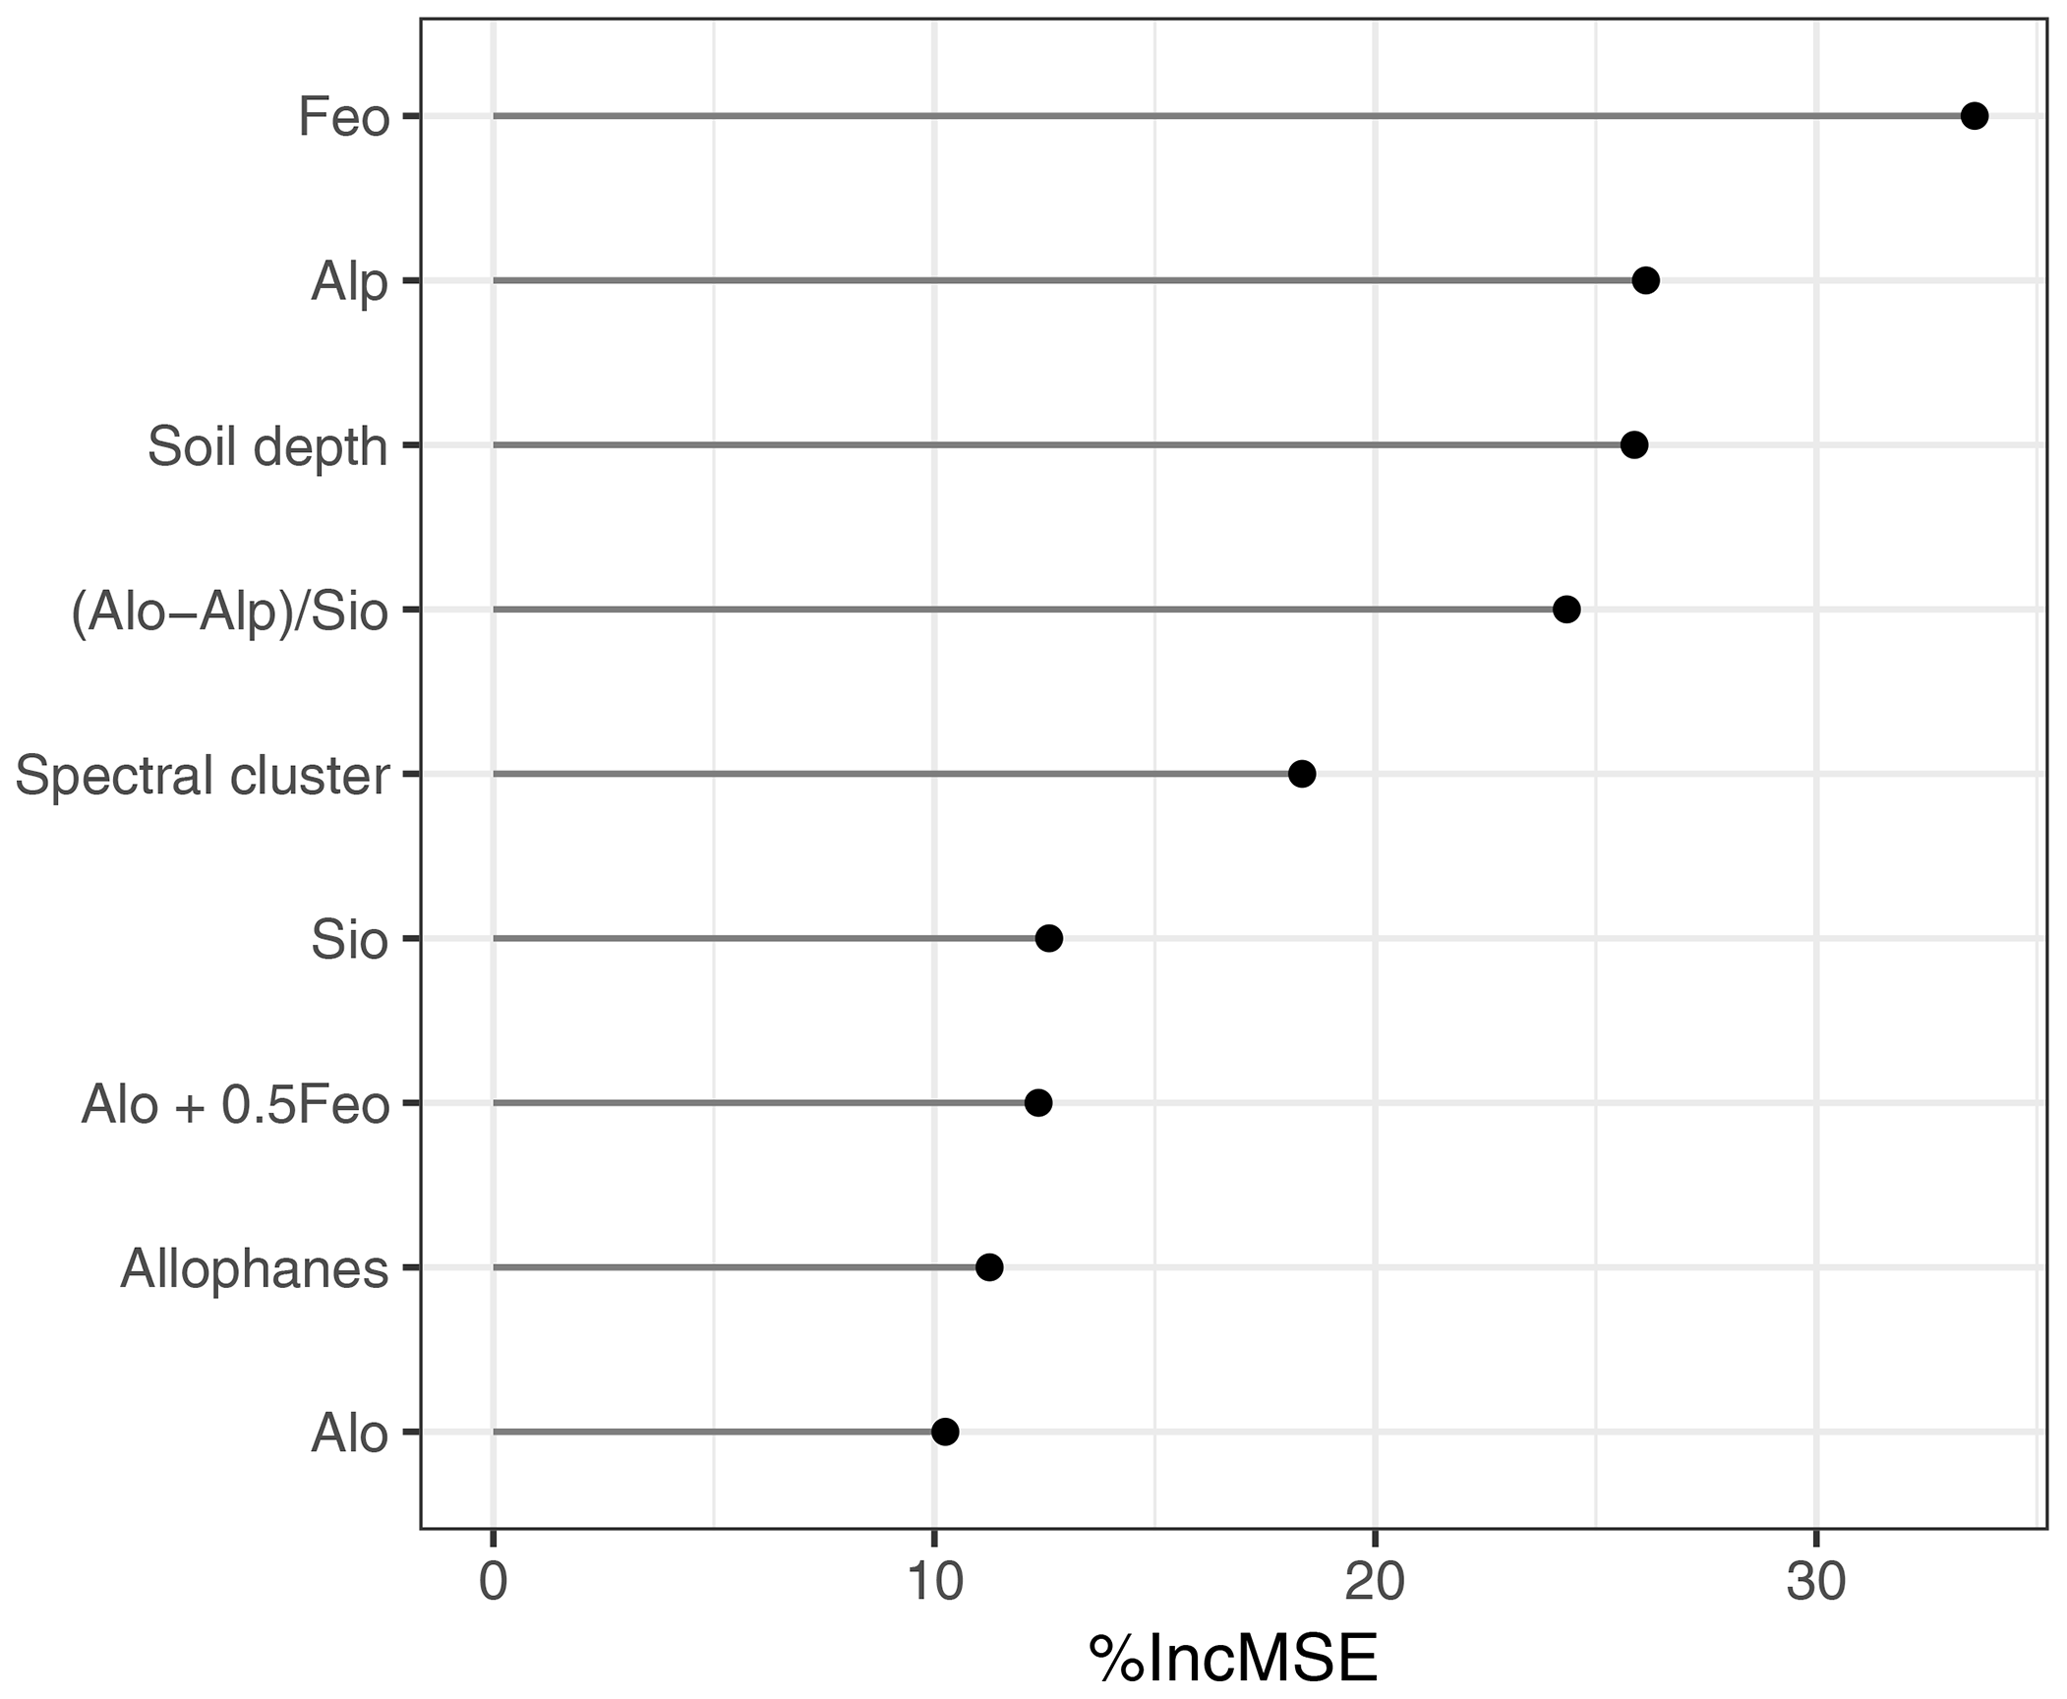
Figure 5Relative importance (% IncMSE) of variables in the random forest model for the prediction of SOC content.
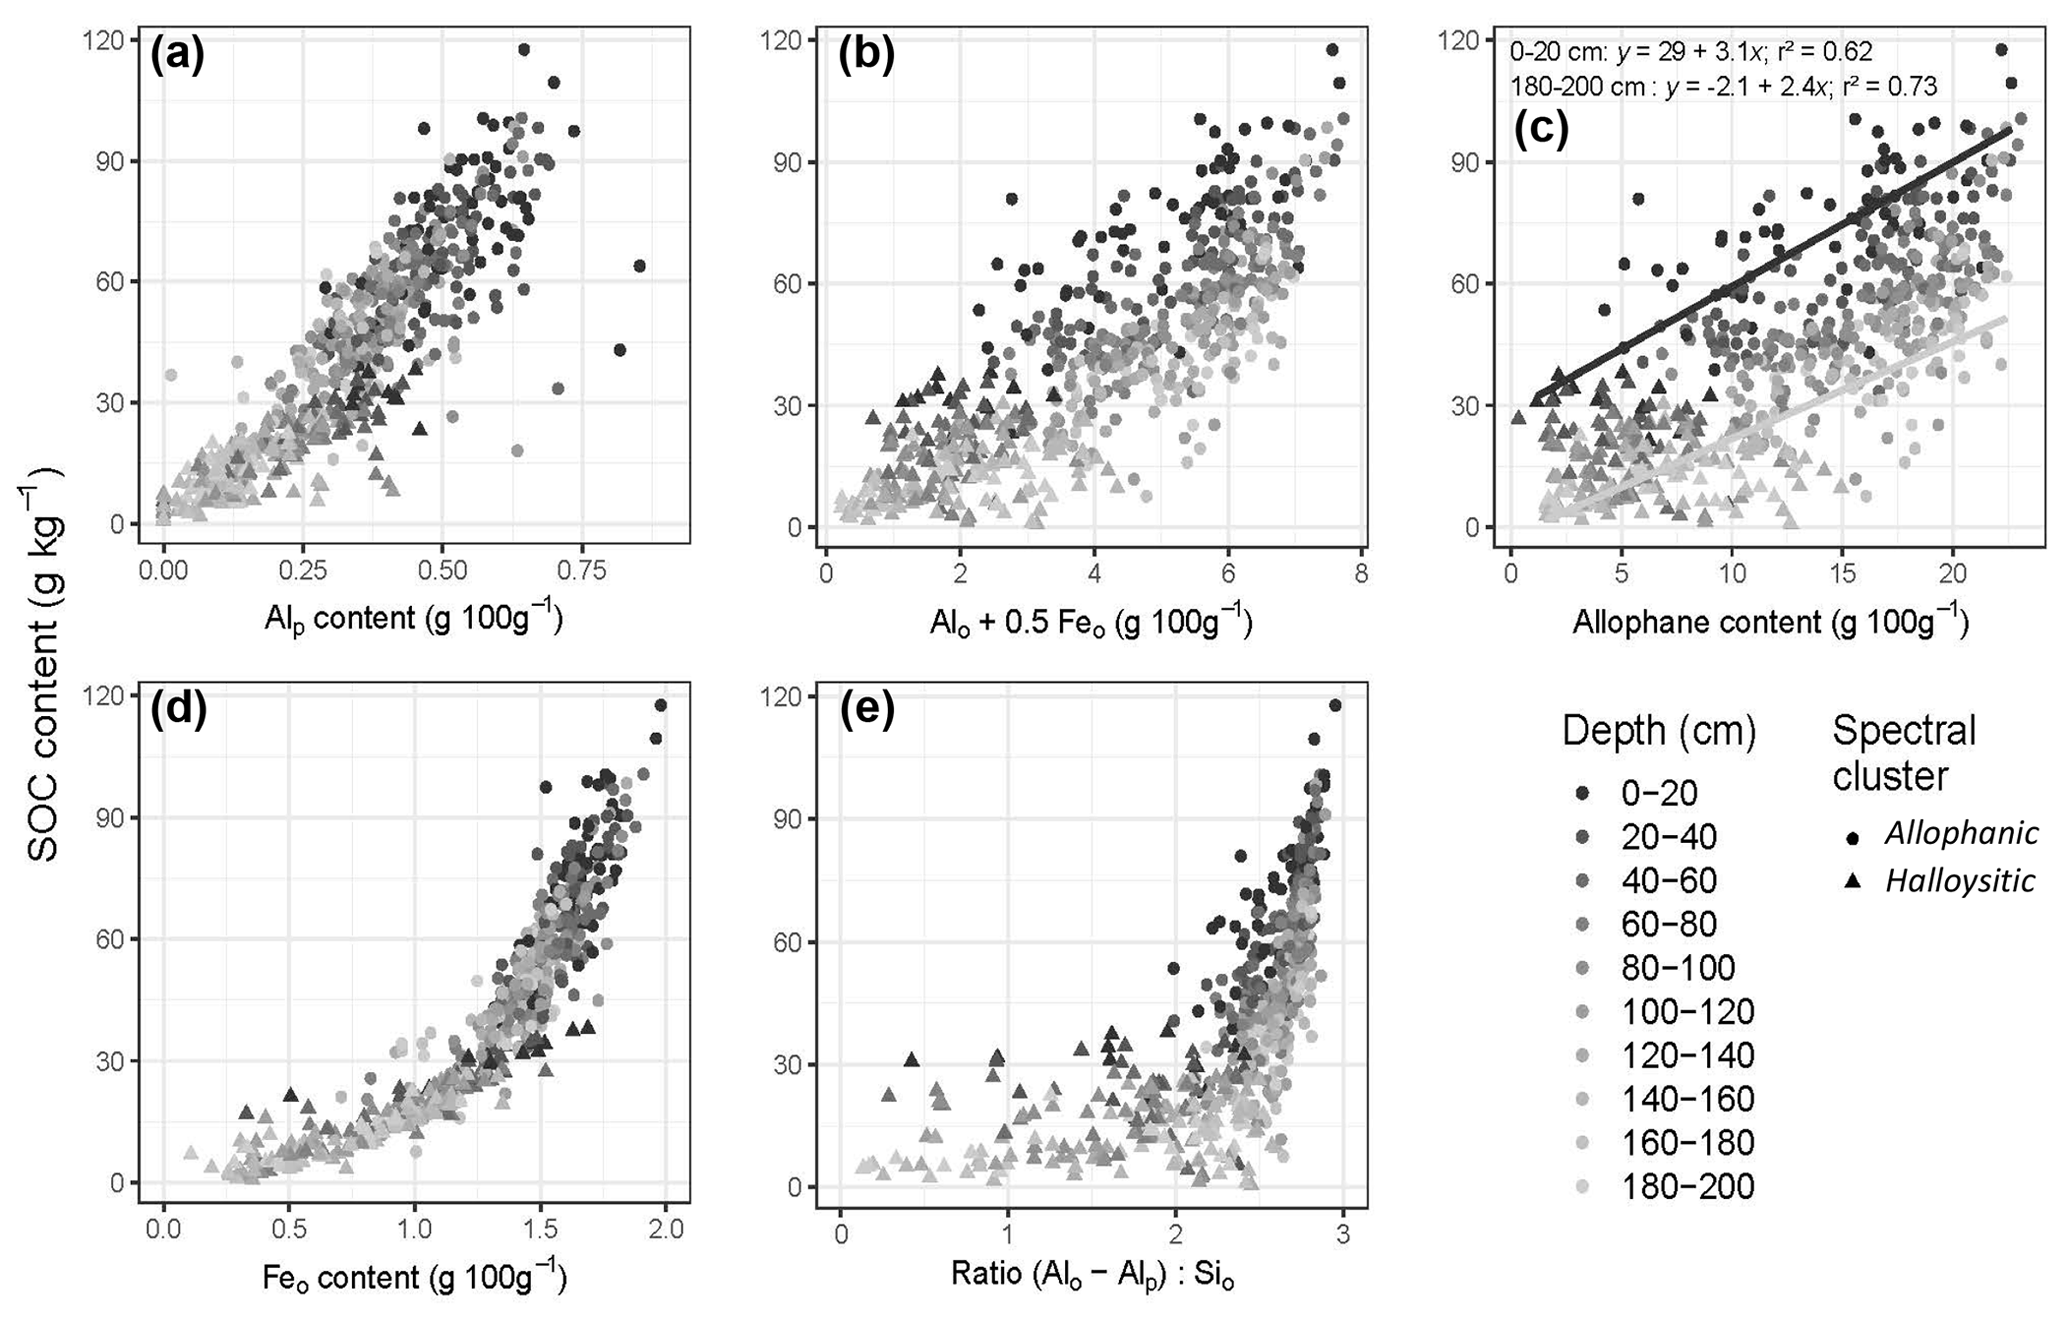
Figure 6Relationships, according to soil-sampling depth and spectral-cluster classification, between SOC content and (a) Alp content; (b) Alo+0.5Feo index; (c) allophane content (showing two linear regressions on results for samples from the 0–20 cm depth and the 180–200 cm depth); (d) Feo content; and (e) Al:Si ratio.
3.2.2 SRO minerals and metal-organo complexes explain the variation of SOC contents
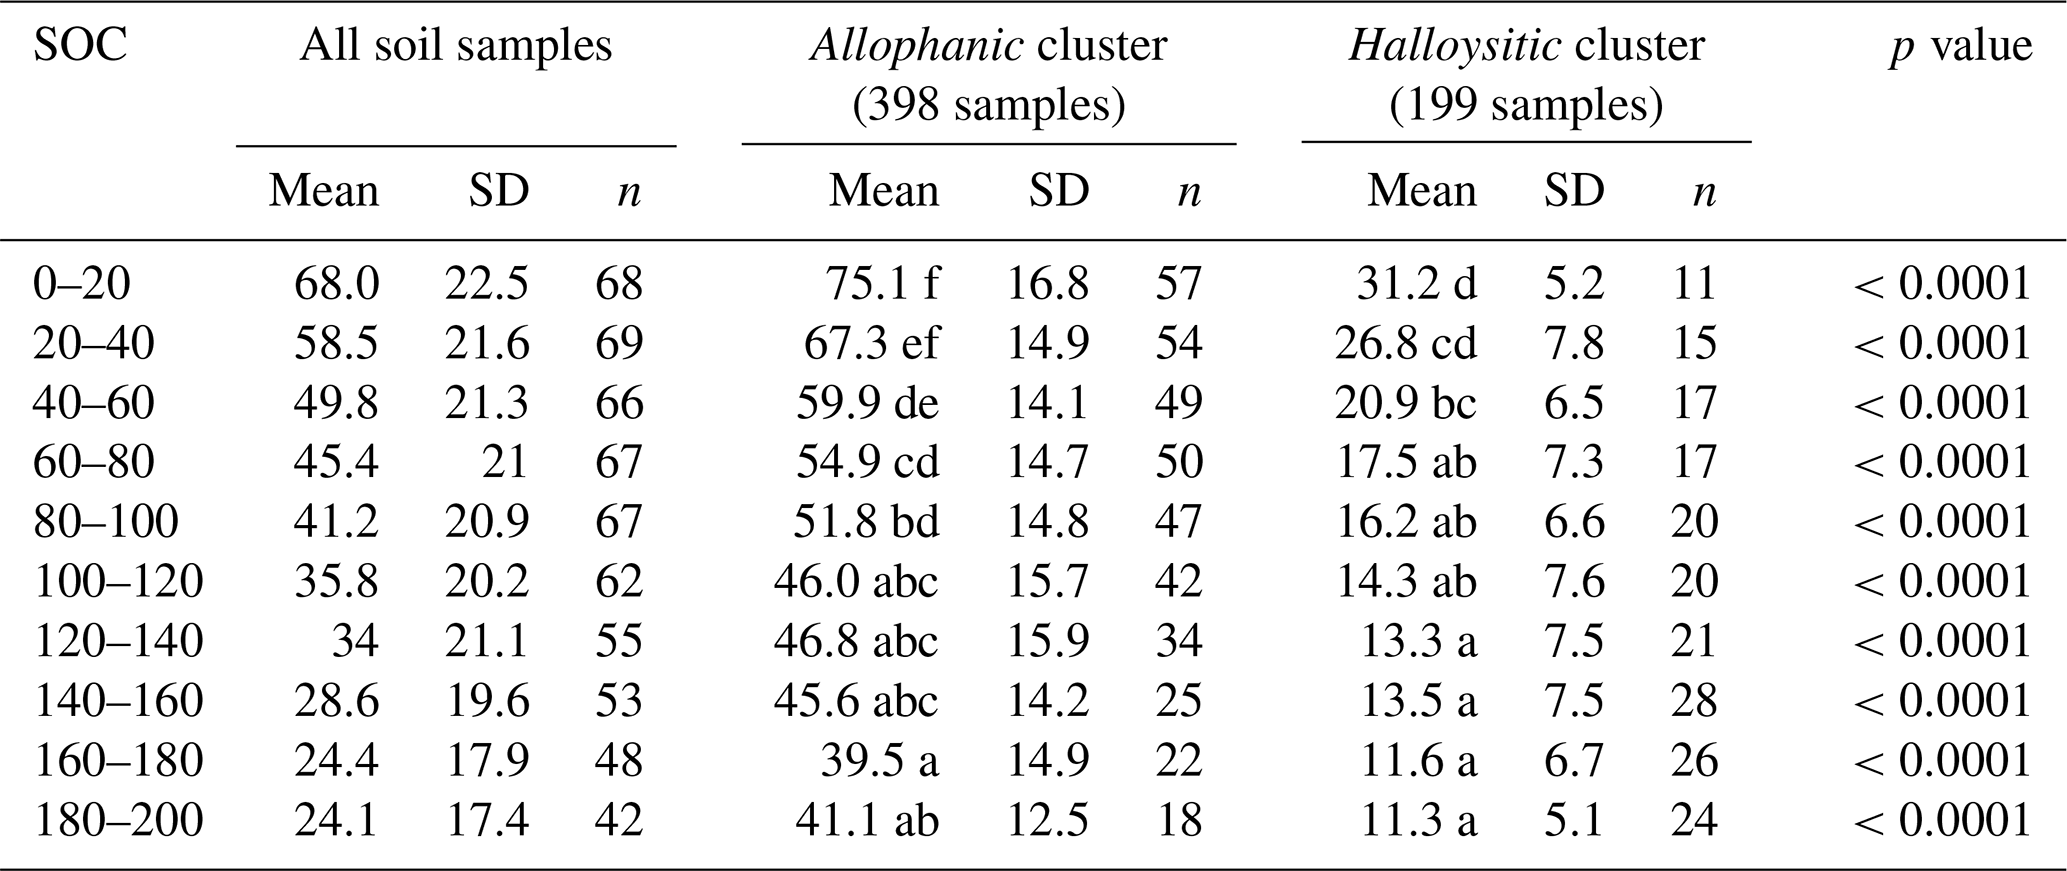
The SOC contents were explained by soil depth and by clustering based on soil MIR spectra. SOC contents decreased significantly with soil depth and were much larger in allophanic than in halloysitic spectral classes at all depths (Table 4). As already and commonly observed, the more SRO minerals that are present, the more SOC is concentrated and preserved in soils (Figs. 5, 6; e.g. Torn et al., 1997; Chevallier et al., 2010). The concentration of SOC in the allophanic materials of this study were similar to those observed in the pedogenetic A horizons of Andosols from Costa Rica (Meijer and Buurman, 2003), Ecuador (Zehetner et al., 2003), Martinique (Chevallier et al., 2010), and Hawaii (Torn et al., 1997).
The strongest correlations were between Feo, or Alp, and SOC, suggesting both (i) an important role of organo-metal complexes in SOC stabilization and (ii) a stronger impact of SRO mineral with Fe on SOC contents at all depths (Fig. 5) than was expected from Kinoshita et al.'s (2016) research on the surface soil (0–5 cm) at the same site. Ferrihydrite is known to be highly involved in the stabilization of SOC in Andosols (Kleber et al., 2005; Matus et al., 2014; Filimonova et al., 2016; Parfitt et al., 1997). In our study, we did not explicitly analyse the form of Fe extractable by oxalate, whether ferrihydrite dominated Fe forms or not, but the preservation of SOC related to Feo, even in relatively small amounts (0.9–1.3 g Feo 100 g−1 soil), seemed to be the major factor explaining SOC-content variations at the surface and at depth (Figs. 5 and 6). In addition, the relation between SOC and Feo appeared to have a threshold near 1.3 g Feo 100 g−1 soil. Beyond that threshold, all soil samples were in the allophanic cluster, and SOC was high and very sensitive to small variations in Feo content (, r2=0.73). In contrast, below that threshold SOC was lower and less sensitive to Feo content (, r2=0.85). However, our results did not provide analysis for determining whether the form of Feo present in allophanic materials differed from that in halloysitic materials.
The organo-Al complexes, represented by Alp, were the second most important soil variable in explaining the variation of SOC (Fig. 6). The importance of Alp in SOC stabilization has already been noted in the literature (Beare et al., 2014; Huygens et al., 2005), although the organo-Al stabilization is not fully understood (Takahashi and Dahlgren, 2016). The most given explanations were Al toxicity for microorganisms or electrostatic sorption between Al and SOC which limits the accessibility of SOC to microorganisms or to their enzymes. The organo-Al complexes were observed to be more effective than allophane in protecting SOC from degradation (Boudot, 1992; Powers and Schlesinger, 2002), especially in the surface soil layers (Fig. 6) where contents of organo-Al complexes and the Alp:Alo ratios tended to be high (Fig. 3). We thus assumed that the majority of active Al groups should pertain to organo-Al complexes, which stabilized the vegetation organic inputs.
Table 4Descriptive statistics for SOC contents (g kg−1 soil) of all soil samples with depth, and with their spectral cluster; p value expresses results from the t test between samples from the two spectra cluster classes (Welsh, two-sided alternative). For a given cluster, means followed by the same letters do not differ significantly at p=0.05.
To a lesser extent, the SOC contents were explained by calculated parameters linked to soil andic properties, the ratio , allophane, Alo+0.5Feo, and soil depth (Figs. 5, 6; Table 4). The mineral matrix explained the SOC stabilization even better at depth than at the surface (Fig. 6c). The relationship between allophane or Alo+0.5Feo and SOC was mediated by soil depth. For a given amount of allophane, the soil was richer in SOC at the surface than at depth. In surface samples, C inputs by vegetation likely explained the higher SOC contents as well as the slightly greater variation of that content (Table 4; Matus et al., 2014). Nevertheless, the SOC contents are reported to be poorly correlated with above-ground biomass in Andosols (Noponen et al., 2013) and mainly controlled by contents of organo-Al complexes and SRO minerals even in the topsoil (Kinoshita et al., 2016). Furthermore, the decrease in SOC content with depth in allophanic cluster was much less noticeable than in other studies on Andosols. The SOC contents reported here decreased slightly and smoothly with depth throughout the soil profile (Fig. 3) and still remained high (40 g C kg−1 soil) at the 200 cm depth. The ratio displayed a threshold near 2.5 (Fig. 6) similarly to that was noticed for Feo at 1.3 g Feo 100 g−1 soil. Beyond that threshold, all soil samples were in allophanic clusters and SOC was very sensitive to a small variation in the ratio.
As the volcanic ejecta at the study site contained little carbon (2 to 3 mg C g−1 ash, data not shown), the SOC-content distribution in the watershed was controlled mainly by vegetation inputs with pedogenic processes. The dominant pedogenic processes could be the development of an A horizon by andosolization, which consists of the stabilization of accumulations of vegetation-derived organic matter by active Al and Fe, in parallel with rapid formation of SRO minerals from volcanic ejecta. Rapid weathering of the ejecta released Si, Al, and Fe faster than crystalline minerals could form. Complexation of humic/colloidal organic substances with metal to form organo-metal (Al∕Fe) complexes was especially noticeable at the soil surface. Preferential precipitations of metastable SRO minerals (allophane, imogolite, ferrihydrite) occurred in the subsoil (Ugolini and Dahlgren, 2002; Kramer et al., 2012). The permanent humid weather and the regular ash deposition favoured these mechanisms (Ugolini and Dahlgren, 2002; Mora et al., 2014) and the stabilization of SOC (Buurman et al., 2007; Chevallier et al., 2010). Regular burial of soil by volcanic ashes would explain why some locations have a very thick layer of allophanic material, assimilated to a young pedogenetic Andosol A horizon rich in SOC. Over time, or in specific locations where Si could accumulate, halloysite could form at the expense of SRO minerals. Formation of halloysite with lower surface area and charge density would cause loss of stabilized OC (Torn et al., 1997). Our results showed that deep-soil carbon contents as well as surface-soil carbon contents were essentially driven by the type of soil material and contents of SRO minerals. The combination of soil development and mineralogy was a powerful factor for explaining SOC content, regardless of the soil depth.
Table 5Cross-validation statistics of modified partial least-squares regression for the models used to predict soil bulk densities (g cm−3) from MIR spectra.
3.3 SOC stocks
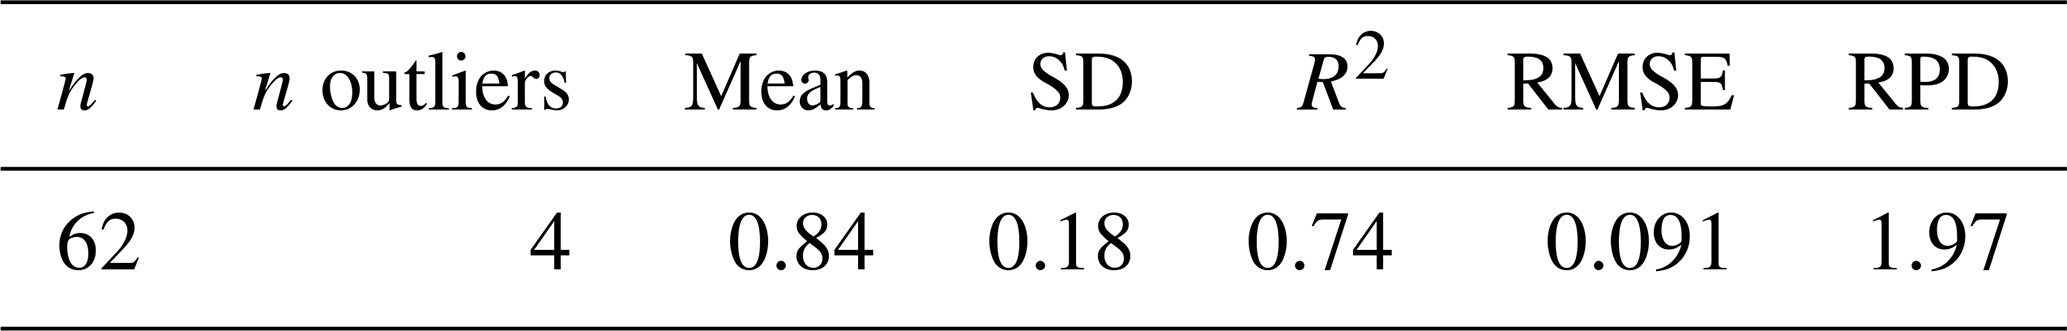
3.3.1 Predictions of Bd
The prediction model for Bd (Sect. 2.5.2) gave accurate results, with a RMSE of about 0.09 and an average Bd of 0.8 g cm−1 (Table 5). This level of performance was close to that of Cambou et al.'s (2016) predictions of Bd from near-infrared spectroscopy of Luvisols. Bd is determined not only by soil constituents, but also by soil structure, which has no effect upon the MIR spectral signature of a soil sample that has been dried and sieved to <200 µm. Nevertheless, the MIR spectra of such a sample could contain enough information to predict Bd. Here, andic properties (e.g. Alo+0.5Feo), which are well predicted by MIRS, were known to control Bd strongly (Shoji et al., 1996). Therefore, these well-predicted properties were used as a proxy for Bd prediction. The MIR spectroscopy of soil samples prepared for soil analysis seemed to offer promise for predicting Bd of Andosols.
The Bd increased slightly with soil depth: from 0.65 to 0.75 in allophanic soil materials, and from 0.87 to 0.98 in halloysitic soil materials. As already and commonly observed, soil horizons with SRO minerals have much lower Bd than soil with crystalline clays (e.g. Mora et al., 2014), independently of soil depth (Table 6).
Table 6Descriptive statistics for bulk densities (Bd in g cm−3) with depth and with their spectral cluster. P value expresses results from the t test between samples from the two cluster classes (Welsh, two-sided alternative). For a given cluster, means followed by the same letters do not differ significantly at p=0.05.
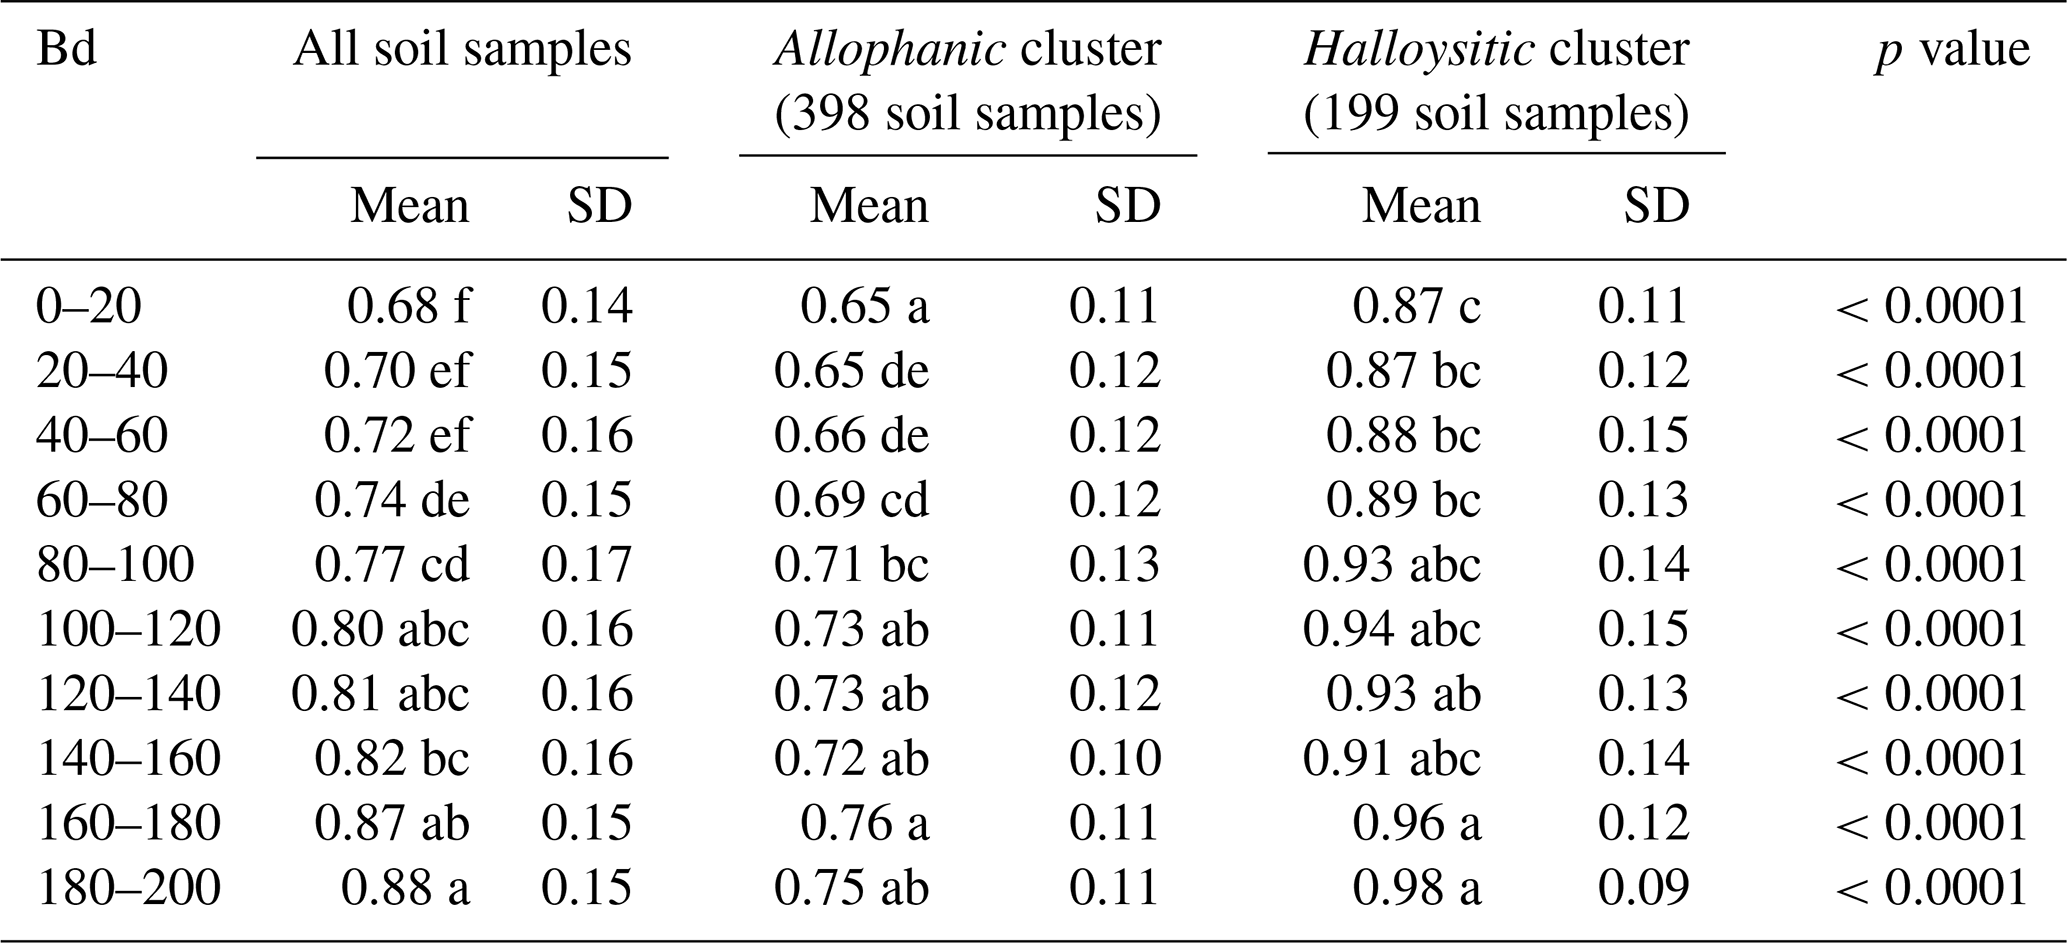
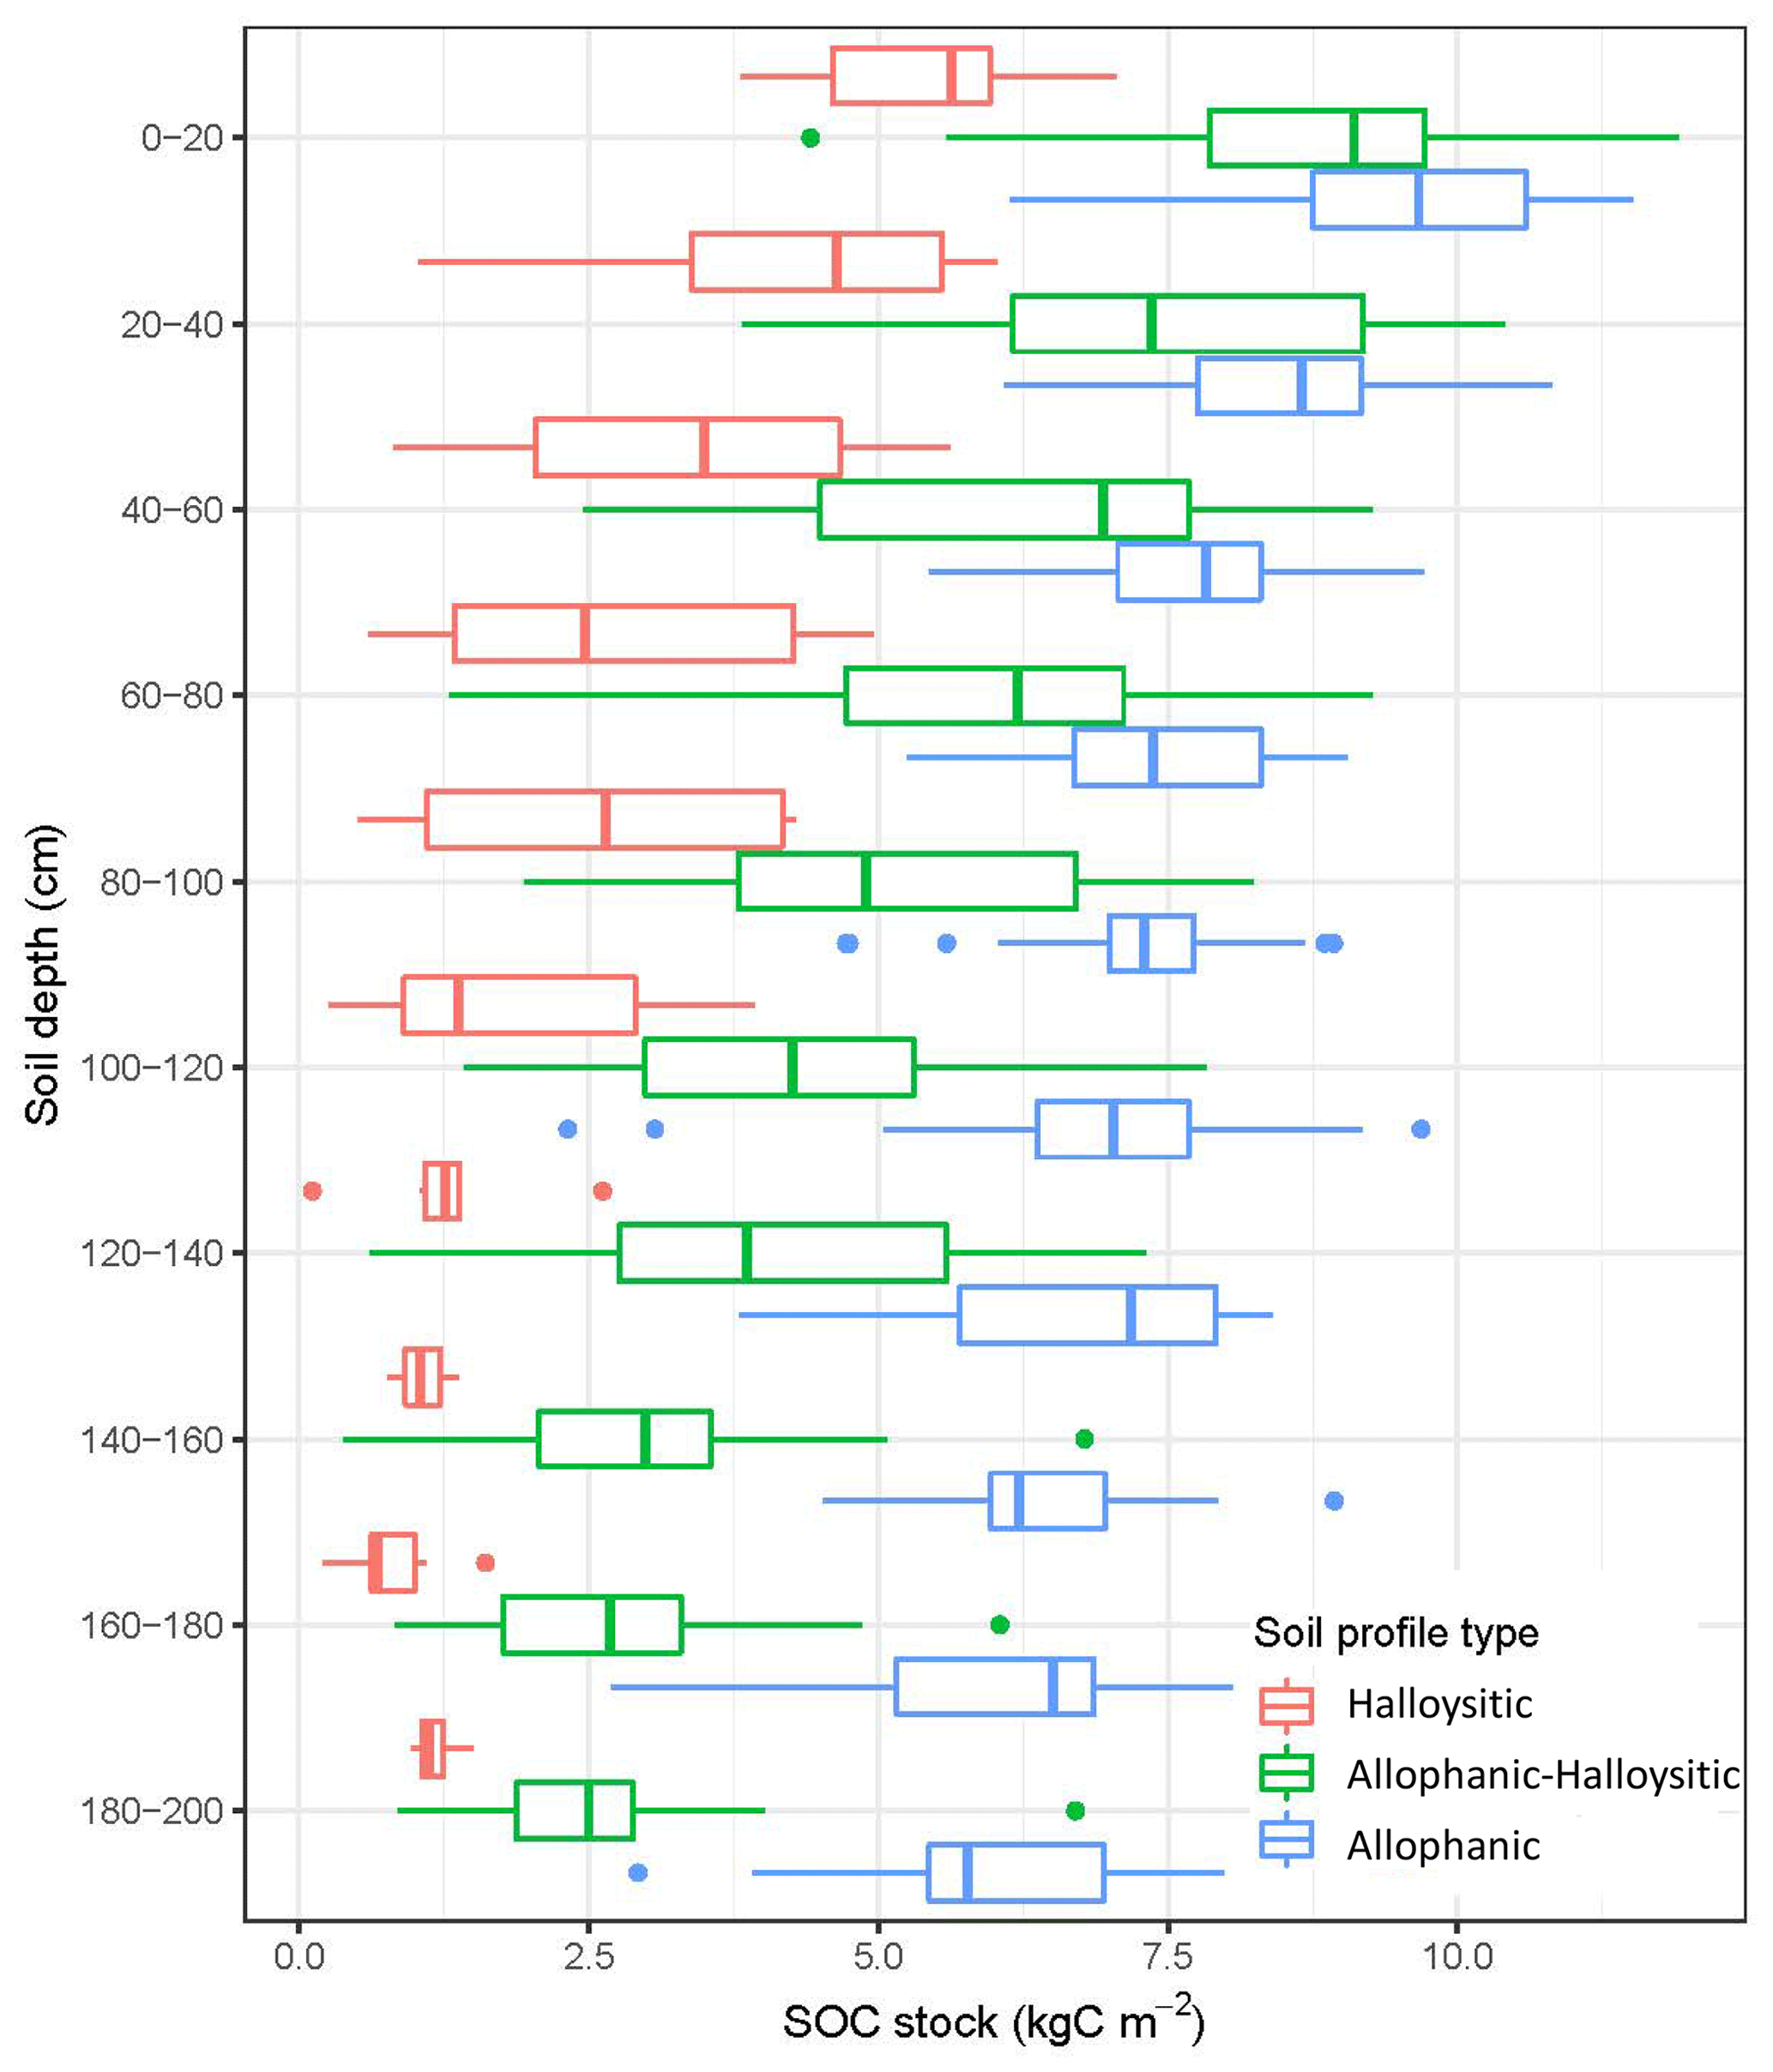
Figure 7Mean SOC stocks in the three types of soil profiles. The allophanic profile is the mean profile of the 35 soil profiles composed of samples only in the allophanic spectral cluster; the halloysitic profile is the mean of the 8 soil profiles composed of samples only in the halloysitic spectral cluster; and the allophanic–halloysitic profile is the mean of the 26 soil profiles composed of samples in both spectral clusters.
3.3.2 Variation of SOC stocks in the Aquiares watershed
Most of the ecosystem C in the watershed is in the soil (from 24 to 72 kg C m−2) compared to the above-ground biomass of coffee and Erythrina poeppigiana of 2.8±0.2 kg C m−2 (Charbonnier et al., 2017) or the below-ground biomass of coffee down to 400 cm at 0.9 kg C m−2 (Defrenet et al., 2016). The SOC stocks were highly variable in both dimensions, horizontal and vertical along the soil depth (Fig. 7). The relative distribution of SOC stocks with depth, i.e. the ratio of SOC stocks at 0–100 cm to SOC stocks at 0–200 cm, also varied and was lower in the allophanic (0.56±0.03) than in the halloysitic (0.75±0.10) soil profile type. Our results were consistent with most other studies (e.g. Mora et al., 2014; Batjes, 2014): the allophanic soil materials with high contents of SRO minerals had much larger SOC stocks, at every soil depth, than did halloysitic soil materials with crystalline clays (Fig. 7). Thus SOC stocks in the upper 200 cm of soil varied markedly among the three soil profile types defined in Sect. 3.1.3. The range of calculated stocks for halloysitic soil profiles was 24.5±0.5 kg C m−2, compared to 49.9±1.8 kg C m−2 for allophanic–halloysitic soil profiles and 72.4±2.0 kg C m−2 for allophanic soil profiles (Fig. 7). The high SOC stocks in allophanic soil profiles confirmed that large stocks can be present under plantations at moderate altitudes (1000 m a.s.l.), possibly as a result of organic-material accumulation from previous land cover (pristine forest, then households) along with andosolization. Larger SOC stocks were also measured in deep, homogeneous volcanic-ash soils of Andean ecosystems in Ecuador under upper montane forest and high-altitude paramo (87±12 kg C m−2 within the 0–200 cm depth, Tonneijck et al., 2010), as well as in young Hydric Andosols derived from recent volcanic ash (Poulenard et al., 2003). Nevertheless, when the ( ratio >2.5 and Feo >1.3 g 100 g−1 soil (see Sect. 3.2.2), the SOC stocks were high with high variations (50 and 74 kg C m−2) which remained unexplained.
Globally, the distribution of SOC stocks down to 200 cm was based on the distribution of the soil profile type in the watershed and could not be predicted from the SOC stocks at the surface. For halloysitic soil profiles, we observed a linear relationship between SOC stock in 0–20 cm and SOC stock in 0–200 cm as already reported for soils with different texture but without SRO minerals (Andriamananjara et al., 2016). However, this relationship did not hold in allophanic and allophanic–halloysitic soil profiles (Fig. 8a). The SOC stocks down to 200 cm could not be easily predicted from the SOC stock at the surface because of the discontinuity in the type of soil material in horizontal and vertical (i.e. allophanic–halloysitic soil profile) dimensions.
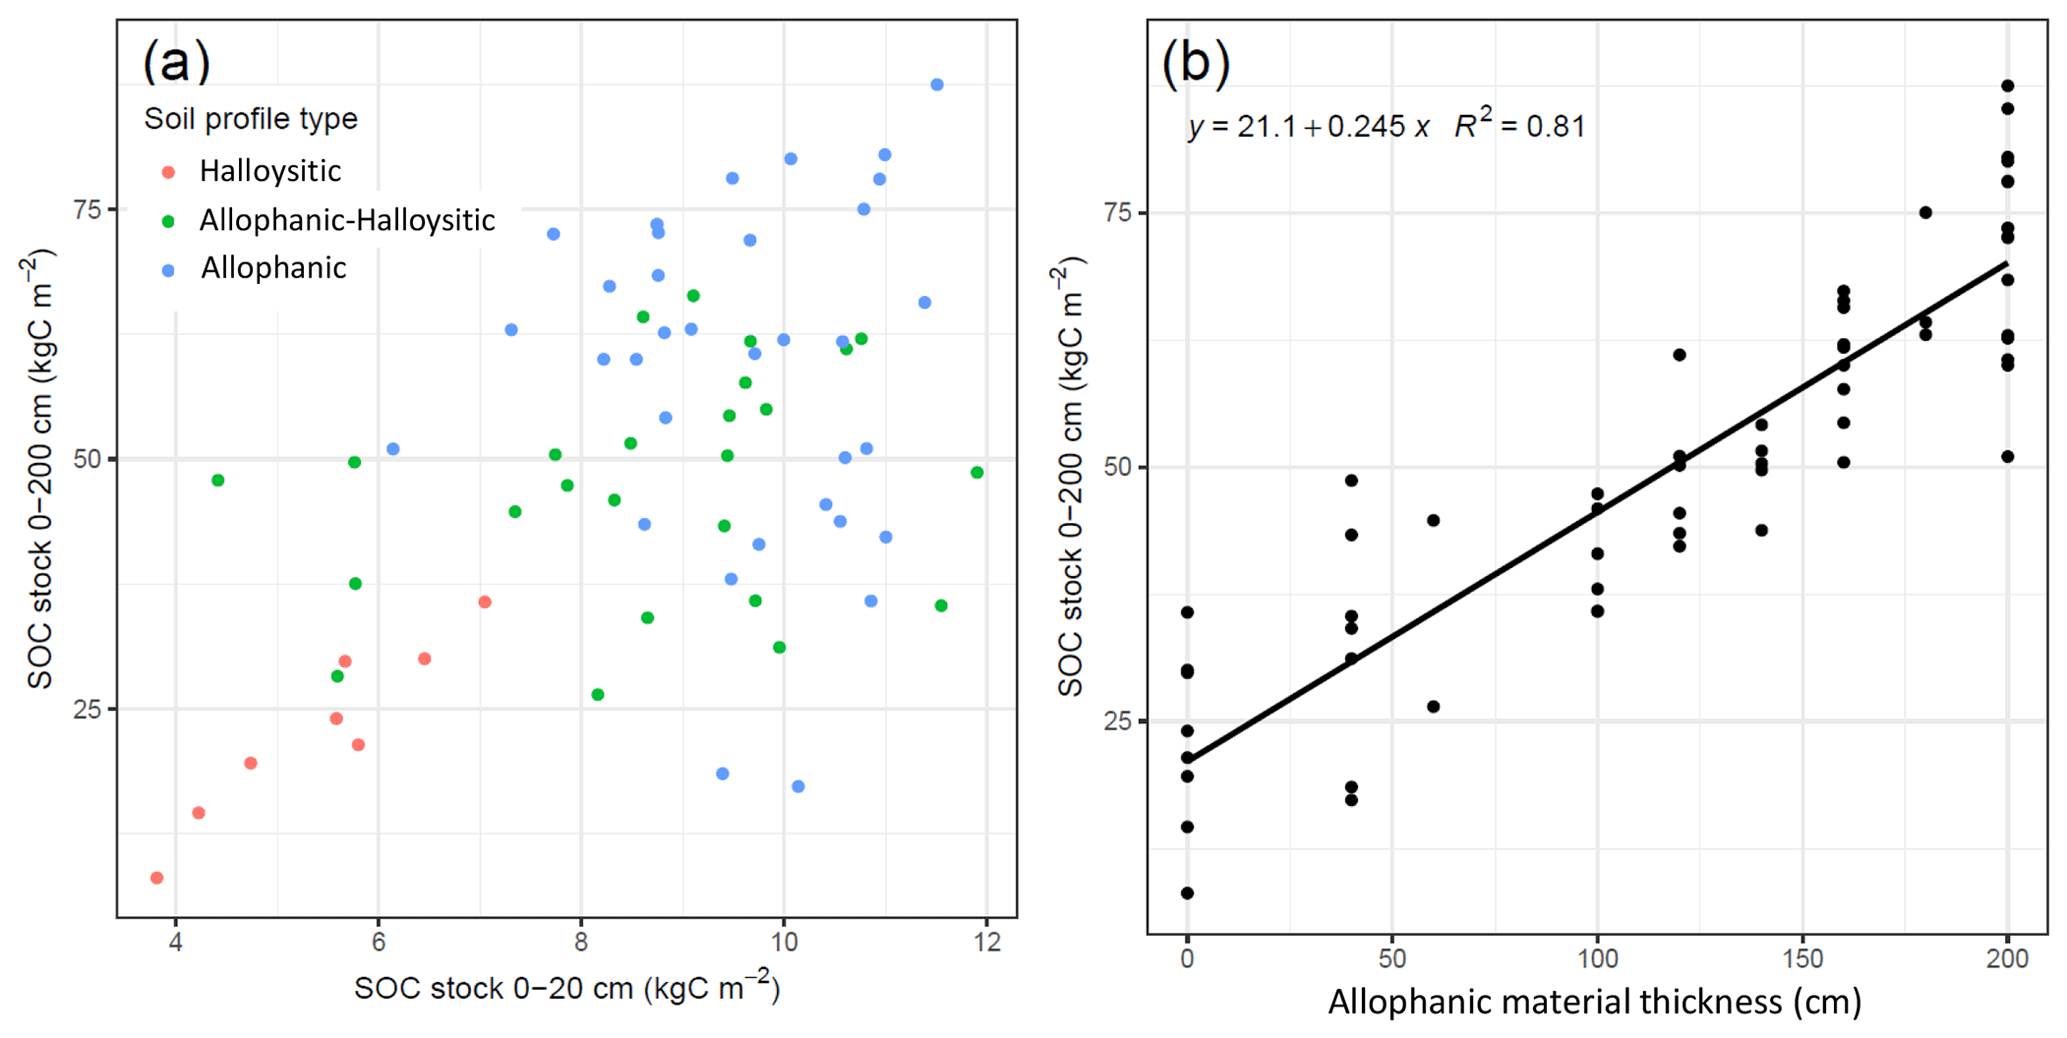
Figure 8Relationship between the SOC stock at 0–200 cm depth and (a) the SOC stock at 0–20 cm depth; (b) the thickness of the allophanic soil material.
The thickness of the allophanic soil material layer was a better predictor of SOC stock in 0–200 cm than the SOC stocks in the topsoil (Fig. 8b) because the SOC stocks varied only weakly within this layer and are especially high. Thus, the distribution of this layer in the watershed explained the distribution of SOC stocks (0–200 cm). Thick allophanic soil material and high SOC stocks were on gentle slopes (Fig. 4; Mora et al., 2014), while outcroppings of halloysitic soil material and small SOC stocks were found where slopes changed abruptly (Fig. 4). We thus hypothesized that erosion and regular ash deposition moulded the watershed's landscape, the thickness of a young andic A horizon, and the distribution of SOC within the upper 2 m of that soil. Pedogeomorphic processes could explain the high variation of SOC stocks at fine scales within the landscape.
The SOC stocks of the studied 1 km2 watershed were much larger than the SOC stocks stored in vegetation biomass. The large variation of SOC stocks in the 0–200 cm soil profiles at fine scales (m) was related to the horizontal and vertical variations in SRO mineral contents. Knowing surface SOC stocks provided little information about deep SOC stocks, whereas SOC stocks within the 0–200 cm depth were positively correlated with the thickness of an allophanic soil material layer, likely a young andic A horizon. In this volcanic environment, where soil minerology varies greatly, MIR spectroscopy was confirmed as a convenient and accurate tool for classifying soil materials as either andic or non-andic. As a result, MIR spectroscopy also proved useful for predicting SOC contents, bulk density, and SOC stocks for a large set of samples. The main conclusion of our study is that ignoring topography and soil pedogenesis would introduce a serious weakness in current approaches for evaluating regional C stocks, especially in young volcanic areas where mineralogy controls SOC stocks and varies strongly on a fine spatial scale. Improved knowledge of pedogenesis is thus needed for understanding the variability and distribution of SOC stocks.
All data used in this paper are available at https://doi.org/10.23708/RKOTNR (Chevallier et al., 2019).
The supplement related to this article is available online at: https://doi.org/10.5194/soil-5-315-2019-supplement.
OR and RK designed the experiments. FG, EdMVF, and PL carried them out. AA performed the lab analyses and the MIRS analyses. KF performed the statistics. TC prepared the manuscript with contributions from all the co-authors.
The authors declare that they have no conflict of interest.
Our study was part of the work of the CoffeeFlux observatory, developed by CIRAD (Centre de Coopération Internationale en Recherche Agronomique pour le Développement) and CATIE (Centro Agronómico Tropical de Investigación y Enseñanza). This site contributes to FLUXNET (CR-AqC) and belongs to the SOERE F-ORE-T network of observatories, with support from Ecofor, Allenvi, and the French national research infrastructure ANAEE-F (http://www.anaee-france.fr, last access: 31 October 2019). This work was also supported by AIRD (SAFSE) and the ANR, the French Research Agency, through two projects: Ecosfix (ANR-2010-STRA-003-01) and MACACC (ANR-13-AGRO-0005).
The authors give warm thanks for the field support we received in Costa Rica, including that from Álvaro Barquero and his family; from Aléxis Pérez; and from the following persons at Cafetalera Aquiares: Alfonso and Diego Robelo, Luis Guillermo Navarro, Manuel Jara, and Rafael Acuña Vargas.
This research has been supported by the ANR, the French Research Agency (grant nos. ANR‐2010‐STRA‐ 003‐01 and ANR‐13‐AGRO‐0005).
This paper was edited by Karsten Kalbitz and reviewed by two anonymous referees.
Andriamananjara, A., Hewson, J., Razakamanarivo, H., Andrisoa, R. H., Ranaivoson, N., Ramboatiana, N., Razafindrakoto, M., Ramifehiarivo, N., Razafimanantsoa, M. P., Rabeharisoa, L., Ramananantoandro, T., Rasolohery, A., Rabetokotany, N., and Razafimbelo, T.: Land cover impacts on aboveground and soil carbon stocks in Malagasy rainforest, Agr. Ecosyst. Environ., 233, 1–15, https://doi.org/10.1016/j.agee.2016.08.030, 2016.
Aomine, S. and Wada, K.: Differential weathering of volcanic ash and pumice resulting in the formation of hydrated halloysite, American Mineralogist, 47, 1024–1048, 1962.
Basile-Doelsch, I., Amundson, R., Stone, W. E. E., Masiello, C. A., Bottero, J. Y., Colin, F., Masin, F., Borschneck, D., and Meunier, J. D.: Mineralogical control of organic carbon dynamics in a volcanic ash soil on La Réunion, Eur. J. Soil Sci., 56, 689–703, https://doi.org/10.1111/j.1365-2389.2005.00703.x, 2005.
Batjes, N. H.: Total carbon and nitrogen in the soils of the world, Eur. J. Soil Sci., 65, 4–21, https://doi.org/10.1111/ejss.12115, 2014.
Beare, M. H., McNeill, S. J., Curtin, D., Parfitt, R. L., Jones, J. S., Dodd, M. B., and Sharp, J.: Estimating the organic carbon stabilisation capacity and saturation deficit of soils: a New Zealand case study, Biogeochemistry, 120, 71–87, https://doi.org/10.1007/s10533-014-9982-1, 2014.
Ben-Dor, E., Chabrillat, S., Demattê, J. A. M., Taylor, G. R., Hill, J., Whiting, M. L., and Sommer, S.: Using Imaging Spectroscopy to study soil properties, Remote Sens. Environ., 113, S38–S55, https://doi.org/10.1016/j.rse.2008.09.019, 2009.
Benegas, L., Ilstedt, U., Roupsard, O., Jones, J., and Malmer, A.: Effects of trees on infiltrability and preferential flow in two contrasting agroecosystems in Central America, Agr. Ecosyst. Environ., 183, 185–196, https://doi.org/10.1016/j.agee.2013.10.027, 2014.
Blakemore, L. C., Searle, P. L., and Daly, B. K.: Soil Bureau Laboratory Methods: Methods for chemical analysis of soils. New Zealand Soil Bureau Scientific Report, 10A, CSIRO, New Zealand, 1981.
Boudot, J. P.: Relative efficiency of complexed aluminum, noncrystalline Al hydroxide, allophane and imogolite in retarding the biodegradation of citric acid, Geoderma, 52, 29–39, https://doi.org/10.1016/0016-7061(92)90073-G, 1992.
Bounouara, Z., Chevallier, T., Balesdent, J., Toucet, J., Sbih, M., Bernoux, M., Belaissaoui, N., Bouneb, O., and Bensaid, R.: Variation in soil carbon stocks with depth along a toposequence in a sub-humid climate in North Africa (Skikda, Algeria), J. Arid Environ., 141, 25–33, https://doi.org/10.1016/j.jaridenv.2017.02.001, 2017.
Buurman, P., Peterse, F., and Almendros Martin, G.: Soil organic matter chemistry in allophanic soils: a pyrolysis-GC/MS study of a Costa Rican Andosol catena, Eur. J. Soil Sci., 58, 1330–1347, https://doi.org/10.1111/j.1365-2389.2007.00925.x, 2007.
Cambou, A., Cardinael, R., Kouakoua, E., Villeneuve, M., Durand, C., and Barthès, B. G.: Prediction of soil organic carbon stock using visible and near infrared reflectance spectroscopy (VNIRS) in the field, Geoderma, 261, 151–159, https://doi.org/10.1016/j.geoderma.2015.07.007, 2016.
Cardinael, R., Chevallier, T., Barthès, B., Saby, N., Parent, T., Dupraz, C., Bernoux, M., and Chenu, C.: Impact of alley cropping agroforestry on stocks, forms and spatial distribution of soil organic carbon – A case study in a Mediterranean context, Geoderma, 259–260, 288–299, https://doi.org/10.1016/j.geoderma.2015.06.015, 2015.
CENIGA: Hojas Topográficas Escala 1:25 000, Proyecto TERRA, available at: http://ceniga.sinac.go.cr/geonetwork/srv/eng/main.home (last access: 31 October 2019), 1998.
Chang, C. W., Laird, D. A., Mausbach, M. J., and Hurburgh, C. R.: Near-Infrared Reflectance Spectroscopy–Principal Components Regression Analyses of Soil Properties, soil Sci. Soc. Am. J., 65, 480–490, https://doi.org/10.2136/sssaj2001.652480x, 2001.
Charbonnier, F., Roupsard, O., le Maire, G., Guillemot, J., Casanoves, F., Lacointe, A., Vaast, P., Allinne, C., Audebert, L., Cambou, A., Clement-Vidal, A., Defrenet, E., Duursma, R. A., Jarri, L., Jourdan, C., Khac, E., Leandro, P., Medlyn, B. E., Saint-Andre, L., Thaler, P., Van den Meersche, K., Aguilar, A. B., Lehner, P., and Dreyer, E.: Increased light-use efficiency sustains net primary productivity of shaded coffee plants in agroforestry system, Plant Cell Environ. 40, 1592–1608, https://doi.org/10.1111/pce.12964, 2017.
Chevallier, T., Voltz, M., Blanchart, E., Chotte, J. L., Eschenbrenner, V., Mahieu, M., and Albrecht, A.: Spatial and temporal changes of soil C after establishment of a pasture on a long-term cultivated vertisol (Martinique), Geoderma, 94, 43–58, https://doi.org/10.1016/S0016-7061(99)00064-6, 2000.
Chevallier, T., Woignier, T., Toucet, J., and Blanchart, E.: Organic carbon stabilization in the fractal pore structure of Andosols, Geoderma, 159, 182–188, https://doi.org/10.1016/j.geoderma.2010.07.010, 2010.
Chevallier, T., Fujisaki, K., Roupsard, O., Guidat, F., Kinoshita, R., De Melo Viginio Fihlo, E., Lehner, P., and Albrecht, A.: Soil carbon content, bulk densities, allophane and MIRS data on Aquiares Watershed (Costa Rica), DataSuds, V1, https://doi.org/10.23708/RKOTNR, 2019.
Churchman, J., Pasbakhsh, P., Lowe, D. J., and Theng, B. K. G.: Unique but diverse: some observations on the formation, structure, and morphology of halloysite, Clays Minerals, 51, 395–416, https://doi.org/10.1180/claymin.2016.051.3.14, 2016.
Clairotte, M., Grinand, C., Kouakoua, E., Thébault, A., Saby, N., Bernoux, M., and Barthès, B. G.: National calibration of soil organic carbon concentration using diffuse infrared reflectance spectroscopy, Geoderma, 276, 41–52, https://doi.org/10.1016/j.geoderma.2016.04.021, 2016.
Costa Junior, C., Corbeels, M., Bernoux, M., Piccolo, M. C., Siqueira Neto, M., Feigl, B. J., Cerri, C. E. P., Cerri, C. C., Scopel, E., and Lal, R.: Assessing soil carbon storage rates under no-tillage: Comparing the synchronic and diachronic approaches, Soil Till. Res., 134, 207–212, https://doi.org/10.1016/j.still.2013.08.010, 2013.
Dahlgren, R. A., Saigusa, M., and Ugolini, F. C.: The nature, properties and management of volcanic soils, edited by: Sparks, D. L., Advances in Agronomy, 82, 113–182, 2004.
Defrenet, E., Roupsard, O., Van den Meersche, K., Charbonnier, F., Pastor Pérez-Molina, J., Khac, E., Prieto, I., Stokes, A., Roumet, C., Rapidel, B., de Melo Virginio Filho, E., Vargas, V. J., Robelo, D., Barquero, A., and Jourdan, C.: Root biomass, turnover and net primary productivity of a coffee agroforestry system in Costa Rica: effects of soil depth, shade trees, distance to row and coffee age, Ann. Bot., 118, 833–851, https://doi.org/10.1093/aob/mcw153, 2016.
Devitre, C., Gazel, E., Quesada, P., Tracy, R., Lucke, O., Soto, G., and Alvarado-Induni, G.: Geochemical Evidence for Multi-Stage Chaotic Magma Mixing at Turrialba Volcano, Costa Rica, Fall meeting AGU, Washington, D.C., 10–14 December 2018, 2018.
Don, A., Schumacher, J., Scherer-Lorenzen, M., Scholten, T., and Schulze, E. D.: Spatial and vertical variation of soil carbon at two grassland sites – Implications for measuring soil carbon stocks, Geoderma, 141, 272–282, https://doi.org/10.1016/j.geoderma.2007.06.003, 2007.
Feller, C., Albrecht, A., Blanchart, E., Cabidoche, Y. M., Chevallier, T., Hartmann, C., Eschenbrenner, V., Larre-Larrouy, M. C., and Ndandou, J. F.: Soil organic carbon sequestration in tropical areas. General considerations and analysis of some edaphic determinants for Lesser Antilles soils, Nutr. Cycl. Agroecosys., 61, 19–31, https://doi.org/10.1023/A:1013359319380, 2001.
Filimonova, S., Kaufhold, S., Wagner, F. E., Hausler, W., and Kogel-Knabner, I.: The role of allophane nano-structure and Fe oxide speciation for hosting soil organic matter in an allophanic Andosol, Geochim. Cosmochim. Ac., 180, 284–302, https://doi.org/10.1016/j.gca.2016.02.033, 2016.
Gessler, P., Chadwick, O., Chamran, F., Althouse, L., and Holmes, K.: Modeling Soil-Landscape and ecosystem properties using terrain attributes, Soil Sci. Soc. Am. J., 64, 2046–2056, https://doi.org/10.2136/sssaj2000.6462046x, 2000.
Gómez-Delgado, F., Roupsard, O., le Maire, G., Taugourdeau, S., Pérez, A., van Oijen, M., Vaast, P., Rapidel, B., Harmand, J. M., Voltz, M., Bonnefond, J. M., Imbach, P., and Moussa, R.: Modelling the hydrological behaviour of a coffee agroforestry basin in Costa Rica, Hydrol. Earth Syst. Sci., 15, 369–392, https://doi.org/10.5194/hess-15-369-2011, 2011.
Hidalgo, C., Etchevers, J. D., Martinez-Richa, A., Yee-Madeira, H., Calderon, H. A., Vera-Graziano, R., and Matus, F.: Mineralogical characterization of the fine fraction (<2 µm) of degraded volcanic soils and tepetates in Mexico, Appl. Clay Sci., 49, 348–358, https://doi.org/10.1016/j.clay.2009.11.007, 2010.
Huygens, D., Boeckx, P., Van Cleemput, O., Oyarzún, C., and Godoy, R.: Aggregate and soil organic carbon dynamics in South Chilean Andisols, Biogeosciences, 2, 159–174, https://doi.org/10.5194/bg-2-159-2005, 2005.
Janik, L. J., Merry, R. H., and Skjemstad, J. O.: Can mid infrared diffuse reflectance analysis replace soil extractions?, Aust. J. Exp. Agr., 38, 681–696, https://doi.org/10.1071/EA97144, 1998.
Jobbagy, E. G. and Jackson, R. B.: The vertical distribution of soil organic carbon and its relation to climate and vegetation, Ecol. Appl., 10, 423–436, https://doi.org/10.1890/1051-0761(2000)010[0423:TVDOSO]2.0.CO;2, 2000.
Kinoshita, R., Roupsard, O., Chevallier, T., Albrecht, A., Taugourdeau, S., Ahmed, Z., and Van Es, H.: Large topsoil organic carbon variability is controlled by Andisol properties and effectively assessed by VNIR spectroscopy in a coffee agroforestry system of Costa Rica, Geoderma, 262, 254–265, https://doi.org/10.1016/j.geoderma.2015.08.026, 2016.
Kleber, M., Mikutta, R., Torn, M., and Jahn, R.: Poorly crystalline mineral phases protect organic matter in acid subsoil horizons, Eur. J. Soil Sci., 56, 717–725, https://doi.org/10.1111/j.1365-2389.2005.00706.x, 2005.
Kramer, M. G., Sanderman, J., Chadwick, O. A., Chorover, J., and Vitousek, P. M.: Long-term carbon storage through retention of dissolved aromatic acids by reactive particles in soil, Global Change Biol., 18, 2594–2605, https://doi.org/10.1111/j.1365-2486.2012.02681.x, 2012.
Lal, R.: Soil carbon sequestration impacts on global climate change and food security, Science, 304, 1623–1627, https://doi.org/10.1126/science.1097396, 2004.
Levard, C., Doelsch, E., Basile-Doelsch, I., Abidin, Z., Miche, H., Masion, A., Rose, J., Borschneck, D., and Bottero, J. Y.: Structure and distribution of allophanes, imogolite and proto-imogolite in volcanic soils, Geoderma, 183, 100–108, https://doi.org/10.1016/j.geoderma.2012.03.015, 2012.
Mathieu, J. A., Hatté, C., Balesdent, J., and Parent, É.: Deep soil carbon dynamics are driven more by soil type than by climate: a worldwide meta-analysis of radiocarbon profiles, Global Change Biol., 21, 4278–4292, https://doi.org/10.1111/gcb.13012, 2015.
Matus, F., Rumpel, C., Neculman, R., Panichini, M., and Mora, M. L.: Soil carbon storage and stabilisation in andic soils: A review, Catena, 120, 102–110, https://doi.org/10.1016/j.catena.2014.04.008, 2014.
Mayer, L. M.: Relationships between mineral surfaces and organic carbon concentrations in soils and sediments, Chem. Geol., 114, 347–363, https://doi.org/10.1016/0009-2541(94)90063-9, 1994.
Mayer, L. M. and Xing, B.: Organic matter-surface area relationships in acid soils, Soil Sci. Soc. Am. J., 65, 250–258, https://doi.org/10.2136/sssaj2001.651250x, 2001.
Mayer, L. M., Schick, L., Hardy, K., Wagai, R., and McCarthy, J.: Organic matter in small mesopores in sediments and soils, Geochim. Cosmochim. Ac., 68, 3863–3872, https://doi.org/10.1016/j.gca.2004.03.019, 2004.
McCarthy, J. F., Ilavsky, J., Jastrow, J. D., Mayer, L. M., Perfect, E., and Zhuang, J.: Protection of organic carbon in soil microaggregates via restructuring of aggregate porosity and filling of pores with accumulating organic matter, Geochim. Cosmochim. Ac., 72, 4725–4744, https://doi.org/10.1016/j.gca.2008.06.015, 2008.
McDowell, M. L., Bruland, G. L., Deenik, J. L., Grunwald, S., and Knox, N. M.: Soil total carbon analysis in Hawaiian soils with visible, near-infrared and mid-infrared diffuse reflectance spectroscopy, Geoderma, 189–190, 312–320, https://doi.org/10.1016/j.geoderma.2012.06.009, 2012.
Meijer, E. L. and Buurman, P.: Chemical trends in a perhumid soil catena on the Turrialba volcano (Costa Rica), Geoderma, 117, 185–201, https://doi.org/10.1016/S0016-7061(03)00122-8, 2003.
Misnany, B., Tranter, G., McBratney, A. B., Brough, D. M., and Murphy, B. W.: Regional transferability of mid-infrared diffuse reflectance spectroscopic prediction for soil chemical properties, Geoderma, 153, 155–162, https://doi.org/10.1016/j.geoderma.2009.07.021, 2009.
Mizota, C. and Van Reewijk, L. P.: Clay mineralogy and chemistry of soils formed in volcanic material in diverse climatic regions, Soil Monograph no. 2, International Soil Reference and Information Center, Wageningen, 185 pp., 1989.
Mora, J. L., Guerra, J. A., Armas-Herrera, C. M., Arbelo, C. D., and Rodríguez-Rodríguez, A.: Storage and depth distribution of organic carbon in volcanic soils as affected by environmental and pedological factors, Catena, 123, 163–175, https://doi.org/10.1016/j.catena.2014.08.004, 2014.
Mora-Chinchilla, R.: Geomorfología de la Cuenca del Río Turrialba, Universidad de Costa Rica, San José, 2000.
Nocita, M., Stevens, A., Van Wesemael, B., Aitkenhead, M., Bachmann, M., Barthès, B. G., Ben Dor, E., Brown, D. J., Clairotte, M., Csorba, A., Dardenne, P., Demattê, J. A. M., Genot, V., Guerrerro, C., Knadel, M., Montanarella, L., Noon, C., Ramirez-Lopez, L., Robertson, J., Sakai, H., Soriano-Disla, J. M., Sheperd, K. D., Stenberg, B., Towett, E. K., Vargas, R., and Wetterlind, J.: Soil Spectroscopy: An alternative to wet chemistry for soil monitoring, Adv. Agron., 132, 139–159, https://doi.org/10.1016/bs.agron.2015.02.002, 2015.
Noponen, M., Healey, J. R., Soto, G., and Haggar, J. P.: Sink or source – The potential of coffee agroforestry systems to sequester atmospheric CO2 into soil organic carbon, Agr. Ecosyst. Environ., 175, 60–68, https://doi.org/10.1016/j.agee.2013.04.012, 2013.
Parfitt, R. L.: Allophane and imogolite: role in soil biogeochemical processes, Clay Miner., 44, 135–155, https://doi.org/10.1180/claymin.2009.044.1.135, 2009.
Parfitt, R. L. and Childs, C. W.: Estimation of forms of Fe and Al: a review, and analysis of constrastig soils by dissolution and Moessbauer methods, Aust. J. Soil Res., 26, 121–144, https://doi.org/10.1071/SR9880121, 1988.
Parfitt, R. L., Russell, M., and Orbell, G. E.: Weathering sequence of soils from volcanic ash involving allophane and halloysite, New Zealand, Geoderma, 29, 41–57, https://doi.org/10.1016/0016-7061(83)90029-0, 1983.
Parfitt, R. L., Theng, B. K. G., Whitton, J. S., and Shepherd, T. G.: Effects of clay minerals and land use on organic matter pools, Geoderma, 75, 1–12, https://doi.org/10.1016/S0016-7061(96)00079-1, 1997.
Parfitt, R. L. and Wilson, A. D.: Estimation of allophane and halloysite in three sequences of volcanic soils, Catena Suppl., 7, 1–8, 1985.
Payan, F., Jones, D. L., Beer, J., and Harmand, J. M.: Soil characteristics below Erythrina poeppigiana in organic and conventional Costa Rican coffee plantations, Agroforest. Syst., 76, 81–93, https://doi.org/10.1007/s10457-008-9201-y, 2009.
Percival, H. J., Parfitt, R. L., and Scott, N. A.: Factors controlling soil carbon levels in New Zealand grasslands: Is clay content important?, Soil Sci. Soc. Am. J., 64, 1623–1630, https://doi.org/10.2136/sssaj2000.6451623x, 2000.
Poulenard, J., Podwojewski, P., and Herbillon, A. J.: Characteristics of non-allophanic andisols with hydric properties from the Ecuadorian paramos, Geoderma, 117, 267–281, https://doi.org/10.1016/s0016-7061(03)00128-9, 2003.
Powers, J. S. and Schlesinger, W. H.: Relationships among soil carbon distributions and biophysical factors at nested spatial scales in rain forests of northeastern Costa Rica, Geoderma, 109, 165–190, https://doi.org/10.1016/s0016-7061(02)00147-7, 2002.
Rasse, D. P., Mulder, J., Moni, C., and Chenu, C.: Carbon turnover kinetics with depth in a French loamy soil, Soil Sci. Soc. Am. J., 70, 2097–2105, https://doi.org/10.2136/sssaj2006.0056, 2006.
R Core Team: R: A Language and Environment for Statistical Computing, R Foundation for Statistical Computing, Vienna, Austria, available at: https://www.R-project.org/ (last access: 31 October 2019), 2016.
Ross, C. S. and Kerr, P. F.: Halloysite and allophane, U.S. Geological Survey Professional Papers, 185–189, 135–148, 1934.
Scheel, T., Dörfler, C., and Kalbitz, K.: Precipitation of dissolved organic matter by aluminium stabilizes carbon in acidic forest soils, Soil Sci. Soc. Am. J., 71, 64–74, https://doi.org/10.2136/sssaj2006.0111, 2007.
Shen, Q., Suarez-Abelenda, M., Camps-Arbestain, M., Calvelo Pereira, R., McNally, S. R., and Kelliher, F. M.: An investigation of organic matter quality and quantity in acid soils asinfluenced by soil type and land use, Geoderma, 328, 44–55, https://doi.org/10.1016/j.geoderma.2018.05.006, 2018.
Shi, S., Zhang, W., Zhang, P., Yu, Y., and Ding, F.: A synthesis of change in deep soil organic carbon stores with afforestation of agricultural soils, Forest Ecol. Manag., 296, 53–63, https://doi.org/10.1016/j.foreco.2013.01.026, 2013.
Shoji, S., Nanzyo, M., Dahlgren, R. A., and Quantin, P.: Evaluation and proposed revisions of criteria for Andosols in the world reference base for soil resources, Soil Sci., 161, 604–615, https://doi.org/10.1097/00010694-199609000-00005, 1996.
Soriano-Disla, J. M., Janik, L. J., Rossel, R. A. V., Macdonald, L. M., and McLaughlin, M. J.: The performance of visible, near-, and mid-infrared reflectance spectroscopy for prediction of soil physical, chemical, and biological properties, Appl. Spectrosc. Rev., 49, 139–186, https://doi.org/10.1080/05704928.2013.811081, 2014.
Takahashi, T. and Dahlgren, R. A.: Nature, properties and function of aluminum–humus complexes in volcanic soils, Geoderma, 263, 110–121, https://doi.org/10.1016/j.geoderma.2015.08.032, 2016.
Terra, F. S., Dematte, J. A. M., and Rossel, R. A. V.: Proximal spectral sensing in pedological assessments: vis-NIR spectra for soil classification based on weathering and pedogenesis, Geoderma, 318, 123–136, https://doi.org/10.1016/j.geoderma.2017.10.053, 2018.
Tonneijck, F. H., Jansen, B., Nierop, K. G. J., Verstraten, J. M., Sevink, J., and De Lange, L.: Towards understanding of carbon stocks and stabilization in volcanic ash soils in natural Andean ecosystems of northern Ecuador, Eur. J. Soil Sci., 61, 392–405, https://doi.org/10.1111/j.1365-2389.2010.01241.x, 2010.
Torn, M., Trumbore, S., Chadwick, O., Vitousek, P., and Hendricks, D.: Mineral control of soil organic carbon storage and turnover, Nature, 389, 170–173, https://doi.org/10.1038/38260, 1997.
Ugolini, F. C. and Dahlgren, R. A.: Soil development in volcanic ash, Global J. Environ. Res., 6, 69–81, 2002.
Visacarra Rossel, R. A., Behrens, T., Ben-Dor, E., Brown, D. J., Dematte, J. A. M., Shepherd, K. D., Shi, Z., Stenberg, B., Stevens, A., Adamchuk, V., Aichi, H., Barthes, B. G., Bartholomeus, H. M., Bayer, A. D., Bernoux, M., Bottcher, K., Brodsky, L., Du, C. W., Chappell, A., Fouad, Y., Genot, V., Gomez, C., Grunwald, S., Gubler, A., Guerrero, C., Hedley, C. B., Knadel, M., Morras, H. J. M., Nocita, M., Ramirez-Lopez, L., Roudier, P., Campos, E. M. R., Sanborn, P., Sellitto, V. M., Sudduth, K. A., Rawlins, B. G., Walter, C., Winowiecki, L. A., Hong, S. Y., and Ji, W.: A global spectral library to characterize the world's soil, Earth-Sci. Rev., 155, 198–230, https://doi.org/10.1016/j.earscirev.2016.01.012, 2016.
Wada, K. J.: Allophane and Imogolite, in: MineraIs in Soil Environments, edited by: Dixon, J. B. and Weeds, S. B., 2nd ed. Soil Sc. Soc. Am., WI, 1051–1108, 1989.
Welsh, K., Boll, J., Sanchez-Murillo, R., and Roupsard, O.: Isotope hydrology of a tropical coffee agroforestry watershed: Seasonal and event-based analyses, Hydrol. Process., 32, 1965–1977, https://doi.org/10.1002/hyp.13149, 2018.
Zehetner, F., Miller, W. P., and West, L. T.: Pedogenesis of Volcanic Ash Soils in Andean Ecuador, Soil Sci. Soc. Am. J., 67, 1797–1809, https://doi.org/10.2136/sssaj2003.1797, 2003.