the Creative Commons Attribution 4.0 License.
the Creative Commons Attribution 4.0 License.
 | 07 Nov 2018
Spatial assessments of soil organic carbon for stakeholder decision-making – a case study from Kenya
Tor-Gunnar Vågen
Leigh Ann Winowiecki
Constance Neely
Sabrina Chesterman
Mieke Bourne
Land degradation impacts the health and livelihoods of about 1.5 billion people worldwide. Given that the state of the environment and food security are strongly interlinked in tropical landscapes, the increasing need for land for food production, urbanization and other uses poses several threats to sustainability in the long term. This paper demonstrates the integration of land and soil health maps with socioeconomic datasets into an online, open-access platform called the Resilience Diagnostic and Decision Support Tool for Turkana County in Kenya, using the Stakeholder Approach to Risk Informed and Evidence Based Decision Making (SHARED) methodology. The paper highlights the utility of spatial assessments of soil organic carbon (SOC) for monitoring land degradation neutrality (LDN) compliance, understanding the drivers of SOC dynamics and inclusion of these in stakeholder decision-making. The main objectives of this paper were to (1) demonstrate the application of a systematic approach for land health assessments, including spatial mapping of soil organic carbon; (2) show an operational interdisciplinary framework for assessing ecosystem health and (3) showcase the application of evidence-based tools for stakeholder engagement using the SHARED approach. Through the approaches and tools presented, the paper addresses the increasing need for more integrated approaches when assessing and managing ecosystem health to meet the targets of the 2030 Agenda, including Sustainable Development Goal (SDG) 15.3. In addition to systematic and reliable biophysical and socioeconomic assessments, stakeholder engagement with evidence is crucial to support such integrated approaches.
- Article
(2921 KB) - Full-text XML
-
Supplement
(3978 KB) - BibTeX
- EndNote


The 2030 Agenda, including multilateral environmental agreements and the Sustainable Development Goals (SDGs), has set the stage for greater appreciation and understanding of the complex nature and interactions among environmental challenges facing society (United Nations General Assembly, 2015). SDG 15 calls for the protection, restoration and promotion of sustainable use of terrestrial ecosystems and sustainably managed forests, combating desertification, halting and reversing land degradation and halting biodiversity loss. At their core, initiatives such as land degradation neutrality (LDN) and SDG 15 emphasize healthy ecosystem function and resilient landscapes, which underpin healthy economies and societal well-being. Because these issues are intrinsically inter-related, decisions around soil and land cannot be taken in isolation. Achieving the associated targets requires a robust evidence base for measuring and monitoring land health indicators and associated land management practices, coupled with local- and policy-level awareness of the importance of land health in supporting multiple sectors. Also, local capacity to implement, monitor and assess these indicators is needed, including mechanisms for integrated, cross-sectoral coordination and inclusive, multi-stakeholder collaboration to achieve impact.
Many assessments of land health suffer from (i) disagreements about the definition of land degradation/land health; (ii) an abundance of indicators (Heink and Kowarik, 2010) that are often not feasible to measure and hence operationalize and (iii) a lack of rigorous science-based indicators (Niemeijer and de Groot, 2008) and analytical frameworks. Comparable indicators are critical when assessing environmental conditions and progress made towards the mitigation or avoidance of land degradation, but they are also important to effectively communicate information both to stakeholders, such as farmers or advisory services, and to policy makers. In addition to being comparable, indicators for assessment and monitoring of land health should be (a) science-based; (b) readily measurable (quantifiable); (c) rapid; (d) based on field assessment across multiple scales (plot, field, landscape, region) and (e) representative of the complex processes of land degradation in landscapes (Dale and Beyeler, 2001). The methods, tools and approaches presented in this paper offer realistic and cost-effective options both for baseline assessments of LDN indicators and for the monitoring of progress towards LDN targets. Several assessments of methodologies for LDN compliance (Aynekulu et al., 2017; Caspari et al., 2015; Stavi and Lal, 2015) also highlight the need for consistent, spatially explicit data over time.
The Land Degradation Surveillance Framework (LDSF) is an example of a method that has been applied in a number of projects in the global tropics to provide more rigorous, science-based assessments of land degradation risk and status, as well as soil health (Vågen et al., 2013a). An important indicator of soil health is soil organic carbon (SOC), and field datasets collected using the LDSF have been used to provide spatially explicit assessments of SOC and other indicators of land degradation processes, such as soil erosion, in addition to other soil functional properties (Vågen et al., 2012, 2016; Winowiecki et al., 2016a, b). These assessments can be used to inform spatially explicit land and soil health monitoring systems, which are critical in order for countries to avoid land degradation, or to restore ecosystems that are already degraded. Combining systematic data collection efforts with rigorous analytical frameworks, evidence-based approaches can be used to engage stakeholders with interactive online user-friendly platforms to inform national and international policy makers.
Within this context, the engagement of stakeholders becomes an important element to prioritize investment strategies for accelerating the achievement of the SDGs. The Stakeholder Approach to Risk Informed and Evidence Based Decision Making (SHARED)1 emerged in response to this need and was developed around a number of key factors, steps and principles, including (i) advancing a holistic or systems view to raise awareness on the integrated nature of environmental, social, cultural and economic dimensions and causal relationships; (ii) establishing a clear understanding of the influencing factors of human and group decision-making including stakeholder analysis; (iii) facilitating different government sectors and multi-stakeholder platforms of diverse societal sectors; (iv) collectively articulating mutually agreed, desired sustainable development outcomes and indicators building upon fundamental ecosystem services and nested within national and global goals; (v) generating evidence and experience and tailoring tools in a readily consumable way for problem solving and options identification; (vi) testing options based on collectively defined criteria, including risks and potential synergies and (vii) designing option implementation with monitoring and evaluation and co-learning feedback into the process.
This paper demonstrates the integration of land and soil health maps, using spatial assessments of SOC as an example, with socioeconomic datasets into an online tool, the Resilience Diagnostic and Decision Support Tool2 (RDDST) in Turkana County, Kenya. The main objectives of the efforts discussed in this paper were to (1) demonstrate the application of a systematic approach for land health assessments, including spatial mapping of soil organic carbon; (2) demonstrate the operationalization of interdisciplinary framework for assessing ecosystem health and (3) showcase the application of evidence-based tools for stakeholder engagement using the SHARED approach. The approaches presented can also be applied as part of LDN efforts to assist countries in more effectively restoring degraded lands and increasing agricultural productivity, including opportunities for sustainable development and biodiversity conservation (IUCN, 2015). A recent assessment of land degradation in Kenya estimates that the annual cost of land degradation is at approximately USD 1.5 billion, which represents about 5 % of the country's GDP (Munoz, 2016). Kenya has endorsed the SDG 15.3 targets, and discussions on baseline assessments and monitoring are underway. Given the large extent of drylands in Kenya, their management will be critical to achieving these targets.
This paper utilizes spatial assessments of SOC that were conducted using data from a network of LDSF sites in the global tropics. The LDSF was designed for practical and cost-effective soil and ecosystem health surveillance, including for the mapping of SOC (Vågen et al., 2013a, 2016; Winowiecki et al., 2016a, b). The framework is also designed to monitor changes over time, and provides opportunities for targeting improved soil management and land restoration activities (Lohbeck et al., 2018). Specifically, the LDSF systematically assesses several ecological metrics simultaneously at four different spatial scales (100 m2, 1000 m2, 1 km2 and 100 km2), using a spatially stratified, hierarchical sampling design (Vågen et al., 2013b). The LDSF also applies the latest soil infrared (IR) spectroscopy technologies in analysis of SOC and other soil properties, which are cost-effective and hence allow for the scaling of soil measurements. The spatial assessments of SOC included in this study were developed based on an archive of 10 000 georeferenced LDSF plots with soil samples that were analyzed for SOC and mid-infrared analysis at the ICRAF Soil and Plant Diagnostics Lab in Nairobi, Kenya, and used to conduct spatial predictions of SOC concentrations and stocks using reflectance data from the Moderate Resolution Imaging Spectroradiometer (MODIS) satellite sensor (Vågen et al., 2016). In brief, annual MODIS reflectance image composites were created based on the date of maximum fractional vegetation cover in each MODIS pixel, and these reflectance data were used to train models using the Random Forest algorithm (Breiman, 2001) to predict soil properties such as SOC and pH, as well as land degradation processes such as soil erosion. The modeling of soil and land health variables was conducted in R Statistics (R Core Team, 2018) using the randomForest (Liaw and Wiener, 2002) R library.
An interactive dashboard was developed for Turkana County, which is located in northwestern Kenya, bordering Uganda, Sudan and Ethiopia. Turkana County is part of the Arid and Semi-Arid Lands (ASALs) of Kenya, with an annual average rainfall of about 250 mm and a population of almost 1 million people, the majority of which are pastoralists. We used the Shiny web framework for R statistics (Chang et al., 2017; R Core Team, 2018) to develop an interactive dashboard integrating existing and new data and providing robust data management and graphical tools to allow users to interact with these data in a meaningful way. The RDDST dashboard is hosted on the ICRAF Landscape Portal3, which provides a platform and tools for spatial data storage and visualization.
The SHARED approach was applied to foster the innovation required to shape and embed land health assessments into inclusive negotiation and decision-making processes through a co-design process with stakeholders in Turkana County. By utilizing a comprehensive framework tailored to specific decision needs, coupled with science-based evidence, processes, evidence and tools were brought together to shift the decision paradigm towards more inclusive, inter-sectoral and interinstitutional integration to tackle complex decisions and achieve desired outcomes. The approach emphasizes the importance of rigorous indicator frameworks that are simple and readily measurable, but that reflect the complexity of both ecological systems and decision-making processes.
Through robust data management and advanced data visualization, the RDDST was co-developed with stakeholders in Turkana County to help facilitate communication of data and analysis between scientists and stakeholders. This allows for the interrogation of evidence and an increased rate of discovery, and it helps contextualize the data used. Third-party data sources for the RDDST included the Armed Conflict Location & Event Data Project (ACLED) for security data, Kenya government statistics for education and health data and data from the Hunger Safety Net Programme (HSNP) for information on livestock populations and energy use within the county.
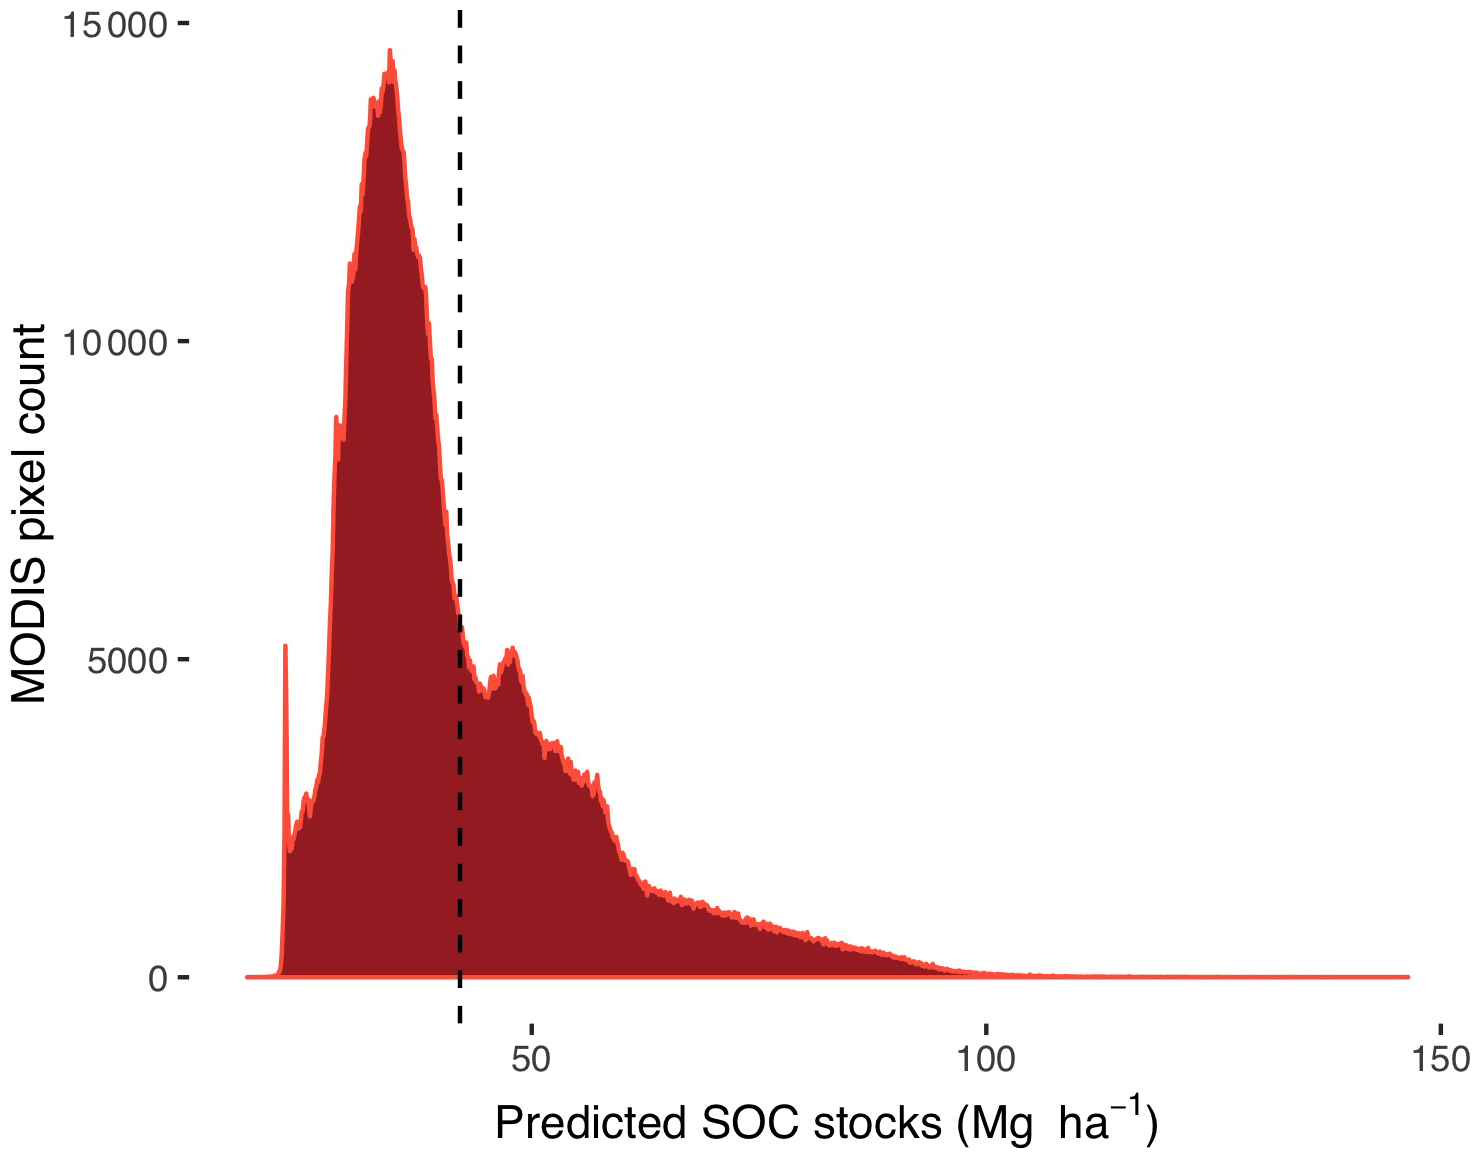
Figure 1The distribution of SOC stocks to 30 cm depth in Kenya. The vertical dashed line shows the mean (42 Mg ha−1) for the country.
The targeted facilitation and co-design approach employed ensures local ownership and cohesive communication across multiple institutions, including different political levels and knowledge systems to develop capacity and the evidence base as a continuously linked process. At the national level, the SHARED approach has been used in collaboration with Kenya's Ministry of Environment and Natural Resources and the Ministry of Agriculture, Livestock and Fisheries to synthesize the evidence of 44 integrated crop–livestock–tree system projects to develop recommendations for climate-resilient approaches (Chesterman and Neely, 2015) and to directly inform the drafting of Kenya's National Climate Change Policy Framework (Neely, 2014).
Spatial estimates of SOC stocks for Kenya show that Kenyan soils store approximately 2.4 Gt carbon (C) in the upper 30 cm of the soil profile (Minasny et al., 2017). Average SOC stocks for Kenya were estimated to be 42 Mg C ha−1 (Fig. 1) for 0 to 30 cm depth. The lowest estimated C stocks were found in arid and semi-arid regions of the country (<20 Mg C ha−1 on average), such as Turkana County. These estimates are consistent with those reported by Batjes and Batjes (2004) for arid and semi-arid parts of the country. Higher SOC stocks were found in subhumid and humid areas, including the central highlands and western parts of the country (Fig. 1). The highest SOC stocks are found in forest systems, such as around Mt. Kenya (>100 Mg C ha−1), the Aberdares, the Mau Forest Complex and Kakamega Forest. These forest systems, while making up a small proportion of the country's area, are critical carbon pools and also represent important water towers that millions of Kenyans rely on for their water supply (Mogaka et al., 2005). Also, wetland ecosystems such as inland riverine and palustrine areas are critical SOC pools in Kenya and in much of Eastern Africa. In the drylands, such wetland systems are particularly critical for SOC storage and land health, frequently reaching between 80 and 100 Mg C ha−1 at 0 to 30 cm depth. Other wetland systems, many of them under threat, such as around the Rift Valley lakes and lacustrine wetlands along Kenya's coast, are also examples of ecosystems that are critical for C storage (Minasny et al., 2017; Saunders et al., 2007) and other ecosystem services (Zedler and Kercher, 2005) in the country.
Soil organic carbon (SOC) concentrations were mapped for Africa at 500 m spatial resolution (Vågen et al., 2016) and clipped for Kenya (Fig. 2) for use in stakeholder engagement processes within Turkana County (see county outlined in Fig. 2). Large parts of the drylands have SOC concentrations that are lower than 15 g C kg−1, which is generally considered very low, as shown in Fig. 3. Given the emphasis on management of SOC as a critical resource for both agriculture and rangeland management in Turkana County, SOC concentrations were applied in the RDDST rather than estimates of SOC stocks.
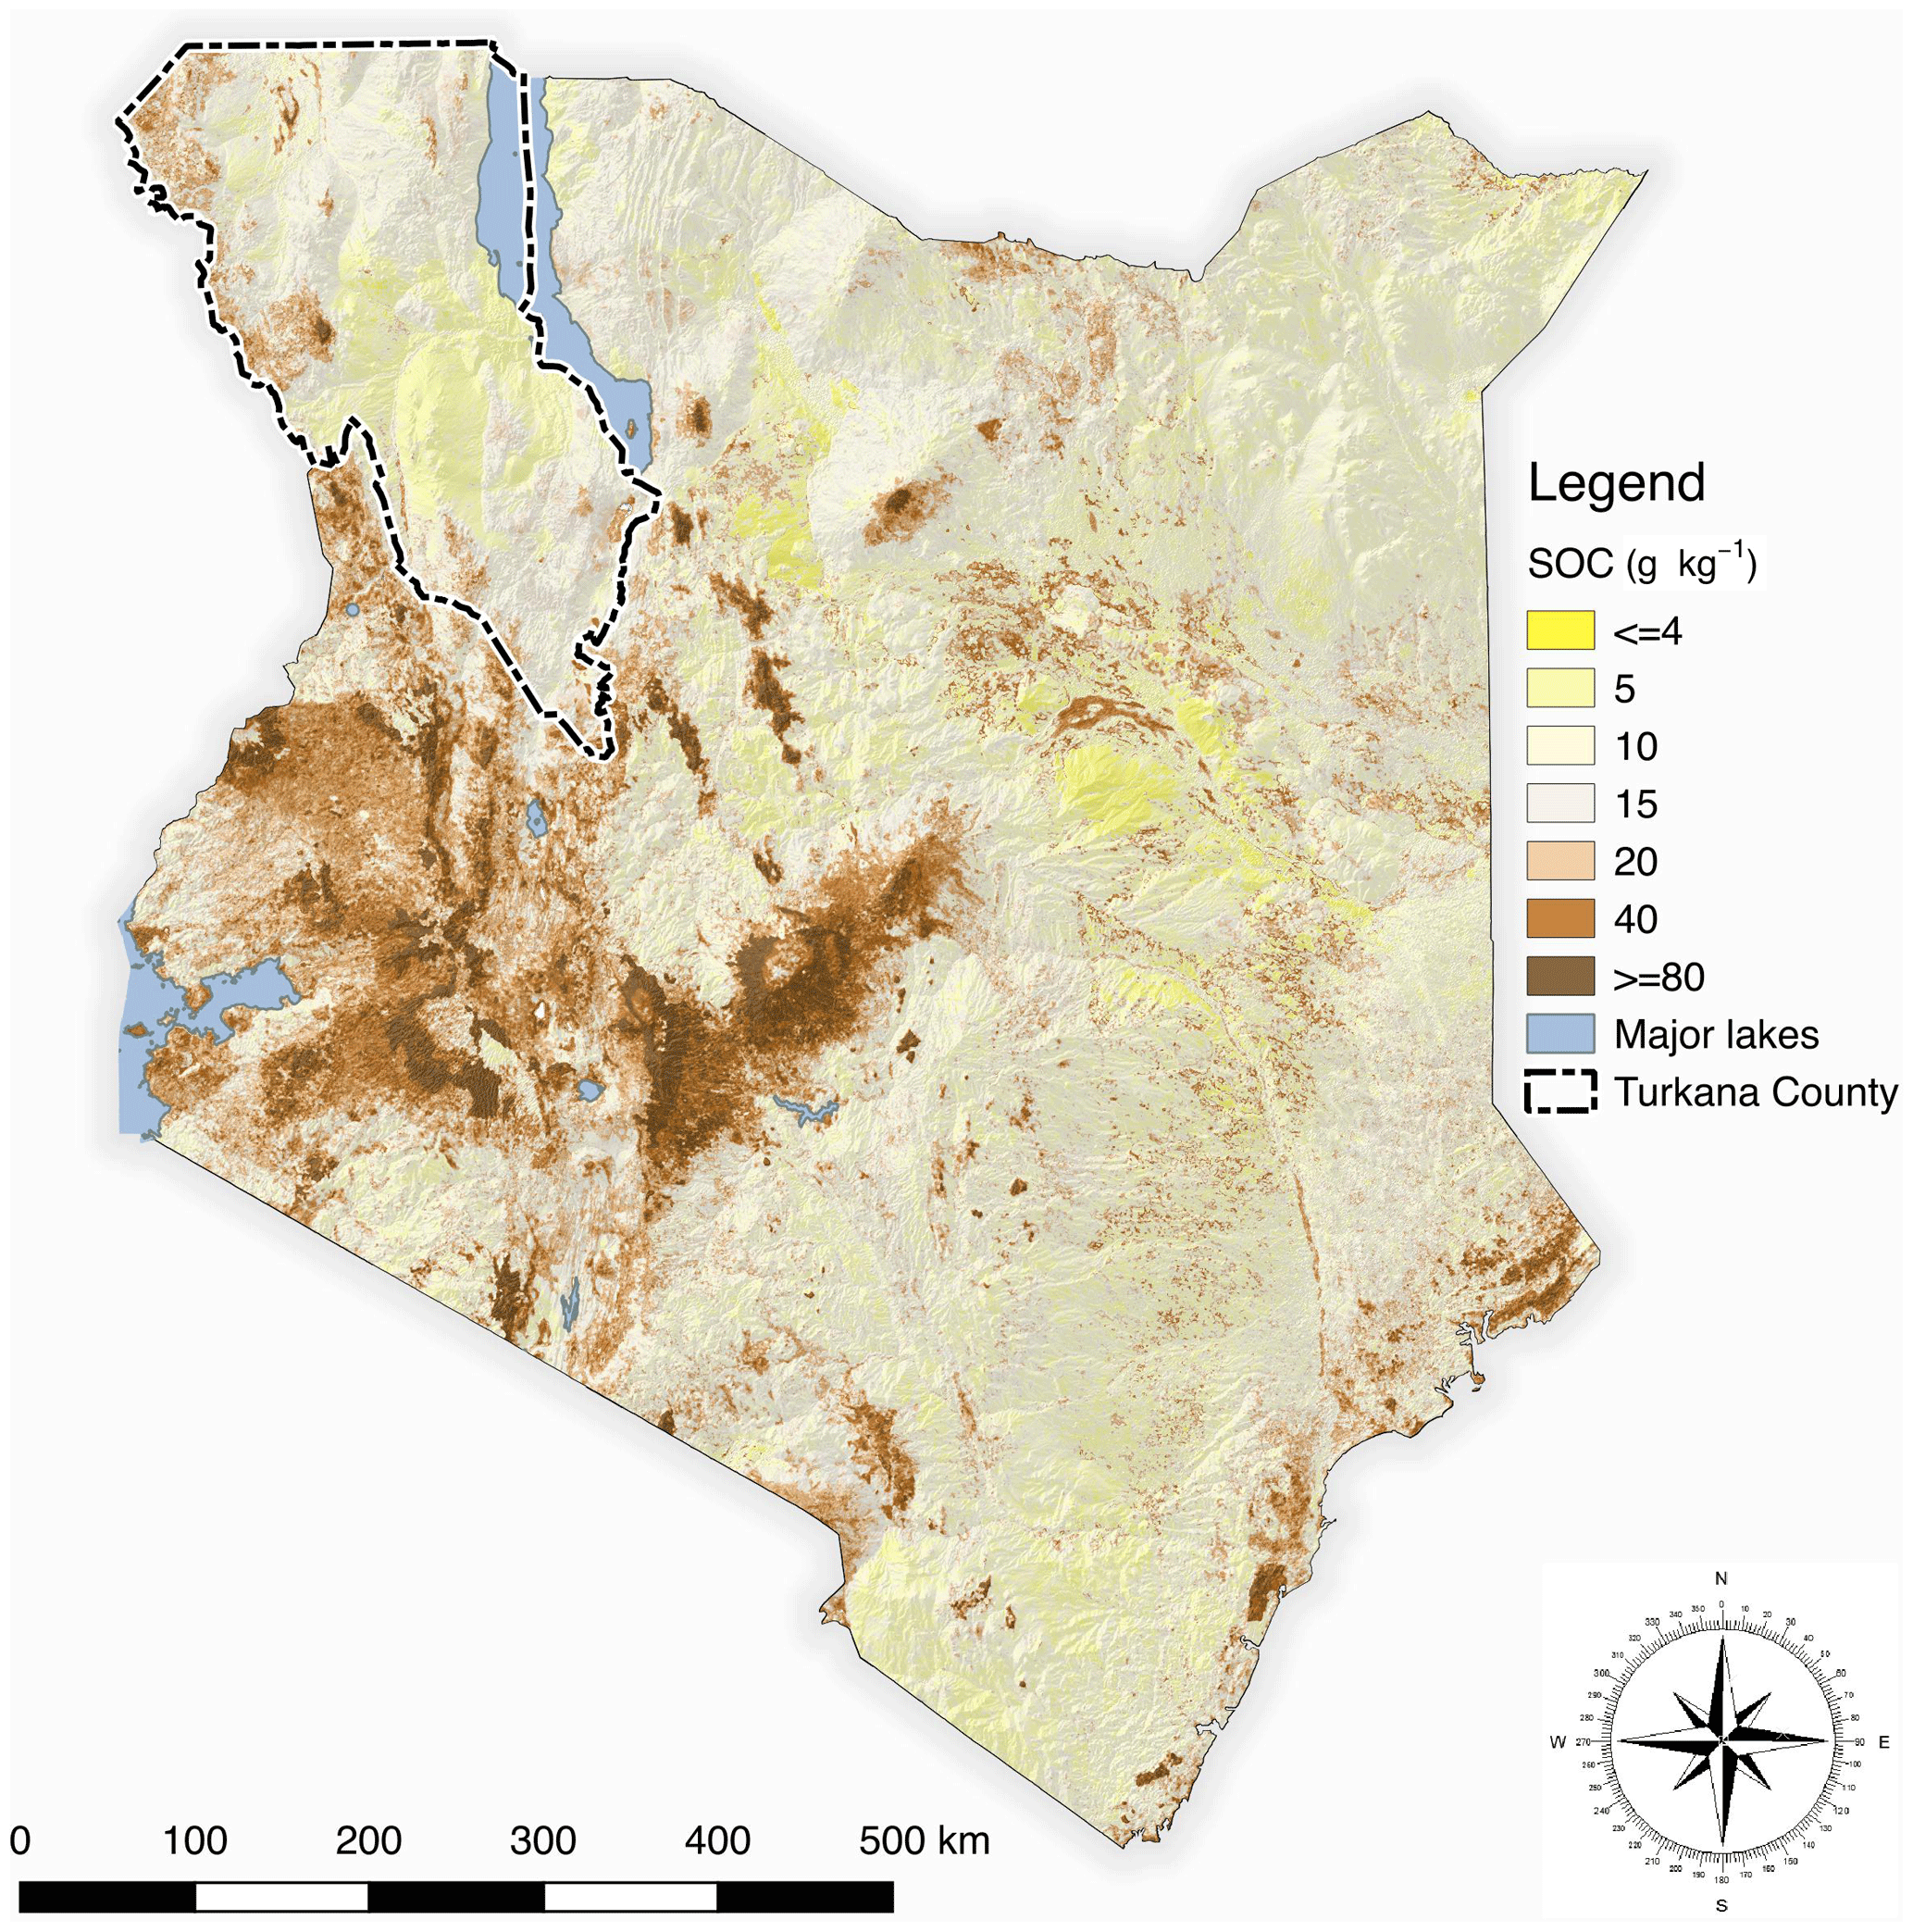
Figure 2Soil organic carbon (SOC) map of Kenya at 500 m resolution (for 2012). Turkana County is located in the northwestern corner of the country, and is outlined on the map.
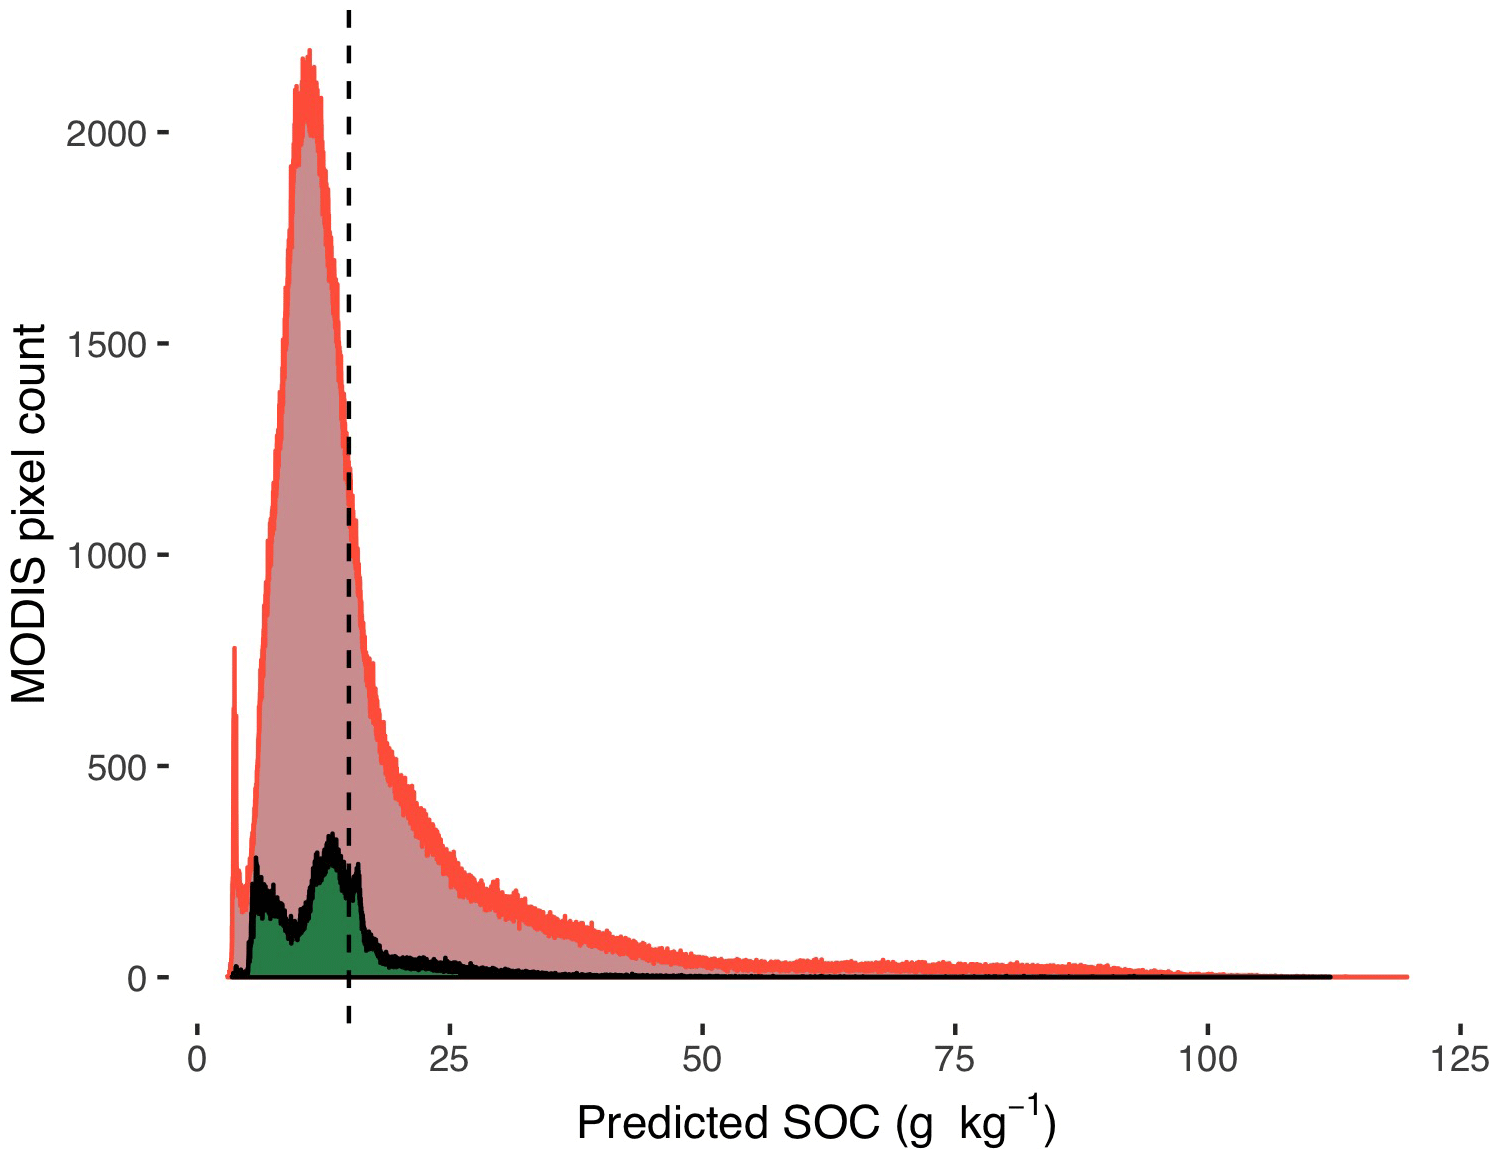
Figure 3Histograms showing the distribution of SOC in Turkana County (green) versus the rest of Kenya (red). The vertical dashed line represents a SOC concentration of 15 g kg−1.
Concentrations of SOC follow a similar pattern as the SOC stocks, as shown in Figs. 2 and 3, with very low SOC in parts of the drier northern and northeastern parts of the country. However, it is worth noting that SOC is relatively heterogenous within these areas and that there are pockets of high SOC in parts of the drylands such as the Matthews Range and mountains such as Ndoto, Marsabit and Kulal, as well as the Loima Hills in Turkana County. These areas represent critical SOC pools, are important resources for pastoralists in the drylands for dry-season grazing (Oba et al., 2000) and are hotspots for biodiversity in the region.
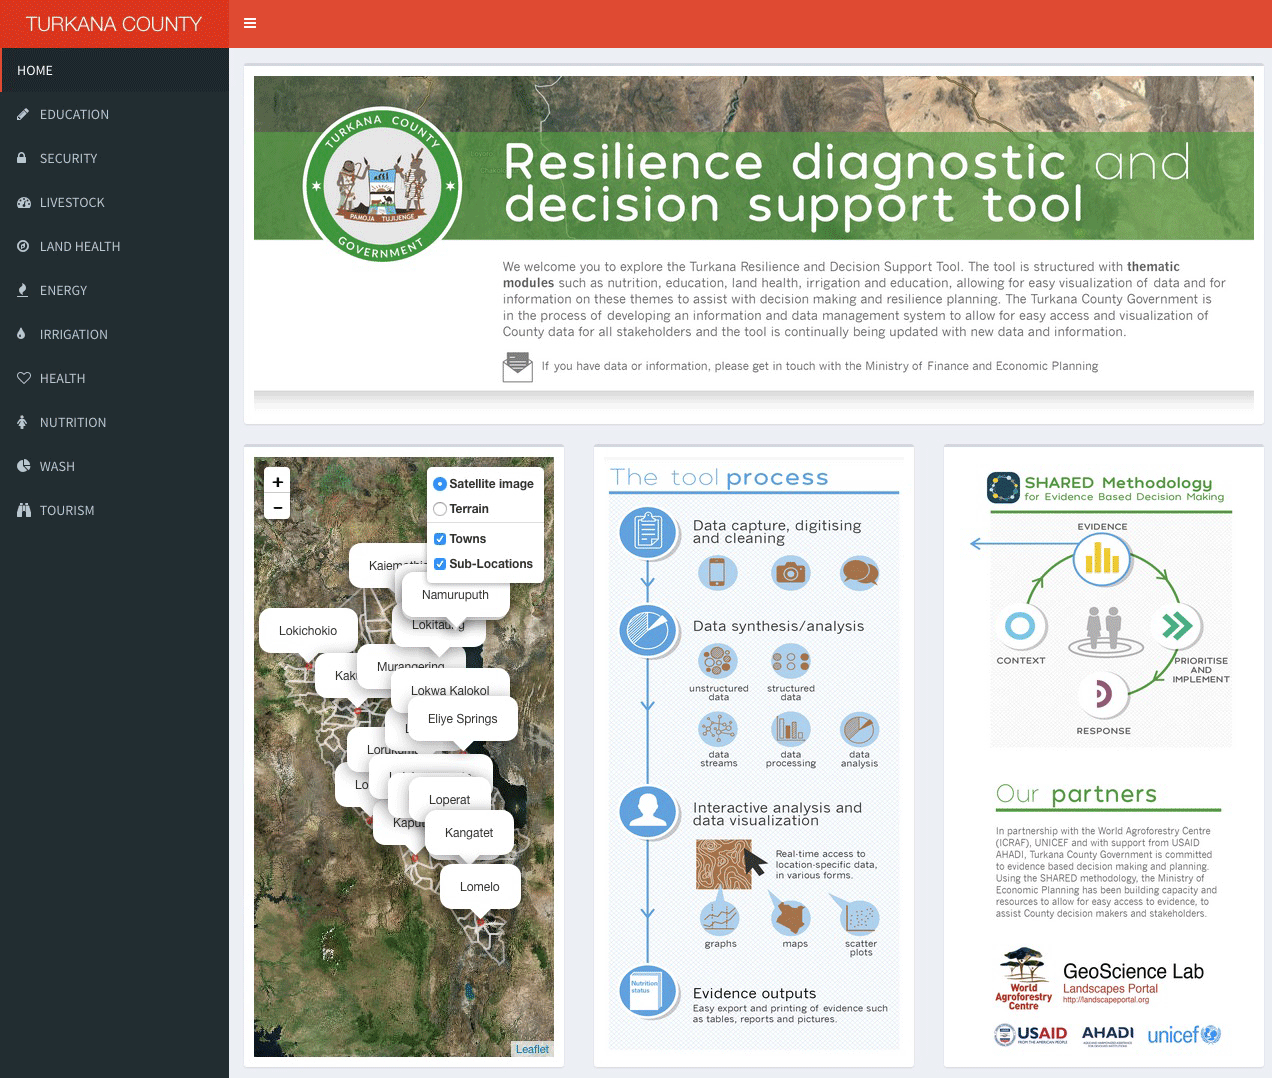
In Turkana County, maps of SOC concentrations were included in the RDDST tool to assess resilience within the county and support decision-making processes (Fig. 4), integrating data from across numerous sectors, from security and education to human health and land health. Through a serious of workshops facilitated using the SHARED process, the RDDST was co-developed with representatives from the Turkana County Government and other stakeholders such as representatives from UN organizations and non-governmental organizations (NGOs) in the county. Furthermore, the outcomes of these workshops and the RDDST were applied in the development of the Turkana County Integrated Development Plan (CIDP) for the period 2018 to 2022. The land health part of the RDDST was used to interactively visualize and explore SOC (Fig. 5), along with other key land health indicators across the county, including soil erosion prevalence, root-depth restrictions and soil pH using spatial estimates from Vågen et al. (2016). In addition, a module for exploring vegetation cover status and trends was applied for assessing vegetation performance and trends. These tools are being used to demonstrate the critical role of the underpinning natural resource base and the importance of taking this into account in decision-making across multiple sectors. Visualization of local land health parameters in conjunction with data from other sectors shifted the discourse in the county government and resulted in the identification of integrated flagships for multiple sectors working together on development outcomes with a base in land restoration.
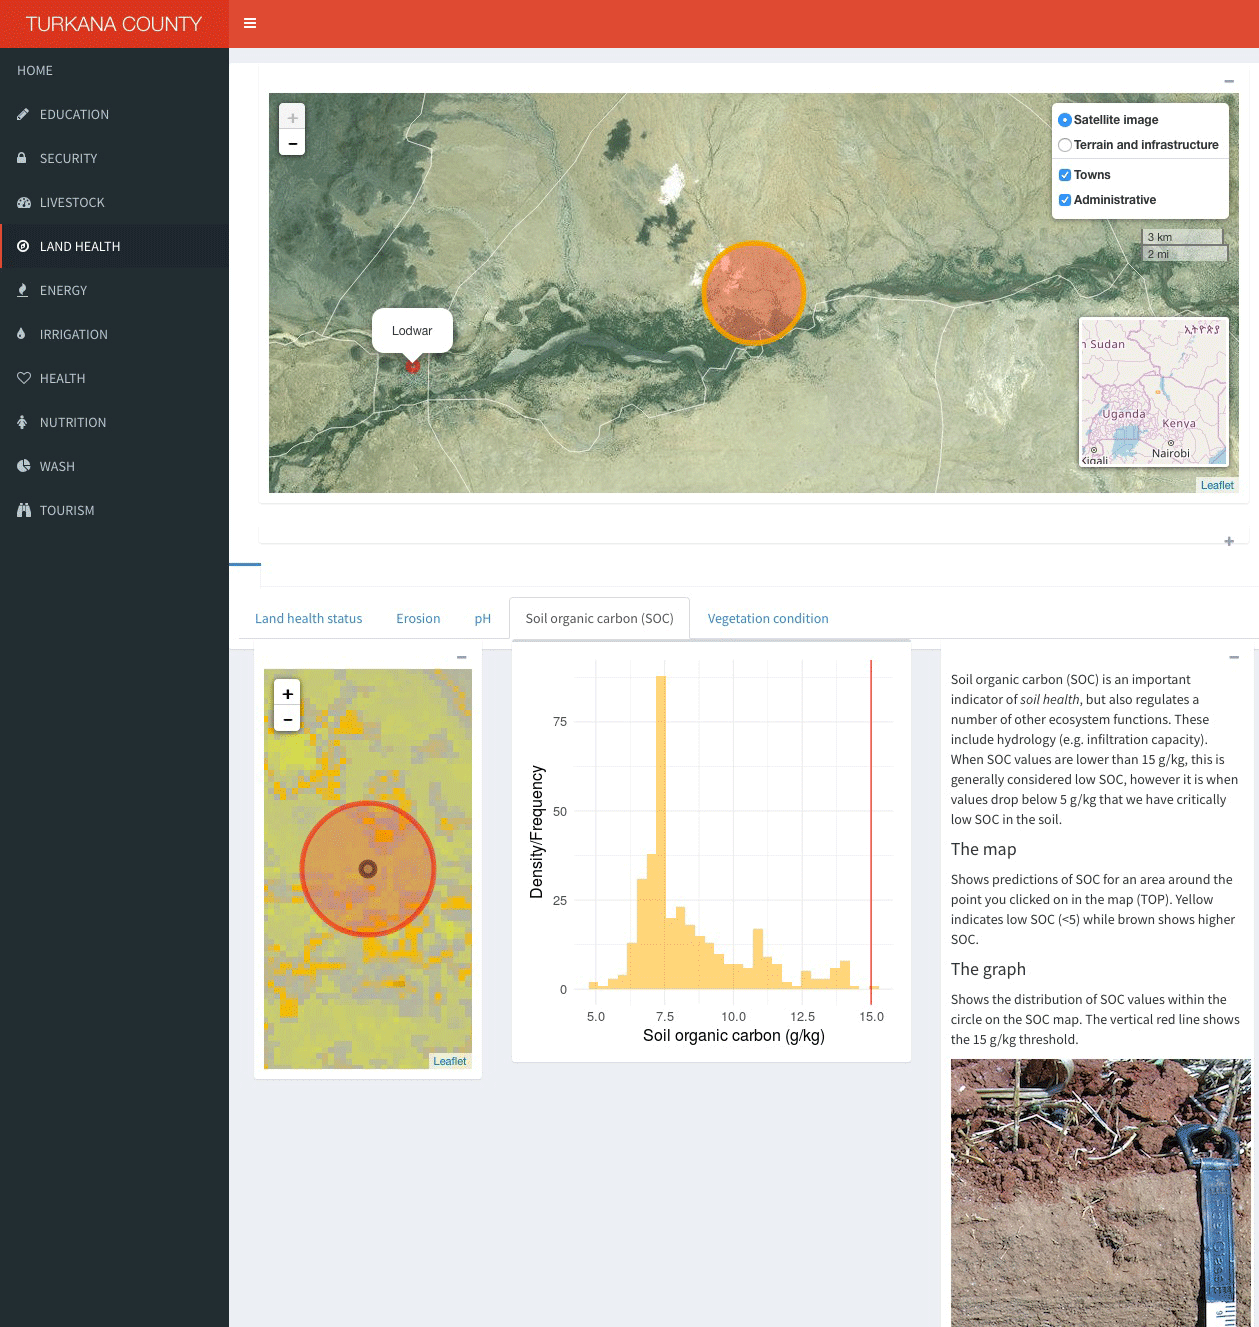
Figure 5The SOC assessment part of the Turkana Resilience Diagnostic and Decision Support Tool, which is part of the land health section of the tool.
Consistently developed indicator frameworks such as the LDSF, combined with systematic field and lab measurement protocols, allow for spatial assessments of SOC and other land health indicators at multiple spatial scales and with unprecedented accuracy and spatial coverage. Such spatial assessments can be applied at continental and regional scales (Vågen et al., 2016), as well as at country and local scales (Figs. 2 and 3), with results integrated directly into decision-making processes at a local level, as demonstrated for Turkana County (Fig. 5). In Kenyan drylands, which make up more than 80 % of the area of the country, and where the primary land use is livestock production, SOC concentrations and stocks are low due to a combination of climatic conditions and widespread land degradation. Land degradation in these drylands is the result of several factors, including substantial migration into these areas, which has resulted in a large growth in their population starting as early as over 30 years ago (Bernard, 1985) and soils that are alkaline and prone to soil erosion. This, along with other factors, has in turn resulted in overgrazing or inappropriate agricultural practices that have again resulted in accelerated land degradation. As a result, counties in the drylands of Kenya face serious challenges in terms of restoring degraded lands, including implementing policies and incentives that can help target restoration efforts both in terms of space and context. By applying spatial assessments of land health indicators, SOC being a key indicator in this regard, areas that are degraded can be identified for further assessments of the drivers and processes that are leading to degradation, while at the same time making more realistic assessments of the types of restoration efforts that are likely to be effective given conditions in a certain area or location.
There is great value in using the soil health maps depicting SOC and other attributes for awareness raising and to inform decisions of stakeholders and decision makers. Building these data into the RDDST and displaying them in conjunction with data and statistics from other sectors including human health, education, pastoral economies, environment, agriculture, trade, infrastructure and energy supported the facilitation of a newfound attention to the socioecological system and associated inter-relationships and an understanding of causal dynamics among the sectors. The Ministry of Economic Planning, working with all of the government sectors and several development actors in Turkana County, chose to use the SHARED methodology and the RDDST to guide the new Turkana County Integrated Development Plan (CIDP), a 5-year program (2017–2022). Based on the knowledge of the prevalence and location of land degradation in the county, there were multiple county-integrated flagships aimed at restoring land health while meeting the priorities of social and economic sectors. Further, the county government chose to cancel an earlier planned infrastructural effort that would have exposed relatively healthy land to degradation. Presenting readily accessible soil health maps initiated discussion on the fundamental importance of land restoration to achieving development outcomes and led to a commitment to bring land health management into integrated planning processes within the county.
Recent developments in the use of earth observation data to model and map SOC concentrations and stocks have resulted in the availability of spatial estimates with high accuracy and moderate to fine spatial resolution. Decision support tools increase the utility of spatial assessments of SOC, along with other indicators of soil and land health, by providing users with both interactive dashboards that allow them to map and interact with data and analytical tools for land health diagnostics and the targeting of interventions. Through the application of open-source platforms and tools, the use of evidence in land health management can also be effectively mainstreamed. In the context of the SHARED approach, this process is enhanced through structured stakeholder engagement, co-learning and co-design of tools. These approaches and tools have the potential to greatly enhance the uptake of management interventions to increase SOC and avoid or reverse land degradation, hence also contributing towards the achievement of LDN and SDG targets.
Maps were produced using a dataset, which is available in Harvard Dataverse (Vågen et al., 2013c). The SOC map of Kenya will be available on the ICRAF Landscape Portal to all registered users at http://landscapeportal.org; registration is free.
The supplement related to this article is available online at: https://doi.org/10.5194/soil-4-259-2018-supplement.
TGV led the development of the data analytics and dashboards, as well the predictive mapping of SOC. TGV also led the writing of the manuscript. LAW contributed to the conceptual framework of the paper, data analytics and writing and editing of the paper. CN led the SHARED facilitation workshops, co-designed the dashboards and contributed to the framing and writing of the manuscript. SC co-led the SHARED facilitation around the dashboards and the graphical design and contributed to the theoretical basis of SHARED. MB co-led the SHARED workshops and the concepts employed in SHARED and contributed to the writing of the manuscript.
The authors declare that they have no conflict of interest.
This article is part of the special issue “Regional perspectives and challenges of soil organic carbon management and monitoring – a special issue from the Global Symposium on Soil Organic Carbon 2017”. It is a result of the Global Symposium on Soil Organic Carbon, Rome, Italy, 21–23 March 2017.
This work was supported in part by the International Fund for Agricultural
Development (IFAD), grant numbers 2000000520, 2000000976, and 2000001302, US
Agency for International Development Resilience Program, UNICEF, as well as
the CGIAR Research Program on Forests, Trees and Agroforestry (FTA). We also
acknowledge partners from the Turkana County Government in
Kenya.
Edited by: Viridiana
Alcántara
Reviewed by: two anonymous referees
Aynekulu, E., Lohbeck, M., Nijbroek, R., Ordóñez, J., Turner, K., Vågen, T.-G., and Winowiecki, L. A.: Review of methodologies for land degradation neutrality baselines. Sub-national case studies from Costa Rica and Namibia, 58, available at: http://hdl.handle.net/10568/80563, 2017.
Batjes, N. and Batjes, N.: Soil carbon stocks and projected changes according to land use and management: a case study for Kenya, Soil Use Manage., 20, 350–356, https://doi.org/10.1079/SUM2004269, 2004.
Bernard, F. E.: Planning and Environmental Risk in Kenyan Drylands, Geogr. Rev., 75, 58, https://doi.org/10.2307/214578, 1985.
Breiman, L.: Random forests, Mach. Learn., 45, 35, https://doi.org/10.1023/A:1010933404324, 2001.
Caspari, T., van Lynden, G., and Bai, Z.: Land Degradation Neutrality: An Evaluation of Methods, ISRIC-World Soil Information, Wageningen, 2015.
Chang, W., Cheng, J., Allaire, J. J., Xie, Y., and McPherson, J.: shiny: Web Application Framework for R., available at: https://cran.r-project.org/package=shiny (last access: 20 August 2018), 2017.
Chesterman, S. and Neely, C.: Evidence into decision making for resilience planning in Turkana County: Stakeholder Approach for Risk Informed and Evidence Based Decision Making (SHARED), World Agroforestry Centre (ICRAF) Working Paper, 13 pp., 2015.
Dale, V. H. and Beyeler, S. C.: Challenges in the development and use of ecological indicators, Ecol. Indic., 1, 3–10, https://doi.org/10.1016/S1470-160X(01)00003-6, 2001.
Heink, U. and Kowarik, I.: What are indicators? On the definition of indicators in ecology and environmental planning, Ecol. Indic., 10, 584–593, https://doi.org/10.1016/j.ecolind.2009.09.009, 2010.
IUCN: Land Degradation Neutrality, Implications and opportunities for conservation, Nairobi, Kenya, 2015.
Liaw, A. and Wiener, M.: Classification and Regression by randomForest, R news, available at: ftp://131.252.97.79/Transfer/Treg/WFRE_Articles/Liaw_02_Classification and regression by randomForest.pdf (last access: 25 August 2018), 2002.
Lohbeck, M., Winowiecki, L., Aynekulu, E., Okia, C., and Vågen, T.-G.: Trait-based approaches for guiding the restoration of degraded agricultural landscapes in East Africa, edited by M. Isaac, J. Appl. Ecol., 55, 59–68, https://doi.org/10.1111/1365-2664.13017, 2018.
Minasny, B., Malone, B. P., McBratney, A. B., Angers, D. A., Arrouays, D., Chambers, A., Chaplot, V., Chen, Z.-S., Cheng, K., Das, B. S., Field, D. J., Gimona, A., Hedley, C. B., Hong, S. Y., Mandal, B., Marchant, B. P., Martin, M., McConkey, B. G., Mulder, V. L., O'Rourke, S., Richer-de-Forges, A. C., Odeh, I., Padarian, J., Paustian, K., Pan, G., Poggio, L., Savin, I., Stolbovoy, V., Stockmann, U., Sulaeman, Y., Tsui, C.-C., Vågen, T.-G., Wesemael, B., and van and Winowiecki, L.: Soil carbon 4 per mille, Geoderma, 292, 59–86, https://doi.org/10.1016/j.geoderma.2017.01.002, 2017.
Mogaka, H., Gichere, S., Davis, R., and Hirji, R.: Climate Variability and Water Resources Degradation in Kenya, The World Bank, 2005.
Munoz, P.: Land Degradation Neutrality (LDN) in Kenya, The Economic Case, UNCCD, Nairobi, Kenya, 2016.
Neely, C.: Transitioning towards Climate-Smart Agriculture in Kenya, Linking Research, Practice and Policy, FAO Brief, 6 pp., http://www.fao.org/3/a-i4259e.pdf (last access: 20 August 2018), 2014.
Niemeijer, D. and de Groot, R. S.: A conceptual framework for selecting environmental indicator sets, Ecol. Indic., 8, 14–25, https://doi.org/10.1016/j.ecolind.2006.11.012, 2008.
Oba, G., Stenseth, N. C., and Lusigi, W. J.: New perspectives on sustainable grazing management in arid zones of sub-Saharan Africa, BioScience, 50, 35–51, https://doi.org/10.1641/0006-3568(2000)050[0035:NPOSGM]2.3.CO;2, 2000.
R Core Team: R: A Language and Environment for Statistical Computing, R Foundation for Statistical Computing, Vienna, Austria, available at: https://www.r-project.org/, last access: 25 August 2018.
Saunders, M. J., Jones, M. B., and Kansiime, F.: Carbon and water cycles in tropical papyrus wetlands, Wetl. Ecol. Manag., 15, 489–498, https://doi.org/10.1007/s11273-007-9051-9, 2007.
Stavi, I. and Lal, R.: Achieving Zero Net Land Degradation: Challenges and opportunities, J. Arid Environ., 112(PA), 44–51, https://doi.org/10.1016/j.jaridenv.2014.01.016, 2015.
United Nations General Assembly: Transforming our world: The 2030 agenda for sustainable development, 1, 1–5, http://www.un.org/ga/search/view_doc.asp?symbol=A/RES/70/1&Lang=E Last (last access: 10 July 2018), 2015.
Vågen, T.-G., Davey, F., and Shepherd, K. D.: Land health surveillance: Mapping soil carbon in Kenyan rangelands, in: Agroforestry – the future of global land use, edited by: Nair, P. R. and Garrity, D., 455–462, Springer, 2012.
Vågen, T.-G., Winowiecki, L. A., Abegaz, A., and Hadgu, K. M.: Landsat-based approaches for mapping of land degradation prevalence and soil functional properties in Ethiopia, Remote Sens. Environ., 134, 266–275, https://doi.org/10.1016/j.rse.2013.03.006, 2013a.
Vågen, T.-G., Winowiecki, L. A., Tamene Desta, L., and Tondoh, J. E.: the Land Degradation Surveillance Framework (LDSF) – Field Guide, 14, available at: http://landscapeportal.org/blog/2015/03/25/the-land-degradation-surveillance-framework-ldsf/ (last access: 15 August 2018), 2013b.
Vågen, T.-G., Winowiecki, L. A., Tondoh, J. E., and Desta, L. T.: Africa Soil Information Service (AfSIS) – Soil Health Mapping, https://hdl.handle.net/1902.1/19793, Harvard Dataverse, V2, 2013c.
Vågen, T.-G., Winowiecki, L. A., Tondoh, J. E., Desta, L. T., and Gumbricht, T.: Mapping of soil properties and land degradation risk in Africa using MODIS reflectance, Geoderma, 263, 216–225, https://doi.org/10.1016/j.geoderma.2015.06.023, 2016.
Winowiecki, L., Vågen, T.-G., and Huising, J.: Effects of land cover on ecosystem services in Tanzania: A spatial assessment of soil organic carbon, Geoderma, 263, 274–283, https://doi.org/10.1016/j.geoderma.2015.03.010, 2016a.
Winowiecki, L., Vågen, T.-G., Massawe, B., Jelinski, N. A., Lyamchai, C., Sayula, G., and Msoka, E.: Landscape-scale variability of soil health indicators: effects of cultivation on soil organic carbon in the Usambara Mountains of Tanzania, Nutr. Cycl. Agroecosyst., 105, 263–274, https://doi.org/10.1007/s10705-015-9750-1, 2016b.
Zedler, J. B. and Kercher, S.: WETLAND RESOURCES: Status, Trends, Ecosystem Services, and Restorability, Annu. Rev. Env. Resour., 30, 39–74, https://doi.org/10.1146/annurev.energy.30.050504.144248, 2005.