the Creative Commons Attribution 4.0 License.
the Creative Commons Attribution 4.0 License.
 | 01 Oct 2025
Aeration and mineral composition of soil mediate microbial CUE
Jolanta Niedźwiecka
Petr Čapek
Ana Catalina Lara
Stanislav Jabinski
Travis B. Meador
Hana Šantrůčková
In ecosystem studies, microbial carbon use efficiency (CUE) is often used to estimate the proportion of organic substrate (glucose) consumed by microbial biomass that is not released from soil as CO2. While most studies assume aerobic conditions, with CO2 and microbial biomass as the predominant products of organic substrate processing, anoxic microniches are common inside soil aggregates. Microorganisms in these microniches perform fermentation and anaerobic respiration using alternative electron acceptors: processes connected with the release of extracellular intermediates. These extracellular intermediates and other compounds are not traditionally accounted for but may represent a significant C flux when compared to microbial biomass formation. Climate change may modulate soil microbial activity by altering soil aeration status on a local level. Therefore, CUE as an intrinsic parameter that is used in ecosystem studies and modelling should be defined for more realistic assumptions regarding soil aeration.
This study focused on the effect of oxygen and Fe availability on C mineralisation in forest soils and quantified C distribution between biomass and different extracellular metabolites. Forest soils from two Bohemian Forest (Czechia) sites, with low and high Fe content, were incubated under oxic and anoxic conditions. A solution of 13C-labelled glucose was used to track C incorporation into the biomass, respired CO2, and extracellular metabolites. We estimated CUE based on measured cumulative microbial respiration, residual glucose, biomass, and extracellular metabolites concentration. RNA-SIP was used to identify the active bacteria under each treatment.
Under oxic conditions, glucose was rapidly consumed and largely converted to CO2, with greater microbial biomass and CUE observed in the low-Fe soil compared to the high-Fe soil. In contrast, under anoxic conditions, glucose consumption was slower, leading to the accumulation of fermentation products, especially in the high-Fe soil, and higher carbon storage efficiency. Microbial growth and turnover were generally lower under anoxic conditions.
A large and diverse portion of the microbial community rapidly incorporated 13C-labelled glucose under oxic conditions, with over 300 active amplicon sequence variants (ASVs) identified – primarily from dominant phyla like Proteobacteria, Actinomycetota, and Bacteroidota. In contrast, anoxic conditions led to much slower and more limited labelling, with only a few ASVs (mainly Firmicutes) incorporating 13C.
Our findings confirm that anoxia in soils enhances short-term C preservation and suggest that excluding exudates in mass flux calculations would underestimate C retention in the soil, especially under anoxic conditions.
Please read the corrigendum first before continuing.
-
Notice on corrigendum
The requested paper has a corresponding corrigendum published. Please read the corrigendum first before downloading the article.
-
Article
(2678 KB)
- Corrigendum
-
Supplement
(11924 KB)
-
The requested paper has a corresponding corrigendum published. Please read the corrigendum first before downloading the article.
- Article
(2678 KB) - Full-text XML
- Corrigendum
-
Supplement
(11924 KB) - BibTeX
- EndNote


In soils, the efficiency of microbial transformation of plant litter to soil organic carbon (SOC) is one of the main controls of carbon (C) storage. Carbon use efficiency (CUE) is a significant factor that contributes to the potential for C storage in soils (Tao et al., 2023). CUE is especially helpful for describing changes in the C soil retention due to shifts in climate patterns and, consequently, in environmental conditions. CUE is also useful for predicting C transformations in terrestrial ecosystems, offering a glimpse into their functioning and, subsequently, the effect of ecosystem management strategies.
Traditionally, CUE is calculated as biomass production over organic C uptake (e.g. Manzoni et al., 2012; Sinsabaugh et al., 2013), applying various methods and assumptions that affect the estimates (Geyer et al., 2019). In this sense, gross CUE equals microbial growth efficiency and can be considered a physiological trait of microorganisms (del Giorgio and Cole, 1998). High CUE means C is stored in the soil as microbial biomass and, over time, can be stabilised as SOC. Low CUE means that a high proportion of organic C is released into the atmosphere as CO2 or CH4. In ecosystem studies, however, CUE is not considered a microbial trait but an intrinsic parameter that is used to estimate C flux and C storage in soil (rather mechanistic approach). In ecological modelling, it is employed as a parameter which distinguishes between different C transformations of interest. Considering from this perspective CUE that includes biomass formation and CO2 production as the only fate for C substrates entering the soil can bias the results, especially in anaerobic conditions or in the conditions of unbalanced microbial growth, where a significant quantity of extracellular metabolites (cell exudates) such as organic acids, alcohols, enzymes, and extracellular polymeric substances are released (Manzoni et al., 2012). On the one hand, these exudates can increase the soil's potential for C sequestration. On the other hand, they could accelerate the mineralisation of stabilised SOC. This may happen when the produced organic acids acidify the soil and SOC is desorbed from mineral particles or when extracellular enzymes increase depolymerisation of complex organic compounds in soil. Even under fully oxic conditions, a significant release of microbial exudates (sugars and amino acids) has been documented in addition to long-lasting necromass components such as muramic acid (Warren, 2022). In humid or dry climates, soils contain pockets where anoxic metabolism occurs (Ebrahimi and Or, 2015; Endress et al., 2024). Under anoxia, microbial exudates can be retained in the soil and, like necromass, become a component of stable soil organic matter (SOM). In oxic soils, the enzyme production rate is estimated to account for 1 % to 5 % of the microbial biomass (Allison et al., 2010; Allison, 2014). However, in anoxic soils and anoxic microniches of well-aerated soils, the production of extracellular organic compounds in “hot spots of activity” or aggregates (Borer et al., 2018) can be comparable in magnitude with the total microbial biomass (Picek et al., 2000; Šantrůčková et al., 2004). Thus, microbial biomass and exudate production should be considered in CUE calculations when CUE is used in ecosystem studies. Under some circumstances, neglecting microbial exudation could lead to underestimating the role of microbial organic matter transformation in increasing the C storage in soil over a certain period. In the following text, we will discuss the effect of aeration status on microbial biomass and exudate production and compare different approaches to estimate CUE. To avoid ambiguity, we employ the terminology proposed by Manzoni et al. (2018) and use the term apparent carbon use efficiency (CUEA) when only biomass production is included in the calculation (intrinsic physiological property) and CUE if microbial exudates (e.g. enzymes, fermentation products, polysaccharides) are also included (mechanistic approach). In addition, we define the carbon storage efficiency (CSE), which represents all microbial organic compounds derived from glucose that remain in the soil, and carbon stabilisation efficiency (TCSE), which measures only microbial organic compounds that are not extractable from soil and are, most likely, complexed in mineral-associated organic matter (see formal definitions below and in Table S1 in the Supplement). Both definitions above are influenced by substrate chemical composition, stoichiometry (Blagodatskaya et al., 2014; Manzoni et al., 2018), microbial functional diversity, and many climatic and edaphic drivers. Of those, the availability of electron acceptors and associated redox conditions play the most important role in controlling the gap between CUEA and CUE (and naturally, also CSE). Under aerobic and anaerobic respiration, CO2 is the main end-product of energy metabolism, microbial biomass is the main product of biosynthesis, and the difference between CUEA and CUE should be small. Although the biomass yield decreases with decreasing energy gain that varies with the availability of external electron acceptors other than O2 (), the difference between CUEA and CUE should not be large. However, the close relationship between biomass synthesis and energy gain fails under unbalanced environmental conditions, e.g. under nutrient deficiency or water stress. In such conditions, intermediates of energy metabolism, mainly low molecular weight organic acids, are released to the soil (futile cycles, over-flow metabolism) (Dijkstra et al., 2022; Basan et al., 2015). When external electron acceptors are depleted in anoxic conditions, and fermentation pathways prevail as energy metabolism, growth yields are much lower, and a significant portion of the carbon is secreted back into the soil in the form of low molecular organic compounds (Liu et al., 2007). Under anoxic conditions, fermentation will cause divergence of CUEA, CUE, and CSE estimates. Another reason for differences in C efficiencies measures is the production of extracellular, mostly high-molecular-weight compounds. For example, when lignocellulose and other complex compounds are degraded, many of the enzymes involved in the processes are released from the cell (exoenzymes) and can remain in the soil matrix (Gotsmy et al., 2021). Under desiccation stress, prokaryotes secrete extracellular polymeric substances (EPS; mostly polysaccharides and polypeptides) and amino acids to limit water loss (Kakumanu et al., 2019). However, these fluxes are also typically not accounted for when various microbial efficiency metrics are experimentally assessed, partly due to methodological challenges associated with the quantification of such fluxes.
One of the most abundant electron acceptors that play a key role in anoxic environments is Fe(III). Iron-reducing microorganisms (FRMs) are ubiquitous in soil and can be found in various taxa across the phylogenetic tree in both Bacteria and Archaea (Weber et al., 2006). In soils, FRMs gain access to iron oxide crystals via either direct contact, nanowires (Reguera et al., 2005), or through organic electron shuttles such as quinones (formerly termed collectively with other substances as “humic substances”; Bauer and Kappler, 2009; Newman and Kolter, 2000) and use them to oxidise organic compounds in anaerobic respiration. However, in addition to serving as a terminal electron acceptor in anaerobic respiration, Fe(III) can serve as a sink for excess reducing equivalents during fermentation (Lovley et al., 2004). Fermenters are particularly efficient in breaking down more labile organic C sources, such as sugars, amino acids, and fatty acids, compared to FRMs (Lovley, 2000). This again shows that extracellular products of anaerobic metabolism may significantly differ from aerobic metabolism and that careful determination of the C budget under both conditions is needed to calculate realistic CUE values.
As mentioned above, CUE reflects substrate quality and stoichiometry, microbial structural diversity, environmental factors, and a methodological approach (Geyer et al., 2019). For example, the mechanistic approach of measuring relevant soil and microbial variables at the same time interval following glucose addition, which is usually used, may introduce some bias because CUEA decreases over time due to the gradual transformation of the consumed substrate and its release as CO2 or extracellular compounds. This decrease depends on the physiological state or growth of the microbial population and, thus, on the environmental conditions during the experiment. This should be considered when conducting experiments in different environmental conditions and if we want to know not only CUEA (growth yield) but also the CUE, CSE, or TCSE. Measurements should be made at different time intervals, and microbial populations in similar growth stages should be compared.
To assess the effect of aeration status and the availability of iron as an alternative electron acceptor on CUEA, CUE, CSE, and TCSE, we employed a suite of chemical and stable isotope labelling methods to measure the soil properties and C efficiencies. Simultaneously, we identified the active members of the community using RNA stable isotope probing (RNA-SIP). RNA-SIP utilises the incorporation of a heavy stable isotope (13C) into the rRNA of active microorganisms to separate the labelled (i.e. heavier) RNA from the non-labelled one using buoyant density ultracentrifugation in a density gradient. Following fractionation, reverse-transcription, and DNA sequencing, the identity of the labelled microorganisms is confirmed by statistically comparing their abundance across the different fractions (Angel, 2019; Ghori et al., 2019). Combining C use efficiency measurements with RNA-SIP links the ecosystem function of microbial populations with the taxonomic identity of the active bacteria.
We studied two acidic forest soils with similar chemical and biochemical properties but differing Fe content. We hypothesised that (1) oxic CUEA will be much higher than anoxic, while the difference between oxic and anoxic CUE is low. (2) Under oxic conditions, C is used mostly for respiration and biomass production, while under anoxic conditions, the production of exudates, such as organic acids, is important, resulting in a divergence between CUEA and CUE. (3) Fe content affects the divergence between CUEA and CUE and C storage and stabilisation efficiencies. Low iron soils have a faster onset of fermentation. (4) Different microbial communities will be isotopically enriched under oxic and anoxic conditions. Iron content will also affect the community profile of the active microbes in anoxic soils.
To test these hypotheses, we incubated two soils with different Fe content under oxic and anoxic conditions and labelled them with 13C-glucose. Labelled glucose partitioned into gaseous products (), microbial biomass, exudates, and non-extractable organics were determined at different time intervals of incubation. RNA-SIP was employed to identify the microbes involved in carbon assimilation.
2.1 Site description and soil characteristics
Spruce forest soils were collected on two sites in the Bohemian Forest, southern Czechia. The soils at both sites are acidic (pH varies between 3 and 4) Cambisols and chemically similar, apart from iron oxide content (Kaňa et al., 2019) (Table S2). Soil from Plešné Lake (PL; N, E) catchment area contains ca. 35 mmol of oxalate-extractable Fe per kilogramme of dry soil and soil from Čertovo Lake (CT; N, E) catchment area ca. 240 mmol Fe kg−1. The uppermost forest floor layer (2–5 cm) was removed and organo-mineral soil (A, Oh + Ah) was sampled to a depth of 5 cm at four randomly chosen locations. Fresh soils were pooled, sieved (2 mm), and homogenised prior to storage at 4 °C for several days before the experiments.
2.2 Experimental setup
Two incubation setups of the same design were run in parallel: (i) A high-volume, low-level 13C-labelling incubation to measure C balance and C partitioning into different metabolites and (ii) a low-volume, high-level 13C-labelling incubation for identifying active bacteria and archaea using RNA-SIP. The moisture of both soils was adjusted to 50 % of the water-holding capacity to ensure the same hydration conditions. Fresh soil samples, weighing 32 or 3.9 g (see below) were transferred into 250 or 30 mL glass bottles, sealed with pre-boiled butyl rubber stoppers, and preincubated for 6 d at 20 °C in either oxic (lab air, always 16 bottles) or anoxic (N2, always 16 bottles) conditions. Anoxic conditions were established by flushing the headspace with N2 gas and the bottles were stored upside down, with caps immersed in water, to limit oxygen infiltration through the septa.
2.2.1 Soil incubations for C balance and chemical analyses
After 6 d of preincubations, all bottles were opened to add 8 mL of a 13C-labelled-glucose solution to a final glucose concentration of approximately 100 µg C g−1 of dry weight and AT% 13C of 3 %. The glucose solution was prepared by mixing 99 AT% glucose (uniformly labelled, Sigma-Aldrich) with a natural 13C abundance glucose (Sigma-Aldrich). The spike amendment increased the moisture in both soils to 64 %–67 % in PL and 57 %–58 % in CT. Anoxic bottles were handled inside an anoxic vinyl chamber (COY) filled with 98 % N2 and 2 % H2, and the isotope solution was degassed using a gassing manifold before adding it to the experimental bottles. Soils were incubated at 20 °C for 72 h under oxic conditions for measurable microbial growth and glucose transformation. Under anoxic conditions, the soil was incubated for 216 h because of slow anaerobic metabolism and long lag phase. Oxygen was monitored throughout incubation. In the oxic bottles, O2 only slightly decreased during the incubation, and in the anoxic bottles, no O2 was detected. The headspace gas (CO2 and CH4) and C isotopes were measured at 0, 24, 48, and 72 h (oxic) or 216 h (anoxic) of incubation, and then soils were sampled destructively (always four replicates) for biochemical and chemical analyses. Soils for total C analyses were freeze-dried immediately after sampling. Unamended controls were set up and incubated like experimental samples, except that water was added to adjust moisture instead of glucose solution. The headspace gas in the controls without glucose addition was measured in the same period as the glucose-amended samples. However, destructive analyses were performed only at the beginning and end of incubation (0 and 72 or 216 h; Table S3).
2.2.2 Soil incubations for RNA-SIP
On a smaller scale (30 mL bottles), separate soil incubations were performed with the same concentration of 99 % uniformly 13C-labelled glucose for RNA-SIP analysis. A high glucose label was required for effective 13C incorporation into nucleic acids, a prerequisite for SIP. The incubations were set up in the same way as the high-volume incubations described above. Most importantly, the soil-to-headspace volume ratio was identical in both incubation setups and CO2 and CH4 production was monitored throughout the experiment to ensure comparable experimental conditions. Oxic and anoxic samples were collected periodically at the same time intervals described above and immediately frozen on dry ice until further processing.
2.3 Chemical and biochemical analyses
2.3.1 Headspace gases
Concentrations of CO2 and O2 were measured using an HP 6850 gas chromatograph (Agilent) equipped with a 0.53 mm×15 m HP-Plot Q column, a 0.53 mm×15 m HP-Plot Molecular Sieve 5A column, and a thermal conductivity detector, with He as the carrier gas. The detection limit of CO2 and O2 was 300 and 1000 ppmv respectively. CH4 was measured using an HP 6890 gas chromatograph (Agilent) equipped with a 0.53 mm×30 m GS-Alumina column and a flame ionisation detector, with N2 as the carrier gas (detection limit, 10 ppmv). Peaks were integrated using Agilent Chemstation A.08.03 software (Agilent). The 13C-CO2 fraction of the headspace was measured by injecting 250 µL of headspace sample to the gas preparation and introduction system Delta/MAT 252 Gasbench II (Thermo Finnigan) connected to DeltaplusXL IRMS (Thermo Finnigan), with He as a carrier gas. The precision for measurements was <0.2 ‰ for peaks >3000 mV.
2.3.2 Total C, N, and 13C in various pools
Unless mentioned otherwise, all concentrations of soil chemical parameters are expressed per gram of dried soil. Bulk soil N (Ntot), C (Ctot), and its isotopic signal () were determined in freeze-dried grounded soil samples. Water extractable N (TN), nitrates (), C (WEC), and δ13C were determined after a 1 h extraction with distilled water (1:10, ) on a shaker followed by filtration (glass-fibre filter, 0.45 µm). Carbon and δ13C in microbial biomass carbon (CMB) were estimated by the chloroform-fumigation extraction method (Vance et al., 1987) modified for 13C analysis (Bruulsema and Duxbury, 1996). Briefly, non-fumigated or fumigated (CHCl3, 24 h) soil was extracted with 0.05 M K2SO4 (1:4, ), and the extract was centrifuged and filtered through a glass filter (0.45 µm). The extracts in potassium sulfate (fumigated and non-fumigated) and in water (WEC) were freeze-dried for a final dry C weight of approximately 30 µg, resuspended in distilled–deionised water (ddH2O), quantitatively transferred 600 µL into tin cups (10 mm×10 mm, Sercon), and dried overnight in the oven at (40 °C). CMB was calculated as the difference between C in the fumigated and non-fumigated soil extracts, assuming the relative extractability of microbial cells killed by fumigation (KEC) to be 0.38 (Vance et al., 1987). The δ13C of CMB was calculated by a two-component mixing model (Šantrůčková et al., 2000). Total dissolved N and organic C dissolved in K2SO4 or water were analysed on a TOC/TN analyser (LiquicTOC II, Elementar, Germany). Freeze-dried bulk soil and extracts were analysed via flash combustion at 1020 °C on a SmartEA Isolink with a continuous flow interface to a Conflo IV device and MAT253 Plus IRMS (Thermo-Fisher Scientific). Values of δ13C were determined against an international reference (IAEA-600 and -603) and house standards and are expressed in 13C atom per cent. The precision of the δ13C measurements for natural abundance samples was 0.06 ‰. All analyses were performed in four replicates, unless stated otherwise. Bulk N (Ntot) was measured in the same samples as in C and 13C analyses using an EA Isolink. Water extractable was measured spectrophotometrically with a flow injection analyser (FIAstar 5012, Foss Tecator, Sweden). Glucose concentration remaining in the soil was monitored at each sampling point in four replicates, as described previously (Šantrůčková et al., 2004; Picek et al., 2000). Glucose was extracted from 10 g of soil sample using 15 mL of 0.1 % () benzoic acid. The soil solution was shaken on an end-over-end shaker at 150 rev min−1 for 15 min and centrifuged at 7000×g for another 15 min. Proteins were precipitated with a final concentration of 10 % () trichloroacetic acid (Koontz, 2014). Glucose concentration was measured enzymatically using the BIOLATEST assay GLU 500 (Erba Lachema) and expressed per C1 molar basis (Cgluc).
2.3.3 Bioavailable Fe(II) and Fe(III)
Bioavailable Fe(II) (Feavail) concentrations were measured using the Ferrozine assay (Lovley and Phillips, 1987). Briefly, 1 g of fresh soil was submerged in 5 mL of 0.5 N HCl for 10 min. Then, the acid extract was added to a Ferrozine solution, and Fe(II)-Ferrozine complex was measured spectrophotometrically at 562 nm. Fe(III) in the acid extract was reduced to Fe(II) using hydroxylamine-HCl, and the total Fe(II) was measured as described above. The difference between the total Fe and Fe(II) was equal to bioavailable (microbially reducible) Fe(III) in the acid extract. Reported Fe(II) values are likely underestimated, as soil aliquots came into contact with oxygen after sampling but before acidification and Ferrozine assay. For this reason, Fe(II) values are discussed comparatively rather than as absolute values.
2.3.4 Organic acids in pore water
Sample porewater was analysed to measure low molecular weight organic acids (OA) production via fermentation. The porewater was separated from moist soil by centrifugation. For CT soil, 8 g of moist soil was centrifuged at 8000×g for 10 min. For PL soil, 14 g was centrifuged at 10 400×g for 10 min. Centrifuged liquids were analysed by ion chromatography (Integrion, Thermo Fisher) with a conductivity detector. Organic acids were separated using IonPac AG11-HC-4 and IonPac AS11-HC-4 columns (Thermo Fisher). The eluent was analytical EGC KOH with a multistep gradient ranging from 1 to 85 mM and run at 0.38 mL min−1. Samples were placed in a cooled (5 °C) AS-AP autosampler (Thermo Fisher). Samples of 15 µL with 20 µL cut volumes were injected using low draw speed. Samples were run across certified standards (Sigma-Aldrich).
2.4 Identification of labelled bacteria using RNA stable-isotope probing
2.4.1 Nucleic acid extraction, RNA purification
RNA was extracted from each sample from the small-scale incubation, as described before (Angel et al., 2012). Briefly, total nucleic acids (TNA) were extracted by disrupting 0.2 g of soil from each sample in a lysing matrix E tube (MP Biomedicals) in a chilled environment (dry ice), in the presence of phosphate buffer, 10 % SDS solution, phenol, and 0.1 M AlNH4(SO4)2×12H2O (Alfa Aesar) using a FastPrep–24™ 5G sample homogeniser and CoolPrep™ adapter (MP Biomedicals). The process was repeated 3 times for each sample, using the same lysing matrix tubes, collecting the supernatant after each time, and using fresh buffers and phenol. TNA was then purified using phenol/chloroform/isoamyl alcohol and chloroform/isoamyl alcohol purification (Carl Roth). TNA was precipitated using 30 % polyethylene glycol and 2 µL of glycogen (Life Technologies), washed once with ice-cold 75 % EtOH and resuspended in low TE buffer in Non-Stick RNase-free Microfuge Tubes (Life Technologies). Lastly, TNA was further purified using the OneStep PCR inhibitor removal kit (Zymo Research). For DNA removal, 90 µL of TNA was digested with TURBO DNase (Life Technologies) and later purified using a GeneJET RNA cleanup and concentration micro kit (Thermo Fisher Scientific). Complete DNA removal was verified by failure to obtain a PCR amplification product using the purified RNA template; the PCR conditions are described below. The purified RNA was quantified using a Quant-iT RiboGreen RNA Assay Kit (Thermo Fisher Scientific). The full protocol is available online (Angel et al., 2021).
2.4.2 RNA-stable isotope probing
RNA (ca. 250 ng) was subjected to isopycnic gradient centrifugation in a solution of caesium trifluoroacetate (CsTFA, GE Healthcare), HiDi formamide (Thermo Fisher Scientific), and buffer (0.1 mol Tris-HCl at pH 8.0, 0.1 mol KCl, and 1 mM EDTA). Gradients were prepared in Ultracrimp 6 mL tubes (Thermo Scientific) and centrifuged at 130 000×g using a TV-1665 Sorval Rotor (Thermo Scientific) for ≥65 h. Fractionation was done by piercing the tube close to the top and bottom and injecting RNAse-free water (Carl Roth) into the top using an automatic syringe pump (NE-300; New Era Pump System Inc.) Fractions were collected every 20 s (300 µL each). The density of each fraction was measured using a refractometer (AR200 Automatic Digital Refractometer; Reichert). Fifteen (fractions out of 20, with densities ranging between 1.766–1.842 g mL−1, were used for downstream analysis. The RNA from the fractions was precipitated in the presence of 2 µL GlycoBlue (Fisher Scientific), Na-acetate (3 mol), and EtOH (absolute). RNA pellets were dissolved in 10 µL of RNA-Storage solution (Fisher Scientific). Complementary DNA was synthesised using Super Script IV reverse transcriptase (Thermo Fisher Scientific) and 0.5 µg µL−1 of random hexamer primers, as described by the manufacturer. The full protocol is available online (Angel et al., 2023).
2.4.3 Amplicon sequencing
Amplicon sequencing was done using a two-step barcoding approach (Naqib et al., 2018). cDNA from each fraction was amplified using the universal bacterial and archaeal primers 515F-mod-CS1 (aca ctg acg aca tgg ttc tac aGT GYC AGC MGC CGC GGT AA), and 806-mod-CS2 (tac ggt agc aga gac ttg gtc tGG ACT ACN VGG GTW TCT AAT; Walters et al., 2016) in a T100 Thermal Cycler (Biorad) with a number of amplification cycles ranging from 26 to 30, depending on the amount of template. The full protocol is available online (Angel and Petrova, 2021). In addition, negative control in the form of two fractions from a gradient loaded with the product of a blank RNA extraction (reagents only) was sequenced, and five non-template controls (NTC) PCR reactions were amplified with 28–32 cycles. A mock community (ZymoBIOMICS Microbial Community DNA Standard II; Zymo Research) was also amplified and sequenced. Library construction and sequencing were performed at the University of Illinois, Chicago DNA Services Facility, using an Illumina MiniSeq sequencer (Illumina) in the 2×150 cycle configuration (V2 reagent kit).
2.4.4 Sequence data processing and detection of labelled ASVs
Primer regions were trimmed off the amplicon sequence data using cutadapt (V2.3, Martin, 2011). All downstream analyses were done in R (V4.0.3 R Core Team, 2020). Quality-trimming and clustering into amplicon sequence variants (ASVs) were done using the DADA2 pipeline (Callahan et al., 2016) with the following quality filtering options: no truncate, maxN=0, , and truncQ=2. Chimaera sequences were removed with removeBimeraDenovo() using the “consensus” method and “allowOneOff”. Taxonomic classification of the ASVs was done using assignTaxonomy() against the SILVA database (Ref NR 99; V138.1; Quast et al., 2013). Potential contaminant ASVs were removed using decontam (Davis et al., 2018), employing the default options. Unclassified taxa or those classified as either “Eukaryota”, “Chloroplast”, or “Mitochondria”, and ASVs with a prevalence of <10 % of the samples, were removed. The remaining sequences were aligned using SINA (Pruesse et al., 2012) against the SILVA database, and a maximum-likelihood tree was calculated using IQ-TREE (Minh et al., 2020) with an automatic model selection and using the “fast” option. Beta diversity was calculated with a constrained analysis of principal coordinates (CAP; Anderson and Willis, 2003) from a Morisita–Horn distance matrix of the samples (gradient fractions). Labelled ASVs were detected using differential abundance modelling, as described by Angel et al. (2018). Briefly, for each gradient, the abundance of each ASV in fractions >1.795 g mL−1 (a.k.a. “heavy” fractions) was compared to that found in fractions <1.795 g mL−1 (a.k.a. “light” fractions) using package DESeq2 (Love et al., 2014). The Wald hypothesis test and local fit were used, followed by an adaptive shrinkage estimator of the log-fold changes (package “ashr”). Those ASVs with a statistically significant differential abundance with a p value of <0.05 and a log 2-fold change of 0.26 (ca. 20 % average difference in abundance) were considered labelled. Nearest taxon index (NTI) values were calculated on phylogenetic trees comprising only the ASVs indicated as labelled by DESeq2 from the “heavy” fractions of the labelled (non-control) gradients. NTI was calculated as described in Webb et al. (2002) using the function ses.mntd() in the R package picante (Kembel et al., 2010).
2.4.5 Isotopic tracer calculations and statistical modelling
A full list of expressions and formulas used for the following calculations can be found in Table S1. Briefly, isotopic fractions of the different C pools (CMB, WEC, CO2) were calculated by multiplying the at% 13C by the concentration of the C pool. The quantity of C derived from glucose in the measured pools was calculated by multiplying the C pool concentration by the tracer fraction (F; molar ratio of the tracer C to total C in the glucose). The quantity of glucose-derived WEC in the total WEC (i.e. after correction for Cgluc that remained untransformed in the soil, measured enzymatically) was considered microbial extractable exudates (Cexud). The glucose consumption over time was modelled using a linear model on log-transformed data (to linearise the decrease in Cgluc over time). The effect of the treatment on the microbial biomass, irrespective of time, was modelled using generalised mixed-effect models, with time as a random variable. The function glmer() in the R package lme4 (V1.1-30; Bates et al., 2015) was used with gamma distribution and the log link function. The turnover rates (i.e. decay) of glucose-derived CMB (CMB-gluc) were calculated as the linear regression slope between time and the natural logarithm of CMB-gluc. The standard deviation was estimated by shuffling the replicates and refitting over 999 trials. The accumulation of CO2 against time was modelled using linear regression after inverting both variables (i.e. Lineweaver–Burk plot). Carbon use, storage, and stabilisation efficiencies were calculated after 24, 48, 72, and 216 h for oxic and anoxic treatment. Apparent carbon use efficiency (CUEA) assumes the production of microbial biomass only:
Carbon use efficiency (CUE) assumes microbial biomass growth and exudation of water-extractable compounds (Cexud):
Exudates are defined as all organic compounds originating from glucose that are free in soil. Their chemical identity is unknown and, therefore, they are all included in the equation's nominator. Certain fractions could comprise fermentation products, i.e. products of catabolic metabolism, and the rest consist of organic compounds of some microbial anabolic pathways. The ratio between the two then affects the degree of consistency between original CUE definition and our results.
The CUEA and CUE after 24 and 38 h of incubation, when the concentration of residual glucose under anoxic conditions was still high, were calculated according to Geyer et al. (2019) (Table S1).
Carbon storage efficiency (CSE) characterises biotic and abiotic C accumulation (biomass and both water-extractable and non-extractable transformed C compounds). CSE was calculated from CO2 derived from glucose (CO2-gluc) and glucose uptake, and it represents all the organic microbial compounds derived from glucose that remain in the soil, in either extractable or non-extractable form (i.e. note that CMB-gluc is considered an extractable form):
Carbon stabilisation efficiency (TCSE) represents the microbial organic compounds that are not extractable from soil and are, most likely, complexed in mineral-associated organic matter, so the proportion of C from glucose that was not converted to CO2 and could not be extracted as CMB or Cexud:
To model WEC emerging from the labelled glucose, the remaining (mean) glucose concentration in soil (enzymatically measured) was first subtracted from WEC. In the statistical model, each observation is weighted by the inverse of the root square of standard deviation, calculated as:
3.1 Soil characteristics
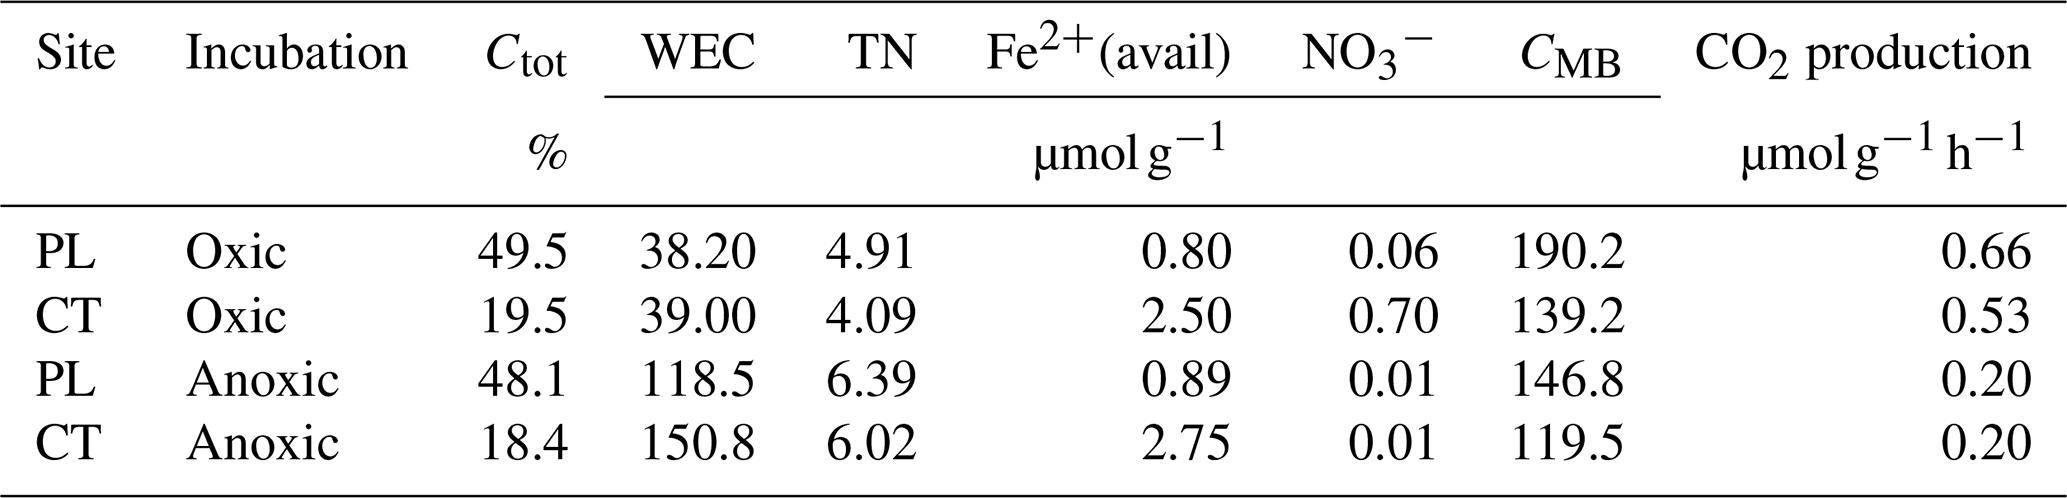
At the beginning of the oxic incubation, i.e. after preincubation, the PL soil samples exhibited higher Ctot, CMB, and respiration rates but similar WEC and TN content compared to the CT soils (Tables 1 and S3). As expected, the CT samples differed from PL in higher bioavailable iron (Feavail) and content. The brief anoxic preincubation period removed most of the , decreased CMB and respiration, and increased WEC and TN but left Feavail effectively unchanged. Both soils showed typical δ13C values around −26 ‰ (Table S2). The addition of 13C in glucose (2.5–2.9 µmol g−1 dw) was 3 orders of magnitude lower than total soil 13C (411 and 155 µmol per gram dry soil for PL and CT soils respectively).
Table 1Soil characteristics after preincubation, before glucose addition.
3.2 Glucose consumption and consequent changes in bulk C pools
The oxic and anoxic conditions were maintained throughout the incubations. Oxygen levels in the headspace remained above 14 % in the oxic incubations and were below the detection limit (1000 ppmv) in the anoxic incubations (Fig. S1 in the Supplement). Methane did not accumulate in the incubations and remained at atmospheric levels (data not shown).
Under oxic conditions, glucose consumption was fast. It was removed to below detection limits within 24 h of the PL and within 48 h in the CT soils (Fig. 1a). In contrast, a significant quantity of glucose was still present after 48 and 216 h under anoxic conditions. Under anoxia, only 56 % (PL) and 70 % (CT) of added glucose were microbially transformed, mainly into water-extractable products of anaerobic metabolism, which corresponded to an increased concentration of organic acids in pore water (see below). In both cases, glucose consumption was non-linear, with no effect of the soil type on the consumption rate (P=0.1). However, not all the C added as glucose was recovered as newly produced CO2, WEC, CMB, or Cgluc (Fig. 1a). Carbon recovered in these pools ranged between 41.5 %–47.5 % and 73.1 %–82.6 % for oxic CT and PL soils respectively and 53.3 %–99.8 % and 59.4 %–99.4 % for anoxic CT and PL soils respectively.
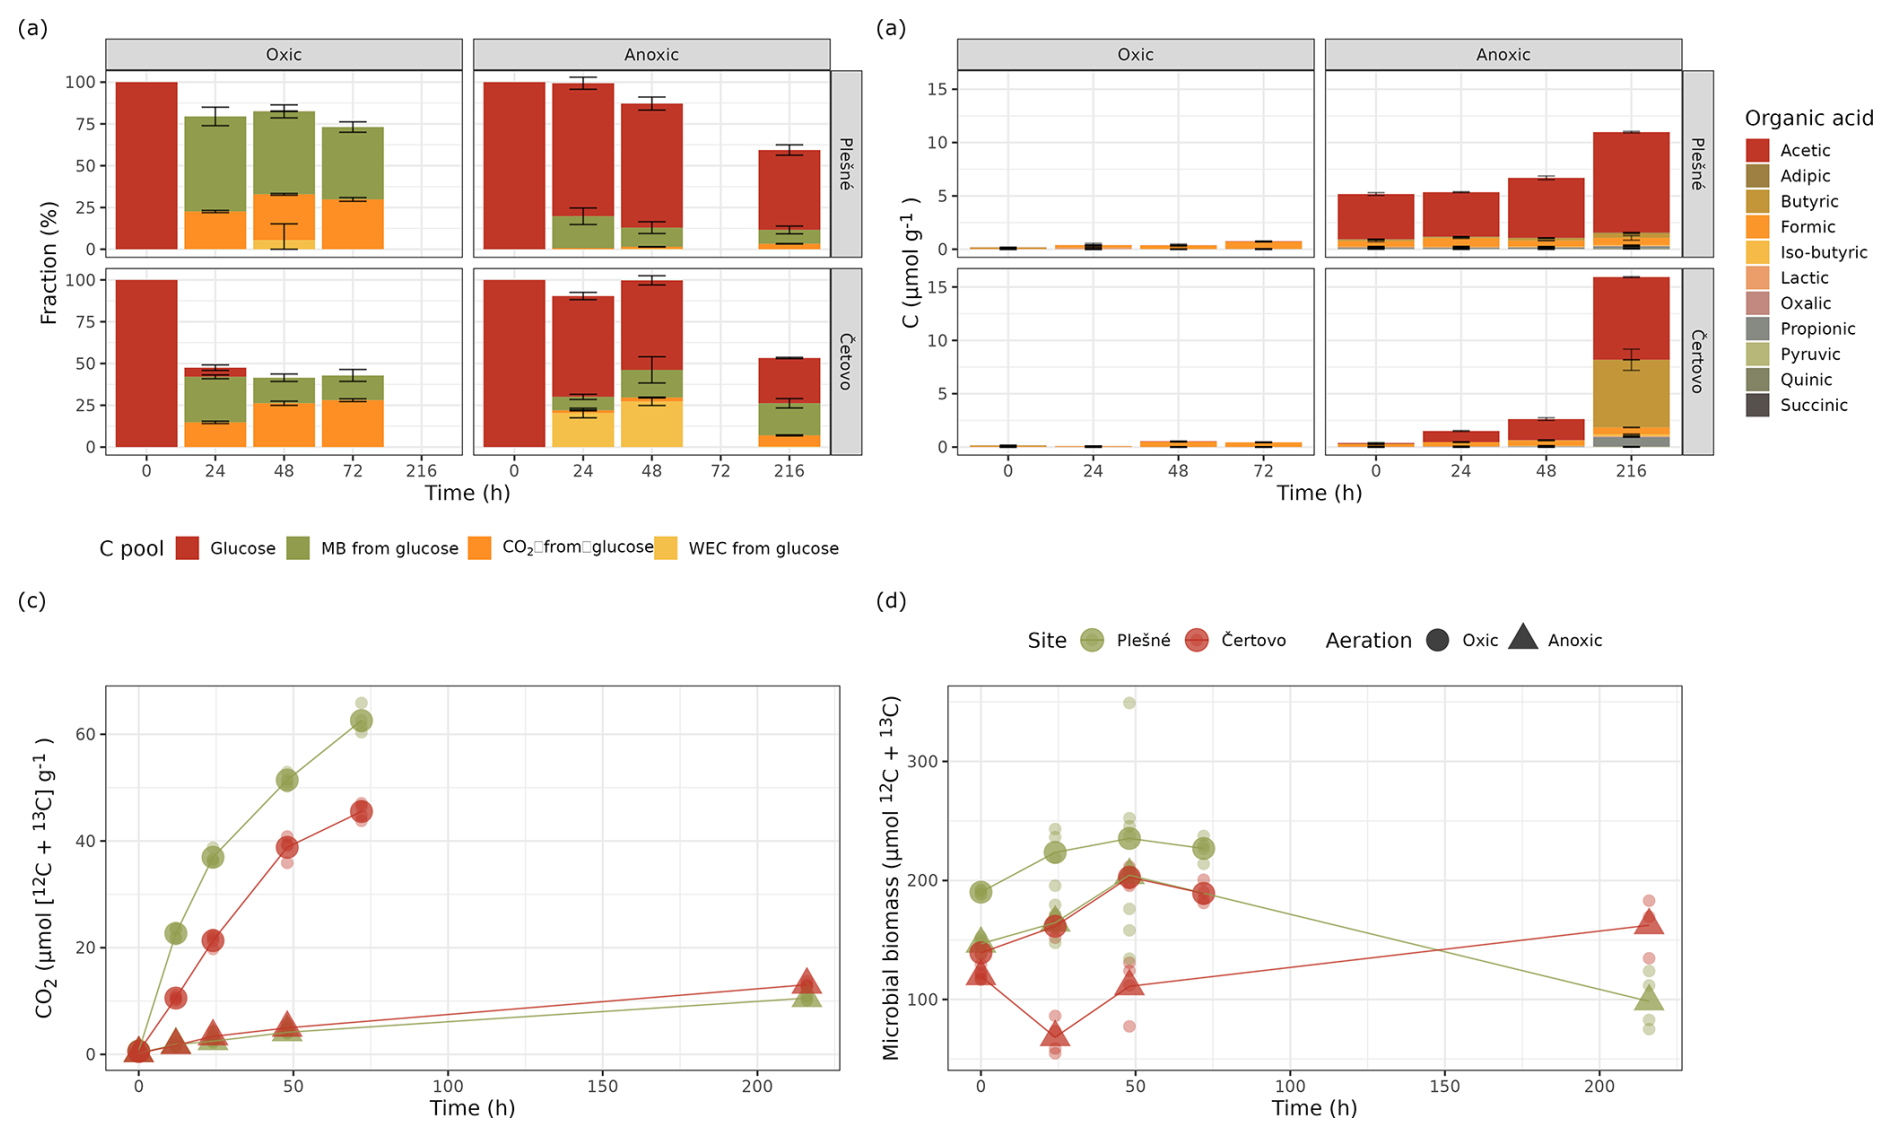
Figure 1(a) Glucose partitioning into measured C pools in the PL and CT soils under oxic and anoxic conditions during the incubation (means ± propagated errors SEM (see Sect. 2); n=4). CMB refers to microbial biomass measured using chloroform fumigation, and WEC refers to water-extractable carbon. Time 0 glucose values represent the quantity added and have not been measured in the soil. (b) OA accumulated during the incubation, expressed in µmol OA C g−1 (means ± SEM; n=2). (c) Total CO2 accumulation in the headspace (means ± SEM; n=4) and (d) total microbial biomass (means ± SEM; n=4).
The total CO2 (from SOC and glucose) accumulated over time was highest under oxic conditions. In PL, CO2 accumulated up to 66 µmol C-CO2 g−1, while CT samples produced significantly less (up to 45 µmol C-CO2 g−1; P=0.04), but both soils produced only 13 µmol C-CO2 g−1 under anoxic conditions, with no difference between the sites (Fig. 1c). Similarly, the 13CO2 fraction increased with time (Fig. 1a). However, in contrast to the trends in total CO2, the 13CO2 fraction was similar between the two soils and accounted for approx. 29 % of the added labelled glucose C at the end of the incubation, under oxic conditions, with no statistical significance between the sites (Fig. 1a). Unsurprisingly, under anoxic conditions, 13CO2 reached only 2.5 % and 2.9 % of the added glucose C in CT and PL soils respectively.
Regarding alternative terminal electron acceptors, was low in both soils (Table 2). Under anoxic conditions, it was close to the detection limit and did not change throughout the incubation, while under oxic conditions, a depletion was observed over time in both soils. In contrast, Fe(II) values remained stable under oxic conditions but increased under anoxic conditions. This was especially pronounced in the Fe-rich CT soil, where Fe(II) concentration increased nearly 5-fold, indicating vigorous activity of iron-reducing microorganisms. Other potential electron acceptors such as had deficient concentrations and likely played an insignificant role.
Table 2Concentrations of potential terminal electron acceptors throughout the incubations.
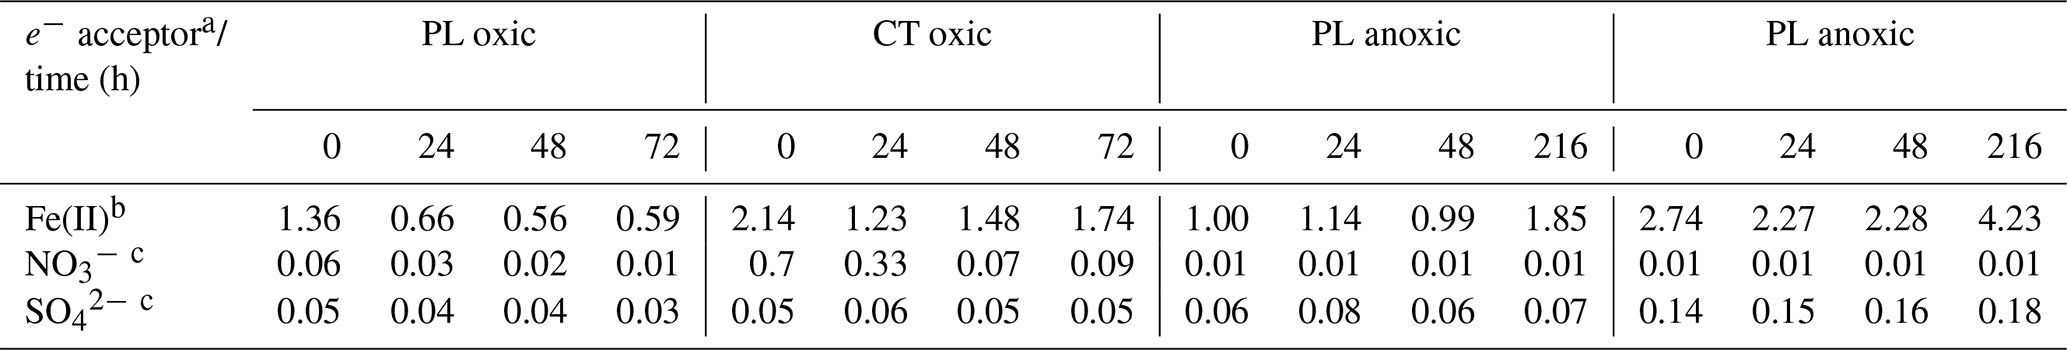
a Mean concentrations (µmol g−1), n=2. b Measured using acid extraction from soil sample. c Measured in pore water.
Indeed, much of the consumed carbon was fermented and released into the soil under anoxic conditions. This can be seen by the accumulation of 13C in the form of water-extractable carbon (Fig. 1a) and the accumulation of OA in pore water, primarily acetate (Fig. 1b; Table S4). Both WEC and OA were 1 to 2 orders of magnitude higher under anoxic than oxic conditions (Fig. 1a and b). Production of total OA in pore water increased up to 11 and 17 µmol C g−1 over 216 h for PL and CT soils respectively. Acetate accounted for 46 %–88 % of all OA, with the remaining mainly consisting of butyrate, propionate, and formate. Consistent with the low partitioning of glucose C into WEC under oxic conditions (Fig. 1a), the production of OA was also low, amounting to only 0.58 µmol OA C g−1 in PL and 0.28 µmol OA C g−1 in the CT pore water, with formate being the most dominant acid (Fig. 1b). Under oxic conditions, WEC produced from glucose was higher in PL soil than in CT soil. However, under anoxic conditions, it was vice versa, as suggested by a significant interaction of aeration status and soil identity (P<0.001).
3.3 Changes in microbial biomass in response to glucose amendments
With glucose amendment, the total microbial biomass (CMB+CMB-gluc) increased under oxic conditions by 20 % and 36 % on average respectively in PL and CT and was consistently greater in PL compared to CT (Fig. 1d; P=0.02). CMB was consistently less under anoxic conditions than in oxic conditions (P<0.01). Microbial biomass derived from glucose (CMB-gluc) increased rapidly during the first 24 h in both soils under oxic conditions, but then microbial growth ceased and CMB-gluc slowly decreased. Similar results were seen in the PL soil under anoxic conditions, although the initial increase in biomass was significantly less (P<0.01), and microbial growth ceased even though the added glucose had not yet been consumed. In the anoxic CT soil, biomass increased slowly until the end of the experiment and reached a higher value (19.2 µmol C g−1) than the maximum in the anoxic PL soil (11.5 µmol C g−1). Surprisingly, only PL exhibited significantly greater newly synthesised biomass under oxic conditions (Fig. 1a; P<0.01 for the interaction) compared to anoxic conditions.
3.4 Microbial carbon use efficiency and turnover rate
Microbial CUEA and CUE were estimated after 24 and 48 h and at the end of incubations (72 or 216 h). However, the calculations after 24 and 48 h were burdened with a large error for the samples under anoxic conditions due to the high concentration of residual glucose in the soil. The results should be evaluated with caution, and they are provided in the Supplement only (Fig. S2). CUEA, which acknowledges biomass production, was higher in the oxic PL soil than in the oxic CT soil and anoxic PL and CT soils (Table 3). In the anoxic PL soil, CUEA was higher after 24 h but lower at the end of incubations compared to the anoxic CT soil. CUEA in the anoxic CT soil exceeded that of oxic CT soil. CUE, which assumes biomass production and extracellular compounds release, was consistently higher under anoxic conditions as compared to oxic conditions (P<0.001). CUE and CUEA were similar in oxic conditions in both soils, but CUE was significantly higher than CUEA in anoxic conditions. CUE was higher in PL than in the CT soil. Carbon storage efficiency, CSE (total proportion of transformed Cgluc in the soil at the end of incubation), was much higher under anoxic than oxic conditions (P<0.001). Carbon stabilisation efficiency, TCSE (proportion of transformed Cgluc in a non-extractable pool of SOC), was higher in Fe-rich CT soil under both oxic and anoxic conditions. In the oxic conditions, TCSE increased during incubation from 0.21 to 0.27 in the PL soil and from 0.48 to 0.53 in the CT soil. The TCSE was significantly higher than that of anoxic soils in both cases. Regarding microbial turnover, CMB-gluc in the CT oxic soils exhibited twice as much turnover as CMB-gluc in the oxic PL soil. Under anoxic conditions, biomass turnover was very low in the PL soil; however, it cannot be calculated in the CT soil as microbial biomass was still growing after 216 h at the end of incubation.
Table 3Mean values of carbon use efficiencies (CUEA excluding exudates and CUE including exudates), soil carbon storage (CSE), and stabilisation (and TCSE) efficiencies, derived from glucose, with confidence intervals in the parentheses at the end of incubation, and mean microbial turnover of newly formed biomass (± standard deviation). Different letters above numbers denote significant differences for values in each column.
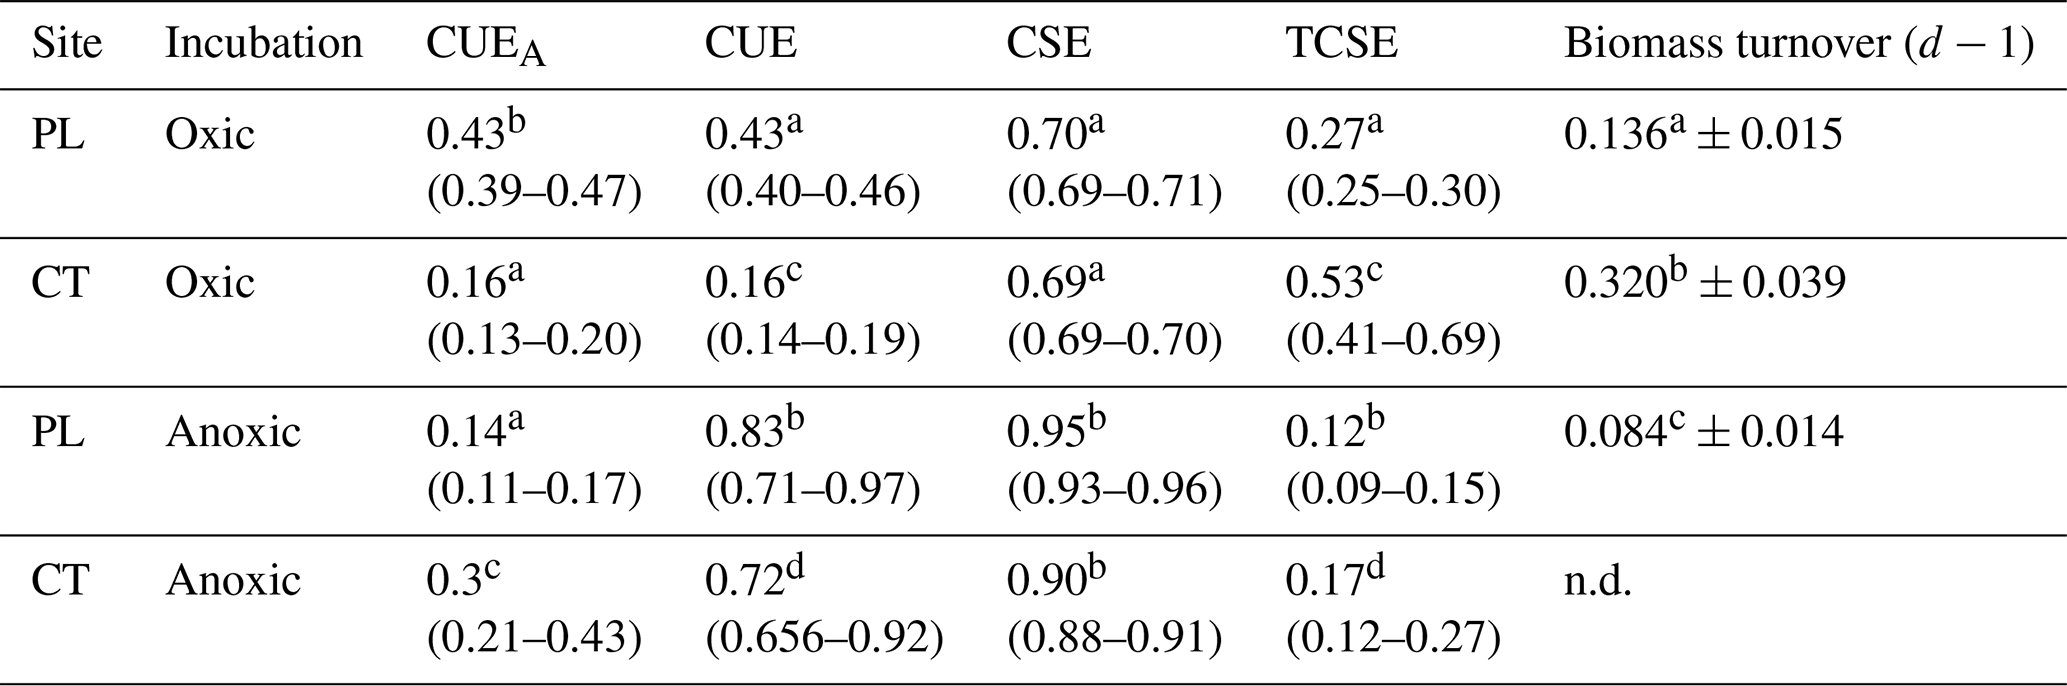
n.d. Not determined.
3.5 Incorporation of 13C into nucleic acids
Sequencing produced 17 million reads with 49 ± 22 K per sample. Quality filtering, merging and chimera filtering removed 20 % of the reads (22 % ± 9 % per sample; Table S5). In addition, 60 ASVs were flagged as potential contaminants and were removed. Taxonomy-based filtering steps removed an additional 274 OTUs (0.156 % of the sequences) classified as chloroplast and mitochondria or did not classify at the kingdom level. Taxonomic orders whose ASVs had a cumulative prevalence of <5 % (30 samples) were also removed (100 ASVs, 0.046 % of the reads), leaving 14 974 taxonomically assigned ASVs (Table S6). Lastly, since RNA-SIP assumes that all ASVs should be present in all fractions of an individual gradient, rare reads appearing in <10 % were removed (10 406 ASVs, 2.37 % of the reads). Beta diversity analysis showed a significant deviation of the community in the heavy fractions from the light fractions of the density gradients under oxic conditions, indicating the labelling of a sizable fraction of the microbial community. Some separation was also observed in the samples incubated under anoxic conditions, though to a much lesser extent, indicating that only a minority of the community was labelled. As expected, no significant deviation was seen for the unlabelled (control) samples (Fig. S3).
Differential abundance modelling using DESeq2 identified, in total, 330 unique ASVs as significantly more abundant in the “heavy” fractions compared to the “light” fraction (Fig. 2; see also Table S7 and Figs. S4–S7). Only a small minority of those (21 in the oxic and 0 in the anoxic incubations) were detected in the unlabelled gradients and are regarded as false positives. As expected, most of the labelled ASVs were found in the oxic incubations, with 192 and 149 unique ASVs labelled across all samples from CT and PL sites respectively, making up 28 % and 32 % of all the reads in these samples (138 ASVs were mutual). Most of these OTUs belonged to the dominant phyla: Proteobacteria, Actinomycetota (Actinobacteria), Acidobacteriota, Verrucomicrobiota, and Bacteroidota. Other prevalent phyla were Planctomycetota, Crenarchaeota, Candidate Phylum RCP2-54, Candidatus Palusbacterota (WPS-2), and Myxococcota. Under anoxic conditions, only 48 and 38 ASVs from CT and PL sites were labelled, making up only 4 % and 6 % of the reads in these samples respectively. These ASVs mainly belonged to Firmicutes.
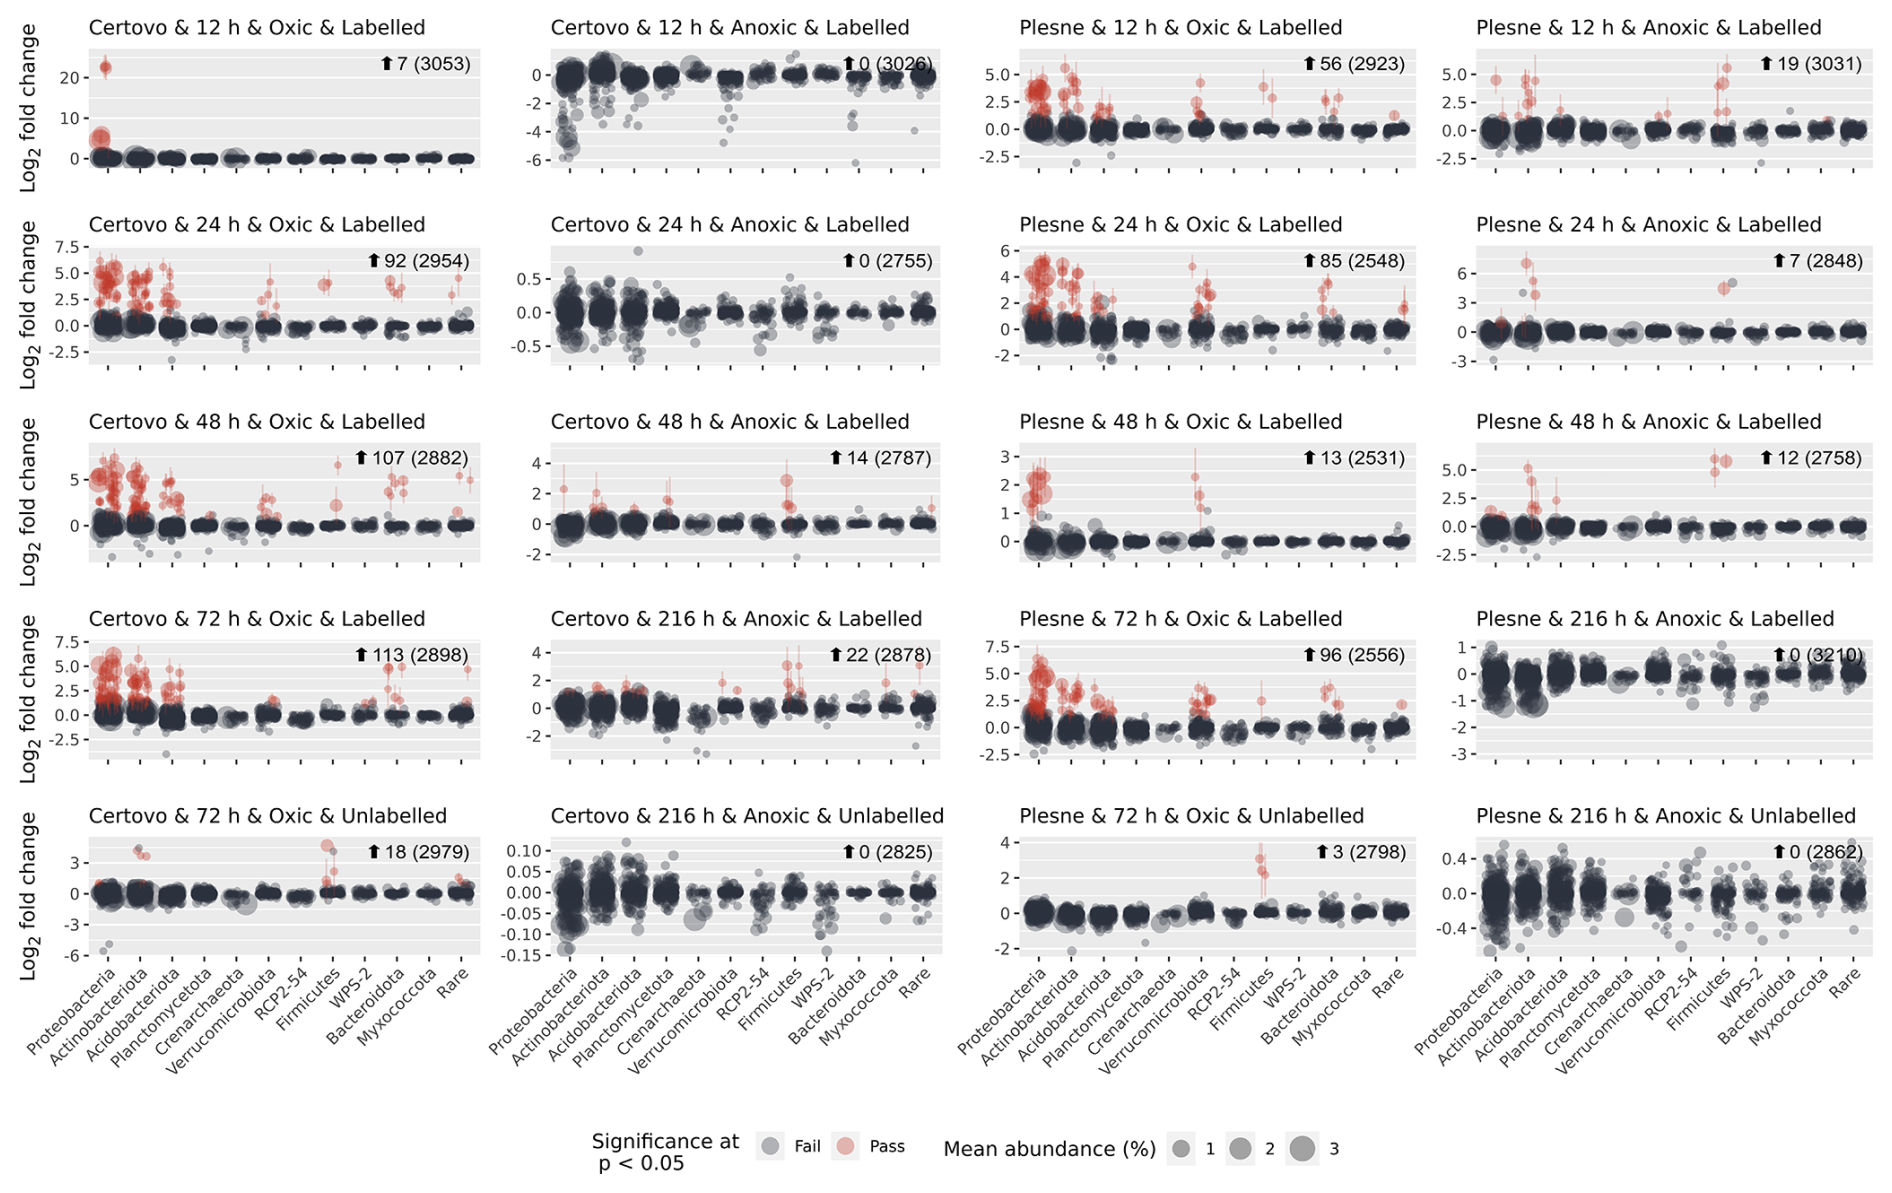
Figure 2Identifying labelled ASVs using differential abundance analysis. Fold change (log 2) of ASVs between fractions where 13C-labelled RNA is expected to be found (>1.795 g mL−1; a.k.a. “heavy” fractions) and the fractions where unlabelled RNA is expected to be found (<1.795 g mL−1; a.k.a. “light” fractions). Each circle represents an ASV, which passed sparsity filtering (see Sect. 2). The x axis shows the taxonomic phylum-level classification of the ASVs (ordered by total abundance across all samples), while the y axis is the mean log 2 fold change across all gradients. The size of each circle represents the normalised abundance across all samples. Red circles denote ASVs flagged as significantly more abundant in the heavy fractions than the light fractions, with a log 2 fold change of >0.26 (∼20 % increase) and an adjusted p value of <0.05.
Under oxic conditions, labelling of ASVs was relatively rapid and incubations past 24 h showed little change in the number and identity of the labelled ASVs (Fig. 2). Of the two sites, PL was quicker to respond and displayed already labelled ASVs in all major phyla after 12 h, while the Fe-rich site – CT – had only a few Gammaproteobacteria ASVs labelled at this point. PL was also quick to respond under anoxic conditions and displayed several labelled ASVs from order Corynebacteriales (Actinomycetota) and the class Bacilli already after 12 h. On the other hand, nearly all labelled ASVs from CT under anoxic conditions first appeared after 48 h, or even 216 h, of incubation.
The labelled ASVs showed not only consistency over time (i.e. the same ASVs labelled at different time points) but also a significant phylogenetic clustering. Measuring the nearest taxon index (NTI, i.e. the standardised measure of the phylogenetic distance to the nearest taxon for each taxon in the sample) for the labelled ASVs showed the values averaged around 1.5 standard deviations across all the SIP gradients (Fig. S8). Interestingly, in most taxonomic groups, either identical or very closely related ASVs were labelled in the samples from both sites (Fig. 3). However, some interesting exceptions are noted. Under oxic conditions, CT samples had more labelled ASVs from the order Frankiales (Actinomycetota) and Xanthomonadales (Gammaproteobacteria), while PL had more labelled ASVs affiliated with the class Verrucomicrobiae. Under anoxic conditions, only PL had some labelled ASVs from the orders Corynebacteriales (Actinomycetota) and Acidobacteriales.
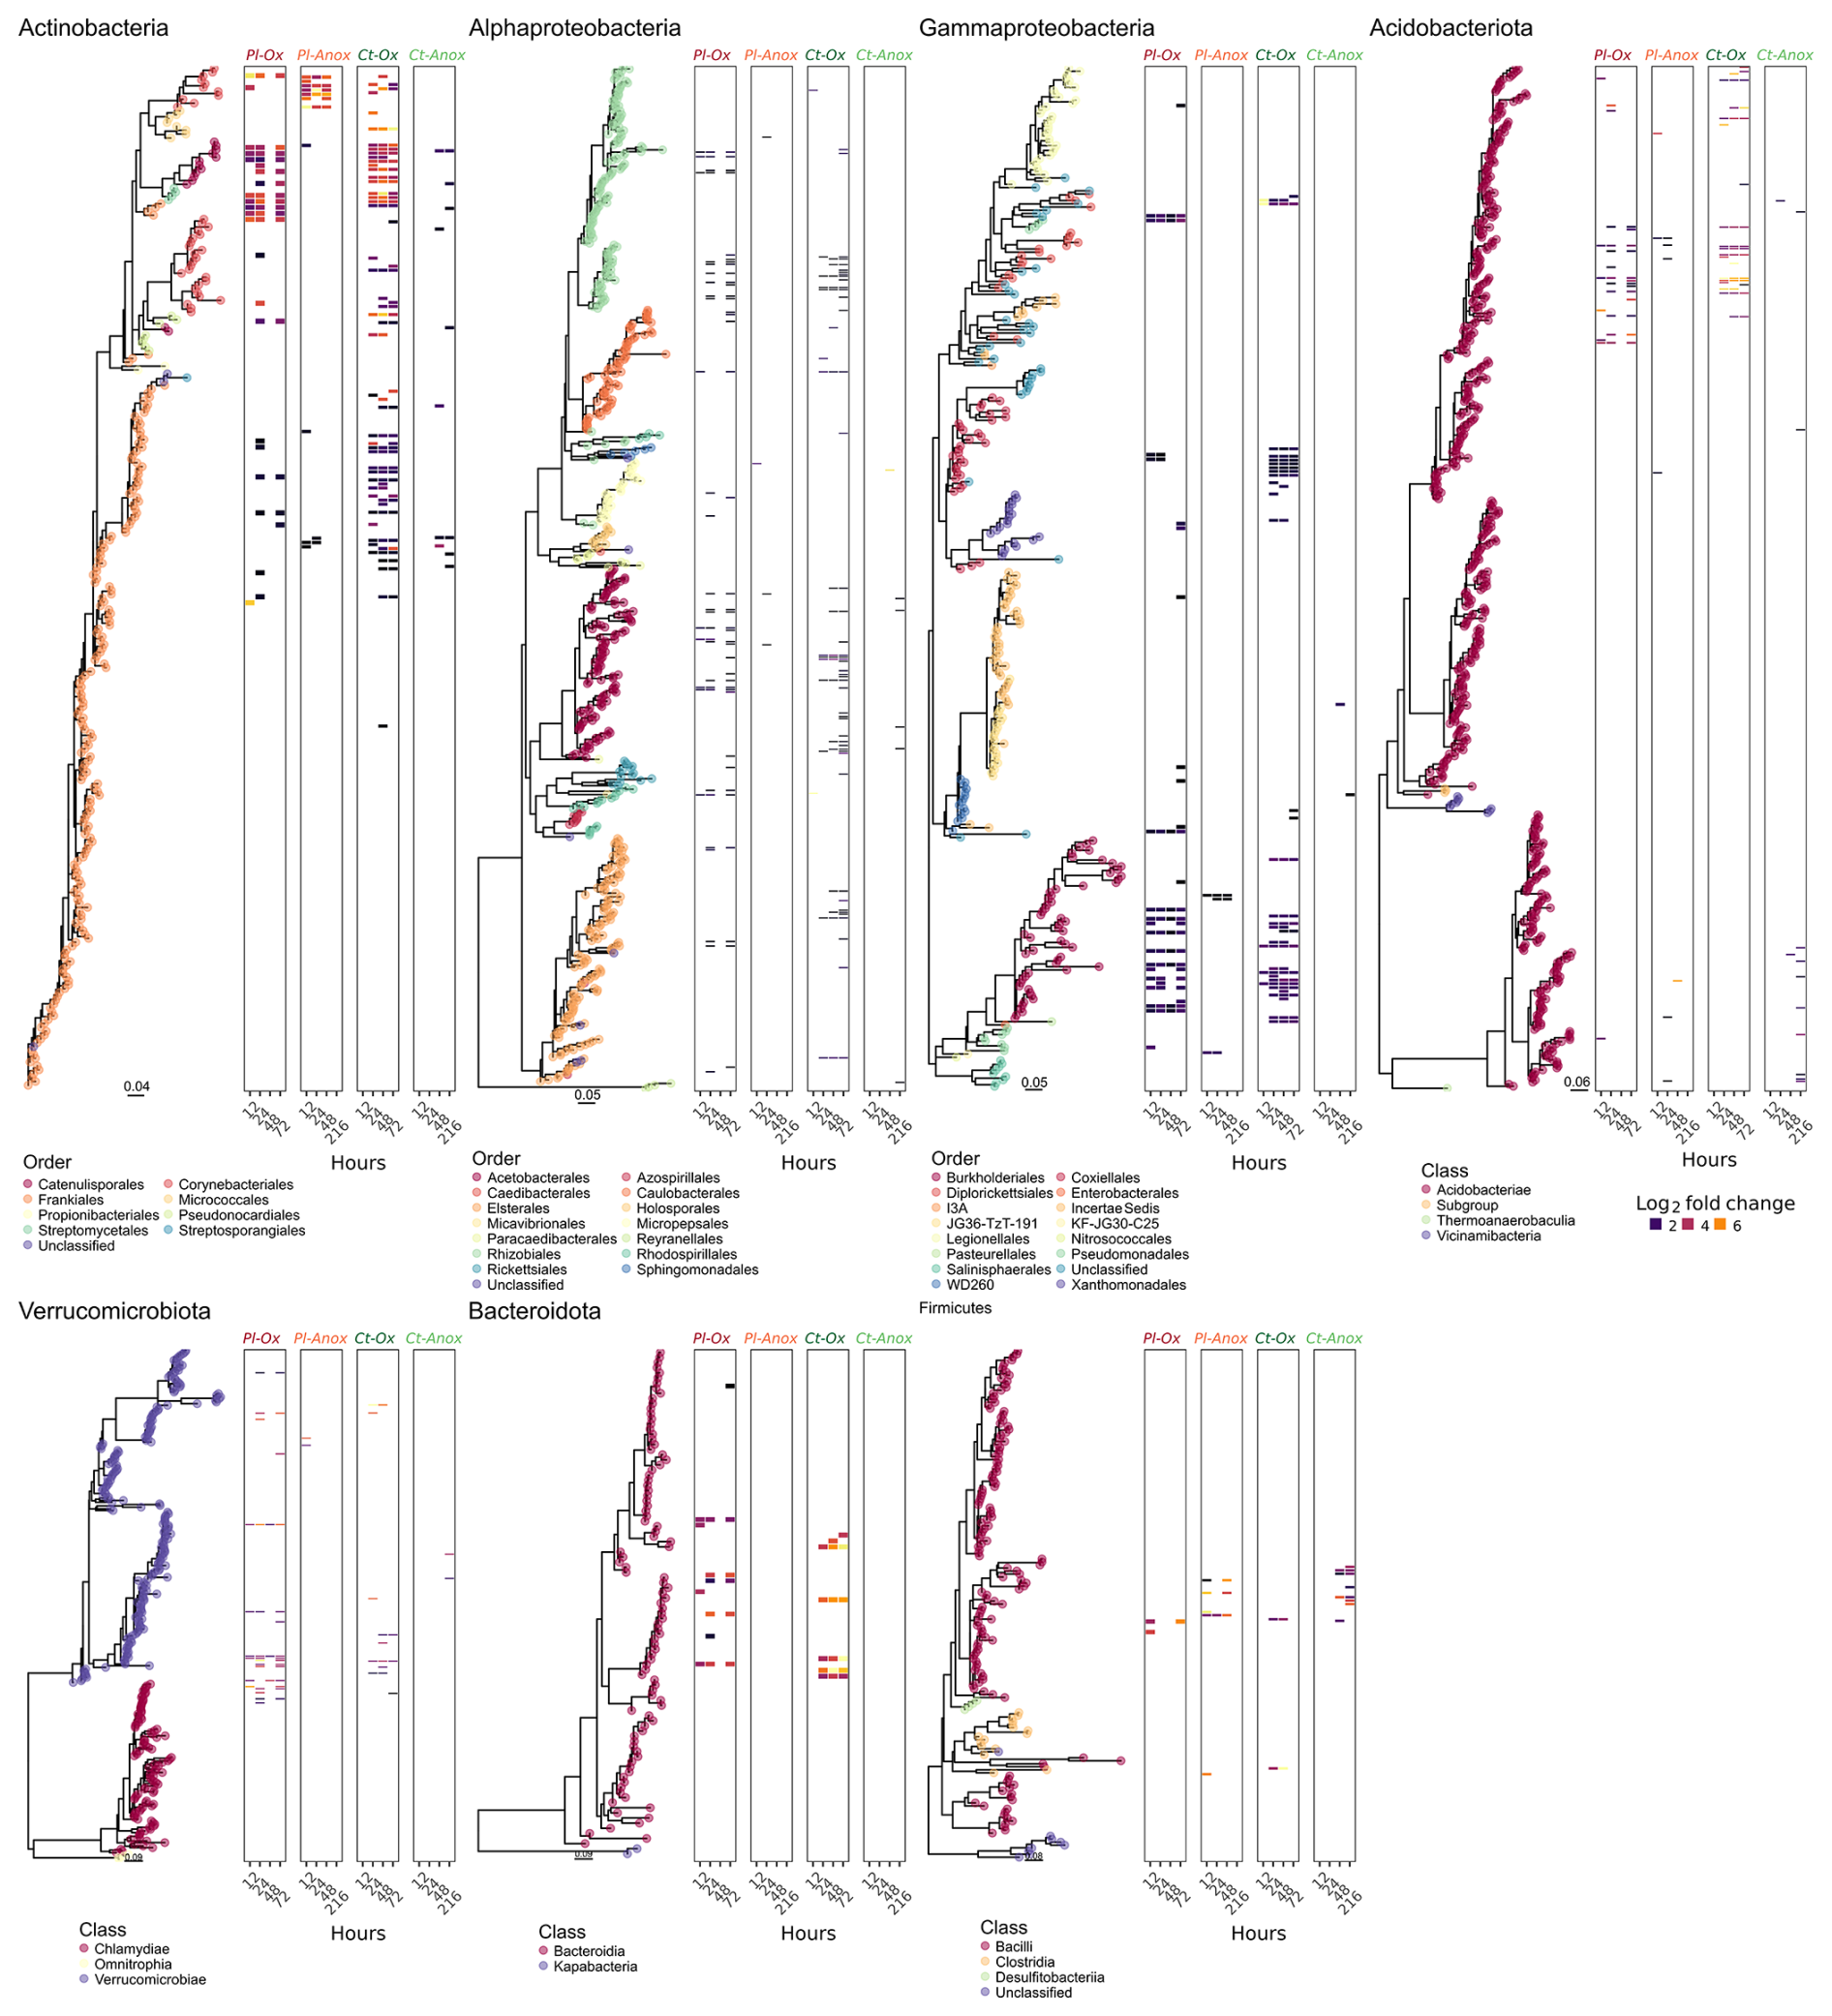
Figure 3Phylogenetic trees of ASVs that passed the sparsity threshold. Coloured dots on the tree tips designate either the taxonomic order (for the classes Actinomycetota, Alphaproteobacteria, and Gammaproteobacteria) or the class (for the phyla Acidobacteriota, Verrucomicrobiota, Bacteroideta, and Firmicutes) to which the ASVs were assigned. The associated heatmaps are divided into Plešné (PL) and Čertovo (CT) samples under oxic (Ox) and anoxic (Anox) conditions at different time points. Highlighted tiles in the heatmaps denote ASVs with a statically significant differential abundance (labelled ASVs), and their colour intensity is proportional to their log 2 fold change between the “heavy” and “light” fractions.
Although CUE has been employed in numerous studies to understand soil C cycling (e.g. Herron et al., 2009; Tao et al., 2023), researchers typically assume fully oxic conditions in the soil and disregard the effects of anoxia, alternative electron acceptors, and the fate of secreted products (Manzoni et al., 2018). This incubation experiment was designed to investigate the differential response of microbial carbon use, storage, and stabilisation efficiencies (response variables) to glucose amendments (controlled variable) under varying levels of oxygen and available Fe in the soil (explanatory variables). The quantity of added glucose was intentionally small and mimicked the input of available C to meet the energy demand for optimal metabolic activity of the metabolically activated population until the substrate was depleted (Anderson and Domsch, 1985). The quantity of added glucose (approx. 100 µmol C g−1) was within a range of bioavailable C in the studied soils (WEC from 38 to 150 µmol C g−1; Fig. 1a, Table S3) and lower than C in microbial biomass (CMB 120 to 190 µmol C g−1), mimicking natural fluctuations in available C.
4.1 CUE values were greatly affected by the aeration status of the soil
Carbon use, storage, and stabilisation efficiencies estimated in our experiments were linked to the ability of the microbial community to assimilate and distribute glucose to catabolism and biosynthesis of microbial compounds, either intracellular or extracellular (Table 2; Fig. S2). Accordingly, it should be interpreted as glucose carbon use efficiency in the sense defined by Schimel et al. (2022). The efficiency of microbial metabolism and C retention in the soil was calculated for all sampling points of the experiment (24 and 48 h and at end of incubation after 72 and 216 h respectively), but under anoxic conditions, the estimates were burdened with a large error under conditions of high concentration of unused glucose in the anoxic soil during earlier samplings, similarly to Geyer et al. (2019). In contrast, glucose consumption was fast under the oxic treatment, and the turnover of microbial biomass was on the order of a few days (72 and 168 h for CT and PL respectively). Such rapid turnover makes CUE estimates biased by microbial biomass recycling. Since the character of 13C substrate being metabolised changes once the microbial biomass gets recycled, CUE estimates specifically derived for glucose metabolism cannot be comparable between treatments. Consequently, we will discuss only the results after 72 and 216 h respectively, for oxic and anoxic treatment. We are aware that the interpretation of results obtained at different time intervals might be different. However, as mentioned in the introduction, the measures of soil C use and stabilisation efficiencies are influenced by microbial growth. At the end of the experiment, the growth of the microbial population ceased, apart from in the anoxic CT soil, where the microbial biomass was still slowly growing (Fig. 1d). We believe this approach makes our comparison more reliable than if we were to compare the same time intervals.
The CUE values, especially under oxic conditions, were potentially affected by the rate of microbial turnover. The higher the turnover rate, the lower the CUE. CUEA and CUE were almost identical in the oxic soils, showing either negligible production of exudates, re-consumption of microbially transformed C (Table 2; Geyer et al., 2019), or formation of unquantified mineral–organic associations (MOAs), mainly in the Fe-rich CT soil. Oxic CT soil had lower CUEs than oxic PL soil, presumably because of the high turnover of CMB associated with a community with more copiotrophic members (see below; Roller and Schmidt, 2015), C stabilisation into MOAs in an iron-rich environment accompanied with lesser accessibility of C for microorganisms, and P limitation (Čapek et al., 2016). The effect of Fe(III) C stabilisation on CUE is highlighted by the high proportion of non-extractable C in this soil.
Under anoxia, the CUE of the soils was 3 to 4 times higher than CUEA and, therefore, even higher than under oxic conditions. The difference is attributed to the high production of fermentation products, mainly organic acids, as is confirmed by their increase in concentration in the pore water. The quantity of all microbially transformed C remaining in soil at the end of the experiment (CSE) was greater under anoxia, but its stabilisation (TCSE) was less. This is related to the solubility and ease of degradation of organic acids (Ström, 1997) and solubility of Fe(II) bounded compounds.
Iron in the CT soils was associated with lower CUE and CUEA than the PL soil but increased C stabilisation of newly transformed C in both oxic and anoxic conditions. Although these data were obtained from the breakdown of a sole substrate, it confirms that the production of extracellular metabolites must be considered when evaluating the efficiency of microbial metabolism in relation to soil organic matter storage. The data further support that the abiotic formation of MOAs from microbially transformed carbon must not be neglected as it may significantly impact anoxic CUE values.
4.2 Unrecoverable C from soil amendments
Much of the added 13C could be traced in the CO2, microbial biomass or WEC, while a significant quantity remained untraced (Fig. 1a). Presumably, the 13C was stabilised via adsorption on mineral surfaces or co-precipitated, forming MOAs. (i) Small quantities of glucose can be sorbed on Fe(hydroxy-)oxides via H bonds (Olsson et al., 2011) or associated via co-precipitation processes (Lenhardt et al., 2023). (ii) Metabolism intermediates can be firmly bound on MOAs (Jones and Edwards, 1998). (iii) Necromass interacts with mineral surfaces to form bioorganic complexes, which are assumed to be the main factors driving soil necromass stabilisation (Camenzind et al., 2023). (iv) Extracellular enzyme preservation can be attributed to copolymerisation, adsorption, and encapsulation (Gotsmy et al., 2021). Lastly, it has been documented that the extractability of proteins from soils ranges from 1 % to 5 % (Benndorf et al., 2007; McClaugherty and Linkins, 1988), which could account for some of the untraced parts of the labelled C pool. Sorption of organics to minerals to form MOAs decreases their decomposability and microbial reuse (Jones and Edwards, 1998; Porras et al., 2018).
4.3 Aeration status and Fe availability affected C partitioning into different pools
Under oxic conditions, a major part of added glucose disappeared from the soil within the first 24 h and, accordingly, CMB and CO2 from glucose increased sharply during this period (Fig. 1a). However, part of the added C was shifted to the non-extractable C pool (about 20 % and 50 % in the PL and CT soils respectively), most likely as a result of the stabilisation effect of MOAs (see above). Glucose incorporation to CMB and respiration was lower but C stabilisation was higher in the Fe-rich CT soil compared to the Fe-poor PL soil. Slower glucose transformation in the CT soil was presumably caused by a combined effect of nutrient limitation, mainly by P, in the CT soil but not in PL soil (Tahovská et al., 2018; Čapek et al., 2016), greater organics binding to minerals to create MOAs, greater organics protection in aggregates, or different structures of microbial community with lower metabolic efficiency (see below). A slight but detectable increase in WEC from glucose and increasing concentration of OA in the soil solution suggest the presence of anoxic microniches in oxic soils (Borer et al., 2018), where oxygen-tolerant bacteria carry fermentation with formic acid being a predominant product. Indeed, the concentration of formic acid increased in the pore water in both oxic soils by 1 order of magnitude during the incubation. Acetate and tricarboxylic acids, concentrations of which increased in the pore water, can also originate from overflow metabolism in conditions of carbon excess (Basan et al., 2015).
Under anoxic conditions, acetate accumulation suggests that acetogenesis dominated fermentation in both soils, which has been observed previously for forest soils (Küsel and Drake, 1995; Degelmann et al., 2009). However, acetate accumulation in the Fe-rich CT soils was considerably delayed compared to the PL soil. Concomitant with the drop in values during this incubation period and the presence of Fe, this indicates that alternative processes to acetogenesis were active as C sinks in CT soil. This phenomenon was seen in other Fe-rich soils (e.g. Küsel et al., 2002; Lentini et al., 2012).
CT soil contains almost 7 times more oxalate-extractable Fe(III) than PL soil. However, only a small fraction of oxalate-extractable iron is microbially reducible (Lovley and Phillips, 1987). Most iron minerals in soil exist in forms which are unavailable to microorganisms. Amorphous Fe(III) oxides, e.g. ferrihydrite, are considered the most microbially accessible forms of Fe(III) (Lovley and Phillips, 1987; Lentini et al., 2012). For PL soil, bioavailable Fe(III) constitutes roughly 11 % of oxalate-extractable Fe(III) in oxic conditions and roughly 13 % in anoxic conditions (Table S2). These values for CT soil are approximately 14 % and 21 % respectively. This suggests that the onset of anoxic conditions in iron-rich CT soil might have triggered reactions resulting in the release of iron solids from bound structures, thus making iron available for microbial reduction. Also, iron reduction can mobilise nutrients and carbon previously bound to iron minerals. Organic carbon can be additionally released from soil organic matter (Bhattacharyya et al., 2018). Both soils demonstrated Fe(II) accumulation after 216 h under anoxic conditions. CT had double the quantity of reduced iron compared to PL soil. It has been reported that Fe(III) not only can serve as a terminal electron acceptor in microbial metabolism but it also acts as an electron sink for fermentation (List et al., 2019). While microorganisms gain more energy from iron respiration than fermentation, the main benefit of iron reduction is buffering pH and extending the acidogenic phase of fermentation in which organic acids are produced (Wang et al., 2019).
4.4 A plethora of aerobic and anaerobic bacteria were activated under varying oxic conditions
The composition of the active part of the microbial community depends on many edaphic factors, among them the aeration status and the availability and type of Fe minerals and C source present at the site (Lentini et al., 2012; Angel and Conrad, 2013; Barnett et al., 2021). Not surprisingly, oxygen availability selected for certain microbial taxa in both PL and CT incubations, and many taxonomic groups of well-known strict aerobes were only labelled under oxic conditions (Fig. 3, Table S7). Complete glucose removal under oxic conditions supported the labelling of many more ASVs from all phyla compared to anoxic conditions. The much greater RNA-labelling under oxic conditions was expected simply thanks to the higher energy yield from oxic respiration compared to anoxic respiration or fermentation. Active taxa under oxic incubations included Acidobacteriota subgroup 1 (Eichorst et al., 2018), members of the Beijerinckiaceae family (Hyphomicrobiales/Rhizobiales; Dedysh and Dunfield, 2016), the order Acetobacterales (Sievers and Swings, 2015) of the Alphaproteobacteria, and members of the orders Xanthomonadales (Saddler and Bradbury, 2015) and Burkholderiales (genus Burkholderia; Garrity et al., 2015). Nearly all members of the abovementioned groups are obligate aerobes. Only a handful of ASVs affiliated with Bacillota (formerly Firmicutes) were labelled in our incubation under oxic and anoxic conditions, even though nearly all members are known to be strict or facultative anaerobes. These Bacillota (all Lactobacilli) were more numerous and strongly labelled under anoxic conditions. However, the labelling of these facultative anaerobes (Pot et al., 2014) under oxic conditions indicates their activity in hypoxic microniches. The calculated NTI values above 1.5 imply that the labelled taxa are more phylogenetically related than expected by chance (Stegen et al., 2012) and indicate a concerted response of specific metabolic guilds to the amendment and incubation conditions.
Despite the differences in iron content, only minor differences were observed in the taxonomic groups that became labelled under either oxic or anoxic conditions in the samples from the two sites. Samples from the iron-rich soils of CT had nearly all Xanthomonadales ASVs (all Rhodanobacter or Dyella) and Acidothermus (Frankiales, Actinomycetota) labelled, while PL had close to none from these taxa. Many Xanthomonadales members are known to couple denitrification to ferrous iron oxidation (Huang et al., 2021), and Acidothermus members have been associated with (acidic) denitrifying conditions (Bárta et al., 2017). Similarly, many denitrifying bacteria were shown to be labelled in SIP experiments of soils under high moisture levels and reducing conditions (Greenlon et al., 2022; Coskun et al., 2019). These groups may have been responsible for the nitrate depletion in our incubations. Moreover, the Fe-rich CT soils had lower CUE, correlated with a more active copiotrophic community (whose metabolism is less efficient). Indeed, many of the labelled ASVs in this soil belong to fast-growing copiotrophic phyla such as Actinomycetota (Ramirez et al., 2012) and Gammaproteobacteria (Fierer et al., 2011), while the PT soils were differentially more enriched with oligotrophic phyla such as Acidobacteriota (Fierer et al., 2011) and Verrucomicrobiota (Bergmann et al., 2011). In contrast, although members of taxa known for iron-reduction capabilities were found in our sequencing data (several Anaeromyxobacter, Bacillus ASVs, and one Shewanella; Esther et al., 2015; Hori et al., 2015) none of them were labelled under either aeration status, indicating no significant iron reduction coupled with glucose oxidation (or its fermentation products) in these soils.
Our findings imply that, regarding CUE, soil aeration status primarily affects immediate C incorporation into soils, with anoxic soils having slightly higher CUE. C is used mainly under oxic conditions for biomass and CO2 production, while in anoxic conditions, C is used primarily for producing extracellular exudates. High Fe content in the CT soil constrained CUEA and CUE under oxic conditions but only CUE under anoxia, while CUEA increased. Under anoxic conditions, exudates remained mainly in the water extractable C pool and less C was lost as CO2, leading to higher CSE as compared with soils under oxic conditions. This enhanced production of microbial exudates at the expense of microbial biomass under anoxic conditions suggests that soil aeration and mineralogy are important determinants of lateral C export fluxes and may thereby influence C storage in the soil. However, C stabilisation potential, TCSE, remained lower in the anoxic soils, implying biomass C has a greater potential for long-term C sequestration. In contrast, extracellular exudates might have a significant role as a source of available C, which can accelerate the development of microbial communities when environmental conditions improve (e.g. after aeration of flooded soils). Fe content promoted the stabilisation potential of the soil (TCSE) under both oxic and anoxic conditions showing an important effect of soil mineralogy.
Raw sequences were deposited into GenBank's SRA database under BioProject no. PRJNA1272818. The scripts to reproduce the analyses are available online: https://github.com/ISBB-anaerobic/anaerobic_CUE (last access: 24 September 2025) and https://doi.org/10.5281/zenodo.16091959 (Angel, 2025).
The supplement related to this article is available online at https://doi.org/10.5194/soil-11-735-2025-supplement.
Conceptualisation: HŠ, JN, RA, TBM; Lab work: JN, ACL, SJ; Formal analysis: RA, HŠ, PČ, TBM; Writing – original draft: JN, HŠ, RA, TBM, Writing – review and editing: all authors; Visualisation: RA; Funding acquisition: HŠ.
The contact author has declared that none of the authors has any competing interests.
Publisher's note: Copernicus Publications remains neutral with regard to jurisdictional claims made in the text, published maps, institutional affiliations, or any other geographical representation in this paper. While Copernicus Publications makes every effort to include appropriate place names, the final responsibility lies with the authors.
We thank Jiří Kaňa for the help in sampling. Ljubov Polaková is acknowledged for her tremendous support of stable isotope measurements. Eva Petrová prepared the RNA samples for sequencing.
Jolanta Niedźwiecka was supported by the EU grant Rozvoj JU – Mezinárodní mobility (project no. CZ.02.2.69/0.0/0.0/16_027/0008364). Roey Angel was supported by supported by the MEYS CZ – Operational Programme RDE (SoWa Ecosystem Research; project no. CZ.02.1.01/0.0/0.0/16_013/0001782). Ana Catalina Lara was supported by the MEYS CZ – Operational Programme RDE (SoWa Ecosystem Research; project no. CZ.02.1.01/0.0/0.0/16_013/0001782). Hana Šantrůčková and Petr Čapek were supported by the Czech Science Foundation project nos. 22-05421S and 20-14704Y. Travis B. Meador and Stanislav Jabinski were supported by the Czech Science Foundation (project no. 20-22380S). Stable isotope measurements were supported by supported by MEYS CZ – Operational Programme RDE (SoWa Ecosystem Research; project no. CZ.02.1.01/0.0/0.0/16_013/0001782) and MEYS CZ Large Infrastructure for Research MEYS LM2015075, NSF-OCE 1736656 (LIA).
This paper was edited by Ashish Malik and reviewed by Wolfgang Wanek and two anonymous referees.
Allison, S. D.: Modeling adaptation of carbon use efficiency in microbial communities, Front. Microbiol., 5, https://doi.org/10.3389/fmicb.2014.00571, 2014.
Allison, S. D., Wallenstein, M. D., and Bradford, M. A.: Soil-carbon response to warming dependent on microbial physiology, Nat. Geosci., 3, 336–340, https://doi.org/10.1038/ngeo846, 2010.
Anderson, M. J. and Willis, T. J.: Canonical analysis of principal coordinates: a useful method of constrained ordination for ecology, Ecology, 84, 511–525, https://doi.org/10.1890/0012-9658(2003)084[0511:caopca]2.0.co;2, 2003.
Anderson, T.-H. and Domsch, K. H.: Maintenance carbon requirements of actively-metabolizing microbial populations under in situ conditions, Soil Biol. Biochem., 17, 197–203, https://doi.org/10.1016/0038-0717(85)90115-4, 1985.
Angel, R.: Stable Isotope Probing Techniques and Methodological Considerations Using 15N, in: Stable Isotope Probing: Methods and Protocols, edited by: Dumont, M. G. and Hernández García, M., Springer New York, New York, NY, 175–187, https://doi.org/10.1007/978-1-4939-9721-3_14, 2019.
Angel, R.: ISBB-anaerobic/Anaerobic_CUE: Publication in SOIL, Zenodo [code], https://doi.org/10.5281/zenodo.16091959, 2025.
Angel, R. and Conrad, R.: Elucidating the microbial resuscitation cascade in biological soil crusts following a simulated rain event, Environ. Microbiol., 15, 2799–2815, https://doi.org/10.1111/1462-2920.12140, 2013.
Angel, R. and Petrova, E.: General bacteria and archaea 16S-rRNA (515Fmod-806Rmod) for Illumina amplicon sequencing V.4, protocols.io, https://doi.org/10.17504/protocols.io.bsxanfie, 2 March 2021.
Angel, R., Claus, P., and Conrad, R.: Methanogenic archaea are globally ubiquitous in aerated soils and become active under wet anoxic conditions, ISME J., 6, 847–862, https://doi.org/10.1038/ismej.2011.141, 2012.
Angel, R., Panhölzl, C., Gabriel, R., Herbold, C., Wanek, W., Richter, A., Eichorst, S. A., and Woebken, D.: Application of stable-isotope labelling techniques for the detection of active diazotrophs, Environ. Microbiol., 20, 44–61, https://doi.org/10.1111/1462-2920.13954, 2018.
Angel, R., Petrova, E., and Lara-Rodriguez, A.: Total Nucleic Acids Extraction from Soil v6, protocols.io, https://doi.org/10.17504/protocols.io.bwxcpfiw, 27 July 2021.
Angel, R., Petrova, E., and Lara, A.: RNA-Stable Isotope Probing V.9, https://doi.org/10.17504/protocols.io.kxygxm23kl8j/v9, 2023.
Barnett, S. E., Youngblut, N. D., Koechli, C. N., and Buckley, D. H.: Multisubstrate DNA stable isotope probing reveals guild structure of bacteria that mediate soil carbon cycling, P. Natl. Acad. Sci. USA, 118, https://doi.org/10.1073/pnas.2115292118, 2021.
Bárta, J., Tahovská, K., Šantrůčková, H., and Oulehle, F.: Microbial communities with distinct denitrification potential in spruce and beech soils differing in nitrate leaching, Sci. Rep.-UK, 7, 9738, https://doi.org/10.1038/s41598-017-08554-1, 2017.
Basan, M., Hui, S., Okano, H., Zhang, Z., Shen, Y., Williamson, J. R., and Hwa, T.: Overflow metabolism in Escherichia coli results from efficient proteome allocation, Nature, 528, 99–104, https://doi.org/10.1038/nature15765, 2015.
Bates, D., Mächler, M., Bolker, B., and Walker, S.: Fitting Linear Mixed-Effects Models Using lme4, J. Stat. Softw., 67, 1–48, https://doi.org/10.18637/jss.v067.i01, 2015.
Bauer, I. and Kappler, A.: Rates and Extent of Reduction of Fe(III) Compounds and O2 by Humic Substances, Environ. Sci. Technol., 43, 4902–4908, https://doi.org/10.1021/es900179s, 2009.
Benndorf, D., Balcke, G. U., Harms, H., and von Bergen, M.: Functional metaproteome analysis of protein extracts from contaminated soil and groundwater, ISME J., 1, 224–234, https://doi.org/10.1038/ismej.2007.39, 2007.
Bergmann, G. T., Bates, S. T., Eilers, K. G., Lauber, C. L., Caporaso, J. G., Walters, W. A., Knight, R., and Fierer, N.: The under-recognized dominance of Verrucomicrobia in soil bacterial communities, Soil Biol. Biochem., 43, 1450–1455, https://doi.org/10.1016/j.soilbio.2011.03.012, 2011.
Bhattacharyya, A., Campbell, A. N., Tfaily, M. M., Lin, Y., Silver, W. L., Nico, P. S., and Pett-Ridge, J.: Redox fluctuations control the coupled cycling of iron and carbon in tropical forest soils, bioRxiv, 312108, https://doi.org/10.1101/312108, 2018.
Blagodatskaya, E., Khomyakov, N., Myachina, O., Bogomolova, I., Blagodatsky, S., and Kuzyakov, Y.: Microbial interactions affect sources of priming induced by cellulose, Soil Biol. Biochem., 74, 39–49, https://doi.org/10.1016/j.soilbio.2014.02.017, 2014.
Borer, B., Tecon, R., and Or, D.: Spatial organization of bacterial populations in response to oxygen and carbon counter-gradients in pore networks, Nat. Commun., 9, 769, https://doi.org/10.1038/s41467-018-03187-y, 2018.
Bruulsema, T. W. and Duxbury, J. M.: Simultaneous measurement of soil microbial nitrogen, carbon, and carbon isotope ratio, Soil Sci. Soc. Am. J., 60, 1787–1791, https://doi.org/10.2136/sssaj1996.03615995006000060025x, 1996.
Callahan, B. J., McMurdie, P. J., Rosen, M. J., Han, A. W., Johnson, A. J. A., and Holmes, S. P.: DADA2: High-resolution sample inference from Illumina amplicon data, Nat. Methods, 13, 581–583, https://doi.org/10.1038/nmeth.3869, 2016.
Camenzind, T., Mason-Jones, K., Mansour, I., Rillig, M. C., and Lehmann, J.: Formation of necromass-derived soil organic carbon determined by microbial death pathways, Nat. Geosci., 16, 115–122, https://doi.org/10.1038/s41561-022-01100-3, 2023.
Čapek, P., Kotas, P., Manzoni, S., and Šantrůčková, H.: Drivers of phosphorus limitation across soil microbial communities, Funct. Ecol., 30, 1705–1713, https://doi.org/10.1111/1365-2435.12650, 2016.
Coskun, Ö. K., Özen, V., Wankel, S. D., and Orsi, W. D.: Quantifying population-specific growth in benthic bacterial communities under low oxygen using , ISME J., 13, 1546–1559, https://doi.org/10.1038/s41396-019-0373-4, 2019.
Davis, N. M., Proctor, D. M., Holmes, S. P., Relman, D. A., and Callahan, B. J.: Simple statistical identification and removal of contaminant sequences in marker-gene and metagenomics data, Microbiome, 6, 226, https://doi.org/10.1186/s40168-018-0605-2, 2018.
Dedysh, S. N. and Dunfield, P. F.: Beijerinckiaceae, in: Bergey's Manual of Systematics of Archaea and Bacteria, John Wiley & Sons, Ltd, 1–4, https://doi.org/10.1002/9781118960608.fbm00164.pub2, 2016.
Degelmann, D. M., Kolb, S., Dumont, M., Murrell, J. C., and Drake, H. L.: Enterobacteriaceae facilitate the anaerobic degradation of glucose by a forest soil, FEMS Microbiol. Ecol., 68, 312–319, https://doi.org/10.1111/j.1574-6941.2009.00681.x, 2009.
del Giorgio, P. A. and Cole, J. J.: Bacterial Growth Efficiency in Natural Aquatic Systems, Annu. Rev. Ecol. Syst., 29, 503–541, https://doi.org/10.1146/annurev.ecolsys.29.1.503, 1998.
Dijkstra, P., Martinez, A., Thomas, S. C., Seymour, C. O., Wu, W., Dippold, M. A., Megonigal, J. P., Schwartz, E., and Hungate, B. A.: On maintenance and metabolisms in soil microbial communities, Plant Soil, https://doi.org/10.1007/s11104-022-05382-9, 2022.
Ebrahimi, A. and Or, D.: Hydration and diffusion processes shape microbial community organization and function in model soil aggregates, Water Resour. Res., 51, 9804–9827, https://doi.org/10.1002/2015WR017565, 2015.
Eichorst, S. A., Trojan, D., Roux, S., Herbold, C., Rattei, T., and Woebken, D.: Genomic insights into the Acidobacteria reveal strategies for their success in terrestrial environments, Environ. Microbiol., 20, 1041–1063, https://doi.org/10.1111/1462-2920.14043, 2018.
Endress, M.-G., Chen, R., Blagodatskaya, E., and Blagodatsky, S.: The coupling of carbon and energy fluxes reveals anaerobiosis in an aerobic soil incubation with a Bacillota-dominated community, Soil Biol. Biochem., 109478, https://doi.org/10.1016/j.soilbio.2024.109478, 2024.
Esther, J., Sukla, L. B., Pradhan, N., and Panda, S.: Fe(III) reduction strategies of dissimilatory iron reducing bacteria, Korean J. Chem. Eng., 32, 1–14, https://doi.org/10.1007/s11814-014-0286-x, 2015.
Fierer, N., Lauber, C. L., Ramirez, K. S., Zaneveld, J., Bradford, M. A., and Knight, R.: Comparative metagenomic, phylogenetic and physiological analyses of soil microbial communities across nitrogen gradients, ISME J., 6, 1007–1017, https://doi.org/10.1038/ismej.2011.159, 2011.
Garrity, G. M., Bell, J. A., and Lilburn, T.: Burkholderiales ord. nov, in: Bergey's Manual of Systematics of Archaea and Bacteria, John Wiley & Sons, Ltd, 1–1, https://doi.org/10.1002/9781118960608.obm00076, 2015.
Geyer, K. M., Dijkstra, P., Sinsabaugh, R., and Frey, S. D.: Clarifying the interpretation of carbon use efficiency in soil through methods comparison, Soil Biol. Biochem., 128, 79–88, https://doi.org/10.1016/j.soilbio.2018.09.036, 2019.
Ghori, N.-U.-H., Moreira-Grez, B., Vuong, P., Waite, I., Morald, T., Wise, M., and Whiteley, A. S.: RNA stable isotope probing (RNA-SIP), in: Stable isotope probing: Methods and protocols, edited by: Dumont, M. G. and Hernández García, M., Springer New York, New York, NY, 31–44, https://doi.org/10.1007/978-1-4939-9721-3_3, 2019.
Gotsmy, M., Escalona, Y., Oostenbrink, C., and Petrov, D.: Exploring the structure and dynamics of proteins in soil organic matter, Proteins, 89, 925–936, https://doi.org/10.1002/prot.26070, 2021.
Greenlon, A., Sieradzki, E., Zablocki, O., Koch, B. J., Foley, M. M., Kimbrel, J. A., Hungate, B. A., Blazewicz, S. J., Nuccio, E. E., Sun, C. L., Chew, A., Mancilla, C.-J., Sullivan, M. B., Firestone, M., Pett-Ridge, J., and Banfield, J. F.: Quantitative stable-isotope probing (qSIP) with metagenomics links microbial physiology and activity to soil moisture in mediterranean-climate grassland ecosystems, mSystems, 7, e00417-22, https://doi.org/10.1128/msystems.00417-22, 2022.
Herron, P. M., Stark, J. M., Holt, C., Hooker, T., and Cardon, Z. G.: Microbial growth efficiencies across a soil moisture gradient assessed using 13C-acetic acid vapor and 15N-ammonia gas, Soil Biol. Biochem., 41, 1262–1269, https://doi.org/10.1016/j.soilbio.2009.03.010, 2009.
Hori, T., Aoyagi, T., Itoh, H., Narihiro, T., Oikawa, A., Suzuki, K., Ogata, A., Friedrich, M. W., Conrad, R., and Kamagata, Y.: Isolation of microorganisms involved in reduction of crystalline iron(III) oxides in natural environments, Front. Microbiol., 6, https://doi.org/10.3389/fmicb.2015.00386, 2015.
Huang, Y.-M., Straub, D., Blackwell, N., Kappler, A., and Kleindienst, S.: Meta-omics reveal Gallionellaceae and Rhodanobacter species as interdependent key players for Ffe(II) oxidation and nitrate reduction in the autotrophic enrichment culture KS, Appl. Environ. Microb., 87, e00496-21, https://doi.org/10.1128/AEM.00496-21, 2021.
Jones, D. L. and Edwards, A. C.: Influence of sorption on the biological utilization of two simple carbon substrates, Soil Biol. Biochem., 30, 1895–1902, https://doi.org/10.1016/S0038-0717(98)00060-1, 1998.
Kakumanu, M. L., Ma, L., and Williams, M. A.: Drought-induced soil microbial amino acid and polysaccharide change and their implications for C-N cycles in a climate change world, Sci Rep, 9, 10968, https://doi.org/10.1038/s41598-019-46984-1, 2019.
Kaňa, J., Kopáček, J., Tahovská, K., and Šantrůčková, H.: Tree dieback and related changes in nitrogen dynamics modify the concentrations and proportions of cations on soil sorption complex, Ecol. Indic., 97, 319–328, https://doi.org/10.1016/j.ecolind.2018.10.032, 2019.
Kembel, S. W., Cowan, P. D., Helmus, M. R., Cornwell, W. K., Morlon, H., Ackerly, D. D., Blomberg, S. P., and Webb, C. O.: Picante: R tools for integrating phylogenies and ecology, Bioinformatics, 26, 1463–1464, https://doi.org/10.1093/bioinformatics/btq166, 2010.
Koontz, L.: Chapter One – TCA Precipitation, in: Methods in Enzymology, vol. 541, edited by: Lorsch, J., Academic Press, 3–10, https://doi.org/10.1016/B978-0-12-420119-4.00001-X, 2014.
Küsel, K. and Drake, H. L.: Effects of environmental parameters on the formation and turnover of acetate by forest soils, Appl. Environ. Microb., 61, 3667–3675, https://doi.org/10.1128/aem.61.10.3667-3675.1995, 1995.
Küsel, K., Wagner, C., Trinkwalter, T., Gößner, A. S., Bäumler, R., and Drake, H. L.: Microbial reduction of Fe(III) and turnover of acetate in Hawaiian soils, FEMS Microbiol. Ecol., 40, 73–81, https://doi.org/10.1111/j.1574-6941.2002.tb00938.x, 2002.
Lenhardt, K. R., Brandt, L., Poll, C., Rennert, T., and Kandeler, E.: Release of glucose from dissolved and mineral-bound organic matter by enzymatic hydrolysis, Eur. J. Soil Sci., 74, e13421, https://doi.org/10.1111/ejss.13421, 2023.
Lentini, C. J., Wankel, S. D., and Hansel, C. M.: Enriched Iron(III)-Reducing Bacterial Communities are Shaped by Carbon Substrate and Iron Oxide Mineralogy, Front. Microbiol., 3, https://doi.org/10.3389/fmicb.2012.00404, 2012.
List, C., Hosseini, Z., Lederballe Meibom, K., Hatzimanikatis, V., and Bernier-Latmani, R.: Impact of iron reduction on the metabolism of Clostridium acetobutylicum, Environ. Microbiol., 21, 3548–3563, https://doi.org/10.1111/1462-2920.14640, 2019.
Liu, J.-S., Vojinović, V., Patiño, R., Maskow, Th., and von Stockar, U.: A comparison of various Gibbs energy dissipation correlations for predicting microbial growth yields, Thermochim. Acta, 458, 38–46, https://doi.org/10.1016/j.tca.2007.01.016, 2007.
Love, M. I., Huber, W., and Anders, S.: Moderated estimation of fold change and dispersion for RNA-seq data with DESeq2, Genome Biol., 15, 550, https://doi.org/10.1186/s13059-014-0550-8, 2014.
Lovley, D. R.: Fe(III) and Mn(IV) Reduction, in: Environmental Microbe-Metal Interactions, John Wiley & Sons, Ltd, 1–30, https://doi.org/10.1128/9781555818098.ch1, 2000.
Lovley, D. R. and Phillips, E. J. P.: Rapid assay for microbially reducible ferric iron in aquatic sediments, Appl. Environ. Microb., 53, 1536–1540, https://doi.org/10.1128/aem.53.7.1536-1540.1987, 1987.
Lovley, D. R., Holmes, D. E., and Nevin, K. P.: Dissimilatory Fe(III) and Mn(IV) reduction, Adv. Microb. Physiol., 49, 219–286, 2004.
Manzoni, S., Taylor, P., Richter, A., Porporato, A., and Ågren, G. I.: Environmental and stoichiometric controls on microbial carbon-use efficiency in soils, New Phytol., 196, 79–91, https://doi.org/10.1111/j.1469-8137.2012.04225.x, 2012.
Manzoni, S., Čapek, P., Porada, P., Thurner, M., Winterdahl, M., Beer, C., Brüchert, V., Frouz, J., Herrmann, A. M., Lindahl, B. D., Lyon, S. W., Šantrůčková, H., Vico, G., and Way, D.: Reviews and syntheses: Carbon use efficiency from organisms to ecosystems – definitions, theories, and empirical evidence, Biogeosciences, 15, 5929–5949, https://doi.org/10.5194/bg-15-5929-2018, 2018.
Martin, M.: Cutadapt removes adapter sequences from high-throughput sequencing reads, EMBnet.journal, 17, 10–12, https://doi.org/10.14806/ej.17.1.200, 2011.
McClaugherty, C. A. and Linkins, A. E.: Extractability of cellulases in forest litter and soil, Biol. Fert. Soils, 6, 322–327, https://doi.org/10.1007/BF00261021, 1988.
Minh, B. Q., Schmidt, H. A., Chernomor, O., Schrempf, D., Woodhams, M. D., von Haeseler, A., and Lanfear, R.: IQ-TREE 2: new models and efficient methods for phylogenetic inference in the genomic era, Mol. Biol. Evol., 37, 1530–1534, https://doi.org/10.1093/molbev/msaa015, 2020.
Naqib, A., Poggi, S., Wang, W., Hyde, M., Kunstman, K., and Green, S. J.: Making and Sequencing Heavily Multiplexed, High-Throughput 16S Ribosomal RNA Gene Amplicon Libraries Using a Flexible, Two-Stage PCR Protocol, in: Gene Expression Analysis: Methods and Protocols, edited by: Raghavachari, N. and Garcia-Reyero, N., Springer, New York, NY, 149–169, https://doi.org/10.1007/978-1-4939-7834-2_7, 2018.
Newman, D. K. and Kolter, R.: A role for excreted quinones in extracellular electron transfer, Nature, 405, 94–97, https://doi.org/10.1038/35011098, 2000.
Olsson, R., Giesler, R., and Persson, P.: Adsorption mechanisms of glucose in aqueous goethite suspensions, J. Colloid Interf. Sci., 353, 263–268, https://doi.org/10.1016/j.jcis.2010.09.023, 2011.
Picek, T., Šimek, M., and Šantrůčková, H.: Microbial responses to fluctuation of soil aeration status and redox conditions, Biol. Fert. Soils, 31, 315–322, https://doi.org/10.1007/s003740050662, 2000.
Porras, R. C., Hicks Pries, C. E., Torn, M. S., and Nico, P. S.: Synthetic iron (hydr)oxide-glucose associations in subsurface soil: Effects on decomposability of mineral associated carbon, Sci. Total Environ., 613–614, 342–351, https://doi.org/10.1016/j.scitotenv.2017.08.290, 2018.
Pot, B., Felis, G. E., Bruyne, K. D., Tsakalidou, E., Papadimitriou, K., Leisner, J., and Vandamme, P.: The genus Lactobacillus, in: Lactic Acid Bacteria, John Wiley & Sons, Ltd, 249–353, https://doi.org/10.1002/9781118655252.ch19, 2014.
Pruesse, E., Peplies, J., and Glöckner, F. O.: SINA: Accurate high-throughput multiple sequence alignment of ribosomal RNA genes, Bioinformatics, 28, 1823–1829, https://doi.org/10.1093/bioinformatics/bts252, 2012.
Quast, C., Pruesse, E., Yilmaz, P., Gerken, J., Schweer, T., Yarza, P., Peplies, J., and Glockner, F. O.: The SILVA ribosomal RNA gene database project: improved data processing and web-based tools, Nucleic Acids Res., 41, D590–D596, https://doi.org/10.1093/nar/gks1219, 2013.
R Core Team: R: A language and environment for statistical computing, ISBN 3-900051-07-0, 2020.
Ramirez, K. S., Craine, J. M., and Fierer, N.: Consistent effects of nitrogen amendments on soil microbial communities and processes across biomes, Glob. Change Biol., 18, 1918–1927, https://doi.org/10.1111/j.1365-2486.2012.02639.x, 2012.
Reguera, G., McCarthy, K. D., Mehta, T., Nicoll, J. S., Tuominen, M. T., and Lovley, D. R.: Extracellular electron transfer via microbial nanowires, Nature, 435, 1098–1101, https://doi.org/10.1038/nature03661, 2005.
Roller, B. R. K. and Schmidt, T. M.: The physiology and ecological implications of efficient growth, ISME J., 9, 1481–1487, https://doi.org/10.1038/ismej.2014.235, 2015.
Saddler, G. S. and Bradbury, J. F.: Xanthomonadaceae fam. nov., in: Bergey's Manual of Systematics of Archaea and Bacteria, John Wiley & Sons, Ltd, 1–3, https://doi.org/10.1002/9781118960608.fbm00237, 2015.
Šantrůčková, H., Bird, M. I., and Lloyd, J.: Microbial processes and carbon-isotope fractionation in tropical and temperate grassland soils, Funct. Ecol., 14, 108–114, https://doi.org/10.1046/j.1365-2435.2000.00402.x, 2000.
Šantrůčková, H., Picek, T., Tykva, R., Šimek, M., and Pavlů, B.: Short-term partitioning of 14C-[U]-glucose in the soil microbial pool under varied aeration status, Biol. Fert. Soils, 40, 386–392, https://doi.org/10.1007/s00374-004-0790-y, 2004.
Schimel, J., Weintraub, M. N., and Moorhead, D.: Estimating microbial carbon use efficiency in soil: Isotope-based and enzyme-based methods measure fundamentally different aspects of microbial resource use, Soil Biol. Biochem., 169, 108677, https://doi.org/10.1016/j.soilbio.2022.108677, 2022.
Sievers, M. and Swings, J.: Acetobacteraceae, in: Bergey's Manual of Systematics of Archaea and Bacteria, John Wiley & Sons, Ltd, 1–20, https://doi.org/10.1002/9781118960608.fbm00174, 2015.
Sinsabaugh, R. L., Manzoni, S., Moorhead, D. L., and Richter, A.: Carbon use efficiency of microbial communities: stoichiometry, methodology and modelling, Ecol. Lett., 16, 930–939, https://doi.org/10.1111/ele.12113, 2013.
Stegen, J. C., Lin, X., Konopka, A. E., and Fredrickson, J. K.: Stochastic and deterministic assembly processes in subsurface microbial communities, ISME J., 6, 1653–1664, https://doi.org/10.1038/ismej.2012.22, 2012.
Ström, L.: Root exudation of organic acids: importance to nutrient availability and the calcifuge and calcicole behaviour of plants, Oikos, 80, 459–466, https://doi.org/10.2307/3546618, 1997.
Tahovská, K., Čapek, P., Šantrůčková, H., and Kopáček, J.: In situ phosphorus dynamics in soil: long-term ion-exchange resin study, Biogeochemistry, 139, 307–320, https://doi.org/10.1007/s10533-018-0470-x, 2018.
Tao, F., Huang, Y., Hungate, B. A., Manzoni, S., Frey, S. D., Schmidt, M. W. I., Reichstein, M., Carvalhais, N., Ciais, P., Jiang, L., Lehmann, J., Wang, Y.-P., Houlton, B. Z., Ahrens, B., Mishra, U., Hugelius, G., Hocking, T. D., Lu, X., Shi, Z., Viatkin, K., Vargas, R., Yigini, Y., Omuto, C., Malik, A. A., Peralta, G., Cuevas-Corona, R., Di Paolo, L. E., Luotto, I., Liao, C., Liang, Y.-S., Saynes, V. S., Huang, X., and Luo, Y.: Microbial carbon use efficiency promotes global soil carbon storage, Nature, 618, 981–985, https://doi.org/10.1038/s41586-023-06042-3, 2023.
Vance, E. D., Brookes, P. C., and Jenkinson, D. S.: An extraction method for measuring soil microbial biomass C, Soil Biol. Biochem., 19, 703–707, https://doi.org/10.1016/0038-0717(87)90052-6, 1987.
Walters, W., Hyde, E. R., Berg-Lyons, D., Ackermann, G., Humphrey, G., Parada, A., Gilbert, J. A., Jansson, J. K., Caporaso, J. G., Fuhrman, J. A., Apprill, A., and Knight, R.: Improved bacterial 16S rRNA gene (v4 and v4-5) and fungal internal transcribed spacer marker gene primers for microbial community surveys, mSystems, 1, e00009-15, https://doi.org/10.1128/mSystems.00009-15, 2016.
Wang, Z., Juarez, D. L., Pan, J.-F., Blinebry, S. K., Gronniger, J., Clark, J. S., Johnson, Z. I., and Hunt, D. E.: Microbial communities across nearshore to offshore coastal transects are primarily shaped by distance and temperature, Environ. Microbiol., 21, 3862–3872, https://doi.org/10.1111/1462-2920.14734, 2019.
Warren, C. R.: D2O labelling reveals synthesis of small, water-soluble metabolites in soil, Soil Biol. Biochem., 165, 108543, https://doi.org/10.1016/j.soilbio.2021.108543, 2022.
Webb, C. O., Ackerly, D. D., McPeek, M. A., and Donoghue, M. J.: Phylogenies and community ecology, Annu. Rev. Ecol. Syst., 33, 475–505, https://doi.org/10.1146/annurev.ecolsys.33.010802.150448, 2002.
Weber, K. A., Achenbach, L. A., and Coates, J. D.: Microorganisms pumping iron: anaerobic microbial iron oxidation and reduction, Nat. Rev. Microbiol., 4, 752–764, https://doi.org/10.1038/nrmicro1490, 2006.
The requested paper has a corresponding corrigendum published. Please read the corrigendum first before downloading the article.
- Article
(2678 KB) - Full-text XML
- Corrigendum
-
Supplement
(11924 KB) - BibTeX
- EndNote