the Creative Commons Attribution 4.0 License.
the Creative Commons Attribution 4.0 License.
 | 15 Sep 2025
Exploring the link between cation exchange capacity and magnetic susceptibility
Gaston Matias Mendoza Veirana
Hana Grison
Jeroen Verhegge
Wim Cornelis
Philippe De Smedt
This study explores the relationship between soil magnetic susceptibility (κ) and cation exchange capacity (CEC) across diverse European soils, aiming to enhance pedotransfer functions (PTFs) for soil CEC using near-surface electromagnetic geophysics. We hypothesize that soil κ, can improve the prediction of CEC by reflecting the soil's mineralogical composition, particularly in sandy soils.
We collected data from 49 soil samples in vertical profiles across Belgium, the Netherlands, and Serbia, including κ in situ conditions (κ∗), low and high frequency κ in the laboratory, in-site electrical conductivity (σ), iron content, soil texture, humus content, bulk density, water content, water pH, and CEC. We used these properties as features to develop univariable and multivariable (in pairs) polynomial regressions to predict CEC for sandy and clayey soils.
Results indicate that κ∗ significantly improves CEC predictions in sandy soils, independent of clay content, with a combined κ∗-σ model achieving the highest predictive performance (R2 = 0.94). In contrast, laboratory-measured κ was less effective, likely due to sample disturbance.
This study presents a novel CEC PTF based on σ and κ∗, offering a rapid, cost-effective method for estimating CEC in field conditions. While our findings underscore the value of integrating geophysical measurements into soil characterization, further research is needed to refine the κ–CEC relationship and develop a more widely applicable model.
- Article
(1459 KB) - Full-text XML
- BibTeX
- EndNote


Modern strategies for soil characterization are crucial for addressing the global challenges of soil degradation and pollution. Near-surface electromagnetic geophysics, in particular, facilitates rapid quantitative assessment of soils, offering insights into subsurface electrical conductivity (σ), dielectric permittivity (ε), and magnetic susceptibility (κ) (Garré et al., 2022; Romero-Ruiz et al., 2018). Data collected on these electromagnetic properties can be used for direct qualitative soil survey interpretations or for more comprehensive quantitative analyses involving pedophysical models (PMs) and pedotransfer functions.
PMs link depth-specific geophysical properties with common soil properties. The need for developing such models is growing due to the demand for high-precision soil characterization (Romero-Ruiz et al., 2018; Verhegge et al., 2021; Wunderlich et al., 2013). Pedotransfer functions (PTFs) are models used to predict soil properties that are typically costly to obtain and are therefore determined less frequently than soil attributes that can be characterized more effectively (Van Looy et al., 2017).
An important indicator of soil health and fertility, which is also crucial in most PMs and PTFs, is the cation exchange capacity (CEC) (Glover, 2015; Mendoza Veirana et al., 2023). CEC, which refers to a soil's capacity to retain and exchange positively charged ions (Khaledian et al., 2017), is highly correlated with the soil clay content due to a larger colloid surface for particle exchanges. Furthermore, it is influenced by the soil's physical (e.g., texture), chemical (e.g., pH, mineralogy), and biological properties (e.g., organic matter); thus, CEC integrates aspects from all three main indicator groups commonly used to assess soil quality (Khaledian et al., 2017). Several PMs for soil σ prediction include CEC due to the significant influence of free charges on σ, despite the contribution of other properties such as water content (θ) and salinity or bulk soil σ (Glover, 2015). Soil charges can be either permanent or variable, depending primarily on soil pH (Chapman, 1965; Sumner and Miller, 2018). The relationship between clay content and CEC can be highly variable due to its dependence on clay mineralogy (ranging from 3–15 meq/100 g for kaolinite to 100–150 meq/100 g for vermiculite), and the relative proportion of variable and permanent CEC varies among clay minerals (Miller, 1970; Seybold et al., 2005). To standardize CEC measurements under varying soil conditions, it is common to use the CEC in neutral pH conditions (= 7), CEC7. However, conventional analytical methods for measuring CEC, such as the sodium saturation method, are time-consuming and expensive (Busenberg and Clemency, 1973). Due to the critical importance of CEC, its measurement cost, and its correlation with other soil properties, numerous PTFs (Khaledian et al., 2017) and worldwide hybrid models (Poggio et al., 2021) for CEC7 have been developed. Commonly, CEC PTFs are expressed as a function of clay content and humus, and less frequently pH and soil depth (Khaledian et al., 2017; Seybold et al., 2005). While CEC PTFs are often multivariate polynomial regressions, machine learning methods such as artificial neural networks (Ghorbani et al., 2015) and genetic expression programming and multivariate adaptive regression splines (Emamgolizadeh et al., 2015) have been used in the last decade when large datasets have been available. However, when working with small datasets, polynomial regressions are often preferred. Additionally, results have shown that σ and soil κ are independent (Maier et al., 2006), even though they generally correlate well with CEC.
Soil magnetic susceptibility has been correlated positively with CEC in studies focusing on soil type identification (Mello et al., 2020) (Pearson's correlation 0.4), soil characterization (Siqueira et al., 2010) (Pearson's correlation 0.68), paleoclimatic reconstruction (Maher, 1998) (Pearson's correlation 0.95 for Podsol and 0.73 for Cambisol samples), and electromagnetic induction applications (McLachlan et al., 2022). The magnetic susceptibility, κ, describes a material's ability to become magnetized when subjected to an external magnetic field. It quantifies the degree of magnetization induced in the substance relative to the strength of the applied magnetic field. The composition of the parent material, and consequently the mineralogy of the rocks and sediments that formed the soils, are the main parameters influencing soil magnetic properties (Jordanova, 2017). Formally, κ is defined as , where M is the induced magnetization of the material and H is the applied magnetic field. Soil and sediment κ measurements are widely used to detect the presence of pedogenic ferrimagnetic minerals (Dearing et al., 1996).
Soil clay content and soil κ are correlated positively due to the presence of ferrimagnetic minerals (such as maghemite) in the clay fraction, originating either from the parent material or through pedogenesis (Mello et al., 2020) (Pearson's correlation 0.26). Consequently, it has been suggested that the observed correlation between κ and CEC is actually due to their mutual correlation with clay content, indicating that κ may not have a direct effect on CEC (Mello et al., 2020).
To the best of our knowledge, the κ–CEC relationship has not been studied beyond the site level (Siqueira et al., 2010). This limited scope represents a significant research gap, as the broader applicability of κ for CEC prediction remains largely unexplored across diverse soil types and conditions.
The main hypothesis is that soil κ can support characterizing soil mineralogy, which also influences the permanent component of CEC. Therefore, soil κ may significantly enhance the accuracy of CEC PTFs. This study directly addresses the identified gap by systematically examining the κ–CEC relationship using a new comprehensive dataset. The potential to develop more robust, widely applicable CEC PTFs underscores the significance of this work, with implications for sustainable land management, precision agriculture, and environmental monitoring.
To improve predictions of field CEC by integrating soil κ, this study focuses on developing and testing uni- and multivariate polynomial PTFs based on data of diverse soil types sampled in Europe. In addition, we explore soil κ measured in situ and in the laboratory at different frequencies to give insights into the κ–CEC relationship and investigate how clay content affects the relationship between κ and CEC. While the methodology of this study focuses on soil and geophysical data collection, data analysis, and model development, delving into the underlying physicochemical mechanisms of soil mineralogy that would link κ and CEC is out of scope but is highlighted as an important direction for future research. To ensure transparency and reproducibility, all the collected data and developed code for this work is publicly available in an open source Python software: Mendoza Veirana (2024).
2.1 Study area, field measurements, and soil analysis
From eight sites in Belgium, the Netherlands and Serbia, 49 soil samples were collected across a wide range of USDA soil textures from sand to clay, and WRB (IUSS Working Group WRB, 2022) soil types (Fig. 1 and Table 1, see also Mendoza Veirana et al., 2023). Specifically, six sites in Belgium contributed 38 samples, one site in the Netherlands contributed 6 samples, and one site in Serbia contributed 5 samples. This distribution ensures representation of diverse soil types and textures across the three countries. At each site, test pits were dug to identify and sample different soil horizons. For each soil horizon and within a vertical soil profile, the soil field κ was measured (κ∗) (5 to 11 measurements per site, 49 in total) using a kappa meter SM30 (ZH Instruments, Brno, Czech Republic) at 8 kHz. The sensor measures soil κ with a penetration depth of 2 cm and a sensitivity of 10−7 SI units. The sensor was placed against the soil's profile wall for a measurement, followed by an additional measurement taken in open air away from the profile to obtain a reference zero κ value for measurement calibration (ZH Instruments, 2022). Additionally, a HydraProbe sensor (Stevens, Water Monitoring Systems) was employed to measure σ along the profile wall. The correction proposed by Logsdon et al. (2010) was applied to improve the quality of these readings.
Undisturbed soil samples (100 cm3) were collected manually by pushing standard steel rings horizontally into the soil profile wall at the same locations where κ∗ was measured. After the cores were weighed fresh and oven-dried for 24 h at 105 °C, volumetric water content (θ) was calculated from the water-mass loss divided by the core volume, and bulk density (bd) from the oven-dry mass divided by the same volume (Grossman and Reinsch, 2002).
Disturbed soil samples of about 250 g were collected around the undisturbed samples. They were air-dried, homogenized in an agate mortar, and sieved using a 2 mm mesh for determination of texture and chemical and magnetic soil properties. Clay, silt, and sand content (expressed in %) was measured following the pipette method (NF X31-107, 2003) after sieving at 2 mm. The humus content was calculated from the organic carbon content (conversion factor of 2), which was determined by dry combustion according to NF ISO 10694. CEC was determined by the CoHex method (Ciesielski et al., 1997a, b).
Table 1Minimum and maximum intervals of soil and magnetic properties for each explored site. Data ranges reflect the diversity of soil types and conditions across various sites. NA: not available.
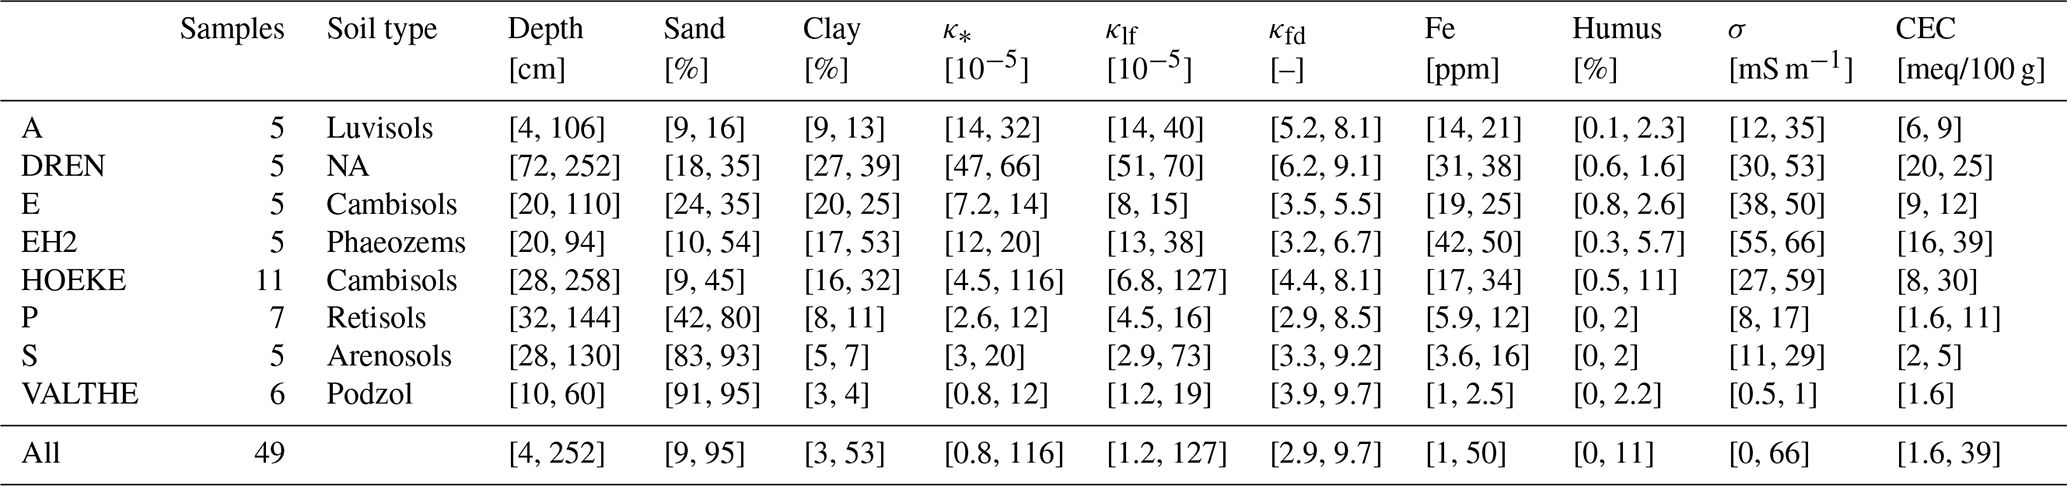
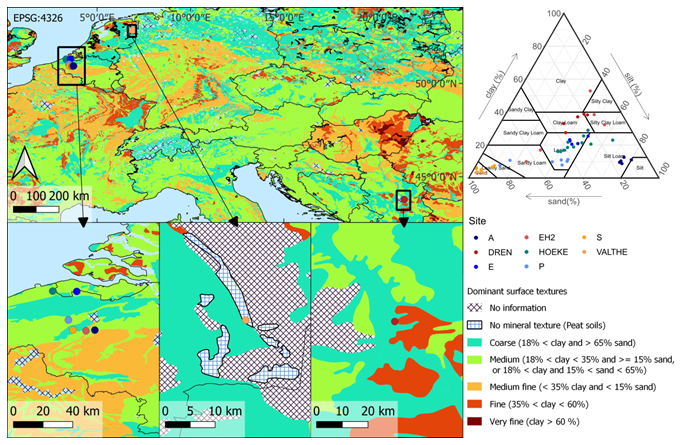
Figure 1Locations of the study sites. Background shows dominant surface texture (European Soil Database v2.0, 2004). Colors represent the texture of the sites: sandy in yellowish, silty in blueish, and clayey in reddish. The United States Department of Agriculture (USDA) texture triangle shows the particle size distribution categorized by sampling site (adapted from Mendoza Veirana et al., 2023).
Magnetic susceptibility κ was measured using a Kappabridge MKF1-FA (AGICO Instruments, Brno, Czech Republic), in addition to the field κ measurements. Prior to these laboratory measurements, corrections were made to eliminate the influence of the diamagnetic sample holder. Samples were placed in 10 cm3 plastic holders, and the in-phase κ was recorded at both low frequency (κlf) and high frequency (κhf) (976 and 15 616 Hz, respectively). Thus, the percentage frequency dependent magnetic susceptibility (κfd) was calculated as
Additionally, the absolute difference () was calculated. Such measurements are used to detect the presence of superparamagnetic ferrimagnetic minerals occurring as ultrafine (<0.03 µm) crystals (mostly ultrafine magnetite and maghemite) produced largely by pedogenic biochemical processes in soil (Dearing, 1994). Samples where ultrafine minerals are present will show increased frequency-dependent magnetic susceptibility; samples without such minerals will show identical κ values at the two frequencies.
To support magnetic observations, elemental analyses were performed to evaluate the total iron content concentration (Fe) of all samples through X-ray fluorescence (XRF, Niton XL3t GOLDD+, Thermo Fisher Scientific Inc., USA) on samples that passed a 0.5 mm sieve and were placed in capsules covered with 4−6 m cellophane. Three consecutive XRF measurements were performed and averaged for each sample.
2.2 Model development
The absence of previous attempts at developing a CEC PTF using soil κ data that can be generalized beyond the site-specific highlights the importance of thorough data exploration. We chose to build polynomial models due to their interpretability, simplicity, and the use of only one tuning parameter (polynomial degree), which is suitable given the relatively small dataset (n=49).
Field and laboratory measured soil properties were used as features for predicting CEC (target variable). These are soil depth, water pH, humus, clay, silt, sand, bd, σ, κ∗, κlf, κfd, κfd abs, and Fe. All (13) features were used to develop univariable polynomial regressions, and multivariable models were created by combining features in pairs, resulting in 91 feature combinations. The top four combinations in terms of test performance were compared to the standard combination of clay and humus content; additionally, single features were considered (clay, σ, and κ∗).
Since model performance was largely dependent on clay content, the samples were divided into sandy (n=25) and clayey (n=24) groups, using the median clay content (16.1 %) as a threshold. Both input datasets were split randomly into training (70 %) and testing (30 %) subsets, without consideration of any soil characteristics. This approach ensured that samples from different sites, soil horizons, and physicochemical properties were mixed during data splitting. To further ensure an unbiased model evaluation, the training and testing process was repeated 100 times. The best polynomial degree (linear or quadratic) was determined by the highest median of the R2 test scores over the 100 repetitions (Tibshirani et al., 2001). Finally, model implementation was performed after tuning and feature selection using all the samples of each subset.
2.3 Statistical analysis
Predicting CEC based on soil properties, particularly focusing on magnetic characteristics, is a multivariate problem. Commonly, many variables are linearly correlated with CEC, such as clay, κ, Fe, humus, and σ. The challenge lies in distinguishing between independent and masked effects. Importantly, the positive correlation between κ and CEC may be due to the strong correlation between clay content and both CEC and κ (Mello et al., 2020).
To address this, we quantified the independent correlation between κ and CEC, irrespective of the effects of clay, by calculating the partial correlation, that is, the correlation between the residuals of the linear fitting of the covariable (clay) with the variables (κ and CEC).
3.1 Data exploration
A general variable exploration analysis is presented in this section, which is fundamental for the model development in the next section. Spearman's rank correlations between all the features mentioned and target can be seen in Fig. 2. As expected, soil κ is less correlated to CEC than common soil properties such as clay and sand, water pH, and θ, while Fe and σ correlate strongly with CEC. Additionally, consistent with the findings of Mello et al. (2020) and Ayoubi et al. (2018), there is a positive correlation between clay and κ (both κ∗ and κlf). Also in line with Maier et al. (2006), σ is not correlated significantly to κ. Conversely, sand correlates negatively with both κ and Fe.
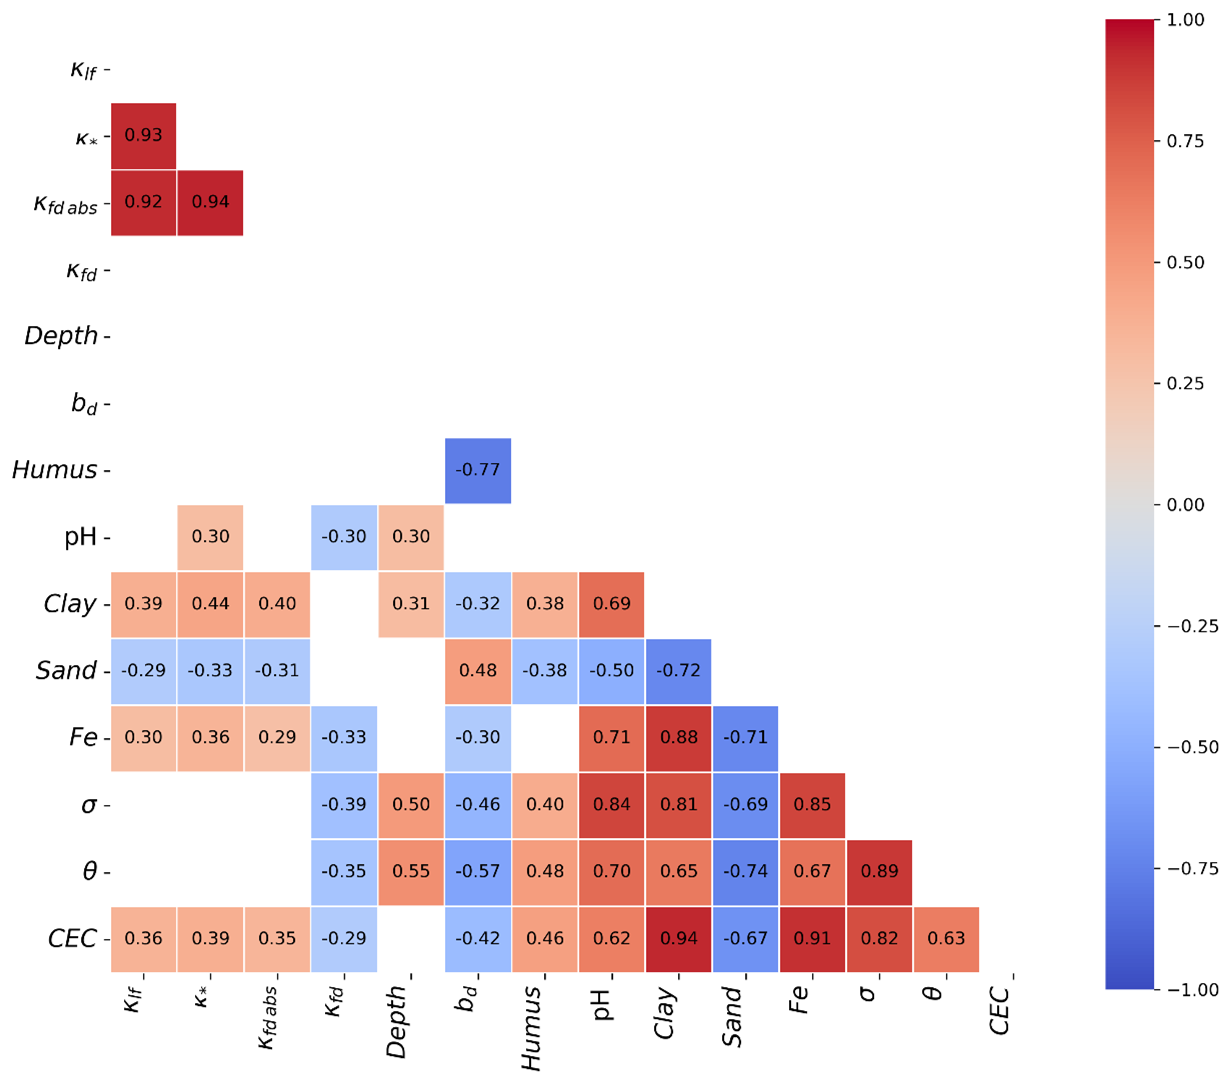
Figure 2Spearman rank correlation heatmap showing significant P-values ≤ 0.005 for the 49 soil samples; missing correlations have P-values > 0.005.
Comparing soil κ∗ to κlf reveals a similar trend across the entire range of observations (10−5 to 10−3) (see Fig. 3). This trend persists despite κ∗ being measured in undisturbed soil structures with field bulk density, while κlf was obtained from repacked samples that do not preserve the field structure and density. Additionally, the measurement frequency for κ∗ (8 kHz) differs from that of κlf (∼ 1 kHz).
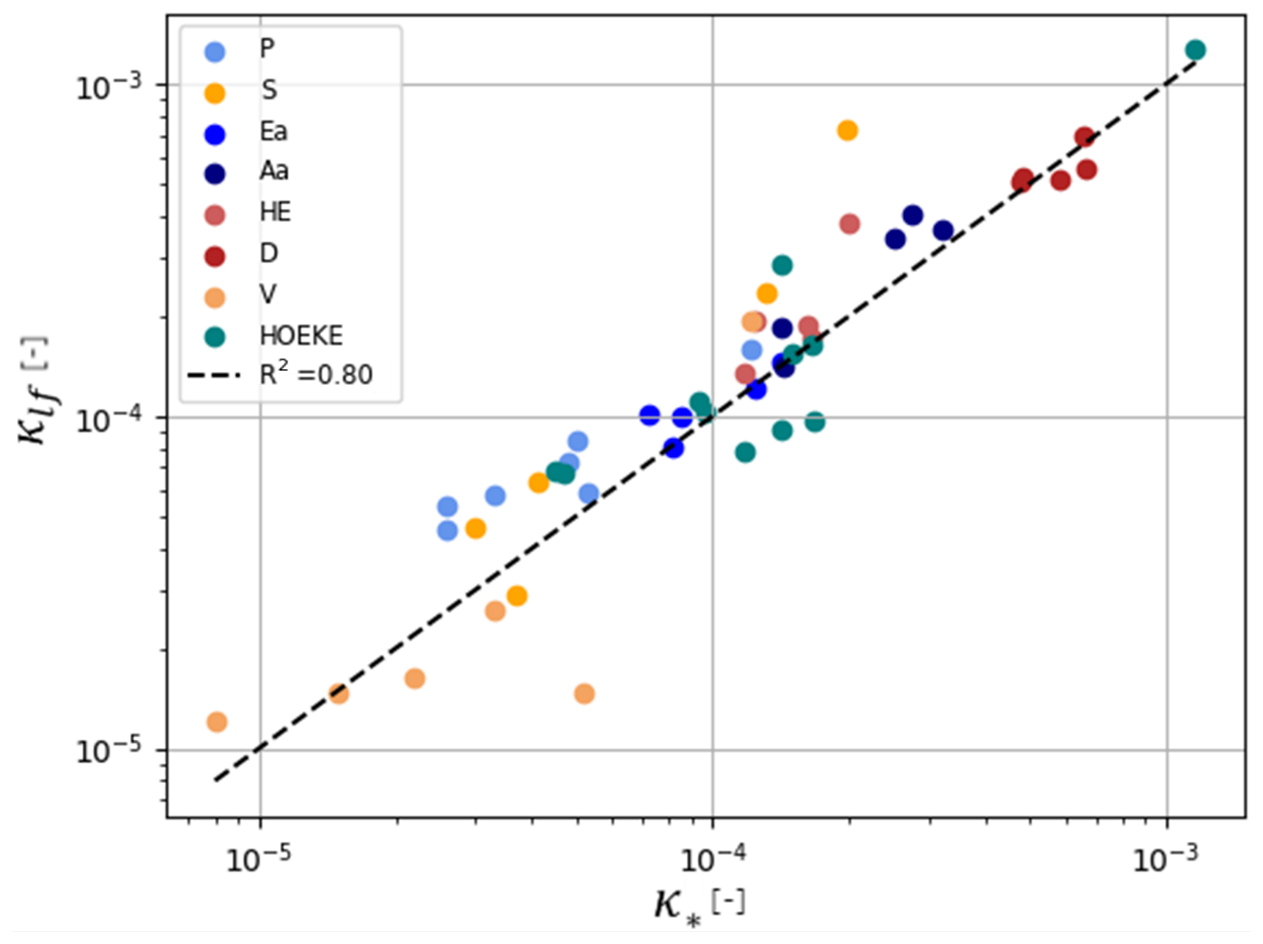
Figure 3Logarithmic scatter plot showing the in situ obtained magnetic susceptibility (κ∗) vs. the laboratory-observed low-frequency magnetic susceptibility (κlf).
3.2 CEC modeling
Model training and testing was performed in sandy and clayey groups independently. The predictors for CEC, with the best overall model performance, turned out to be highly dependent on the group. Notably, using σ and κ∗ provided the best prediction results on the sandy group, with training and testing median R2 values of 0.95 and 0.85, respectively (see Fig. 4). This performance is significantly higher than that achieved with the commonly used features, such as clay and humus content, which had a median test R2=0.38. Additionally, the combination of sand and pH performed equally well, followed closely by combinations of κ∗ and κlf features.
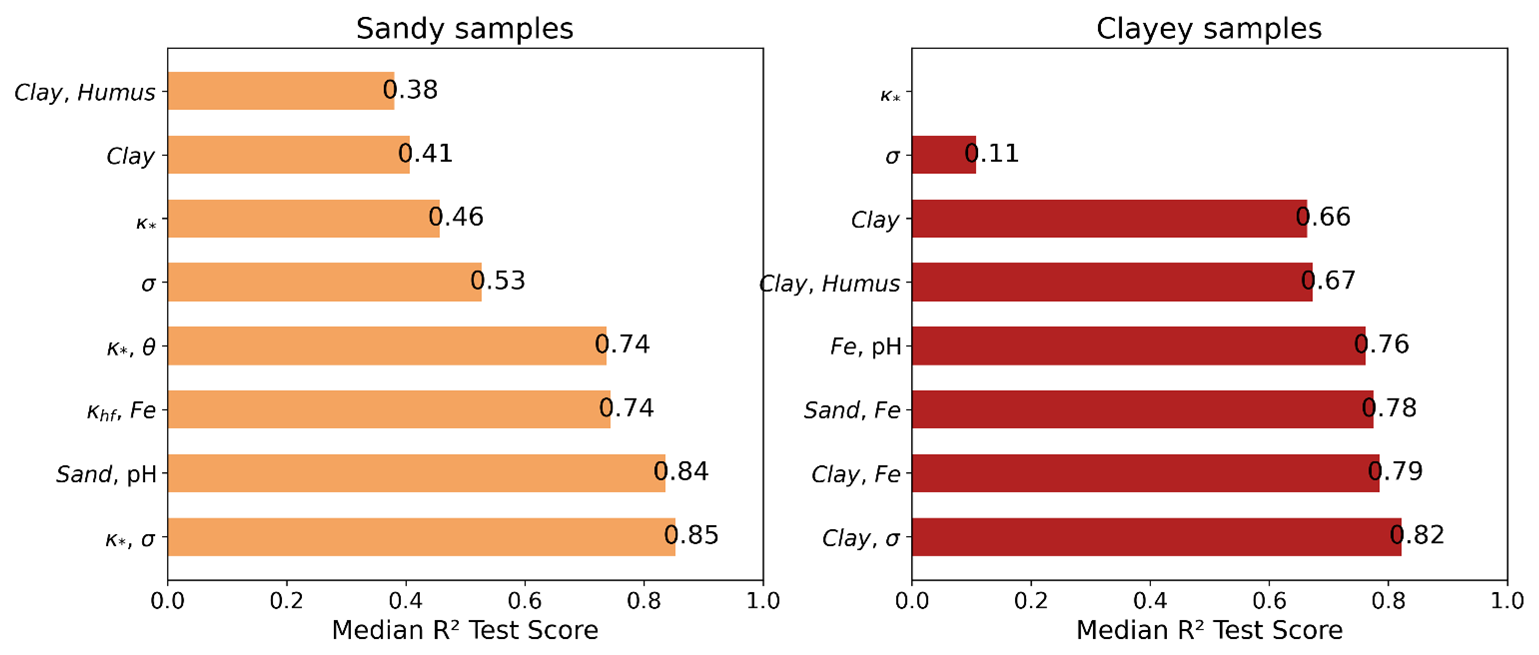
Figure 4Horizontal bar plot showing test model performances of CEC prediction based on different features (vertical axis) for sandy and clayey samples. Features shown here are the top four in performance (bottom), and κ∗, σ, clay, and the pair clay, humus.
The strong performance of σ and κ∗ as predictors of CEC in sandy soils (median test R2=0.85) is particularly noteworthy. It is known that σ is influenced by several factors including soil water content, salinity, and the concentration of dissolved ions, which collectively can reflect the variable component of CEC (Glover, 2015). In sandy soils, which typically have lower water and nutrient retention capacities, σ can provide a dynamic measure of the available exchangeable cations at a given time. Concurrently, the strong predictive capacity of κ∗ suggests it captures a different, yet complementary, aspect of CEC. In soils with low clay content, and therefore limited colloid surface area, the permanent component of CEC is likely more affected by minerals. The fact that κ∗, measured in situ, performed better than laboratory κ suggests that the undisturbed soil structure and field conditions are crucial for this relationship, possibly reflecting the spatial arrangement and contact of these minerals within the soil matrix. Additionally, both σ and κ∗ can be quickly measured in field conditions without the need for invasive sampling. Therefore, after implementing the best CEC PTF for sandy samples (see Fig. 5),
where κ∗ is unitless, σ is in mS m−1, and CEC is in meq/100 g.
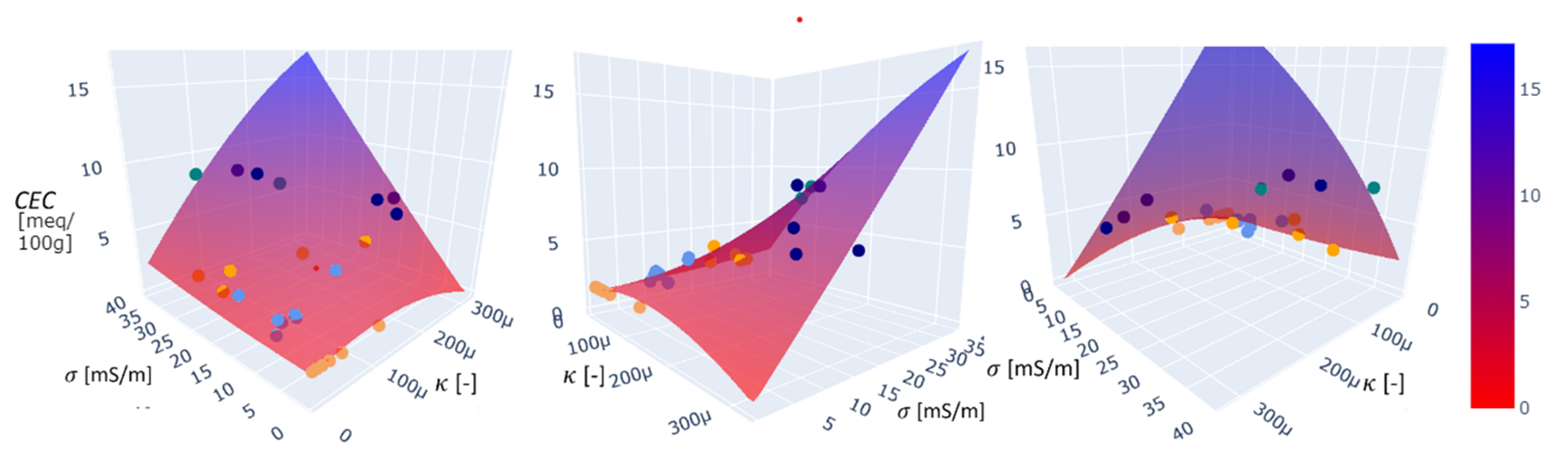
Figure 5Implemented CEC PTF for sandy samples (clay < 16.1) (Eq. 2) with R2=0.94. The model is colored in vertical axis from red to blue to visualize its shape. Colored dots represent the samples used in the sandy group, belonging to different sites that match the colors in Fig. 1.
For clayey samples, σ and clay features resulted in the best performance with the training and testing R2 equal to 0.89 and 0.82, respectively. This result is in line with the literature since the link between CEC, σ, and clay is well documented (Glover, 2015; Wunderlich et al., 2013). For clayey samples, κ was not an outstanding feature, likely due to the influence of a larger colloid surface that may not be effectively characterized by κ.
κ∗–CEC statistics
The partial correlation between κ∗ and CEC, while controlling for (removing the effect of) clay, was found to be 0.61 for sandy samples, and −0.14 for clayey samples. This indicates that in sandy samples, κ∗ is only partially influenced by clay. For clayey samples, however, κ∗ is heavily influenced by the soil's clay content, making the correlation between κ∗ and CEC minor if the effect of clay is removed. Consequently, predicting CEC using clay alone is as effective as using both clay and κ∗ (median testing R2 of 0.66 and 0.64, respectively), while κ∗ alone is a poor predictor (see Fig. 4).
The current study, while providing novel insights, has several limitations that also point towards important future research directions.
First, the main limitation of the analyzed results is related to the dataset size, which, although diverse in terms of European soil types, is relatively small. A larger sample size could improve the statistical relevance of the findings and improve the robustness and generalizability of the developed PTFs (Van Looy et al., 2017). Future work should aim to expand the database with more samples covering an even wider range of soil properties and parent materials.
Second, all collected samples come from nontropical regions, where organic matter content and bacterial activity do not significantly influence soil κ. In contrast, these factors may contribute substantially to higher soil CEC in other environments (Seybold et al., 2005). Therefore, the results are valid for the sampled sites that belong to European soils, and applications to scenarios beyond this range of soils should be approached with caution.
Third, a significant limitation is the lack of direct mineralogical analysis, especially for clay and iron oxide fractions. While κ offers an indirect proxy for ferrimagnetic mineralogy, detailed characterization (e.g., via X-ray diffraction) is needed for a causal understanding of the κ–CEC link. Identifying specific clay minerals (like kaolinite vs. smectite) and their abundance would clarify their CEC contributions and interactions with magnetic minerals. This is a crucial step to move beyond empirical correlations toward a process-based understanding.
Fourth, while field-measured κ proved useful, the reasons for its superiority over laboratory-measured κlf or κfd in the PTFs warrant further exploration. This could involve investigating the effects of soil structure and moisture content (which are preserved in in situ κ measurements). A deeper understanding of how these factors influence different κ measurements could lead to optimized measurement strategies.
Finally, the model shown in Eq. (2) is valid for samples with clay content between 2.9 % and 16.1 %, σ between 0.55 and 39 mS m−1, κ∗ between 8 and 320 µ, and CEC between 1.6 and 8.7 meq/100 g. As larger and more comprehensive datasets become available, exploring advanced modeling techniques, such as machine learning algorithms, may capture more complex, nonlinear relationships. Assessing the scalability of the κ–CEC relationship from point measurements to field-scale predictions using proximal sensing platforms, for example, vehicle-mounted EMI sensors providing dense κ data (McLachlan et al., 2022), would be beneficial.
For the first time, the link between soil κ and CEC has been explored using data that extends beyond the site level. By analyzing soil samples across Europe, encompassing a range of diverse soil physicochemical properties, we found that κ∗ significantly contributes to predicting soil CEC, particularly in sandy samples, and this contribution is linearly independent of the soil clay content. Conversely, soil κ measured in the laboratory was less effective, likely due to the disturbance of soil structure and soil density.
Based on these findings, we proposed a novel PTF for CEC in sandy samples, with a R2 of 0.94, based on σ and κ∗, which likely relate to the variable and permanent components of CEC, respectively. This PTF is valuable because both σ and κ∗ are quick and inexpensive to measure in the field, making it straightforward to predict CEC under field conditions. For instance, it can be used to quickly assess the fertility of sandy soils across agricultural fields.
Further research, along with expanding the existing database, could enhance CEC modeling and provide deeper insights into the κ∗–CEC relationship. These advances could help integrate independent geophysical properties, such as σ and κ, to quantify key soil properties such as CEC, advancing a more holistic approach towards soil characterization.
All computer code used for the data processing and modeling in this study is openly available in the GitHub repository (https://github.com/SENSE-UGent/kappa-CEC, last access: 10 September 2025) and archived at https://doi.org/10.5281/zenodo.13971643 (Mendoza Veirana et al., 2024).
The dataset supporting the findings of this study, including all field measurements and laboratory analyses, is publicly available and archived at Zenodo under https://doi.org/10.5281/zenodo.13971643 (Mendoza Veirana et al., 2024). This dataset is our own original data collected and processed as part of this research.
The interactive computing environment used in this study is available at https://doi.org/10.5281/zenodo.13970660 (Mendoza Veirana, 2024).
PS, MV, and JV designed the surveys and carried them out. MV developed the model code, performed the simulations, and contributed to statistical formal analysis along with HG. JV, HG, PS, and WC gave writing advice. MV prepared the manuscript with contributions from all co-authors.
The contact author has declared that none of the authors has any competing interests.
Publisher's note: Copernicus Publications remains neutral with regard to jurisdictional claims made in the text, published maps, institutional affiliations, or any other geographical representation in this paper. While Copernicus Publications makes every effort to include appropriate place names, the final responsibility lies with the authors.
This article is part of the special issue “Agrogeophysics: illuminating soil's hidden dimensions”. It is not associated with a conference.
Special thanks go to the Institute of Geophysics of the Czech Academy of Sciences for their support in this research.
Text readability of an earlier version of this article and code performance were boosted by using generative AI (ChatGPT 4o, OpenAI).
This research has been supported by the Bijzonder Onderzoeksfonds UGent (grant no. 01IO4120).
This paper was edited by Dongxue Zhao and reviewed by two anonymous referees.
Ayoubi, S., Mohsen, J., and Hossein, K.: Multiple linear modeling between soil properties, magnetic susceptibility and heavy metals in various land uses, Mod. Earth Syst. Environ., 4, 579–589, https://doi.org/10.1007/s40808-018-0442-0, 2018.
Busenberg, E. and Clemency, C. V.: Determination of the cation exchange capacity of clays and soils using an ammonia electrode, Clays Clay Miner., 21, 213–217, https://doi.org/10.1346/CCMN.1973.0210403, 1973.
Chapman, H. D.: Cation-exchange capacity, Agron. Monogr., 9, 891–901, https://doi.org/10.2134/agronmonogr9.2.c6, 1965.
Ciesielski, H., Sterckeman, T., Santerne, M., and Willery, J. P.: A comparison between three methods for the determination of cation exchange capacity and exchangeable cations in soils, Agronomie, 17, 9–16, https://doi.org/10.1051/agro:19970102, 1997a.
Ciesielski, H., Sterckeman, T., Santerne, M., and Willery, J. P.: Determination of cation exchange capacity and exchangeable cations in soils by means of cobalt hexamine trichloride, effects of experimental conditions, Agronomie, 17, 1–7, https://doi.org/10.1051/agro:19970101, 1997b.
Dearing, J. A.: Environmental magnetic susceptibility: using the Bartington MS2 system, Chi Publ., Abingdon, 70 pp., ISBN 0-9523409-0-9, 1994.
Dearing, J. A., Hay, K. L., Baban, S. M. J., Huddleston, A. S., Wellington, E. M. H., and Loveland, P. J.: Magnetic susceptibility of soil: an evaluation of conflicting theories using a national data set, Geophys. J. Int., 127, 728–734, https://doi.org/10.1111/j.1365-246X.1996.tb04044.x, 1996.
Emamgolizadeh, S., Bateni, S. M., Shahsavani, D., Ashrafi, T., and Ghorbani, H.: Estimation of soil cation exchange capacity using genetic expression programming and multivariate adaptive regression splines, J. Hydrol., 529, 1590–1600, https://doi.org/10.1016/j.jhydrol.2015.08.025, 2015.
Garré, S., Blanchy, G., Caterina, D., De Smedt, P., Romero-Ruiz, A., and Simon, N.: Geophysical methods for soil applications, Ref. Mod. Earth Syst. Environ. Sci., 5, 444–458, https://doi.org/10.1016/B978-0-12-822974-3.00152-X, 2022.
Ghorbani, H., Kashi, H., Hafezi Moghadas, N., and Emamgholizadeh, S.: Estimation of soil cation exchange capacity using multiple regression, artificial neural networks, and adaptive neuro-fuzzy inference system models in Golestan Province, Iran, Commun. Soil Sci. Plant Anal., 46, 763–780, https://doi.org/10.1080/00103624.2015.1006367, 2015.
Glover, P. W. J.: Geophysical properties of the near surface earth: electrical properties, in: Treatise on Geophysics, 2nd Edn., edited by Schubert, G., Elsevier, Amsterdam, 89–137, https://doi.org/10.1016/B978-0-444-53802-4.00189-5, 2015.
Grossman, R. B. and Reinsch, T. G.: 2.1 Bulk Density and Linear Extensibility, Methods of Soil Analysis, edited by: Dane, J. H., and Clarke Topp, G., https://doi.org/10.2136/sssabookser5.4.c9, 2002.
IUSS Working Group WRB: World reference base for soil resources, international soil classification system for naming soils and creating legends for soil maps, 4th edn., IUSS, Vienna, 226 pp., ISBN 979-8-9862451-1-9, 2022.
Jordanova, N.: Soil magnetism: applications in pedology, environmental science and agriculture, Academic Press, London, ISBN 978-0-12-809239-2, 2017.
Khaledian, Y., Brevik, E. C., Pereira, P., Cerdà, A., Fattah, M. A., and Tazikeh, H.: Modeling soil cation exchange capacity in multiple countries, Catena, 158, 194–200, https://doi.org/10.1016/j.catena.2017.07.002, 2017.
Logsdon, S. D., Green, T. R., Seyfried, M., Evett, S. R., and Bonta, J.: Hydra probe and twelve-wire probe comparisons in fluids and soil cores, Soil Sci. Soc. Am. J., 74, 5–12, https://doi.org/10.2136/sssaj2009.0189, 2010.
Maher, B. A.: Magnetic properties of modern soils and Quaternary loessic paleosols: paleoclimatic implications, Palaeogeogr. Palaeocl., 137, 25–54, https://doi.org/10.1016/S0031-0182(97)00103-X, 1998.
Maier, G., Scholger, R., and Schön, J.: The influence of soil moisture on magnetic susceptibility measurements, J. Appl. Geophys., 59, 162–175, https://doi.org/10.1016/j.jappgeo.2005.09.001, 2006.
McLachlan, P., Schmutz, M., Cavailhes, J., and Hubbard, S. S.: Estimating grapevine-relevant physicochemical soil zones using apparent electrical conductivity and in-phase data from EMI methods, Geoderma, 426, 116033, https://doi.org/10.1016/j.geoderma.2022.116033, 2022.
Mello, D., Demattê, J. A. M., Silvero, N. E. Q., Di Raimo, L. A. D. L., Poppiel, R. R., Mello, F. A. O., Souza, A. B., Safanelli, J. L., Resende, M. E. B., and Rizzo, R.: Soil magnetic susceptibility and its relationship with naturally occurring processes and soil attributes in the pedosphere of a tropical environment, Geoderma, 372, 114364, https://doi.org/10.1016/j.geoderma.2020.114364, 2020.
Mendoza Veirana, G. M.: orbit-ugent/kappa-CEC: first release (version 0.1), Zenodo [code], https://doi.org/10.5281/zenodo.13970660, 2024.
Mendoza Veirana, G. M., Verhegge, J., Cornelis, W., and De Smedt, P.: Soil dielectric permittivity modelling for 50 MHz instrumentation, Geoderma, 438, 116624, https://doi.org/10.1016/j.geoderma.2023.116624, 2023.
Mendoza Veirana, G. M., De Smedt, P., Verhegge, J., and Grison, H.: Exploring the link between cation exchange capacity and magnetic susceptibility, Zenodo [data set], https://doi.org/10.5281/zenodo.13971644, 2024.
Miller, W. F.: Inter-regional predictability of cation-exchange capacity by multiple regression, Plant Soil, 33, 721–725, https://doi.org/10.1007/BF01378263, 1970.
Poggio, L., de Sousa, L. M., Batjes, N. H., Heuvelink, G. B. M., Kempen, B., Ribeiro, E., and Rossiter, D.: SoilGrids 2.0: producing soil information for the globe with quantified spatial uncertainty, SOIL, 7, 217–240, https://doi.org/10.5194/soil-7-217-2021, 2021.
Romero-Ruiz, A., Linde, N., Keller, T., and Or, D.: A review of geophysical methods for soil structure characterization, Rev. Geophys., 56, 672–697, https://doi.org/10.1029/2018RG000611, 2018.
Seybold, C. A., Grossman, R. B., and Reinsch, T. G.: Predicting cation exchange capacity for soil survey using linear models, Soil Sci. Soc. Am. J., 69, 856–863, https://doi.org/10.2136/sssaj2004.0026, 2005.
Siqueira, D. S., Marques, J., Matias, S. S. R., Barrón, V., Torrent, J., Baffa, O., and Oliveira, L. C.: Correlation of properties of Brazilian Haplustalfs with magnetic susceptibility measurements, Soil Use Manage., 26, 425–431, https://doi.org/10.1111/j.1475-2743.2010.00294.x, 2010.
Sumner, M. E. and Miller, W. P.: Cation exchange capacity and exchange coefficients, in: SSSA Book Series 5, edited by: Sparks, D. L., Page, A. L., Helmke, P. A., Loeppert, R. H., Soltanpour, P. N., Tabatabai, M. A., Johnston, C. T., and Sumner, M. E., Soil Sci. Soc. Am., Am. Soc. Agron., Madison, 1201–1229, https://doi.org/10.2136/sssabookser5.3.c40, 2018.
Tibshirani, R., Friedman, J., and Hastie, T.: The elements of statistical learning: data mining, inference, and prediction, Springer, New York, ISBN 978-0-387-95357-0, 2001.
Van Looy, K., Bouma, J., Herbst, M., Koestel, J., Minasny, B., Mishra, U., Montzka, C., Nemes, A., Pachepsky, Y. A., Padarian, J., Schaap, M. G., Tóth, B., Verhoef, A., Vanderborght, J., van der Ploeg, M. J., Weihermüller, L., Zacharias, S., Zhang, Y., and Vereecken, H.: Pedotransfer functions in Earth system science: challenges and perspectives, Rev. Geophys., 55, 1199–1256, https://doi.org/10.1002/2017RG000581, 2017.
Verhegge, J., Mendoza Veirana, G. M., Cornelis, W., Crombé, P., Grison, H., De Kort, J.-W., Rensink, E., and De Smedt, P.: Working the land, searching the soil: developing a geophysical framework for Neolithic land-use studies, project introduction, methodology, and preliminary results at “Valther Tweeling”, Notae Praehistoricae, 41, 187–197, 2021.
Wunderlich, T., Petersen, H., Hagrey, S. A., and Rabbel, W.: Pedophysical models for resistivity and permittivity of partially water-saturated soils, Vadose Zone J., 12, vzj2013.01.0023, https://doi.org/10.2136/vzj2013.01.0023, 2013.
ZH Instruments: Magnetic susceptibility meter SM-30, user's manual, ZH Instruments, Brno, 28 pp., http://www.zhinstruments.com/assets/sm-30-manual.pdf (last access: 9 September 2025), 2022.
- Abstract
- Introduction
- Methods
- Results and discussion
- Limitations and further directions
- Conclusions
- Code availability
- Data availability
- Interactive computing environment (ICE)
- Author contributions
- Competing interests
- Disclaimer
- Special issue statement
- Acknowledgements
- Financial support
- Review statement
- References