the Creative Commons Attribution 4.0 License.
the Creative Commons Attribution 4.0 License.
 | 14 Jul 2025
Measurement of greenhouse gas fluxes in agricultural soils with a flexible, open-design automated system
Samuel Franco-Luesma
María Alonso-Ayuso
Benjamin Wolf
Borja Latorre
Jorge Álvaro-Fuentes
Over the last decades and due to the current climate change situation, the study of the impacts of human activities on climate has reached great importance, with agriculture being one of the main sources of soil greenhouse gas. There are different techniques to quantify the soil gas fluxes, such as micrometeorological techniques or chamber techniques, with the last one being capable of assessing different treatments at the same site. Manual chambers are the most common technique. However, manual chambers are characterized by low sampling frequency; typically, one sample per day is considered to be a high sampling frequency. Therefore, a great deal of effort is required to monitor short-term emission events such as fertilization or rewetting. For this reason, automated chamber systems present an opportunity to improve soil gas flux determination, but their distribution is still scarce due to the cost and challenging technical implementation. The objective of this study was to develop an automated chamber system for agricultural systems and to compare it with a manual chamber system. Moreover, over a period of 1 month, the soil gas fluxes were determined by both systems to compare their capabilities in capturing the temporal variability of soil gas emissions. The automated system reported soil greenhouse gas (GHG) fluxes that were up to 58 % and 40 % greater for CO2 and N2O fluxes compared to the manual chamber system. Additionally, the higher sampling frequency of the automated chamber system allowed us to capture the daily flux variations, resulting in a more accurate estimation of cumulative soil gas emissions. Furthermore, the assessment of various sampling intervals for single-day measurements indicated that between 10:00 and 12:00 LT was the optimal time interval for soil gas sampling in order to obtain representative daily emissions. This study emphasizes the importance of chamber dimension and shape in the development of chamber systems, as well as the sampling frequency and sampling hour for manual chamber systems.
- Article
(2982 KB) - Full-text XML
-
Supplement
(661 KB) - BibTeX
- EndNote


Agriculture and land use changes are significant contributors to climate change, accounting for 22 % of total global emissions of greenhouse gases (GHGs) (IPCC, 2023). Moreover, agricultural emissions are expected to increase along with food demand (Wiebe et al., 2019). Microbial activity is the primary driver of the production and emission of different soil GHGs. Microbial processes are influenced by several abiotic factors such as soil water content, soil temperature, or nutrient availability. The different farming practices – i.e. crop rotation, fertilization, irrigation – have a significant impact on these factors, and, therefore, they can have a great influence on soil GHG emissions (Oertel et al., 2016). By accurately measuring soil GHG emissions, it is possible to identify the major sources and to understand the impacts associated with various farming practices. This valuable information can be provided to policymakers and regulators to develop science-based policies and regulations that incentivize farmers to adopt more sustainable practices. Thus, measuring soil GHG emissions in agriculture is crucial to promote sustainable farming practices that can mitigate climate change.
The use of manual chambers is one of the most widespread methods for studying soil GHG emissions at small spatial and temporal scales (Collier et al., 2014). Chambers are designed to establish an enclosed environment, facilitating the periodic collection of gases emitted from or consumed in the soil. Subsequently, the gas samples are subjected to laboratory analysis through gas chromatography (Harvey et al., 2020). These analyses determine the concentration of GHGs within the chamber headspace and allow for the calculation of emission rates based on the change in gas concentration over a given time span. This method is characterized by its simplicity and versatility as chambers are relatively simple to use and can be employed across diverse ecosystems and soil types (de Klein et al., 2020). Manual chambers are relatively simple to construct and can be tailored to fit specific research requirements. Besides, compared to alternative methods, they entail relatively low costs. However, they also have some limitations. For instance, their measurement frequency is restricted due to the time-intensive nature of manual sampling and subsequent analysis, making high-frequency sampling impractical. Usually, sampling frequency is not higher than one sampling per day, but it is well established that sampling frequency affects annual GHG estimations (Barton et al., 2015; Parkin, 2008; Savage et al., 2014). For this reason, efforts are often concentrated on intense sampling frequencies during short periods (hours to days) when significant emission peaks are expected; however, later, during the rest of the campaign, samplings are carried out every 1 to 4 weeks (or, sometimes, are even not considered). Another aspect to consider involves the notable soil disruption caused when samples need to be collected, such as after an irrigation event.
In contrast to manual chambers, the utilization of automated chambers coupled with an in situ gas analyser allows for sampling at a higher temporal frequency. Consequently, these automated systems more comprehensively capture temporal variations, enhancing insight into the dynamics of soil GHG emissions on a daily and seasonal basis (Grace et al., 2020). Automation also ensures the capturing of fluxes linked to unexpected events (such as rainstorms), the obtainment of data in areas that are difficult to access, and the reduction of the impact of soil disturbance on measurements. However, this method requires costly equipment and skilled operators and implies different infrastructure constraints, factors that result in lower spatial coverage compared to what can be achieved with manual systems. Moreover, these automated chamber systems are beginning to be manufactured and distributed by companies dedicated to the manufacture of gas analysers, with the limitation that these are closed systems to be modified. Based on this situation, over recent decades, several groups have crafted automated systems (Lognoul et al., 2017; Lawrence and Hall, 2020).
To date, the number of experiments using automated chambers coupled with in situ gas analysers is scarce, and, as far as we have been able to find out, none of these previous studies used chamber systems consisting of a total of 12 individual chambers. The objective of this paper is to present an innovative non-commercial soil GHG measurement system based on automated chambers linked to an in situ photoacoustic multi-gas analyser and to describe its operational details. A comparison between this automated system and the manual static chamber methodology is also presented.
2.1 Automated-system description
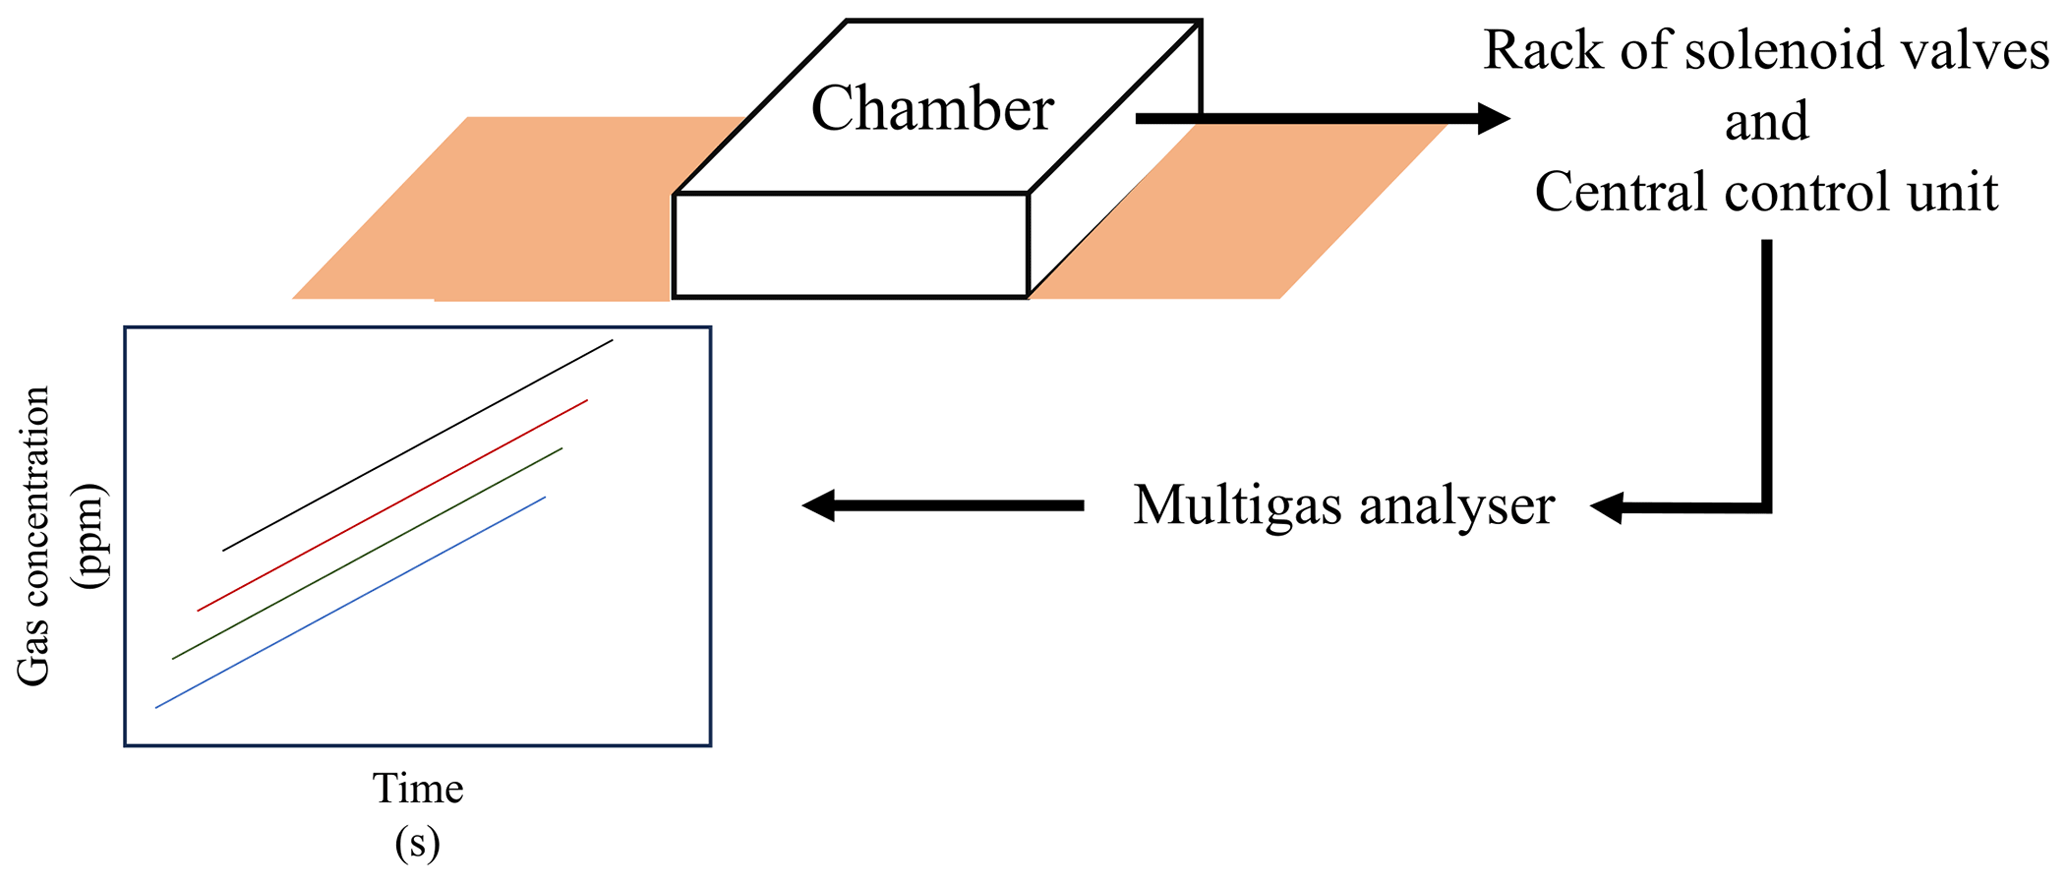
In this section, we present an automated chamber system tailored for monitoring soil gas emissions. By integrating openness, cost-effectiveness, and versatility, this system facilitates precise and dynamic measurements of soil GHG fluxes. Our design principles focused on building an adaptable, configuration, and real-time functionality, alluding to its potential importance in agricultural and environmental research. The system consists of three main parts: the chambers, the set of solenoid valves controlled by a computer (central control unit), and the multi-gas analyser (Fig. 1).
2.2 Soil chamber design
Soil chambers, using the “Queensland” design, were built following a model provided by the Terrestrial Bio-Geo-Chemistry Division of the Institute of Meteorology and Climate Research Atmospheric Environmental Research (IMK-IFU) (Karlsruhe Institute of Technology (KIT)). Chambers consisted of an aluminium structure of 0.50 m×0.50 m length and width and 0.15 m height, closed with methacrylate panels and two lids of 0.50 m×0.25 m width and length that are controlled by four pneumatic actuators, specifically two per lid (Fig. 2a). The lids open at a 90° angle, allowing for rainfall or irrigation water supply to reach the soil surface of the area covered by the chambers. All methacrylate panels were coated with an aluminium bubble foil to keep the internal chamber temperature homogeneous during the enclosure time. Moreover, a rubber seal was fixed to the lids and to the bottom part of each chamber to ensure a hermetic close and to avoid gas leakage during the sampling process.
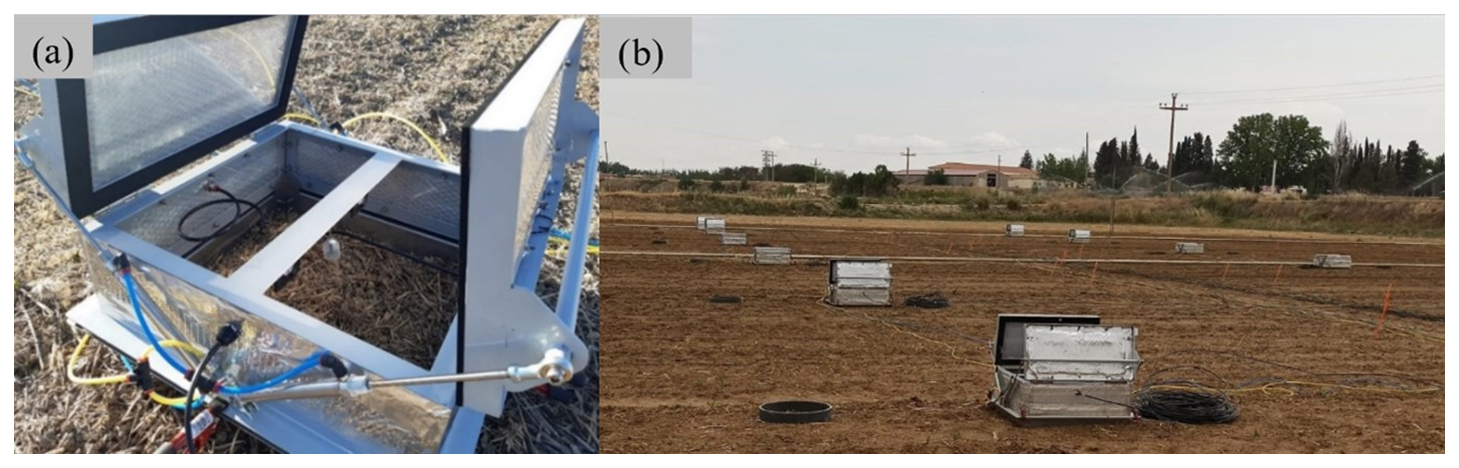
Figure 2(a) Open automated chamber deployed in the field trial (Queensland design). (b) Set of chambers deployed in the field trial. Dark rings next to chambers are the bases for the manual chambers.
The gas sample line (polyethylene-coated aluminium tube, Eaton Synflex, 6/4 mmm external/internal diameter) entered each chamber via one of the side panels, positioned approximately halfway up. In the central area of the chamber, the tube was bent facing downwards, and the tip was protected by a small PVC (polyvinyl chloride) funnel to prevent water condensation at the tube inlet. A vent (matching the material and diameter of the gas sampling line) was positioned on the opposite side panel to equalize pressure between the chamber's interior and exterior during flux measurements. Moreover, each chamber had two small fans (, 12 V, 4000 rpm; EVERCOOL EC6025L12EA) to promote air mixing inside the chamber.
Three chambers were equipped with a threaded cable gland on a lateral methacrylate panel for mounting a thermistor (107, Campbell Scientific Ltd., UK) to monitor the internal chamber temperature. Chambers were attached by clamps to stainless steel bases (), with sharp edges at the bottom that were inserted 0.10 m into the soil. Plants (crops and weeds) growing inside the chambers were cut since the crop during this experiment was maize (Zea mays L.) (Fig. 2b). The cost of each chamber, including the solenoid valve and the sampling line, is EUR 600.
2.3 Automated chamber operation
The chambers opened and closed by means of pneumatic actuators. This setup comprised an air compressor delivering pressure to the pneumatic actuators. Inside a shed located next to the field trial, three solenoid valves installed in a panel received air from the compressor (6 bar) and directed compressed air to the chambers. Routing of compressed air was facilitated by an external relay controller (eight-channel relay board; 24 V, 6.5 A; YWBL-WH) directly linked to the computer. In the configuration of this study, three sets of four chambers each opened and closed simultaneously. Similarly, each sampling line from each chamber was connected to a two-way solenoid valve that regulated the entry of the gas sample from each of the chambers into the photoacoustic multi-gas analyser (Gasera One, Gasera Ltd., Finland). The two-way solenoid valves were connected to a relay board (16-channel relay board; 24 V, 6.5 A; YWBL-WH) that controlled which valve was activated (Fig. 3).
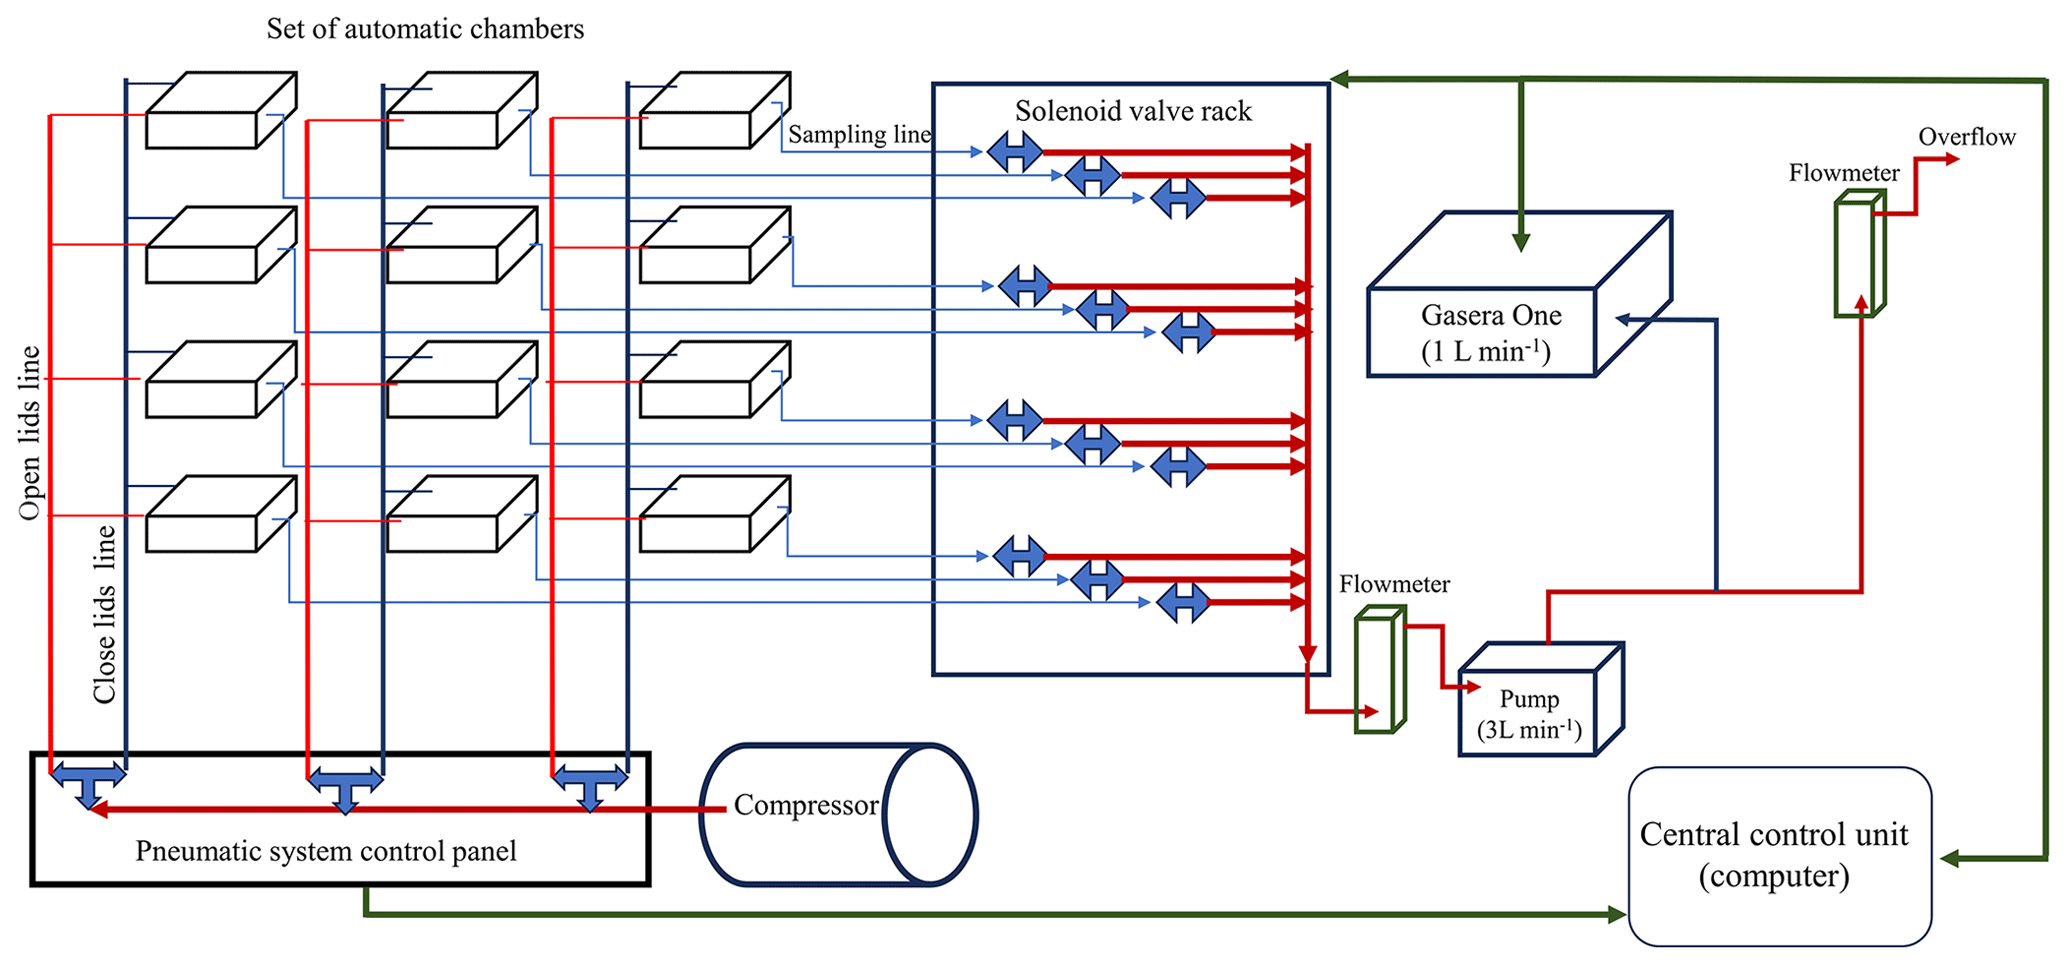
To bring the gas from the chamber to the gas analyser, an external diaphragm pump (KNF NMP830KNDC 12 V, KNF Neuberger Inc., Freiburg im Breisgau, Germany) was coupled to the two-way solenoid valve bank. This pump continuously drew air from the activated sampling line, maintaining a flow rate of 3 L min−1. The gas analyser (analysis cell volume of 30 mL) drew sample gas from this primary line at a rate of 1 L min−1 for a duration of 6 s every 1.5 min (Fig. 3c). Two flowmeters were attached to the main line. The initial one, positioned after the pump and before the gas analyser, regulated the gas flow delivered to the analyser. The second flowmeter ensured a continuous overflow greater than 1 L min−1, guaranteeing sufficient gas flow from the active sampling line to the gas analyser (Fig. 3).
The solenoid valve banks, pneumatic system, chamber sampling lines, and gas analyser were all managed through a custom script created using R statistical software version 4.2.2 (R Core Team, 2022). This R script, governed by the time taken by the analyser to process the sample, can be easily modified by setting the total number of chambers or, if it is necessary to work by blocks, by setting the number of blocks and the number of chambers per block. One of the advantages of this system is the self-made multiplexer that allows us to modify the number of chambers easily compared to other multiplexers like the Gasera Multipoint Sampler (Gasera Ltd., Finland), which has a close configuration of 8 or 12 channels. Moreover, the use of relay boards that could be configured by Arduino or easily integrated into the R script as the selected ones – as an alternative to control modules, for example, I-7060D (ICP DAS Co., Ltd.), that only have four channels per module – simplifies the configuration of the script since, with only one board, it is possible to handle all of the chambers. For this field experiment, the current setup consists of three blocks of four chambers each block. This configuration responds to the needs of the current experimental design; however, since it is an open system, the configuration is variable and can be individualized for each of the chambers.
2.4 Evaluation of the automated measurement system
Over the last decade, the current research team's members have successfully conducted several GHG flux studies using a manual closed-chamber system (Álvaro-Fuentes et al., 2016; Franco-Luesma et al., 2019, 2020a, b, 2022). Based on that, an evaluation experiment was carried out to compare the soil gas fluxes obtained via the newly developed automated chamber system against the conventional manual chamber system used regularly by the research group. This evaluation experiment was aimed at evaluating the impact of (i) the chamber design and (ii) the sampling frequency and time on the differences in soil GHG fluxes between a manual and an automated chamber measurement system.
Manual chambers consisted of a polyvinyl chloride (PVC) cylinder of 0.315 m diameter and 0.2 m height coated with white thermal paint to keep the internal air temperature from increasing during the deployed time. Each chamber was placed within a PVC collar of the same diameter, inserted 0.05 m into the soil. A rubber septum was affixed atop the chamber to enable gas sampling via a plastic syringe equipped with a needle. Gas samples from each chamber were transferred to a 12 mL pre-evacuated glass vial (Exetainer Labco®). The concentrations of CO2, CH4, and N2O in the gas samples were determined by gas chromatography using the Agilent 7890B (Agilent, Santa Clara, CA, United States) equipped with an autosampler (PAL3 autosampler, Zwingen, Switzerland). Soil gas fluxes were determined based on the increase in the gas concentration during the deployment period. Further details regarding the gas chromatography method and manual chamber design can be found in Franco-Luesma et al. (2022).
The evaluation experiment took place in a maize (Zea mays L.) field trial sown on 10 May 2023 under irrigation conditions. The soil is a Typic Xerofluvent (Soil Survey Staff, 2015) with a silty loam texture, characterized by a basic pH of 8, a calcium carbonate content (CaCO3) of 48 %, a total organic carbon content of 0.6 %, and a bulk density of 1.33 g cm−3 in the first 0.25 m soil depth. The area is characterized by a Mediterranean semiarid climate, with a mean annual air temperature of 14.1 °C, mean annual precipitation of 298 mm, and mean annual reference evapotranspiration (ETo) of 1243 mm. The meteorological data were obtained from a meteorological station situated 0.5 km from the experimental site.
The evaluation experiment had two different steps. The first step consisted of simultaneous gas sampling with both manual and automated chamber systems on four different dates (i.e. 19, 20, 21, and 28 June 2023). On 19 and 20 June, chambers were sampled once during 08:00 to 09:30 LT. On 21 and 28 June, chambers were sampled four times between 08:00 to 14:00 Local Time (LT). Consequently, a total of 10 samplings were performed, covering 4 different days and different hours of the day to capture the possible diurnal variation in soil gas emissions.
In this short-time experiment, two chambers of each block were selected to compared with the manual chambers. The sampling sequence for the automated system was programmed to sample each chamber every 5 min, with a total enclosure time of 28 min. However, due to the sequence configuration, the computable time for determining the soil gas fluxes was 20 min, as described in the sequence diagram (Fig. S1 in the Supplement). The two manual chambers of each block were closed at the same time as the automated chamber, and gas sampling was done at 0 min (first automated chamber sampling), at 10 min, and at 20 min (coinciding with the last automated chamber sampling).
The second step of the evaluation experiment consisted of assessing the impact of the sampling time (i.e. hour of the day) and sampling frequency (i.e. 16 daily measurements vs. 1 daily measurement for the automated and the manual chamber systems, respectively) on the estimation of the soil gas fluxes. For this purpose, from 22 May to 29 June 2023, soil CO2, CH4, and N2O fluxes were measured simultaneously by the manual and automated chamber systems in the same field experiment.
During this period, the sampling frequency and configuration of the automated chamber system were the same as what was used during step one of the evaluation experiments. The 12 chambers were grouped into three sets of 4 chambers each, with sampling every 5 min for 28 min, resulting in a total of five sampling points per chamber (Fig. S1). However, the procedure followed in the manual chamber system was different, and it consisted of the collection of three gas samples at 0, 20, and 40 min after closing the chamber. The sampling frequency followed a daily frequency over the first 5 d and, afterwards, weekly measurements till the end of the experiment. For both chamber systems, the measuring instruments (i.e. photoacoustic multi-gas analyser and gas chromatography for automated and manual chamber systems, respectively) were calibrated by using four different ultra-high-purity gas standards (Carburos Metálicos, Barcelona, Spain; standard 1: 400 ppm CO2, 1.5 ppm CH4, 0.3 ppm N2O; standard 2: 800 ppm CO2, 2 ppm CH4, 1 ppm N2O; standard 3: 1500 ppm CO2, 4 ppm CH4, 3 ppm N2O; standard 4: 3000 ppm CO2, 6 ppm CH4, 6 ppm N2O) in order to standardize the concentration values obtained.
2.5 Data analysis
The soil gas flux (mg gas m2 d1) of CO2, CH4, and N2O – i.e. , , and – was calculated using the following equation (Eq. 1):
where Fit represents the linear increase in the gas concentration in the chamber over the enclosure time, MW is the molar weight of the atom in the gas molecule (i.e. 12 g mol−1 for CO2–C and CH4–C and 28 g mol−1 for N2O–N), p is the atmospheric pressure in Pa, h is the chamber height in m, R is the ideal gas constant in , T is the chamber air temperature in K, fT is the correction factor of time units (1440 min d−1), and fU is the unit correction factor (103). Cumulative soil CO2, CH4, and N2O emissions were calculated using the trapezoid rule (Levy et al., 2017). Comparison between systems was done by means of linear fitting considering only soil gas fluxes that presented a value of R2 higher than 0.8. Moreover, the comparison of cumulative emissions between chamber systems over 1 month was evaluated by one-way ANOVA. All analyses were done using the R statistical software version 4.2.2 (R Core Team, 2022).
3.1 Automated-system comparison
The comparison between the automated and manual measurement systems showed a linear response for the three gases compared. In the case of soil CO2, the automated system presented an average flux 58 % greater than that of the manual system, with a minimal flux difference of 425 mg CO2-C m2 d1 (Fig. 4a). Data exhibited moderate dispersion (R2=0.60), revealing increased accuracy when manual fluxes were greater than 500 mg CO2-C m2 d1 (Fig. 4a). With regard to CH4 fluxes, the automated chamber system showed values greater than the fluxes obtained in the manual chamber system, showing a better fitting when fluxes were positive (Fig. 4b). However, the lowest data dispersion between both measurement systems was obtained for soil N2O fluxes (R2>0.87), but, as observed for the other two gases, the automated chamber system reported fluxes values 40 % greater than those of the manual chamber system (Fig. 4c).
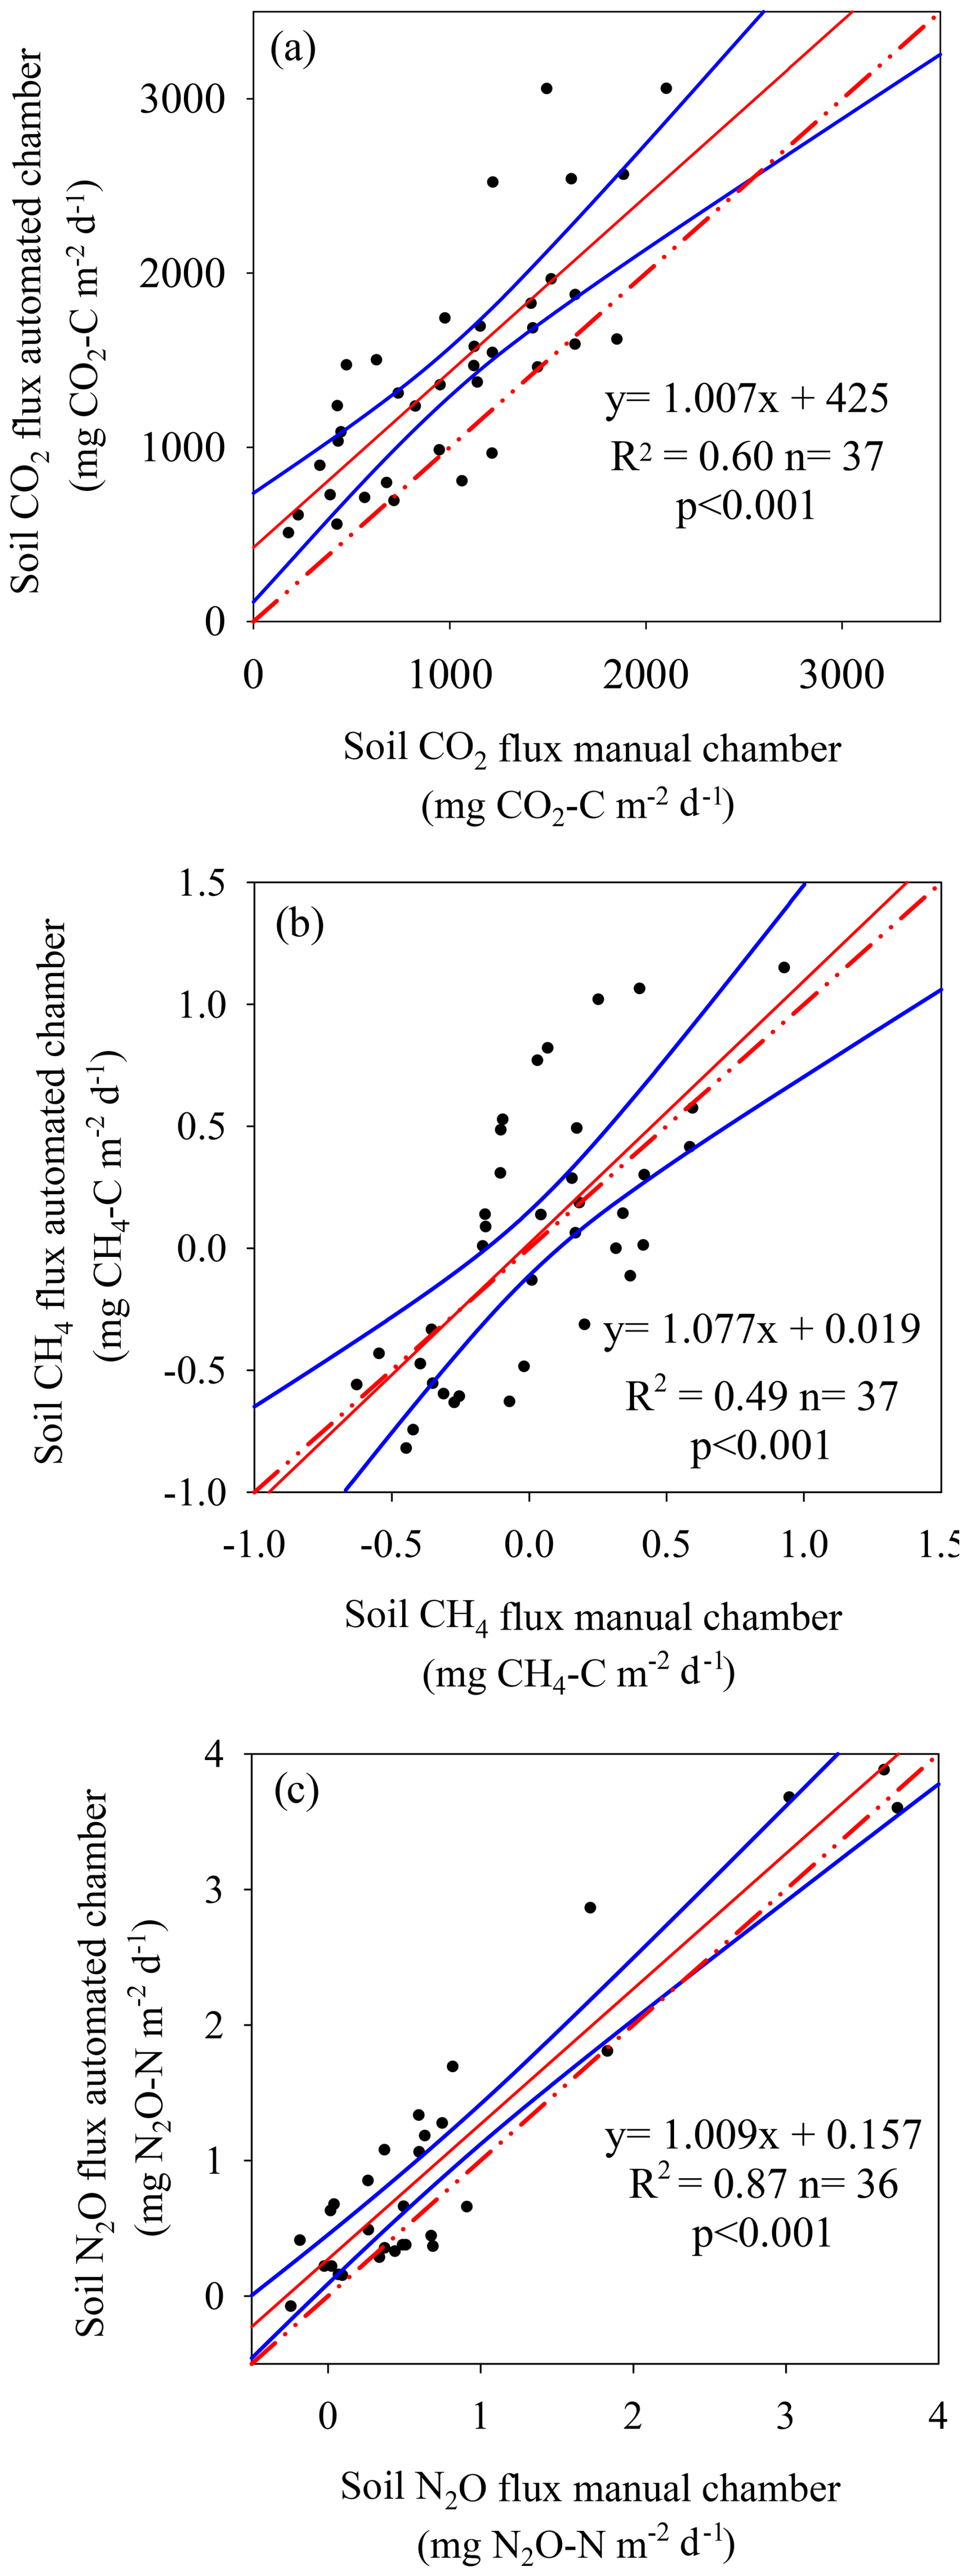
Figure 4Comparison of soil gas flux between automated and manual chamber systems for carbon dioxide (CO2) fluxes (a), methane (CH4) fluxes (b), and nitrous oxide (N2O) fluxes (c). Solid blue lines represent 95 % confidence intervals. Dotted red lines represent the 1:1 line.
These differences between both measurement systems in terms of flux magnitude and for the three studied gases may probably be a consequence of the different chamber shapes and dimensions. Hoffmann et al. (2018) found that the shape and dimension of the chamber have a significant effect on CO2 fluxes, observing that small and cylindrical chambers tend to result in higher underestimation of CO2 fluxes compared with large and squared chambers. In line with the previous authors, Pihlatie et al. (2013) also found a significant effect of the chamber shape and dimension on soil CH4 flux determination. Similarly, Rochette and Eriksen-Hamel (2008) also concluded that chamber shape and dimensions are critical factors in the estimation of GHG fluxes.
All previous studies agreed that the area perimeter ratio is a key factor in soil gas flux estimation, and, hence, they recommended a ratio greater than 0.10 m (Clough et al., 2020). In our work, the two types of chambers compared presented different area perimeter ratios, with values of 0.125 and 0.089 m for the automated and the manual chamber systems, respectively. This difference in the area perimeter ratio could explain the greater CO2, CH4, and N2O fluxes measured by the automated chamber system compared with the manual system. Moreover, the use of fans to mix the internal air of the automated chambers might also explain the higher fluxes measured in this system compared with the manual system. Air mixing by fans is recommended to homogenize the internal air of the chamber, ensuring that the air sample aliquot is representative of the chamber headspace air (Clough et al., 2020).
In line with the previous explanation, the minimum detectable flux (MDF), following the equation presented by Nickersen (2014), was calculated for methodologies. The MDF method not only considered the accuracy of the analyser but also considered the area and volume of the chamber and the enclosure time, factors that are different between both methodologies compared in this work. The MDFs for the automated chamber system were 1.209 , 0.012 , and 0.059 , while, for the manual chamber system, MDF values were 14.050 , 0.143 , and 0.071 . MDF was greater for the automated chamber system for the three gases considering a similar enclosure time of 20 min and an average air temperature during the experiment of 20 °C. The differences in MDF found between both methodologies constituted another factor that explained the greatest flux values observed under the automated chamber system.
3.2 Sampling time and frequency comparison
The effect of sampling time and frequency on cumulative soil gas emissions was compared between the automated and the manual measurement systems. This analysis was performed over 1 month in which the automated chamber system ran continuously over the entire month, while, in the manual chamber system, sampling was only performed on nine different dates.
As expected, the automated chamber system was able to capture daily flux fluctuations, a fact that was not possible for the manual chamber system, because only one gas sampling was done for each of the selected dates (Fig. 5). However, when flux temporal dynamics for each gas were evaluated, there were observed differences for each gas.
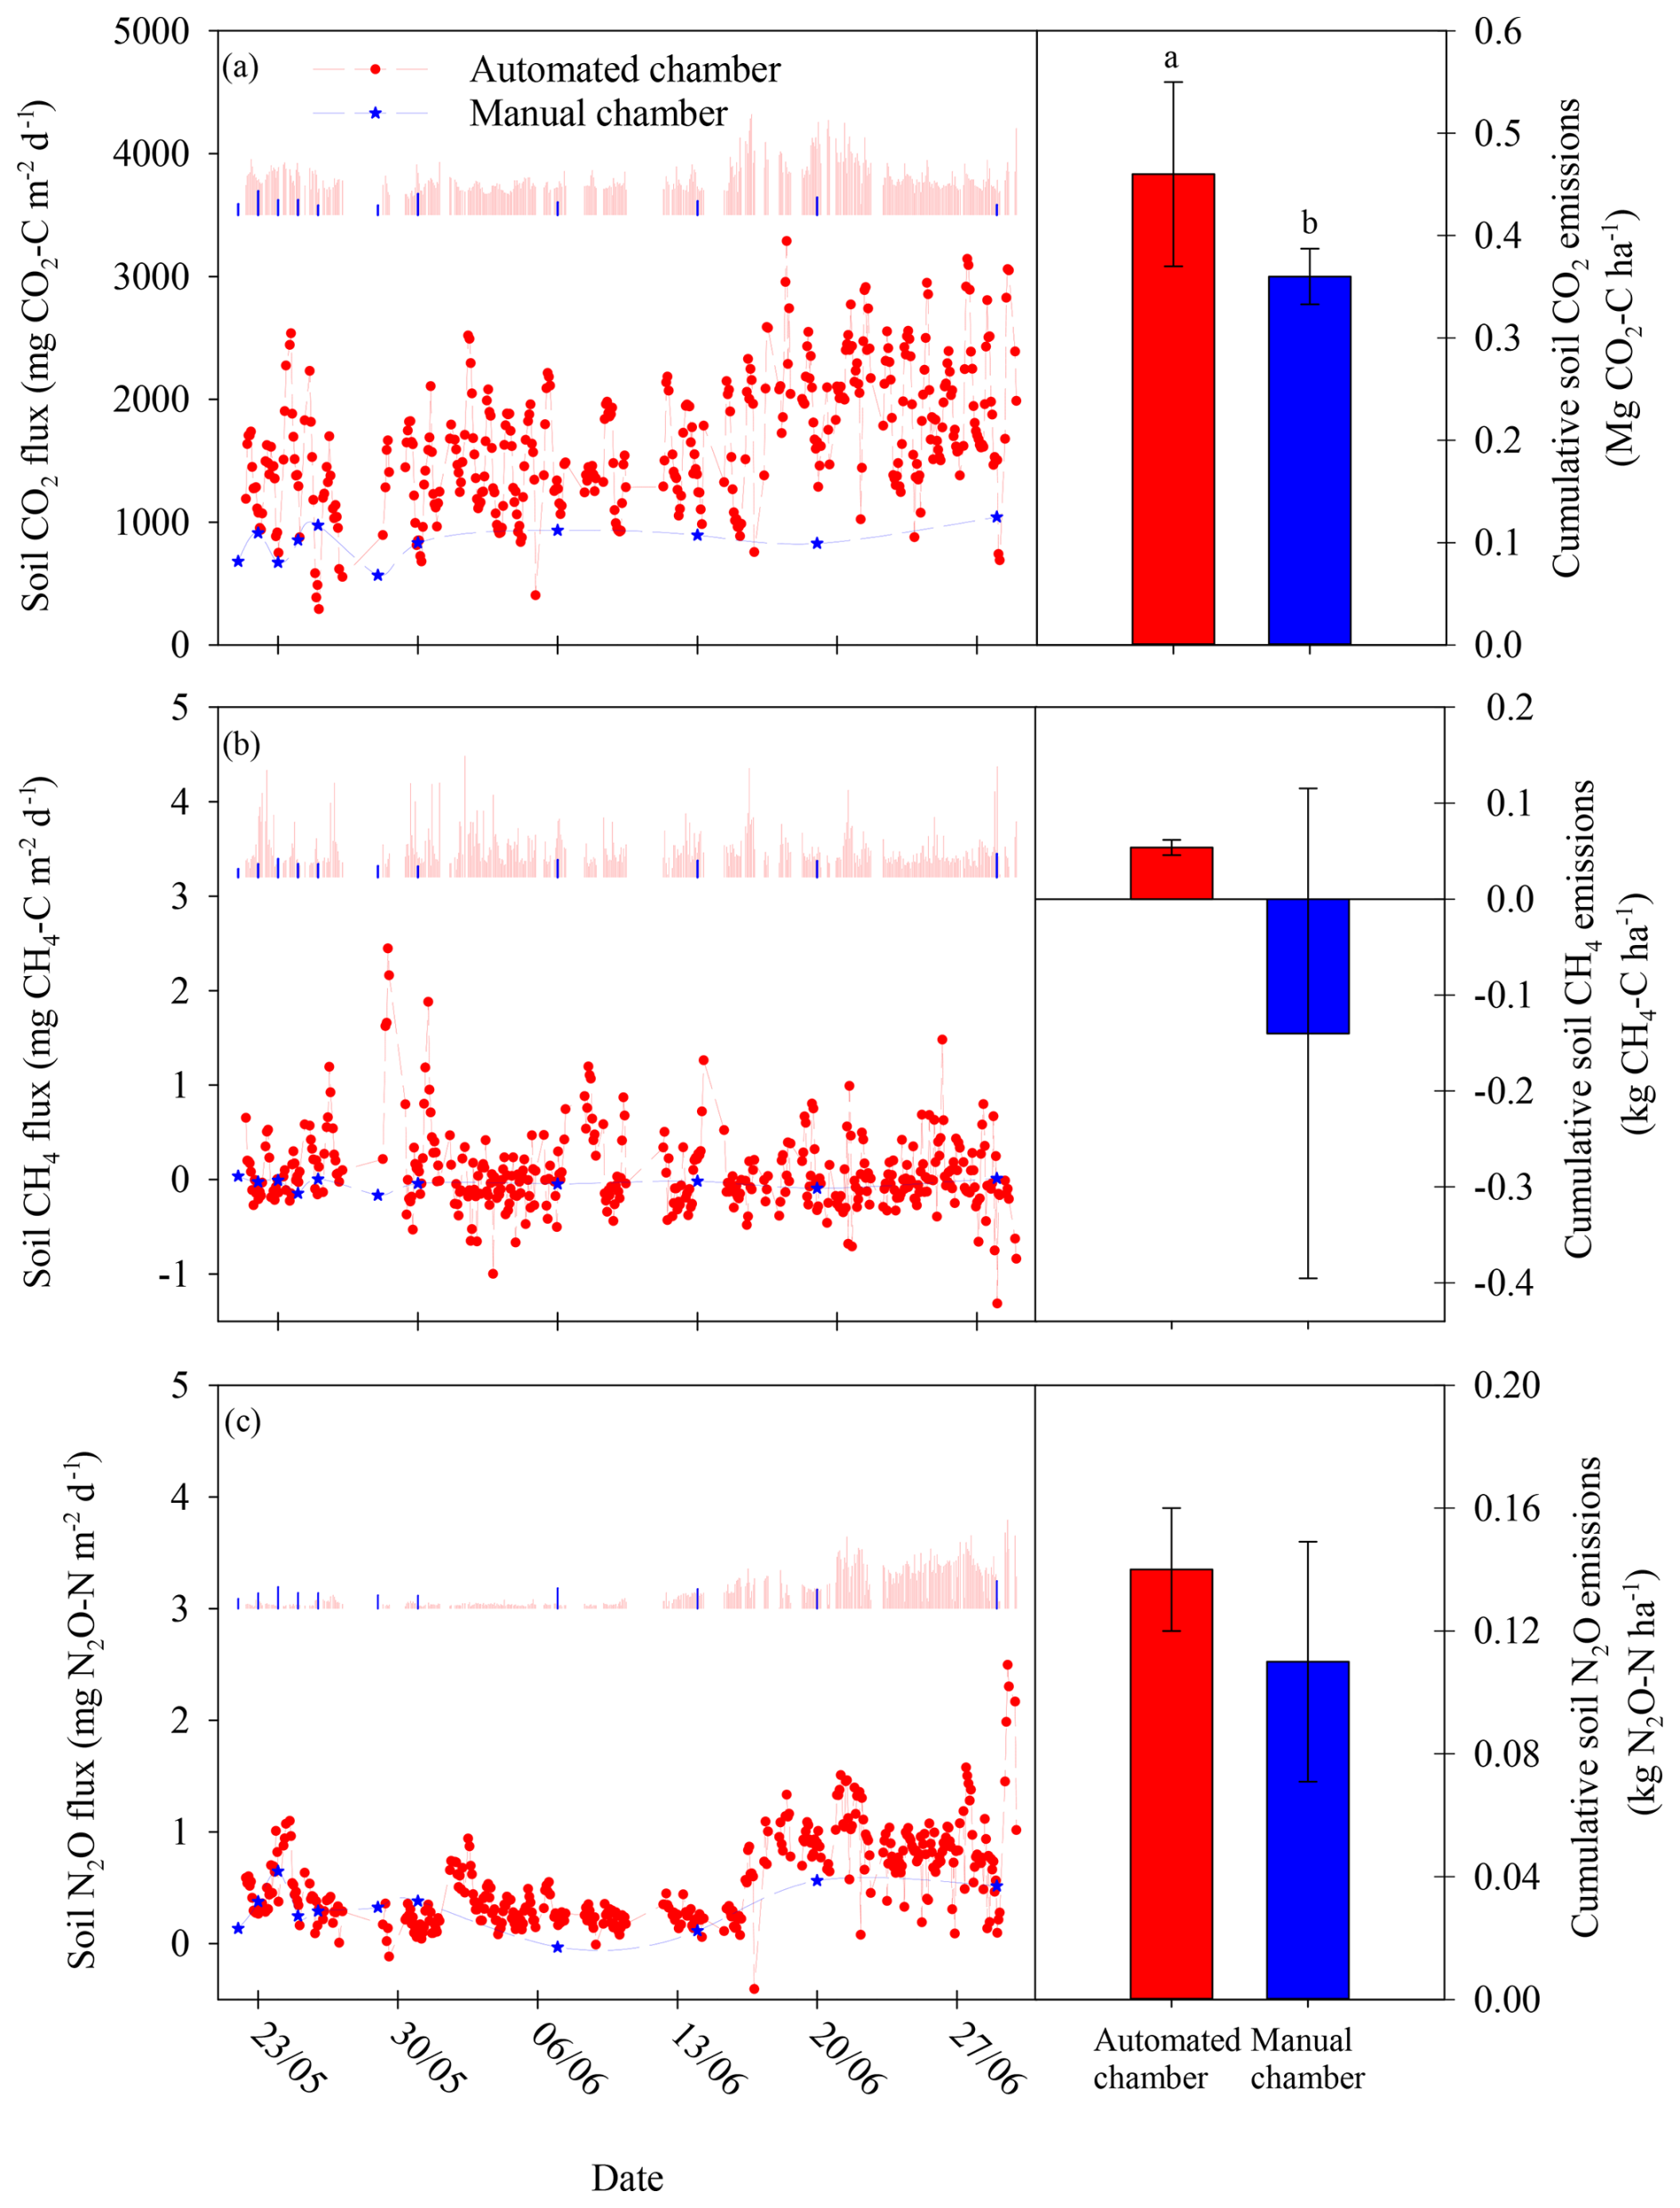
Figure 5Comparison of soil gas flux and cumulative soil gas emissions between the automated (red line and bar) and the manual (blue line and bar) chamber system for carbon dioxide (CO2) fluxes (a), methane (CH4) fluxes (b), and nitrous oxide (N2O) fluxes (c). Vertical solid lines represent the standard error SE (left panel) and the cumulative soil emissions for the automated chamber systems (red bar) and manual chamber system (blue bar) (right panel).
Soil CO2 and CH4 fluxes determined by the manual chamber system showed similar behaviour, presenting a low variation in the flux magnitude over the evaluated period, being more pronounced for soil CH4 fluxes (Fig. 5a and b). For example, this was clearly observed for CH4, for which the automated system captured flux peaks greater than 2 , while the manual fluxes were close to 0 over the entire measuring period (Fig. 5b). Interestingly, the manual system was able to capture the temporal emission trend shown by the automated system for soil N2O fluxes, the gas that showed the greatest temporal variability over the period studied (Fig. 5c).
The cumulative soil gas emissions of the three gases tended to be greater for the automated than for the manual measurement system (Fig. 5). For example, cumulative soil CO2 emissions presented significant differences between both sampling systems. The automated chamber system showed average values that were 16 % greater than those of the manual chamber system (Fig. 5a). Indeed, this difference was even greater in CH4 (more than 3-fold greater cumulative emissions in the automated than in the manual measurement system, Fig. 5b). Cumulative CH4 emissions showed positive values for the automated chamber system, while the average value for the manual chamber system was negative. However, the variability observed for the manual chamber system was 10 times greater than for the automated chamber system, a fact that resulted in the absence of significant differences between both sampling systems. Cumulative soil N2O emissions did not show significant differences between sampling systems despite the fact that the average cumulative N2O emissions were 20 % greater for the automated chamber system (Fig. 5c). As occurred with cumulative CH4 emissions, the manual chamber system showed a greater variability than the automatic chamber system; this could explain the absence of significant differences between sampling systems.
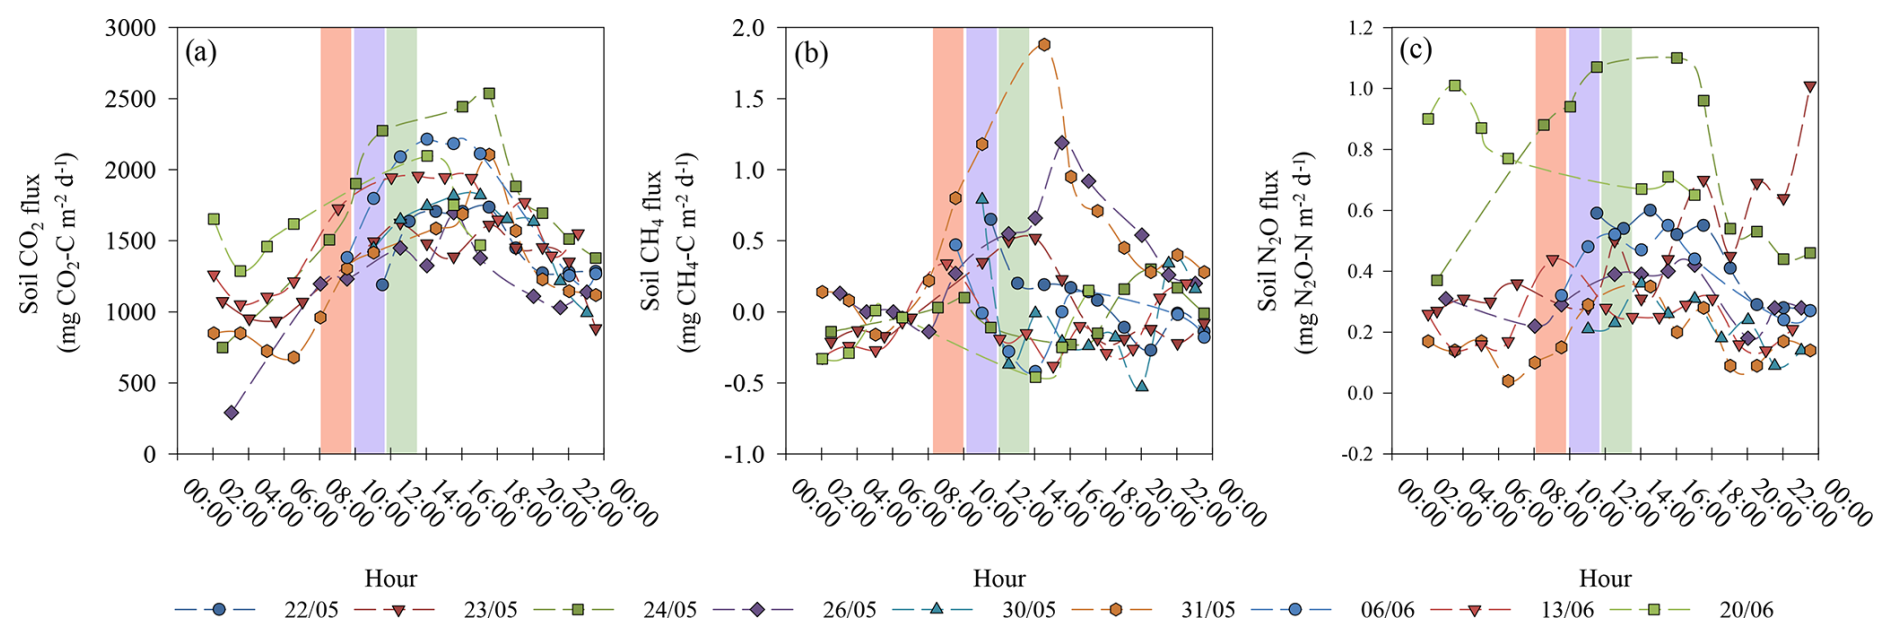
Figure 6Daily soil gas flux determined by the chamber system for carbon dioxide (CO2) (a), methane (CH4) fluxes (b), and nitrous oxide (N2O) fluxes (c). Vertical solid bars represent the 2 h intervals of 08:00 to 10:00 LT (red), 10:00 to 12:00 LT (purple), and 12:00 to 14:00 LT (green), selected for evaluating the daily bias between sampling hours.
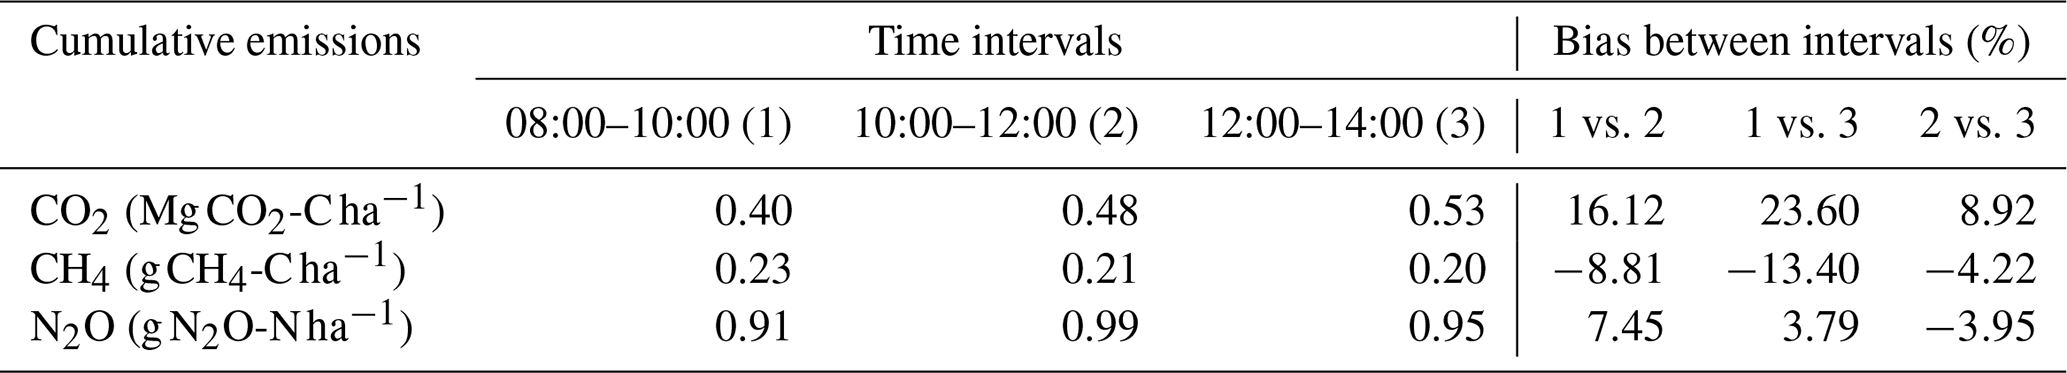
Table 1Cumulative soil emissions (carbon dioxide, CO2; methane, CH4; nitrous oxide, N2O) at three different time intervals (08:00–10:00 LT, 10:00–12:00 LT, 12:00–14:00 LT).
Differences in the different cumulative emissions found between measurement systems might have been explained by the next three points: (i) construction differences, (ii) the sampling time in the manual system, and (iii) the height enclosure time ratio (Clough et al., 2020). The automated chamber presented higher area perimeter ratios and air mixing by fans, which could contribute to the greater fluxes found in this system compared with the manual system. Regarding the sampling time, this was especially critical for CO2. Manual sampling was performed at 08:00 LT, resulting in an underestimation of the average daily emissions (Pumpanen et al., 2003; Yu et al., 2013). In contrast, for N2O, underestimation was lower since 08:00 LT is considered to be a sampling time close to the optimal time for this gas (Wu et al., 2021; Reeves et al., 2016; Francis Clar and Anex, 2020). Finally, the height enclosure time ratio is also an important factor that affects the sensibility of the flux determination. As a recommendation, a height enclosure time ratio greater than 0.40 m h−1 is suggested to increase the minimum detectable flux and to reduce the impacts on air humidity, temperature, and the gas diffusion process, variables that govern the soil gas fluxes between soil and the atmosphere (Clough et al., 2020). In our study, the automated system resulted in height enclosure ratios of 0.60 m h−1, while, in the manual system, the ratios dropped to 0.30 m h−1, explaining the lower cumulative emissions reported by the manual system.
Moreover, when the daily emission pattern of the automated chamber was evaluated, it was observed that soil CO2 fluxes presented the maximum flux rate between 10:00 and 16:00 LT, a daily pattern that responded to the changes in air and soil temperature, similarly to the results reported by Pumpanen et al. (2003) and Yu et al. (2013). The differences between maximum and minimum daily fluxes can be seen in Fig. 6a. Soil CH4 fluxes did not show a clear daily pattern, except for some dates for (26 and 31 May). Differences between the maximum and the minimum CH4 fluxes were lower since soil CH4 fluxes only ranged between −0.5 to 0.5 for most of the nine selected dates, except for 26 and 31 May, when soil CH4 fluxes above 1 were observed at midday (Ding et al., 2004; Wang and Han, 2005) (Fig. 6b).
Soil N2O fluxes also presented a daily emission pattern characterized by maximum soil N2O from 10:00 to 18:00 LT and a minimum during the nighttime, though this is not as clear as the emission pattern observed for soil CO2 fluxes (Fig. 6c). This daily emission pattern was also observed by Wu et al. (2021) in a meta-analysis which evaluated global daily N2O emission patterns. A possible explanation for the daily pattern observed in all three gases would be the temperature dependence of the biological process that governs the production and emission of soil GHGs (Lloyd and Taylor, 1994; Smith and Dobbie, 2001; Davidson and Janssens, 2006). This dependence would explain the higher emissions observed during the daytime compared to during the nighttime (Fig. 6c).
To evaluate the effect the selected sampling time for single-day measurements could have on the soil fluxes estimation, three 2 h intervals – 08:00–10:00 LT, 10:00–12:00 LT, and 12:00–14:00 LT – were selected. For cumulative soil CO2 emissions, the selected interval had a large impact on the estimation of the emissions, with cumulative emissions that were 23 % greater for the 12:00–14:00 LT intervals compared to doing the gas sampling between 08:00 and 10:00 LT (Table 1). Cumulative soil CH4 emissions presented the highest values for the 08:00–10:00 LT time interval; however, differences in terms of absolute values were too low, indicating that the sampling hour could have a lower impact on emission estimation compared to CO2 emissions, for example (Table 1). Finally, the time interval also has an impact on cumulative soil N2O emissions, with the greatest emissions for the 10:00–12:00 LT time interval. The largest difference was found between the 08:00–10:00 LT and 10:00–12:00 LT time intervals, with a difference of 7.45 % in terms of cumulative emissions (Table 1).
Based on the daily emission pattern observed coupled with the evaluation of the effect of different time intervals, sampling time (i.e. hour) can have an impact on soil gas flux estimation, especially when only one sampling is done per day, as occurred with manual chamber systems. For soil CO2 emissions, carrying out the manual sampling at 08:00 LT would result in an underestimation of 43 % with respect to the mean daily flux estimated over 24 h using the automated chamber system for the nine dates evaluated. The average soil CO2 flux determined with the manual chamber system over the nine dates was 836 , while the 24 h CO2 flux for the same nine dates as measured with the automated chamber system was 1469 . In contrast, sampling hour had a minimum impact on soil CH4 fluxes, obtaining similar average fluxes in both systems, specifically 0.066 and 0.068 for the manual and the automated chamber system, respectively.
Regarding N2O emissions, 08:00 LT was shown to be an adequate sampling hour to obtain a representative daily emission. The average soil N2O flux of the nine manual samplings was 0.38 , while the daily average for the same nine dates estimated using the automated chamber system was 0.41 ; as a result, the fluxes determined with the manual chambers showed an underestimation of 7 % compared to the daily average soil N2O flux determined with the automated chambers. Perhaps, considering the evaluation of the three different time intervals, carrying out the soil gas sampling between 10:00 to 12:00 LT could reduce this underestimation.
The presented system features an open design, cost-effective components, and an adaptable configuration, offering benefits in terms of flexibility, compatibility, and affordability; in the end, this resulted in a more precise monitoring of the time flux variability. Moreover, it has been highlighted that the shape, dimension, and configuration of the chamber system are critical factors that must be considered in the design of the chambers when it comes to setting area perimeter and height enclosure time ratios greater than 0.10 m and 0.40 m h−1, respectively. Likewise, in case there is no option to implement an automated system, the sampling time of the manual measurement system is critical, resulting in significant overestimation or underestimation. Our results showed that 08:00 LT was an optimal sampling time for soil N2O emissions but resulted in an underestimation of soil CO2 and CH4 emissions; performing the gas sampling between 10:00 to 12:00 LT reduced emission overestimations compared to the mean daily emissions, especially for CO2. Therefore, based on the results presented in this work, automated chamber systems are a powerful tool for quantifying GHG fluxes from the soil, allowing us to capture the large temporal variability that characterizes GHG emissions. However, when the implementation of an automated measurement system is not possible, the sampling time for manual chamber must be considered to avoid underestimation of soil fluxes, with the time interval between 10:00 to 12:00 LT being the most appropriate time interval.
The R code and notebooks of the automatic chamber system and the data used to compare and validate the functioning of the automatic chamber system can be found at https://doi.org/10.5281/zenodo.15189414 (Franco-Luesma et al., 2025).
All raw data can be provided by the corresponding authors upon request.
The supplement related to this article is available online at https://doi.org/10.5194/soil-11-523-2025-supplement.
SFL: conceptualization, formal analysis, software, data acquisition, writing (original draft), data curation, methodology, formal analysis, investigation. MAA: conceptualization, methodology, writing (review and editing). BW: writing (review). BL: conceptualization, methodology, software, writing (review), funding acquisition. JAF: conceptualization, methodology, writing (review and editing), supervision, project administration, resources, funding acquisition.
The contact author has declared that none of the authors has any competing interests.
Publisher's note: Copernicus Publications remains neutral with regard to jurisdictional claims made in the text, published maps, institutional affiliations, or any other geographical representation in this paper. While Copernicus Publications makes every effort to include appropriate place names, the final responsibility lies with the authors.
We are grateful to Valero Pérez Laguardia for the assistance in the in the development, construction, and maintenance of the manual and automated chamber systems.
This work was supported by the AgriGEI project, funded by the Regional Government of Aragon under the program “Proyectos de ICDCi en líneas prioritarias del Gobierno de Aragón” (grant no. LMP185_21), and by the TED project (grant no. TED2021-130837B-I00), funded by the Agencia Estatal de Investigación (AEI/MCIN/10.13039/501100011033CE9) and the European Union through NextGenerationEU/PRTR.
The article processing charges for this open-access publication were covered by the CSIC Open Access Publication Support Initiative through its Unit of Information Resources for Research (URICI).
This paper was edited by Rémi Cardinael and reviewed by two anonymous referees.
Álvaro-Fuentes, J., Arrúe, J. L., Cantero-Martínez, C., Isla, R., Plaza-Bonilla, D., and Quílez, D.: Fertilization Scenarios in Sprinkler-Irrigated Corn under Mediterranean Conditions: Effects on Greenhouse Gas Emissions, Soil Sci. Soc. Am. J., 80, 662–671, https://doi.org/10.2136/sssaj2015.04.0156, 2016.
Barton, L., Wolf, B., Rowlings, D., Scheer, C., Kiese, R., Grace, P., Stefanova, K., and Butterbach-Bahl, K.: Sampling frequency affects estimates of annual nitrous oxide fluxes, Sci. Rep.-UK, 5, 9, https://doi.org/10.1038/srep15912, 2015.
Clough, T. J., Rochette, P., Thomas, S. M., Pihlatie, M., Christiansen, J. R., and Thorman, R. E.: Global Research Alliance N2O chamber methodology guidelines: Design considerations, J. Environ. Qual., 49, 1081–1091, https://doi.org/10.1002/jeq2.20117, 2020.
Collier, S. M., Ruark, M. D., Oates, L. G., Jokela, W. E., and Dell, C. J.: Measurement of Greenhouse Gas Flux from Agricultural Soils Using Static Chambers, Jove-J. Vis. Exp., 8, e52110, https://doi.org/10.3791/52110, 2014.
Davidson, E. A. and Janssens, I. A.: Temperature sensitivity of soil carbon decomposition and feedbacks to climate change, Nature, 440, 165–173, https://doi.org/10.1038/nature04514, 2006.
de Klein, C. A. M., Harvey, M. J., Clough, T. J., Petersen, S. O., Chadwick, D. R., and Venterea, R. T.: Global Research Alliance N2O chamber methodology guidelines: Introduction, with health and safety considerations, J. Environ. Qual., 49, 1073–1080, https://doi.org/10.1002/jeq2.20131, 2020.
Ding, W., Cai, Z., and Tsuruta, H.: Diel variation in methane emissions from the stands of Carex lasiocarpa and Deyeuxia angustifolia in a cool temperate freshwater marsh, Atmos. Environ., 38, 181–188, https://doi.org/10.1016/j.atmosenv.2003.09.066, 2004.
Francis Clar, J. T. and Anex, R. P.: Flux intensity and diurnal variability of soil N2O emissions in a highly fertilized cropping system, Soil Sci. Soc. Am. J., 84, 1983–1994, https://doi.org/10.1002/saj2.20132, 2020.
Franco-Luesma, S., Álvaro-Fuentes, J., Plaza-Bonilla, D., Arrúe, J. L., Cantero-Martínez, C., and Cavero, J.: Influence of irrigation time and frequency on greenhouse gas emissions in a solid-set sprinkler-irrigated maize under Mediterranean conditions, Agr. Water Manage., 221, 303–311, https://doi.org/10.1016/j.agwat.2019.03.042, 2019.
Franco-Luesma, S., Cavero, J., Plaza-Bonilla, D., Cantero-Martinez, C., Arrue, J. L., and Álvaro-Fuentes, J.: Tillage and irrigation system effects on soil carbon dioxide (CO2) and methane (CH4) emissions in a maize monoculture under Mediterranean conditions, Soil Till. Res., 196, 104488, https://doi.org/10.1016/j.still.2019.104488, 2020a.
Franco-Luesma, S., Cavero, J., Plaza-Bonilla, D., Cantero-Martínez, C., Tortosa, G., Bedmar, E. J., and Álvaro-Fuentes, J.: Irrigation and tillage effects on soil nitrous oxide emissions in maize monoculture, Agron. J., 112, 56–71, https://doi.org/10.1002/agj2.20057, 2020b.
Franco-Luesma, S., Lafuente, V., Alonso-Ayuso, M., Bielsa, A., Kouchami-Sardoo, I., Arrúe, J. L., and Álvaro-Fuentes, J.: Maize diversification and nitrogen fertilization effects on soil nitrous oxide emissions in irrigated mediterranean conditions, Front. Environ. Sci., 10, 914851, https://doi.org/10.3389/fenvs.2022.914851, 2022.
Franco-Luesma, S., Alonso-Ayuso, M., Wolf, B., Latorre, B., and Álvaro-Fuentes, J.: AutoCam-GHG, Zenodo [code], https://doi.org/10.5281/zenodo.15189414, 2025.
Grace, P. R., van der Weerden, T. J., Rowlings, D. W., Scheer, C., Brunk, C., Kiese, R., Butterbach-Bahl, K., Rees, R. M., Robertson, G. P., and Skiba, U. M.: Global Research Alliance N2O chamber methodology guidelines: Considerations for automated flux measurement, J. Environ. Qual., 49, 1126–1140, https://doi.org/10.1002/jeq2.20124, 2020.
Harvey, M. J., Sperlich, P., Clough, T. J., Kelliher, F. M., McGeough, K. L., Martin, R. J., and Moss, R.: Global Research Alliance N2O chamber methodology guidelines: Recommendations for air sample collection, storage, and analysis, J. Environ. Qual., 49, 1110–1125, https://doi.org/10.1002/jeq2.20129, 2020.
Hoffmann, M., Pehle, N., Huth, V., Jurisch, N., Sommer, M., and Augustin, J.: A simple method to assess the impact of sealing, headspace mixing and pressure vent on airtightness of manually closed chambers, J. Plant Nutr. Soil Sc., 181, 36–40, https://doi.org/10.1002/jpln.201600299, 2018.
Intergovernmental Panel on Climate Change, IPCC: Sections, in: Climate Change 2023: Synthesis Report. Contribution of Working Groups I, II and III to the Sixth Assessment Report of the Intergovernmental Panel on Climate Change, edited by: Lee, H. and Romero, J. IPCC, Geneva, Switzerland, 35–115, https://doi.org/10.59327/IPCC/AR6-9789291691647, 2023.
Lawrence, N. C. and Hall, S. J.: Capturing temporal heterogeneity in soil nitrous oxide fluxes with a robust and low-cost automated chamber apparatus, Atmos. Meas. Tech., 13, 4065–4078, https://doi.org/10.5194/amt-13-4065-2020, 2020.
Levy, P. E., Cowan, N., van Oijen, M., Famulari, D., Drewer, J., and Skiba, U.: Estimation of cumulative fluxes of nitrous oxide: uncertainty in temporal upscaling and emission factors, Eur. J. Soil Sci., 68, 400–411, https://doi.org/10.1111/ejss.12432, 2017.
Lloyd, J. and Taylor, J. A.: On the temperature-dependence of soil respiration, Funct. Ecol., 8, 315–323, https://doi.org/10.2307/2389824, 1994.
Lognoul, M., Theodorakopoulos, N., Hiel, M. P., Regaert, D., Broux, F., Heinesch, B., Bodson, B., Vandenbol, M., and Aubinet, M.: Impact of tillage on greenhouse gas emissions by an agricultural crop and dynamics of N2O fluxes: Insights from automated closed chamber measurements, Soil Till. Res., 167, 80–89, https://doi.org/10.1016/j.still.2016.11.008, 2017.
Nickerson, N.: Evaluating gas emission measurements using minimum detectable flux (MDF), White Paper, GasFlux Inc., Halifax, Canada, 2016.
Oertel, C., Matschullat, J., Zurba, K., Zimmermann, F., and Erasmi, S.: Greenhouse gas emissions from soils – A review, Chem. Erde-Geochem., 76, 327–352, https://doi.org/10.1016/j.chemer.2016.04.002, 2016.
Parkin, T. B.: Effect of sampling frequency on estimates of cumulative nitrous oxide emissions, J. Environ. Qual., 37, 1390–1395, https://doi.org/10.2134/jeq2007.0333, 2008.
Pihlatie, M. K., Christiansen, J. R., Aaltonen, H., Korhonen, J. F. J., Nordbo, A., Rasilo, T., Benanti, G., Giebels, M., Helmy, M., Sheehy, J., Jones, S., Juszczak, R., Klefoth, R., Lobo-do-Vale, R., Rosa, A. P., Schreiber, P., Serça, D., Vicca, S., Wolf, B., and Pumpanen, J.: Comparison of static chambers to measure CH4 emissions from soils, Agr. Forest Meteorol., 171, 124–136, https://doi.org/10.1016/j.agrformet.2012.11.008, 2013.
Pumpanen, J., Ilvesniemi, H., Perämäki, M., and Hari, P.: Seasonal patterns of soil CO2 efflux and soil air CO2 concentration in a Scots pine forest: Comparison of two chamber techniques, Glob. Change Biol., 9, 371–382, https://doi.org/10.1046/j.1365-2486.2003.00588.x, 2003.
R Core Team: R: A language and environment for statistical computing, Version 4.2.2, R Foundation for Statistical Computing, Vienna, Austria, https://www.R-project.org/ (last access: 4 July 2025), 2022.
Reeves, S., Wang, W. J., Salter, B., and Halpin, N.: Quantifying nitrous oxide emissions from sugarcane cropping systems: Optimum sampling time and frequency, Atmos. Environ., 136, 123–133, https://doi.org/10.1016/j.atmosenv.2016.04.008, 2016.
Rochette, P. and Eriksen-Hamel, N. S.: Chamber measurements of soil nitrous oxide flux: Are absolute values reliable?, Soil Sci. Soc. Am. J., 72, 331–342, https://doi.org/10.2136/sssaj2007.0215, 2008.
Savage, K., Phillips, R., and Davidson, E.: High temporal frequency measurements of greenhouse gas emissions from soils, Biogeosciences, 11, 2709–2720, https://doi.org/10.5194/bg-11-2709-2014, 2014.
Smith, K. A. and Dobbie, K. E.: The impact of sampling frequency and sampling times on chamber-based measurements of N2O emissions from fertilized soils, Glob. Change Biol., 7, 933–945, https://doi.org/10.1046/j.1354-1013.2001.00450.x, 2001.
Soil Survey Staff: Illustrated guide to soil taxonomy, U.S. Department of Agriculture, Natural Resources Conservation Service, National Soil Survey Center, Lincoln, Nebraska, 2015.
Wang, Z. P. and Han, X. G.: Diurnal variation in methane emissions in relation to plants and environmental variables in the Inner Mongolia marshes, Atmos. Environ., 39, 6295–6305, https://doi.org/10.1016/j.atmosenv.2005.07.010, 2005.
Wiebe, K., Robinson, S., and Cattaneo, A.: Climate change, agriculture and food security: impacts and the potential for adaptation and mitigation, FAO, Rome, https://doi.org/10.1016/b978-0-12-812134-4.00004-2, 2019.
Wu, Y. F., Whitaker, J., Toet, S., Bradley, A., Davies, C. A., and McNamara, N. P.: Diurnal variability in soil nitrous oxide emissions is a widespread phenomenon, Glob. Change Biol., 27, 4024–4039, https://doi.org/10.1111/gcb.15791, 2021.
Yu, L. F., Wang, H., Wang, G. S., Song, W. M., Huang, Y., Li, S. G., Liang, N. S., Tang, Y. H., and He, J. S.: A comparison of methane emission measurements using eddy covariance and manual and automated chamber-based techniques in Tibetan Plateau alpine wetland, Environ. Pollut., 181, 81–90, https://doi.org/10.1016/j.envpol.2013.06.018, 2013.