the Creative Commons Attribution 4.0 License.
the Creative Commons Attribution 4.0 License.
 | 03 Jun 2025
Soil contamination in arid environments and assessment of remediation applying surface evaporation capacitor model: a case study from the Judean Desert, Israel
Rotem Golan
Ittai Gavrieli
Roee Katzir
Galit Sharabi
Due to the presence of highly pollutant industries in arid areas, many of the globe's arid areas are exposed to severe local soil contamination events. In this work, the nature of solute and contaminant transport in the sandy terraces of an ephemeral stream that was exposed to a severe pollution event was examined. Here, the Ashalim Basin in the Judean Desert, Israel, is utilized as a case study.
In order to shed new light on contaminant distribution along the soil profile and on transport mechanisms in arid environments, three complementary approaches were used: (1) periodic on-site soil profile sampling, recording the annual solute transport dynamics; (2) laboratory analyses and controlled experiments in a rain simulator to characterize solute release and transport; and (3) numerical simulation, used to define and understand the main associated processes.
The study highlights the persistent nature of the pollutants in these natural settings, which dictates that they remain near the soil surface despite the presence of sporadic rain events. It was shown that a vertical circulation of the contaminates is occurring with soil wetting and drying cycles. The “surface evaporation capacitor” concept of Or and Lehmann (2019) was examined and compared to field measurements and numerical simulations and was found to be a useful tool for predicting the fate of the contaminants along the soil profile.
- Article
(3224 KB) - Full-text XML
- BibTeX
- EndNote


Arid and semi-arid areas are defined as areas beyond the polar and subpolar regions where the aridity index, which is the ratio of annual precipitation to potential evapotranspiration, is within the range of 0.05–0.65 (Gratzfeld, 2003). These areas cover approximately 32 % of Asia; 22 % of Africa; 17 % and 14 % of North and South America, respectively; 7 % of Europe; and 18 % of Australia (Effat and Elbeih, 2020). Many of the Earth's deserts contain unique natural resources such as evaporative minerals (Reynolds et al., 2007), oil (Leaver, 1990), commercially important rocks such as phosphorites and limestones (Abdel-Hakeem and El-Habaak, 2021; Sharma et al., 2000), and rare minerals or elements such as diamonds and uranium (Salom and Kivinen, 2020). Consequently, combined with low population density, low demand for agricultural lands. and the low land cost, large areas in arid and semi-arid environments are being used for industrial activities that involve highly polluting facilities. These include mines of different types (Abdel-Hakeem and El-Habaak, 2021; Effat and Elbeih, 2020; Portnov and Safriel, 2004); evaporation pans (Marazuela et al., 2020); oil production facilities (Luna et al., 2014); heavy and pollutant chemical industries (Dou et al., 2015; Effat and Elbeih, 2020; Portnov and Safriel, 2004); and landfills of different types (Cohen, 2007), including radioactive waste disposal sites (Shumway and Jackson, 2008).
Improper operational and management actions of these industrial activities, as well as uncontrolled and unpredicted accidents, may cause severe soil, water, and atmospheric contaminations. Often, such contamination events are associated with extreme climatic events such as floods (Sen et al., 2013; El Bastawesy and Abu El Ella, 2017; Becker et al., 2020; Gordon et al., 2018; Greenbaum, 2007; Izquierdo et al., 2020). With increasing risks for contamination events due to global climate change, which includes higher probabilities of extreme rain events and floods (IPCC, 2007; Schewe et al., 2014), it is essential to better understand the hydrological processes associated with such contaminations, particularly the nature of contaminant transport dynamics in arid environments and their fate thereafter. This understanding is key for future prevention and mitigation of flood-associated contaminations in arid areas.
Natural flash flood events in arid environments occur during or following strong rain events. Water flow is typically restricted to the mainstream flow channel (MFC), whereas the elevated alluvial terraces are usually exposed to limited levels of moisture (Fig. 1a). However, during rare and extreme rain events, which may also induce catastrophic pollution spills, the flow may reach areas beyond the MFC (Fig. 1b), exposing the rock slopes and terraces to unique hydrological conditions and processes. While a contaminated MFC is expected to experience natural processes of leaching and contaminant removal during the natural events of flash floods, the terraces and hill slopes are less likely to be exposed to significant natural wetting and flushing. Thus, the natural attenuation of the pollution in these terrains is expected to be significantly limited. Previous studies of water infiltration processes and solute transport dynamics concentrated on the processes taking place beneath the MFC of ephemeral rivers in arid regions during and after flash floods (Amiaz et al., 2011; Basahi et al., 2018; Masoud et al., 2018). The present study focuses on governing solute transport processes that dictate the long-term fate of pollutants in the sandy terraces bordering the MFC. We also present a novel use of the surface evaporation capacitor (SEC) model of Or and Lehmann (2019) as a tool to predict the fate of solutes in the examined system and to assess the likelihood of natural soil remediation by soil leaching with local rains. Our case study is a severe contamination event in the Ashalim Basin, an ephemeral stream in the Judean Desert, described hereafter.
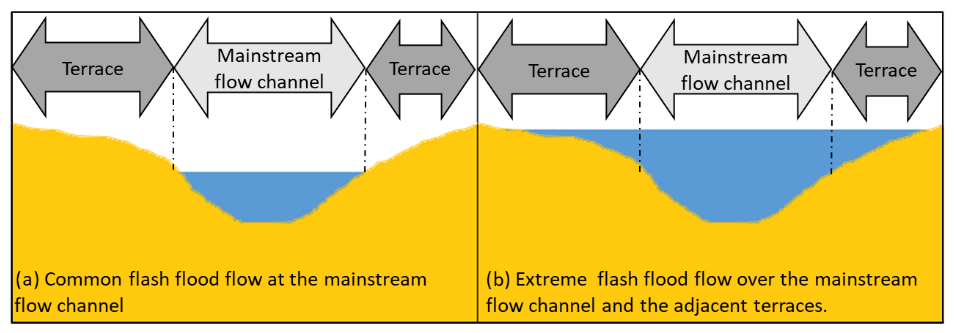
Figure 1Conceptual representations of (a) common flash flood event, where the flow is restricted to the mainstream flow channel, and (b) extreme flash flood, in which the uplands and terraces beyond the mainstream flow channel are exposed to the flood.
1.1 The Ashalim Basin and the contamination event of 2017
The Ashalim Basin, located in the Judean Desert, Israel (Fig. 2A), drains an area of ∼80 km2 between the Rotem Plain in the west and the Dead Sea transform depression in the east (Fig. 2A). At its highest point in the west, the basin is approximately 450 m above sea level, while its outlet elevation ∼15 km to the east is about 390 m below sea level, with the Ashalim stream course curving by ∼26 km (Becker et al., 2020; Greenbaum, 2007). In the upper, western part of the basin, the MFC curves through a 4–5 km sandy to carbonate terrain and is characterized by a shallow and wide stream channel, with adjacent sandy terraces to the sides, bordering the hilly rock slopes (Fig. 2B). Toward the east, the landscape changes to a rocky terrain (mainly carbonates), and the stream channel narrows to form a deep gorge (Fig. 2C). The regional climate is arid, with average annual precipitation of less than 100 mm, characterized by sporadic and short rain events during winter months in between October and March (Zoccatelli et al., 2020). Thus, throughout most of the year, the basin is dry, whereas, in winter, flash floods may develop following strong rain events. Annual potential evaporation (PET) is higher than 2500 mm, as measured in a meteorological station located at the southwestern edge of the basin over a time span of 9 years (2013–2022). The eastern part of the basin is part of the Judean Desert Nature Reserve (https://en.parks.org.il/map/, last access: 27 May 2025).
The Rotem Plain complex, in the western part of the Ashalim Basin, is a chemical–industrial zone (Fig. 2A). One of the major facilities on site is the ICL Rotem chemical plant, which produces phosphate from phosphorite rocks for the fertilizer industry and for other phosphate-based products. A by-product of the phosphate production is phosphogypsum, which is operationally stockpiled in high mounds overlooking the Ashalim Basin. Operational ponds were constructed on the mounds' tops to circulate the production fluids and deposit the phosphogypsum. The latter accumulates at the bottom of the ponds, thus gradually elevating the acidic pond and forming the phosphogypsum stockpile. In June 2017, one of the dikes of the operational ponds was breached, releasing about 300 000 m3 of highly acidic eluents and phosphogypsum slurry into the Ashalim stream (Becker et al., 2020; Rudnik, 2019). The acidic slurry also contained high concentrations of dissolved salts and heavy metals, derived from the phosphorite rocks, as well as from the industrial process itself. The catastrophic spill event developed into a man-made flash flood in which flow levels reached elevations significantly higher than the MFC, covering large areas of the sandy terraces and bordering hillslopes, which, commonly, are not exposed to flow during natural flash floods. Several years after the event, the mark of the maximal height of the acidic flow is still easily observed in the field in the form of a bright, light coloring of the surface and sediments in contrast to the unaffected darker rocks and sediment above (Fig. 2B). The pollution event caused an immediate extinction of local fauna and flora, including the death of an entire herd of the local desert mountain goat, the Nubian ibex (Capra nubiana).
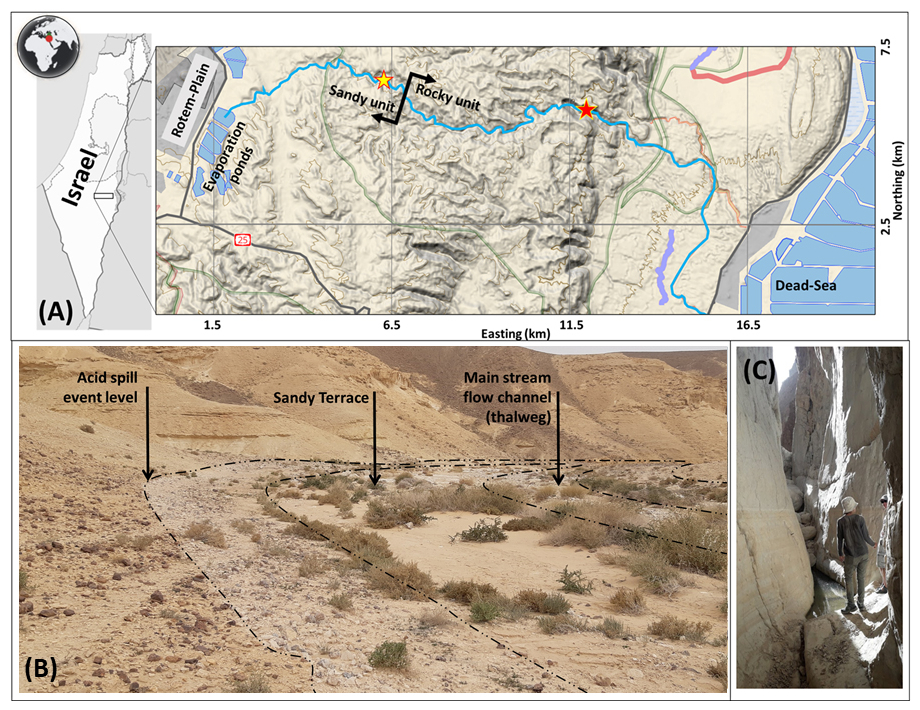
Figure 2Location map of the Ashalim Basin and the field site (a). The light-blue curve follows the main channel of the Ashalim stream. Yellow and red stars designate the location of the sandy unit (b) and the deep-gorge unit (c), respectively. The whitish coloring of the surface in picture (b) is the coloring due to the spill event. The picture was taken in the vicinity of the field monitoring station.
1.2 Surface evaporation capacitor model
Or and Lehmann (2019) termed the topsoil layer that contributes water to evaporation at the soil surface during the first stage of evaporation (S1) as the surface evaporation capacitor (SEC). S1 functions as such and evaporation is maximal as long as there is hydraulic connection between the drying front and the soil surface (Lehmann et al., 2008). The SEC model predicts if porewater at the subsurface will flow by means of capillarity action toward the evaporation front and evaporate or if it will infiltrate downward to deeper soil levels or to groundwater, where groundwater exists. Here, we use the SEC model to estimate the fate of conservative solutes and pollutants in the soil which are transported with the flowing porewater.
The thickness of the SEC layer that contributes water to evaporation at the soil surface is determined by the soil characteristic evaporation length Lc (m), which combines gravity and viscous forces, and is also determined by the potential evaporation at the soil surface E0 (m s−1) and the soil hydraulic properties (Or and Lehmann, 2019):
where Keff (m s−1) is the effective soil hydraulic conductivity within the SEC, and LG (m) is the maximum length for capillary flow against gravity to sustain evaporation from the surface. LG is determined solely by the soil physical properties, its texture, and the difference in terms of air entry pressure between the largest soil pores hL (m) and the smallest hydraulically connected pore hS (m).
In the above,
and α (m−1) and n (–) are the van Genuchten parameters which describe the connection between matric suction and soil water content for different soil textural properties (van Genuchten, 1983).
During S1, the effective soil hydraulic conductivity (Keff) is affected by the matric suction of the small pores at the soil surface and the soil hydraulic parameters:
where Ks (m s−1) is the soil hydraulic conductivity at saturation.
Determining the soil characteristic evaporation length Lc based upon soil properties and environmental conditions enables us to predict the flow direction of the porewater and solutes within, including contaminates, if present. In principle, following a soil wetting event, a drop of water within the SEC may undergo one of the three following processes: (i) downward infiltration to depths greater than Lc; (ii) upward flow to the soil surface by means of capillarity and evaporation at the soil surface; or (iii) no flow, provided that the SEC water content is low (∼residual water content) and the hydraulic conductivity approaches zero (i.e., the porewater will not flow out of the pores). In this latter case, the water may be exposed to a slow diffusive evaporation process, i.e., the second stage of evaporation (S2). Downward infiltration from the SEC is initiated when the SEC mean water content exceeds a critical water content θcrit that corresponds to the matric suction of the smallest hydraulically connected pores of the medium hS (Or and Lehmann, 2019) and is equal to
For conservative solutes or pollutants that are transported with porewater and that do not interact with soil particles, the SEC model may be used to determine the fate and location of solute accumulation. Upward water flow to the soil surface and evaporation during S1 will result in substantial accumulation of the solutes near the soil surface and, eventually, may lead to salt precipitation above (efflorescence) or below (subflorescence) the soil surface (Dai et al., 2016; Nachshon et al., 2018). Water that infiltrates downward to below Lc will carry away the solutes and the pollutants to deeper soil levels, removing them permanently from the soil surface and the root zone. Retained porewater under conditions of residual water content will maintain the solutes in their location, while S2 evaporation will concentrate them in situ.
Here, we combine laboratory measurements, field observations, and numerical modeling and estimation of the SEC thickness in the sandy soils of the Ashalim Basin to better understand pollutant dynamics and solute transport processes in sandy soils in arid environments.
In order to better understand solute transport processes at the sandy terraces of the contaminated Ashalim Basin, two series of experiments were conducted in the laboratory; long-term monitoring of solute distribution along the soil profile was conducted in the field, and a transport model was formulated using HYDRUS-1D (Simunek et al., 2005). In addition, the SEC model was evaluated in the light of the field measurements and numerical model results.
The soil of the sandy terraces was characterized by the hydrometer method to determine soil particle size distribution (Ashworth et al., 2001), and the hanging-column approach was used to define soil water retention properties (Schelle et al., 2013) and the van Genuchten parameters (van Genuchten, 1980). Hydraulic conductivity at saturation was measured by means of a Darcy column test over a 10 cm long tube, with a pressure head difference of 25 cm. These hydrological properties, along with Eqs. (1–4) and combined with field data of precipitation and evaporation, measured at a nearby meteorological station, were used to determine the thickness of the SEC layer at the sandy terraces of the Ashalim Basin. Field measurements and numerical model results were compared and discussed in the light of the SEC model, as detailed below.
2.1 Laboratory experiments
Two laboratory experiments were conducted: (i) batch leaching experiments, aimed at examining the dissolution and release dynamics of selected solutes out of the contaminated soil, and (ii) experiments in a rain simulator to study the release and transport of the solutes during rain events. For the experiments, contaminated sandy soil was collected from the contaminated terraces along the mainstream channel (yellow star in Fig. 2A and B). The soil samples were collected in June 2019, 2 years after the contamination event. Prior to any experiment or analysis in the laboratory, the collected soil was dried in an oven at 50 °C for 48 h, disintegrated by hand, and sieved through a 2 mm sieve.
2.1.1 Batch leaching experiments
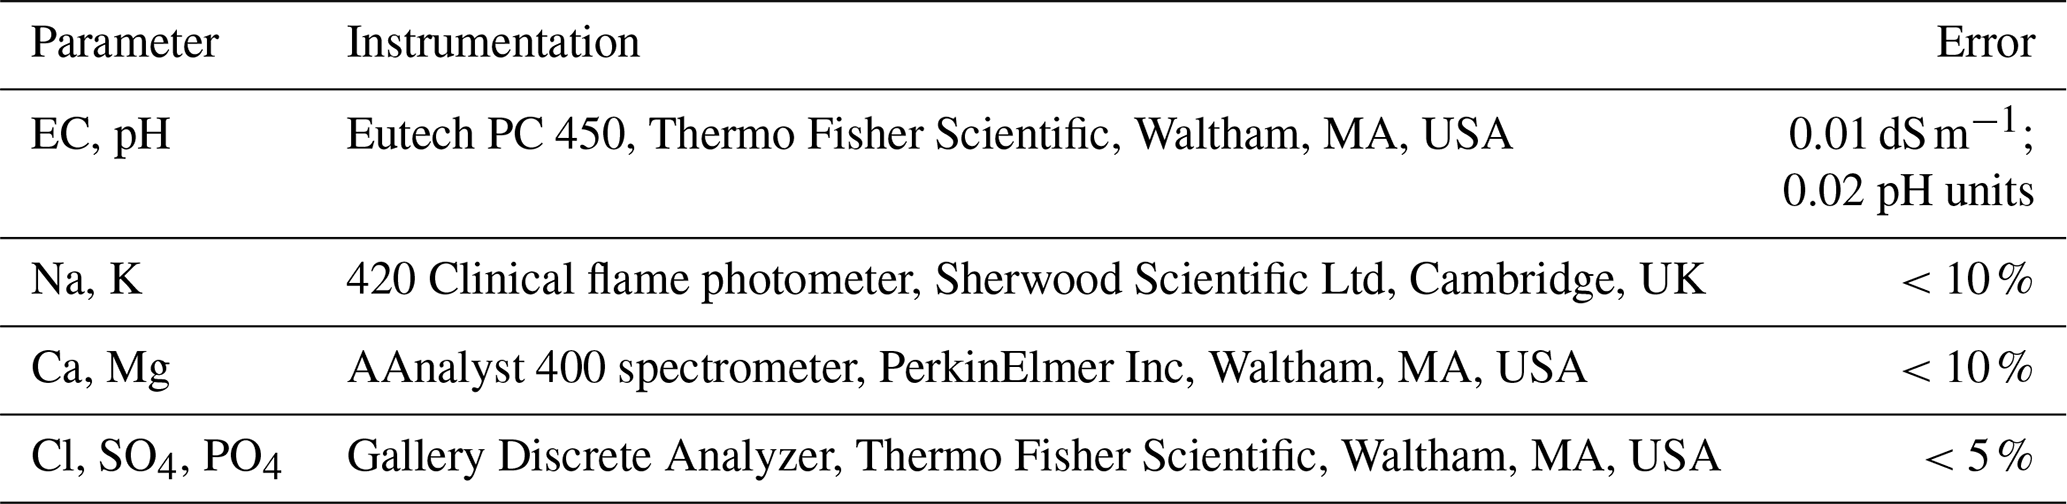
In order to determine the composition of the major ions in the contaminated soils and the dynamics of dissolution and extraction of the substances from the soil, batch dissolution experiments were conducted; 30 g of the contaminated sandy soil and 30 mL of deionized water were mixed and shaken well for 10 min in 50 mL test tubes. The tubes were then centrifuged (3500 rpm), and the solutes were decanted and filtered before being analyzed for their chemical composition, as detailed in Table 1. The solids in the test tube were then saturated again with 30 mL distilled water, and the process was repeated five times. The leaching experiments were done in triplicate.
2.1.2 Rain simulator experiments
The rain simulation experiments aimed to shed light on the dissolution and transport processes of the solutes during rain events. The experiments were conducted in a Morin-type rainfall simulator, which enables us to simulate rainstorms with different rainfall intensities on inclined surfaces (Morin et al., 1967). The simulated rain event was a 43.0 mm cumulative rain, with a rain intensity of 48.0 mm h−1. The rainwater used for the simulations was deionized water to closely mimic natural rainwater. For the experiments, the examined sandy soil samples were packed in tin trays, 4 cm deep, 45 cm long, and 30 cm wide, which were placed in the simulator at a slope of 9 %, with four replicates. Rain experiments were conducted for three setups: (i) the contaminated sand samples as collected from the field; (ii) the contaminated sand samples from the first rain experiment after being dried in the trays in free air for 2 weeks; and (iii) control sand samples collected from a nearby stream which was not exposed to the contamination event, namely a tributary of Gmalim stream, located ∼1 km north of the Ashalim Basin. The control samples were not exposed to a consecutive rain event, as done for the contaminated samples, since it was assumed that they will be highly depleted of salts following the first rain event. This is presented in the “Results and discussion” section below.
The rain simulator allows for the collection of water infiltrating through the soil, as well as of surface water. Infiltrating water samples were collected every few seconds at the beginning of each simulated rain event and every few minutes in the later stages of the experiments. Surface water, which had lower volumes compared to the infiltrating water, was collected in ∼20 min intervals. Water samples were analyzed in the laboratory for the chemical concentrations of selected components (Table 1).
2.2 Field monitoring
Field measurements were conducted to characterize solute transport and accumulation processes at the terraces of the sandy unit. On 29 September 2020, two contaminated sandy terraces, located within the sandy unit (yellow star in Figs. 2A and 3A), adjacent to and above the MFC were randomly selected to be monitored for their solute transport processes over a 1-year period. The two sites were referred to as the “western plot” (31.077421° N, 35.256586° E) and “eastern plot” (31.077722° N, 35.258020° E). At each location, soil profiling down to a depth of ∼50 cm was done every few months. In addition, during winter, soil profiles were collected following each rain event. For chemical analyses, the collected samples were oven-dried for 48 h at 50 °C, hand crushed, sieved, and mixed and shaken with deionized water at a 1:1 ratio for 2 h. Then the chemical composition of the extracted water was determined (Table 1). Mass water content (θm) in the collected soil samples was determined by weighing moist samples in a high-precision scale (Precision Balance PFB, KERN, Germany; 0.001 mg accuracy) prior to and after oven-drying of the samples at 105 °C for 24 h. Then the mass of water in the moist sample was divided by the mass of the dry sample. Volumetric water content (θv) was computed as follows:
where ρw is the water density (), and ρb (g cm−3) is the bulk density of the sample, which is proportional to soil porosity ∅ and the density of the solid particles in the sample ρ (commonly taken as 2.65 g cm−3) (Skopp, 2001).
For the above, ∅ was determined by means of the hanging-column procedure by weighing the amount of water needed to saturate the oven-dried soil.
Daily rain depth data were available from the Israeli Nature and Parks Authority, which measured rain depth at a station located ∼1 km northeast of the selected terraces.
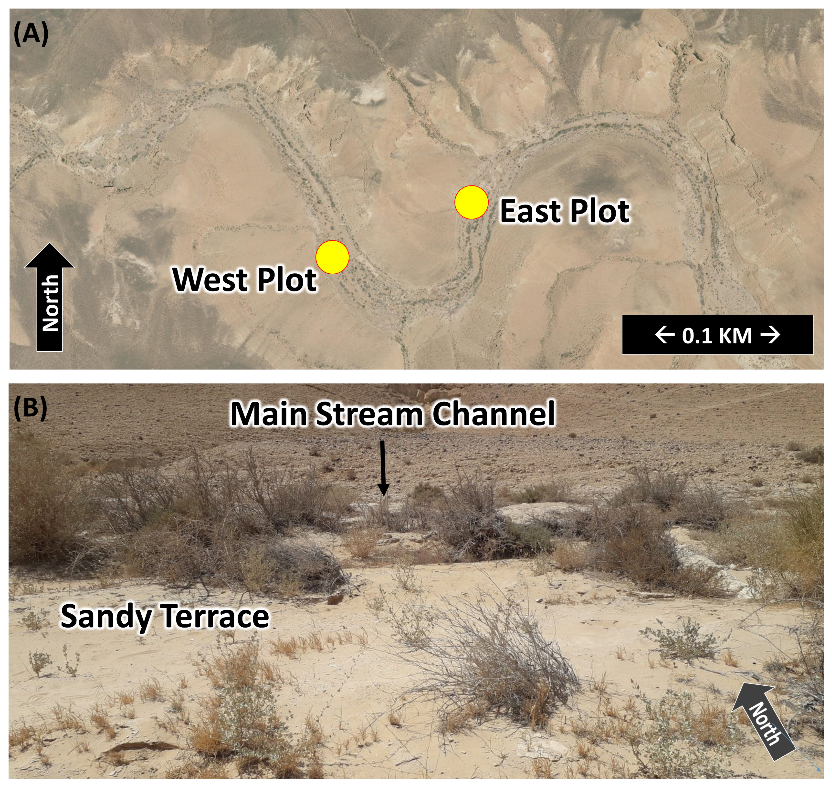
Figure 3Aerial location map view of the western (31.077421° N, 35.256586° E) and eastern (31.077722° N, 35.258020° E) monitoring plots (a) and characteristic view of a sandy terrace, specifically at the western plot, adjacent to the mainstream channel (b).
2.3 Numerical model
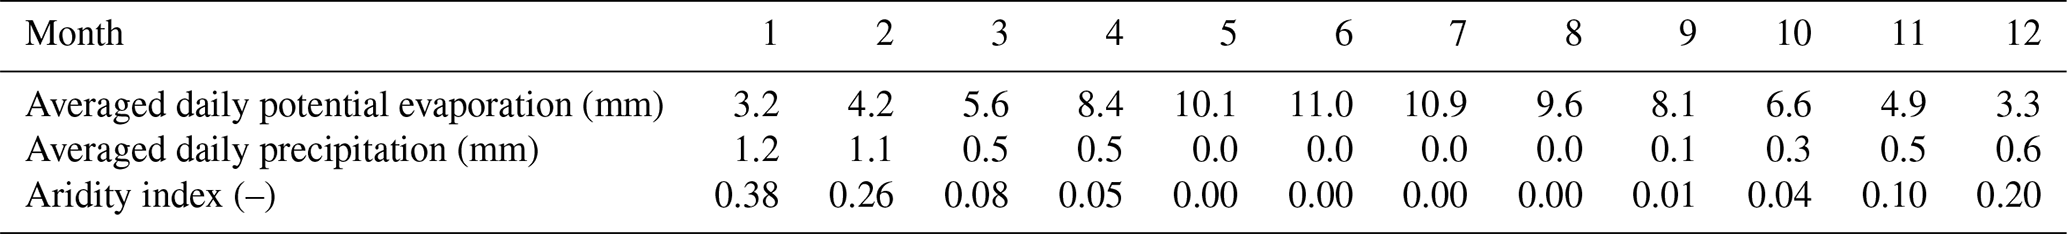
A numerical simulation using HYDRUS-1D (Schaap et al., 2001; Simunek et al., 2005) was applied to estimate the general leaching potential of solutes in sandy soils under arid climatic conditions. For this purpose, a one-dimensional model was constructed, and solute transport was simulated over a 1-year course. The modeled domain was composed of sandy soil with hydrological parameters as determined for the collected soil samples by the hanging-column test, Darcy column test, and hydrometer procedures (Ashworth et al., 2001; Schelle et al., 2013). Initial conditions were set to a matric suction of −100 cm throughout the entire domain, corresponding to the saturation degree of residual water content. The simulated polluted layer was represented as a 10 cm top layer containing a conservative solute. The solute concentration was set to have a linear distribution of 10 and 0 mmol cm−3 at the soil surface and at the lower boundary of the 10 cm layer, respectively. The domain's lower boundary, at a depth of 100 cm, was set to have free drainage, and the upper boundary was set as an atmospheric boundary, with precipitation events corresponding to daily rain depths as measured at the Ashalim Basin during the winter of 2020–2021. Daily potential evaporation was set following long-term measurements conducted at the nearby meteorological station (Table 2). Note the scarce daily precipitation in the Ashalim region alongside the calculated aridity index (precipitation potential evaporation), indicating high levels of aridity for the region (Table 2).
Table 2Averaged daily potential evaporation and precipitation over 1 year (data from a nearby meteorological station of the Israeli Nature and Parks Authority for 2013–2022). The aridity index is the ratio between precipitation and potential evaporation.
In addition, in order to study and better understand the impact of rain depth on solute removal, similar simulations were performed with rain depths 2- and 5-fold higher than measured rains. The excess rain simulations were added to test and emphasize the effect of different rain depths on solute leaching processes in high-aridity locations.
The results will be presented in the following order to allow for a meaningful discussion: first, the physical measurements and hydrological properties of the examined sandy soil of the Ashalim Basin will be introduced. Following this, the dynamic release of solutes from the soil will be discussed based upon the batch extraction experiments and the rain simulator experimental results. Next, the long-term field monitoring measurements will be presented, followed by the numerical model results alongside the SEC model.
3.1 Soil physical properties
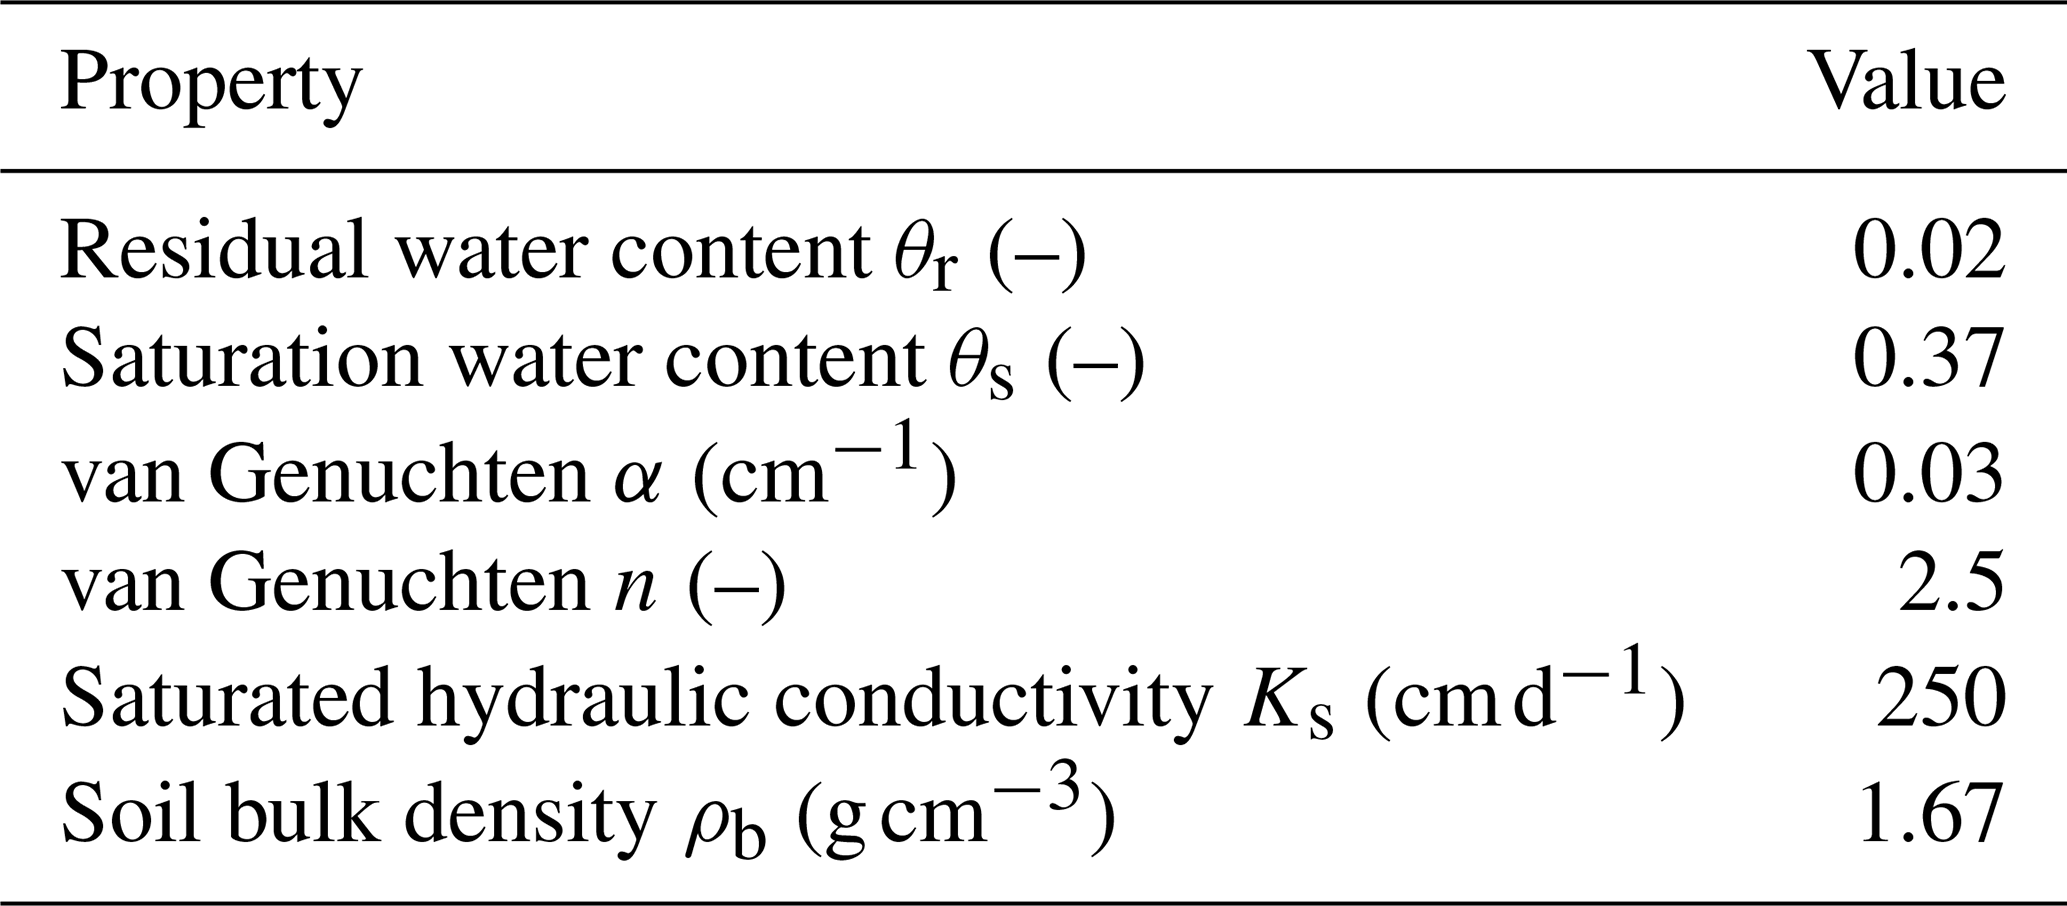
As detailed above, all laboratory experiments and analyses were done for soil samples collected in the field from the sandy terraces in the Ashalim Basin. The soil texture, as defined by the hydrometer method and the USDA soil texture triangle (Shirazi and Boersma, 1984), was characterized as sandy loam, corresponding to 79 % sand, 1.5 % silt, and 19.5 % clay. Figure 4 presents the water retention curves of three sand samples from the field site, as measured by the hanging-column method. It is evident that there are differences in between the three curves that could be a result of small differences in sand packing in the columns or small variations in soil texture in between the three different sand samples. α and n values were determined for each sample as detailed in the legend of Fig. 4. A fitted curve, derived from the average of the three samples and exhibiting good agreement with sample no. 1, was used to determine the α and n values of the modeled soil, which will be used hereon for the numerical simulations and SEC analyses. These α and n values and other soil physical properties measured physically by the hanging-column method and the Darcy column test are detailed in Table 3. The impact of variations in α and n values on the thickness of the SEC layer and the potential leakage of water and solutes out of the SEC are discussed below in Sect. 3.5.
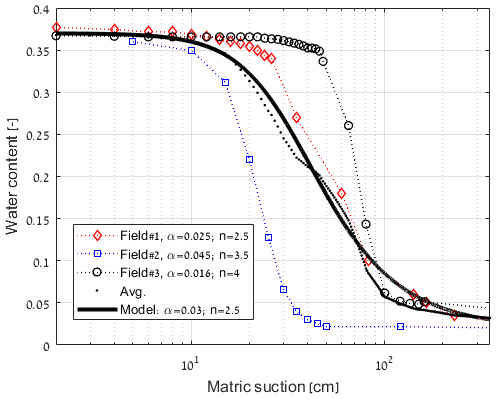
Figure 4Soil water retention curves of the three sand samples from the sandy terraces (field nos. 1, 2, and 3), along with their average curve (avg.). The curve of a modeled soil (model), fitted to the average measured curve, is also shown. The van Genuchten parameters derived from this fitted curve were used for subsequent SEC analyses and numerical simulations.
3.2 Solute release
As detailed above, solute release was examined experimentally by the batch and rain simulator experiments. Both tests pointed out similar dynamics of salt and mineral dissolution and solute release, as detailed below.
3.2.1 Batch experiments
The dynamic extraction of solutes from the soil to the water, as measured in the five cycles of wetting and extraction of the batch experiment, is presented in Fig. 5. Over the five cycles of leaching, electric conductivity (EC) dropped from an average value of ∼2.9 to (Fig. 5A). Concurrently, Na, Cl, K, and Mg concentrations were largely depleted by the five cycles of extraction, with most of the depletion occurring during the first two cycles. The observed rapid extraction of these solutes from the polluted soil indicates that they most likely originated from pollution-associated salts with relatively high solubility, such as NaCl, Na2SO4, KCl, and MgSO4. In addition, their relatively low initial concentrations are indicative of lower quantities of these salts in the soil itself. In contrast, Ca and SO4 maintained relatively constant concentration levels over the five cycles of extraction, with close to a 1:1 stoichiometric relation, pointing to gypsum (CaSO4⋅2 H2O) as the likely source mineral, in line with one of the main components in the Ashalim pollution event (phosphogypsum). All extracts are saturated with respect to gypsum (SI=0.02, calculated by PHREEQC interactive 3.7.3 using the PHREEQC database; Parkhurst and Appelo, 2013). Noteworthy is that their dominance in the solution determines the overall salinity and the EC in the last leachings.
A slight decline in SO4 concentration is seen between cycle no. 1 and no. 2 (from ∼33 to ), while Ca concentrations remain relatively stable at . This decline could point to the presence of minor amounts of relatively highly soluble sulfate minerals such as sodium sulfate and magnesium sulfate. The slight excess of Ca over SO4 in the remaining cycles is likely due to dissolution of some carbonate minerals, which are present in the local sands.
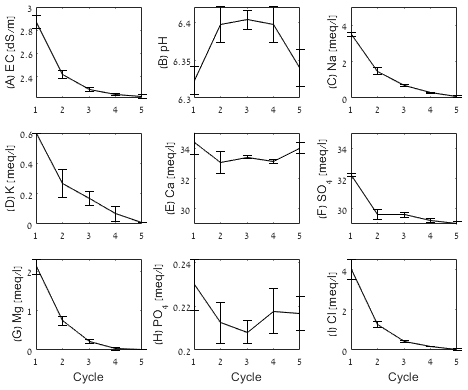
Figure 5Chemical properties of leachate water from the five cycles of batch experiments. Error bars represent standard deviation of the three triplicates.
3.2.2 Rain simulator experiments
In the rain simulator experiments, more than 95 % of rainwater percolated through the soil, and less than 5 % of the rainwater drained along the inclined sandy slopes as runoff (Fig. 6). This means that, for the examined conditions, the potential of lateral transport of salts and other contaminates by surface water is limited as most of the rainwater infiltrates downward through the soil.
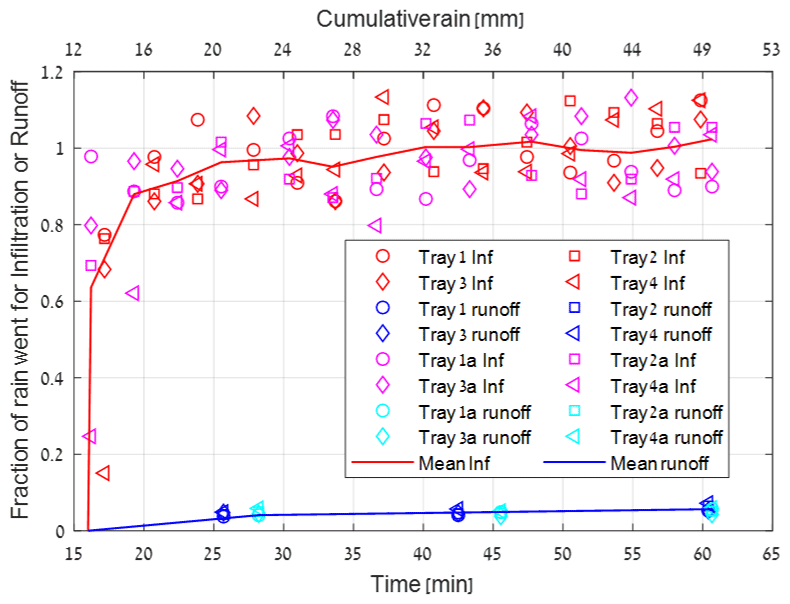
Figure 6Fractions of rainwater volume infiltrated through the soil layers (red and pink symbols) and surface runoff water (blue and aqua) as measured in the rain simulator experiments. All measurements of the four repetitions (trays) and the two simulated rain events are marked as detailed by the legend.
The patterns of solute release observed in the batch experiments were also found in the rain simulator experiments, in which the concentrations of Na, Cl, Ca, and SO4 were measured from samples of surface runoff and water that infiltrated through the soil (Fig. 7). The initial Na and Cl concentrations in the infiltrating water samples were of the order of , with the concentrations quickly dropping off. The most likely source of these solutes is the highly soluble halite (NaCl). These initial concentrations are much higher than those measured in the batch experiments since the water-to-soil ratio in the batch experiments (1:1) was higher than the ratio of the first infiltrating water collected from the simulated rain events. The water-to-soil ratio of the infiltrating water in the rain simulator experiment was estimated by dividing the cumulative mass of collected water at the first reading of Na and Cl concentrations (15 mm rain depth) by the mass of soil through which the water percolated. The mass of soil was computed for a 4 cm soil thickness, with an estimated density of 1.7 g cm−3, yielding a water-to-soil ratio of only , which explains the elevated Na and Cl concentrations in this first infiltrating water sample.
In agreement with the batch extraction results, Na and Cl concentrations in the infiltrating water rapidly declined during the simulated rain event, and, after a cumulative rain of ∼30 mm, both ion concentrations were reduced to levels of about 2 meq L−1, similarly to the control (Fig. 7a and b). These concentration drops indicate a fast and efficient dissolution process and transport of the dissolved Na and Cl ions downward with the infiltrating water. In line with this, in the consecutive simulated rain event, the initial concentrations of Na and Cl were relatively low, on the order of 5–10 meq L−1, indicating that the reservoir of this salt in the washed soil layer was effectively lowered compared to the initial conditions of the first simulation. However, the Na and Cl concentrations at the beginning of the second rain simulation (using the contaminated sand from the first rain experiment after being dried in the trays in free air for 2 weeks) are higher than the concentrations measured at the end of the first rain event. This is likely to be related to accumulation of salts near the soil surface during the drying and evaporation period between the two simulated rain events, a result of capillary water flow toward the evaporation front at the soil surface. This process enforced the accumulation and precipitation of NaCl at the soil surface. Consequently, the water that infiltrated through the soil at the beginning of the second rain event dissolved the cumulated salt and pushed the solutes downward at relatively high concentrations. Similarly to the first rain event, after cumulative rain of ∼20 mm, both the Na and Cl concentrations in both the infiltrated and runoff waters were reduced to low levels of less than 2 meq L−1.
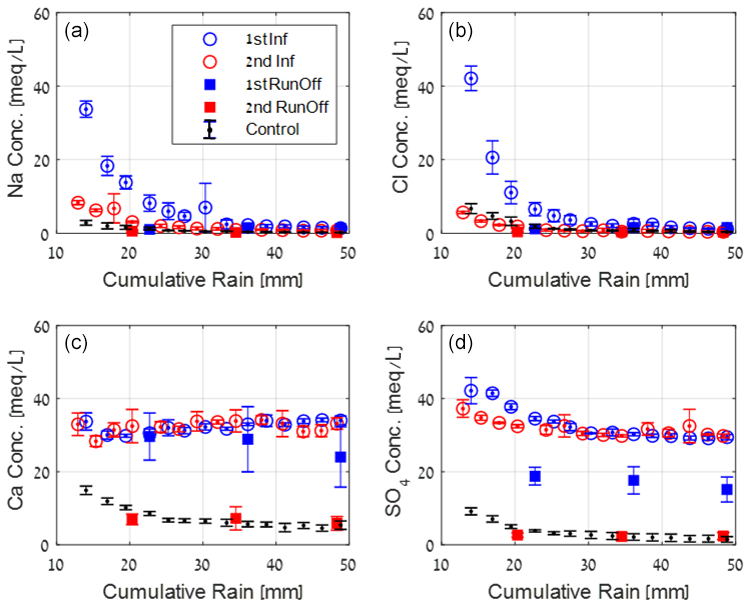
Figure 7Measured concentrations of Na (a), Cl (b), Ca (c), and SO4 (d) in runoff water (squares) and infiltrating water (open circles) during two consecutive simulated rain events. Blue and red symbols are for the first and second simulated rain events, respectively. Black symbols represent the measurements of the infiltrating water from the un-contaminated control soil. Error bars are from the four replicas.
Contrarily to the above, Ca and SO4, which are associated with the phosphogypsum that was deposited during the pollution event and that is much less soluble than halite, maintained high concentration levels of in the infiltrating water during both cycles of simulated rain events. These concentrations are much higher than those measured in the control experiment. As mentioned previously, the high and relatively stable Ca and SO4 concentration levels are indicative of the high content of phosphogypsum in the polluted sand, which effectively acts as a slow-release source for both ions. Concurring with the batch experiment results, and for the same reasons (some Ca carbonate dissolution), the Ca concentrations were more stable than the SO4 concentrations, which exhibited some decline with time (from ∼40 to ).
As detailed above, due to rapid NaCl dissolution and transport of the ions downward, only minor concentrations of Na and Cl were measured in the surface runoff water from the two simulated rain events (Fig. 7a and b). On the other hand, Ca and SO4 concentrations in the runoff water from the first simulated rain event were high and similar to those measured in the infiltrating water. This indicates the presence of a sufficient amount of gypsum at the soil surface to interact with and dissolve in the surface water. However, in the second simulated rain event, both Ca and SO4 concentrations in the surface runoff water were lower, probably due to substantial dissolution and removal of the gypsum from the very top levels of the soil profile during the first rain event.
Given the above detailed experimental results and observations, a similar process is expected under natural conditions, whereby the contaminates and solutes from the upper soil will be mobilized by the infiltrating rainwater to the lower and deeper parts of the soil profile. This process was further studied in the field and by numerical modeling.
3.3 Field measurements – annual salt dynamic in sandy alluvial terraces
Temporal monitoring of the soil profiles in two sandy alluvial terraces was carried between the summers of 2020 and 2021. Major ion compositions along the soil profiles were characterized following extraction of the soluble salts with deionized water (1:1 dry soil:water ratio), as detailed above. The Cl and Ca measurements are presented and discussed hereafter as these originate from two different salts with markedly different solubilities and sources, namely halite and phosphogypsum, respectively. In addition, Cl is a conservative anion that does not interact with the soil, while the Ca cation may be absorbed into clay particles.
Figure 8 presents the results from the field study. On an annual scale, no change was found in Cl and Ca concentrations at the soil surface of the eastern plot between September 2020 and September 2021. Cl concentrations were on the order of 1.5 meq L−1 (Fig. 8c and d), and Ca concentrations were on the order of 37 meq L−1 (Fig. 8e and f). The differences in terms of concentration between Cl and Ca are in accordance with the laboratory experiments, reflecting the abundance of gypsum in the contaminated soils. In the western plot, no changes in Cl concentrations at the soil surface were observed between September 2020 and September 2021 (Fig. 8g and h). However, Ca concentrations declined by ∼20 % between September 2020 to September 2021 (Fig. 8i and j). When examining the ion concentration dynamics along the soil profiles at a higher temporal resolution, between September 2020 and September 2021, it is evident that, in both plots, during the winter months (October–March), Cl and Ca concentrations in the upper levels of the soil profiles were reduced. These concentration drops are explained by dissolution of the salts and the leaching of the solutes downward with the infiltrating rainwater. Consequently, the concentrations of the ions were elevated at the subsurface at depths of 30–40 and 50–60 cm for the eastern and western plots, respectively. These observations point to the dynamic nature of salt dissolution and solute transport processes in the examined system. However, despite the high mobility of the solutes, under the arid conditions of the Ashalim Basin, the overall flushing and removal of the solutes and contaminants to significant depths is negligible. Apparently, the winter infiltration and leaching processes are not sufficient to mobilize the solutes deep enough to prevent their rise back by means of capillarity during the long summer months to the evaporation front at the soil surface.
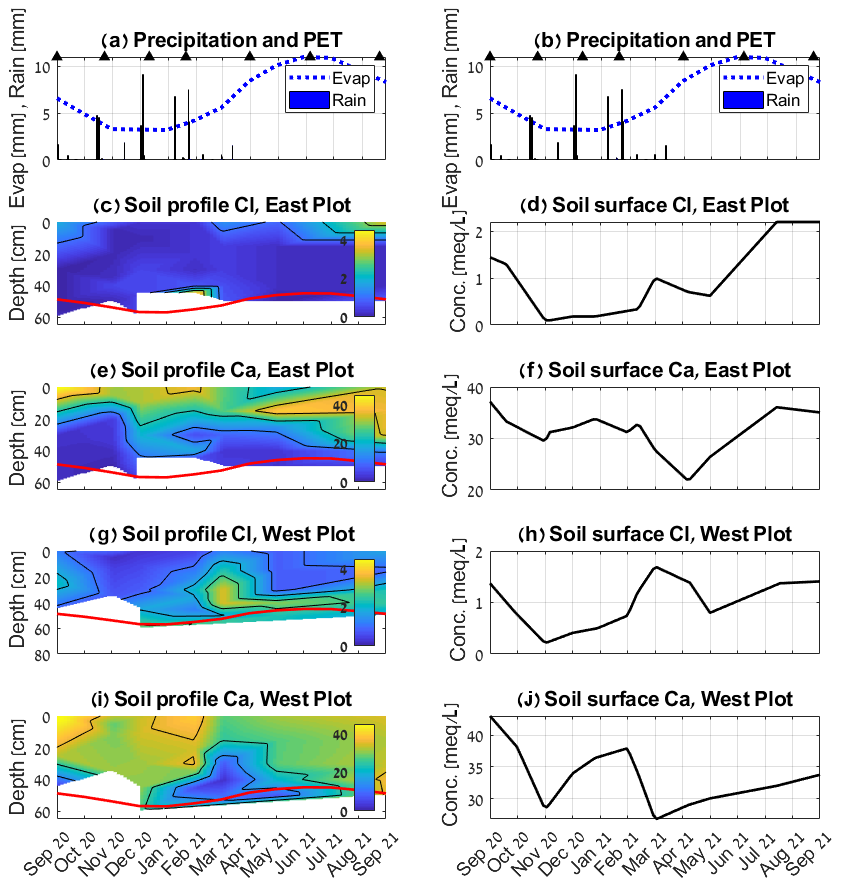
Figure 8Measured precipitation and potential evaporation (PET) are presented in (a) and (b). Triangles indicate the time of soil sampling. Temporal changes in Ca and Cl depth profiles in the sandy terraces as measured in the eastern (c–f) and western Plots (g–j). Panels (a), (c), (e), (g), and (i) present Cl and Ca concentrations (meq l−1) over the entire soil profile, down to the maximal depth that was sampled. The red contours mark the lower boundary of the SEC layer. Panels (b), (d), (f), (h), and (j) present ion concentrations at the soil surface only.
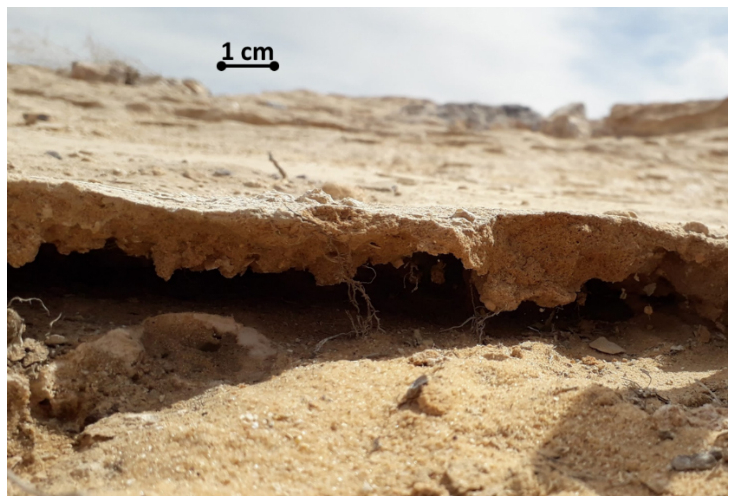
As detailed above, the SEC model may be used to assess the effective depth from which contaminated porewater will not return by means of capillarity to the soil surface. The thickness of the SEC layer was calculated for the field site based on its hydrological properties (Table 3) and local climatic conditions (Fig. 8i and j). The lower boundary of the SEC layer is depicted in Fig. 8 by the red contours, but its depth changes over the year due to temporal changes in the potential evaporation E0. In the eastern plot, the winter downward leaching of both Ca and Cl solutes did not pass the lower boundary of the SEC (Fig. 8c and e). Consequently, during the dry summer months, from April onward, porewater and associated dissolved solutes were available for upward capillary flow toward the soil surface, where evaporation takes place. At the evaporation front, the solutes become concentrated in the solution, and salts and minerals precipitate to form solid crusts at the soil surface (Fig. 9). Figure 8d illustrates a pronounced increase in chloride (Cl) concentration at the soil surface during the summer of 2021 compared to during that of 2020, approximately doubling in magnitude. This enhancement is attributed to a thinner but more concentrated solute profile near the soil surface in 2021 relative to 2020. As corroborated by Fig. 8c, Cl accumulation at the end of the monitoring period in 2021 was confined to a ∼10 cm layer, whereas, in September 2020, it was distributed across a broader layer of ∼20 cm.
In the western plot, however, some leaching of the solutes to depths of ∼40 cm was recorded, yet no significant leaching of the solutes to depths greater than the SEC lower boundary was observed. The disparities between the eastern and western plots could be attributed to more efficient leaching processes that occurred in the western plot due to slight differences in the local meso-topography and soil properties. However, throughout the entire period of measurement, in both plots, average measured θm values along the soil profiles were on the order of 0.015, with maximal and rare values of 0.03, which were measured following the consecutive strong rain events of February 2021. These θm values correspond to θv of 0.025 and 0.05 and are consistently smaller than θcrit, which is equal to 0.11 (Eq. 5) for the measured hydraulic properties of the examined sand (Table 3). The fact that θv did not exceed θcrit supports other observations and understandings that there was no significant downward leaching of water and solutes from the SEC.
The data from the field sites demonstrate the dynamic nature of the solutes as they move vertically along the soil profile with wetting and drying events. In accordance with the SEC model, as long as θv<θcrit, the solutes are not mobilized below the lower boundary of the SEC layer and are expected to migrate upward during the dry summer months toward the evaporation front at the soil surface. As illustrated in Fig. 8, Ca exhibits lower mobility compared to Cl within the soil profile, resulting in wider and deeper Ca distribution. This disparity can be attributed to the elevated Ca concentration in the contaminant effluent, the reduced solubility of gypsum relative to halite, and the propensity of Ca to be adsorbed into soil clay particles. Presently (2024), more than 6 years since the contamination event, salt crusts, mainly of phosphogypsum, are still widely seen in the contaminated basin (Fig. 9). For additional evaluation and understanding of water flow processes and solute transport dynamics, a numerical model was used to examine the system, as detailed below.
3.4 Numerical simulation model
The numerical model presents solute concentration levels (Fig. 10c, e, and g) and water flow directions and velocities (Fig. 10d, f, and h) along a 100 cm soil profile over a time period of 12 months. The solute simulated in the model is considered to be conservative, implying that it does not undergo sorption onto soil particles, similarly to the behavior of Cl. Precipitation and potential evaporation conditions measured at the field site between September 2020 and September 2021 (Fig. 10a and b) were used to define the upper boundary condition for the reference simulation. An additional two simulations were done for 2- and 5-fold increased precipitation.
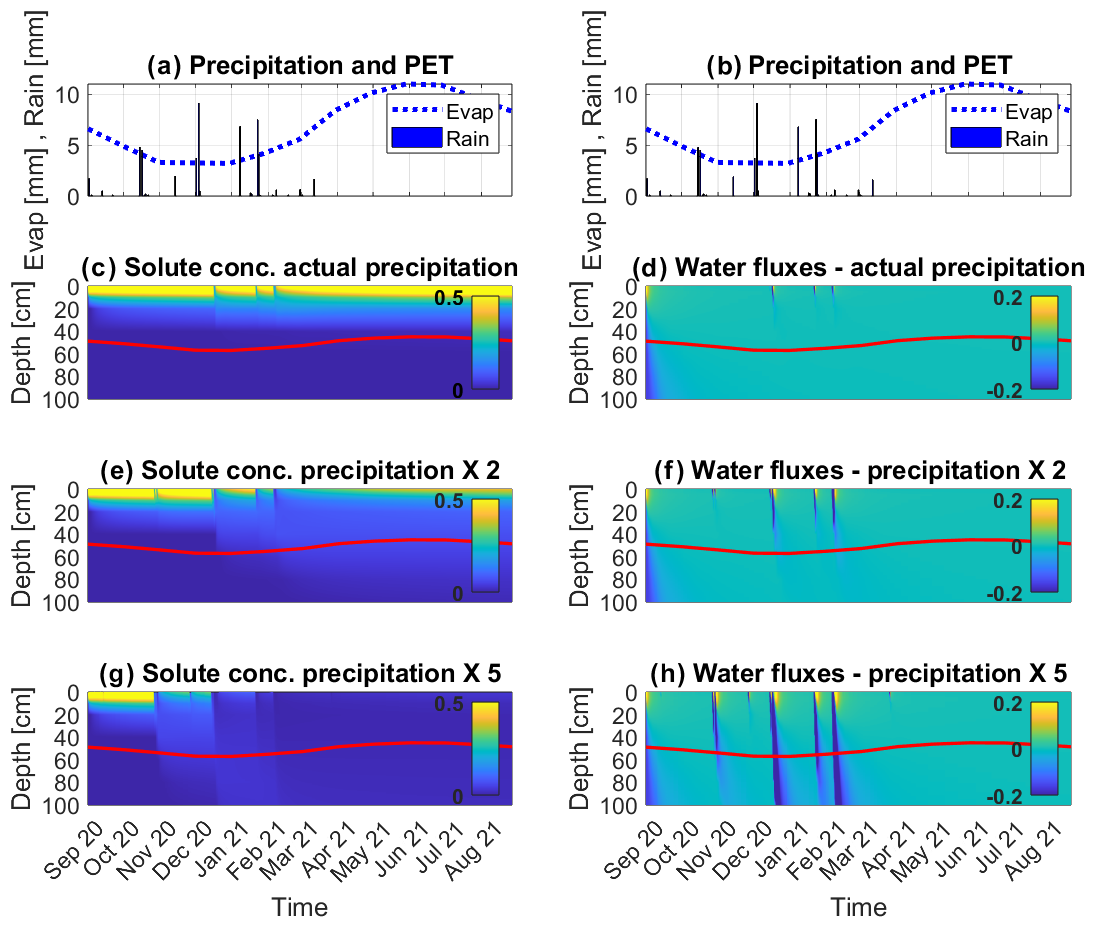
Figure 10Numerical simulation results for solute concentration (a, c, e, g) and water fluxes (b, d, f, h) for three precipitation scenarios. Panels (a) and (b) present the measured precipitation and potential evaporation (PET) conditions used for the simulation. Panels (c) and (d) present computed solute concentration and water flow velocities, respectively, for actual climatic conditions. Panels (e–h) present the same properties for 2- and 5-fold elevated precipitation. Positive values in panels (b, d, f, h) indicate upward water flow. The red line signifies the calculated characteristic evaporation length of the soil Lc, which is the lower boundary of the SEC.
Model results for the actual (measured) rain conditions demonstrate that the removal of solutes to depths greater than 30 cm is negligible. It is seen in Fig. 10c that, for the examined setup and typical climatic conditions, the solutes are leached downward during and following rain events, whereas, in the following dry periods, they are transported upward by rising capillary water toward the evaporation front at the soil surface. Therefore, in agreement with field measurements, mainly for Cl, over a full winter–summer cycle, the high concentration of the solutes at the upper levels of the soil profile is maintained. Figure 10d presents water flow directions and velocities along the soil profile, where negative values (bluish colors) indicate downward infiltration and positive values (yellowish colors) indicate upward capillary flow. It is seen that, for the prevailing climatic conditions, which included only three rain events, a notable downward transport of the solutes to depths of about 20 cm took place. Each rain event was followed by a reversed water flow direction that occurred immediately after the rain event ended (Fig. 10d). This is in accordance with field measurements and the SEC model, with its lower boundary being marked by the red contours in Fig. 10. As mentioned previously, solutes that do not leach to depths greater than this SEC lower boundary are available for upward capillary flow toward the evaporation front at the soil surface.
In the simulated conditions of doubled rain depth, during the two rain events (December 2020 and February 2021), the maximal depth of infiltrating water approaches the lower boundary of the SEC layer (Fig. 10f), and, consequently, a minor reduction in solute concentration at the upper levels of the soil profile is simulated. For the extreme simulated conditions of rain depth 5 times greater than the natural conditions, the depth of the infiltrating water is much deeper than the SEC depth (Fig. 10h), and, indeed, the upper levels of the soil profile are completely depleted of the solutes (Fig. 10g). The differences in terms of water flow and solute leaching dynamics between the three simulated precipitation conditions are in line with the simulated water content of the SEC layer and the estimated θcrit. As detailed in Sect. 1.2, θcrit denotes the minimal level of water content at the SEC that is needed to support water infiltration and solute transport to depths greater than the lower boundary of the SEC. Figure 11 presents the averaged water content of the SEC based on simulated water content levels at depths of 0, 10, 20, 30, 40, and 50 cm. For the actual rain conditions, as monitored in the field, the simulated (and measured) maximal SEC water content following the strong rain event of December 2020 was of the order of 0.05, much lower than θcrit, which is equal to 0.11. Consequently, water flow below the SEC was not observed in the simulation. For the scenario of doubled rain, maximal SEC water contents were elevated to levels of about 0.07, closer to θcrit, leading to minor downward leaching of the solute, as seen in Fig. 10e. It is only in the extreme simulated climatic conditions of 5-fold-increased precipitation that the SEC averaged water content levels were higher than θcrit and that a substantial leaching of solutes from the SEC is modeled (Fig. 10g). Figure 11 also presents averaged water content levels at the SEC, as measured in the field for the eastern and western plots. In agreement with the numerical simulation, it is seen that water content levels in the field were much lower than the θcrit of 0.11 required to support downward infiltration from the SEC.
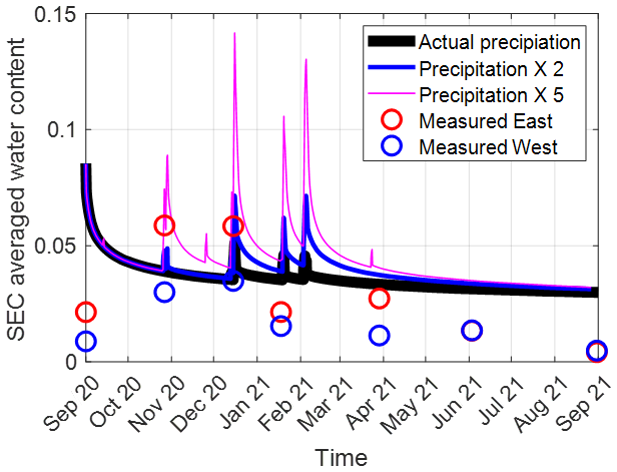
Figure 11Averaged SEC water content over time for numerical simulations (solid curves) and field measurements at the eastern and western plots (circles).
3.5 Applying the SEC model to predict the potential of solute and contaminant leaching from different soil textures
Following the experimental results, field measurements, and numerical model presented above, it is hereby proposed that the SEC model be used as a tool to estimate solute and contaminant transport and accumulation along the soil profile for non-reactive elements. This will be done by estimating the net amount of water entering the SEC and its impact on the average water content of the SEC, which affects water flow and solute transport processes along the soil profile. For arid environments where sandy soils can be assumed to be fully dry, most of the time, the water content of the SEC (θSEC) following a rain event can be calculated by dividing the net length of the water entering the SEC by the SEC depth (i.e., Lc (mm)):
where P (mm) and E (mm) are precipitation and evaporation, respectively, over the examined time period. As aforementioned, in order to initiate water flow through the SEC lower boundary, θSEC needs to be equal to or higher than θcrit. Consequently, by substituting θSEC with θcrit in Eq. (8) and rearranging the equation, it is possible to depict the required P for a given E to allow water flow and leaching of solutes and contaminants out of the SEC for a single rain event:
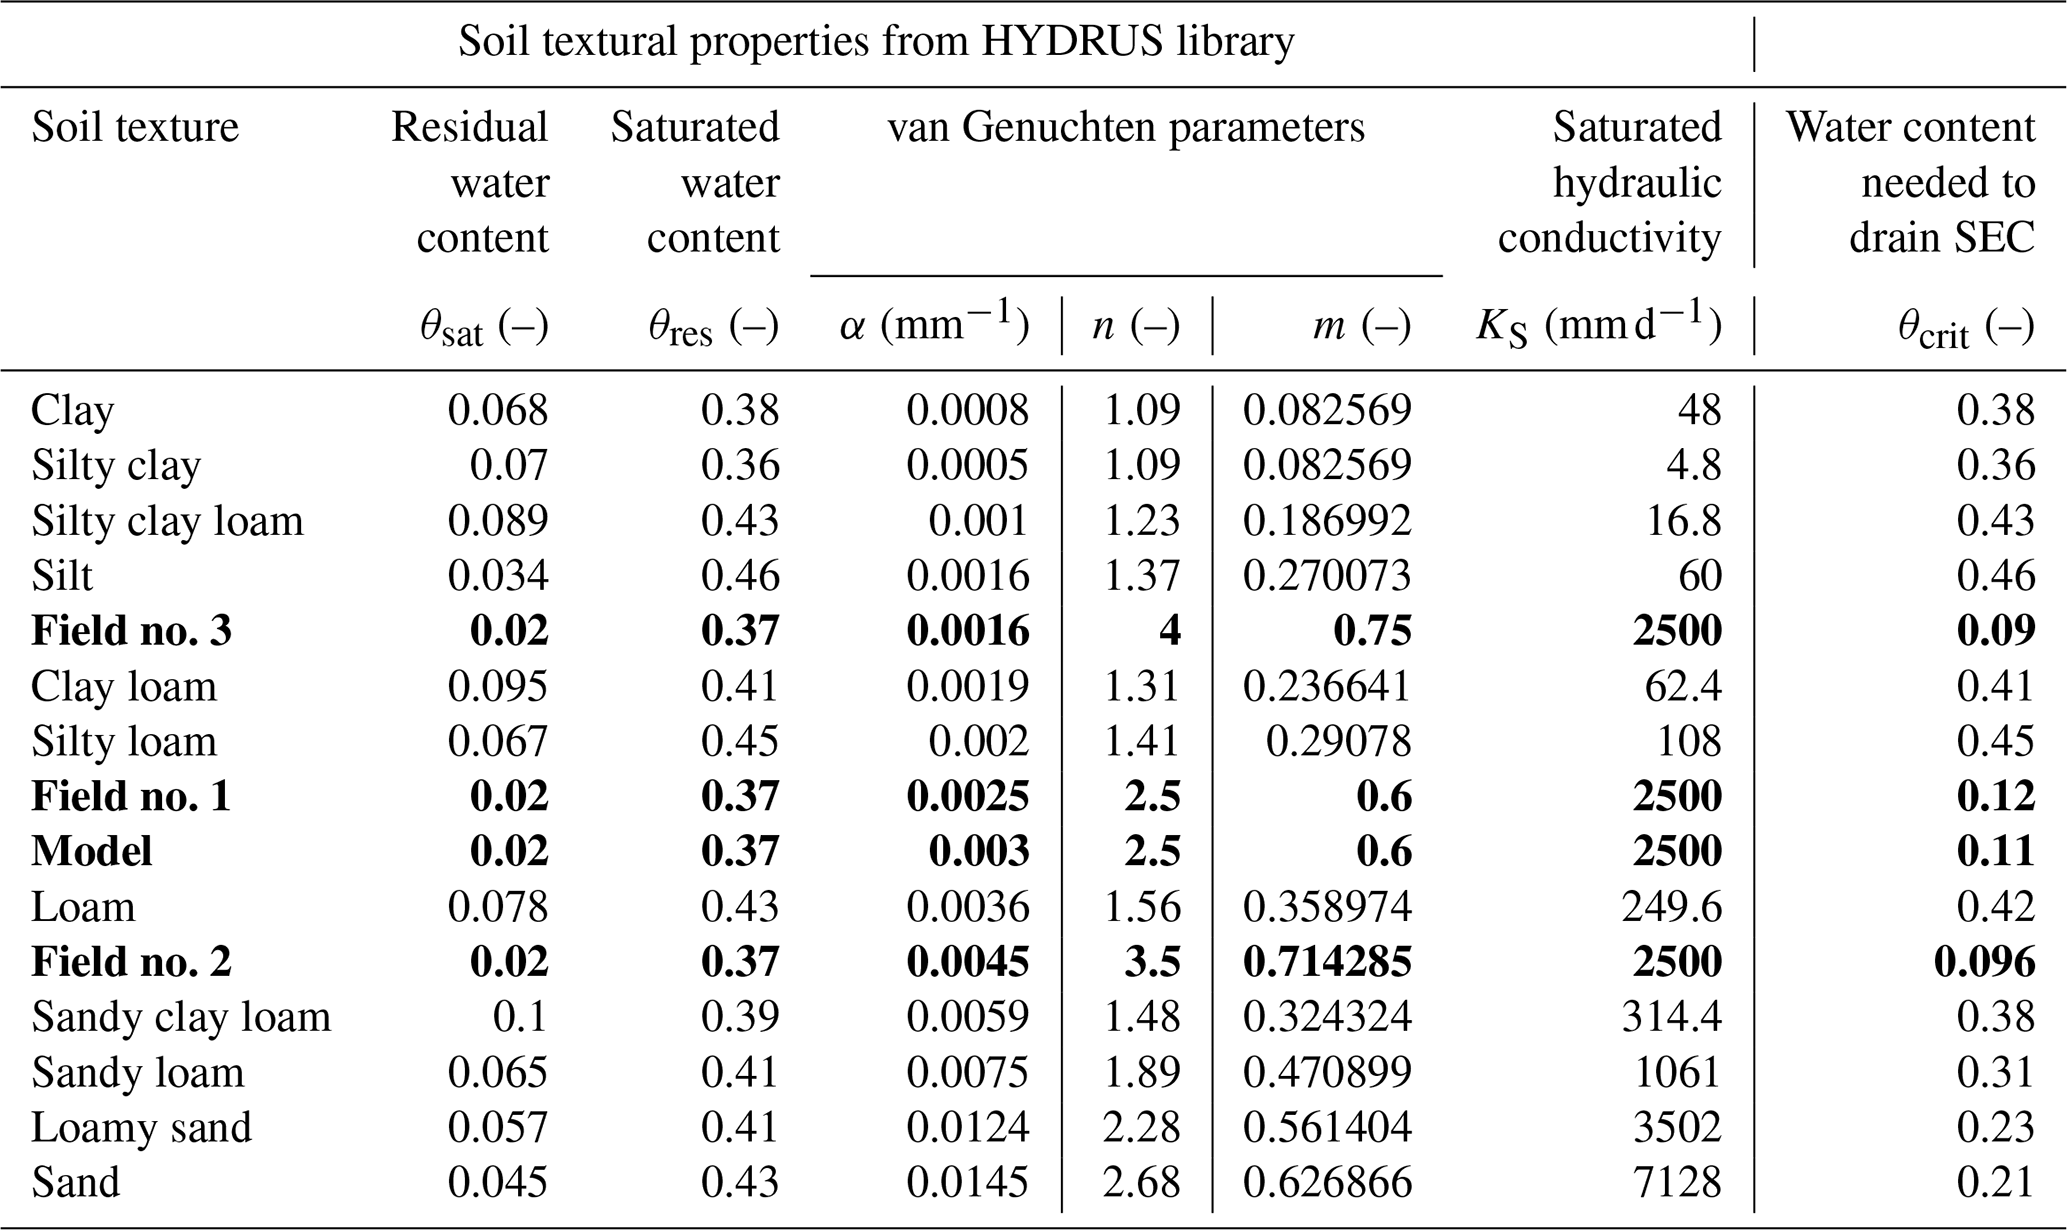
Figure 12 presents the computed Lc, based on Eqs. (1–4), for various soil textures and five daily evaporative scenarios. Table 4 presents the physical and hydraulic properties of the examined soils used for the calculations, as taken from the HYDRUS-1D library (Schaap et al., 2001) and as measured physically for the three soil samples from the field site and the modeled soil, as depicted in Fig. 4.
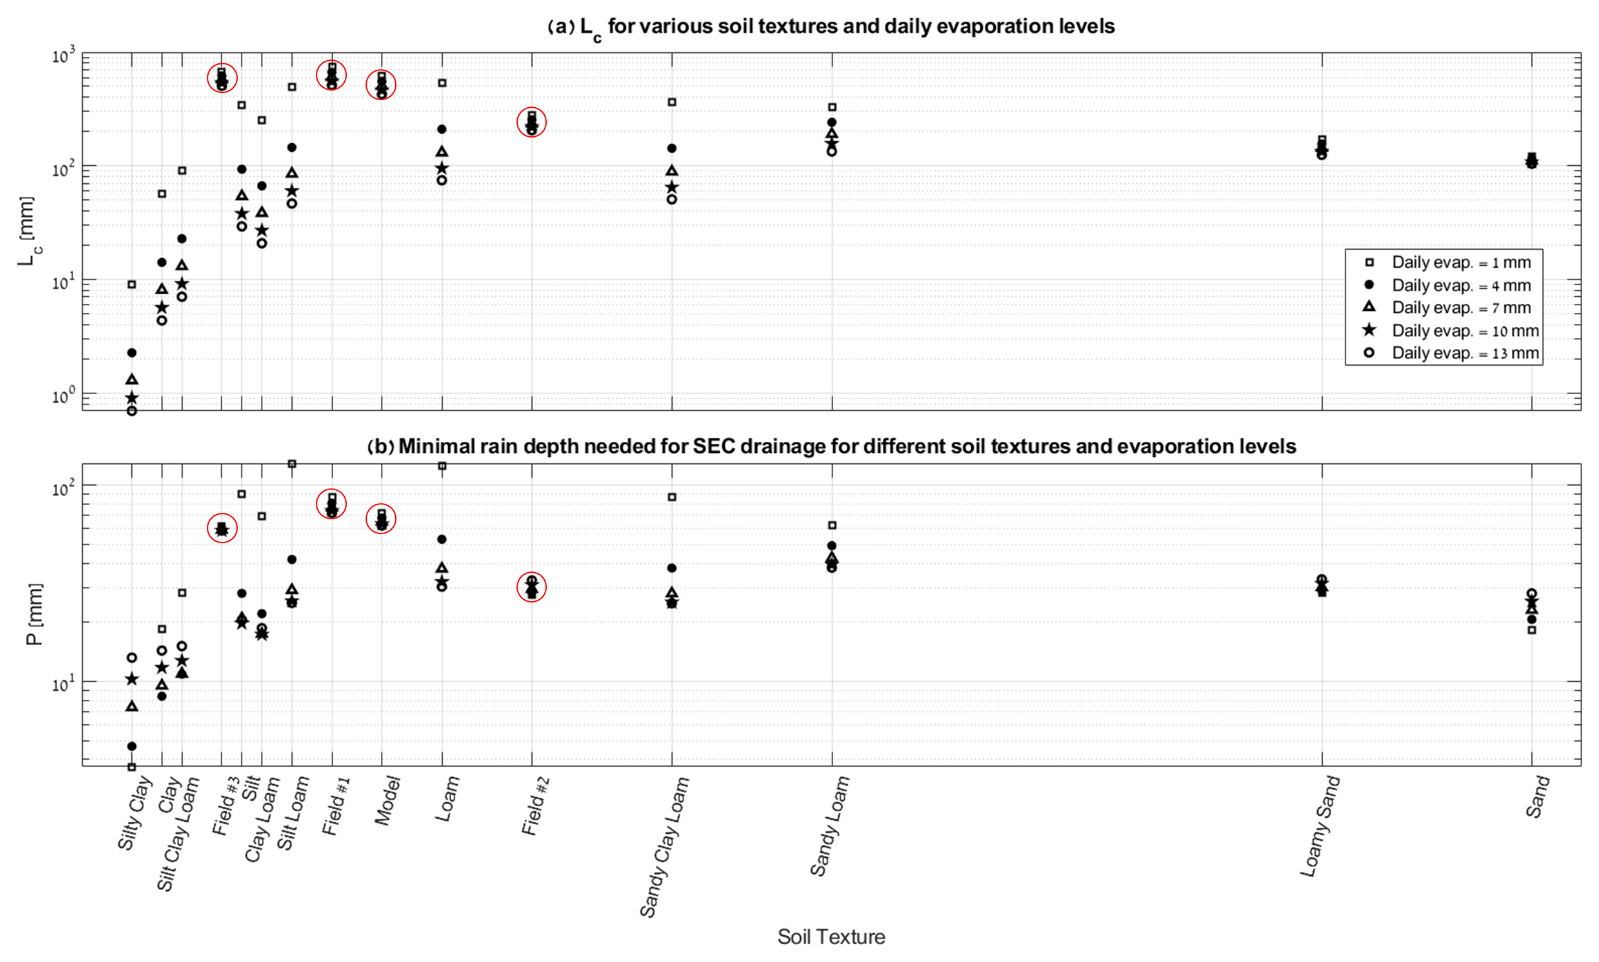
Figure 12The impact of different evaporative conditions and soil textures on Lc (a) and minimal amount of daily precipitation P needed to initiate drainage from the SEC (b) in arid environments. Red contours mark computed Lc and P for the three soil samples from the field and the modeled soil (model). The soils are organized along the x axis in proportion to their α value.
Table 4Soil textural and physical properties from HYDRUS-1D library used for calculations of Keff and θcrit (in table) and Lc and P (in Fig. 12). Soils indicated in bold represent the actual field samples (Field no. 1–no. 3) and the modeled soil used in the HYDRUS-1D numerical simulation (Model).
In agreement with previous calculations (Or and Lehmann, 2019), the medium-texture soils have the deepest Lc (Fig. 12a). For coarser-texture soils, Lc is shorter due to a limited pore size distribution and minor capillary gradient. For finer-texture soils, high viscous resistance and low hydraulic conductivities also lead to short Lc (Or and Lehmann, 2019). Moreover, it is seen in Fig. 12a that, for the relatively high evaporative levels (daily evaporation of 7–13 mm), Lc is quite short and with small differences between the different soil types. Since high evaporation rates usually characterize the dry season, especially in arid areas (see Figs. 8 and 10), there is no practical influence of these short Lc values on solute and contaminant leaching. However, for low evaporative levels (daily evaporation of 1–4 mm), which are commonly associated with rainy periods, a notable difference in terms of Lc length is observed, mainly for the fine- to medium-texture soils. Figure 12b demonstrates that relatively low P levels are sufficient to drain the SEC of fine-texture soils due to the very short Lc of such clayey soils. The highest P levels are needed to drain the SEC of the middle texture and leach down its solutes and contaminants. This is a result of the long Lc of soils such as loamy soils, mainly under the low-evaporation-rate conditions. Shorter P depths are also needed for the drainage of the SEC of sandy soils due to the low θcrit values and relatively short Lc of these soils.
Field sample no. 1 and no. 3 and the modeled soil had relatively high Lc and P values of the order of 50–60 and 60–80 mm, respectively. For field sample no. 2, P was equal to ∼30 mm, and Lc was shallower than other field samples by approximately 25 cm. This disparity emphasizes the major impact that α and n may have on the estimation of SEC thickness and the associated solute transport and leaching dynamics. The good agreement observed between the numerical model results, the field measurements, and the SEC model of the modeled soil supports the hypothesis that the modeled soil accurately represents the local soil within the Ashalim Basin. However, future research should further investigate the sensitivity of the SEC model to variations in soil physical parameters and environmental properties.
As mentioned previously, the use of Eq. (9) and Fig. 12 to estimate the needed amount of rain to initiate water flow through the SEC lower boundary is valid for arid conditions, where rain events are scarce. Under such conditions, the time gap between rain events would suffice for effective drying by the prevailing high capacity of the evaporation processes. For wetter climatic conditions, there is a need to consider cumulative evaporation and precipitation as there may be an accumulation of water at the SEC over consecutive rain events until reaching water levels that are equal to or higher than θcrit, following which downward water flow out of the SEC will occur. Following Lehmann et al. (2019), it is proposed here that the monthly cumulative precipitation be considered to estimate if and how much water would be leached out of the SEC. While Lehmann et al. (2019) neglected cumulative evaporation during the rainy months, here, it is proposed that both monthly cumulative precipitation Pcum (mm) and monthly cumulative evaporation Ecum (mm) be considered in order to determine the amount of water drained off of the SEC:
where D (mm) is the depth of water drained off of the SEC, and θr is the residual water content of the soil. Figure 13a presents monthly cumulative precipitation as measured at the field site and monthly cumulative actual evaporation as simulated by the HYDRUS-1D model in response to measured potential evaporation. In addition, it presents how much water drained to depths greater than Lc based on the SEC model (Eq. 10) and as predicted by the HYDRUS-1D model. For the local climatic conditions in the Ashalim Basin, in agreement with field measurements and the HYDRUS-1D model (Fig. 10c and d), it is seen in Fig. 13a that no drainage occurred over the period of interest.
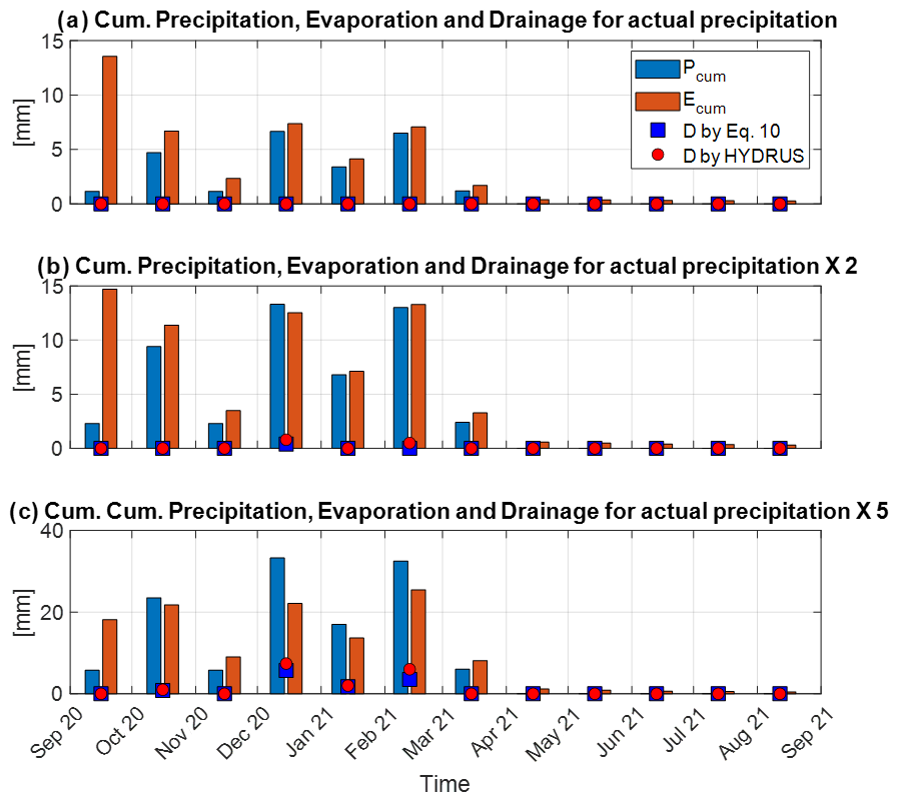
Figure 13Monthly cumulative precipitation (Pcum) and evaporation (Ecum) for actual rain conditions at the Ashalim Basin (a) and for the climatic conditions of doubled (b) and 5-fold-increased (c) precipitation. For all precipitation conditions, water drained out of the SEC (D) is presented for each month as computed by Eq. (10) for the SEC model (blue squares) and as simulated by the HYDRUS-1D model (red circles).
Figure 13b and c present Pcum, Ecum, and D for the climatic conditions of, respectively, doubled and 5 times more rain compared to actual measured precipitation at the field site. For the conditions of doubled precipitation, it is only in December when cumulative monthly precipitation (13.3 mm) was higher than cumulative evaporation (12.5 mm). Computed D for December was minor – of the order of 1 mm – as computed both by Eq. (10) and HYDRUS-1D. In February, the HYDRUS-1D model predicted another minor flow of water out of the SEC, while Eq. (10) did not account for any flow since the overall evaporation during this month exceeded precipitation. This discrepancy highlights a limitation of using the cumulative evaporation and precipitation analysis as it overlooks intense and short rain events that may generate some flow of water out of the SEC for a short period, even if the monthly cumulative evaporation is higher than cumulative precipitation. For the extremely wet conditions with 5 times more rain than actual measurements, it is seen in Fig. 13c that, during December, January, and February, cumulative precipitation was notably higher than cumulative evaporation, and, consequently, relatively high D values were predicted by both Eq. (10) and the HYDRUS model. The good agreement between the monthly cumulative precipitation–evaporation analysis and the HYDRUS model shows the high validity of the cumulative evaporation–precipitation method in estimating water and solute flow through the lower boundary of the SEC for wetter climatic conditions.
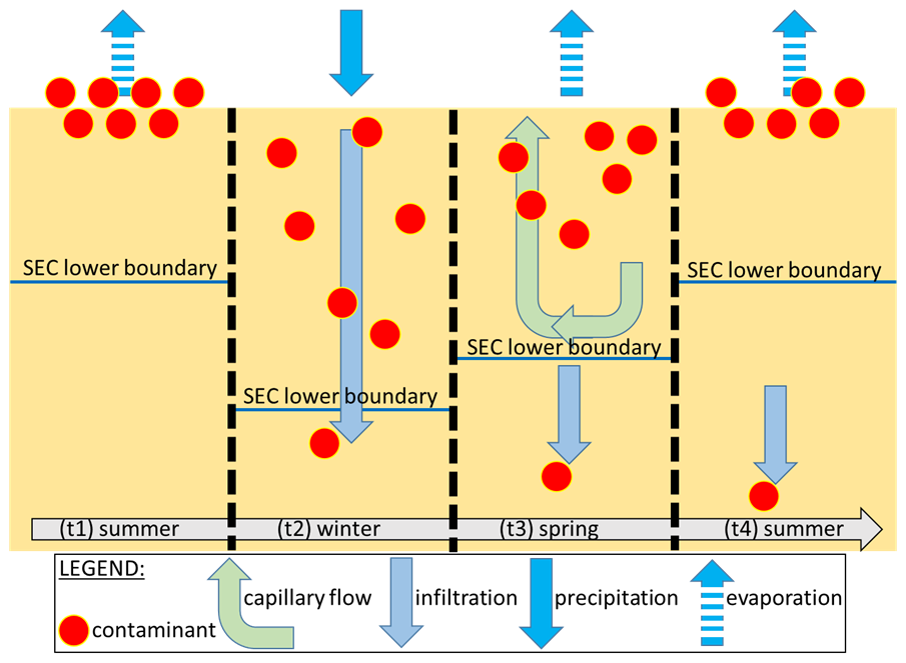
Figure 14Conceptual model describing the fate of solutes along a soil profile under arid environmental conditions following the SEC concept. During rain events, the solutes are leached downward, but as long as they remain within the SEC zone, they can move upward with capillary water toward the evaporation front at the soil surface. Solutes that are mobilized to depths greater than the SEC lower boundary can no longer flow upward toward the soil surface.
Experimental results, field measurements, and numerical model simulations all indicate that, under arid conditions and environments, the mobilization and removal of solutes and pollutants to substantial depths in sandy soils is a minor process even when considering solutes that do not tend to be absorbed into soil particles. Given the relatively high hydraulic conductivities of the sandy soils, it is apparent that similar conclusions can be drawn for heavier and less permeable soils under arid conditions. The sporadic rain events that occur in arid environments enable only minor downward mobilization of the solutes, whereas the dry periods between such rain events are sufficient to force capillary upward transport of the solutes and dissolved pollutants. Figure 14 is a conceptual model that illustrates the dynamics of water flow and solute transport processes, as demonstrated in this work. The soil evaporation capacitor (SEC) model (Or and Lehmann, 2019), which describes the depth of the soil that contributes water for the first stage of evaporation, was applied to estimate the depth to which the solutes and contaminates circulate vertically, further supporting the conceptual model. It was shown that, for arid conditions, the SEC water content levels, in between the short and infrequent rain events, are very low; hence, it is possible to assume that processes of infiltration into the SEC are taking action into dry soil. However, for wetter climatic conditions, it is crucial to consider the cumulative effect of water in the SEC layer. The sensitivity of the SEC model to the van Genuchten n and α parameters was demonstrated as inaccurate estimations of these properties may affect the computed thickness of the SEC layer and consequent water flow and solute transport processes. Therefore, these parameters have to be characterized as accurately as possible, and the results should be compared and validated in comparison to field measurements and other models. Once validated, the SEC model can be used to determine future dynamic flow of the porewater and solute and contaminant transport in the upper soil layers, which are usually the most important from an ecological perspective.
Since catastrophic pollution events in arid environments are, in many cases, of extreme magnitude and related to extreme flash flood events, it is likely that vast areas beyond the MFC will be exposed to the contamination. These areas, however, do not experience regular and natural flash floods, and, thus, their natural attenuation processes driven by water are expected to be very limited. Therefore, it is estimated that areas like the sandy terraces of the Ashalim stream will remain polluted long after the spill event, imposing significant chemical stress on the habitat and rendering it slow in remediation. During this period, it may also act as a slow-release source of contamination to the environment.
Based on the various observations and analyses presented in this study, it is proposed that the SEC model be applied as a practical tool for estimating the potential mobility of solutes and contaminates from the upper part of the soil profile for different soil types and climatic conditions. The soil textural properties and evaporative conditions determine the SEC depth and the minimal water content of the SEC soil that is needed to initiate effective drainage and solute removal from the SEC to deeper horizons of the soil profile. Therefore, simple and basic information about the soil properties and climatic conditions of a contaminated area may be sufficient to provide an estimate regarding the removal efficiency of the contaminated layer by leaching processes, which constitutes critical information when considering the bioavailability of contaminants.
Data and codes are available at https://doi.org/10.6084/m9.figshare.25534285.v3 (Nachshon, 2024).
RG, IG, and UN: conceptualization and methodology. RG and GS: field investigation and lab work. RG: writing (original draft). RG, IG, and UN: writing (review and editing).
The contact author has declared that none of the authors has any competing interests.
Publisher's note: Copernicus Publications remains neutral with regard to jurisdictional claims made in the text, published maps, institutional affiliations, or any other geographical representation in this paper. While Copernicus Publications makes every effort to include appropriate place names, the final responsibility lies with the authors.
We extend our gratitude to the staff of the Israel Nature and Parks Authority for their valuable insights, helpful information, and supportive work at the site.
This research has been supported by “Hamaarag – Israel's National Ecosystem Assessment Program”.
This paper was edited by Jan Vanderborght and reviewed by two anonymous referees.
Abdel-Hakeem, M. and El-Habaak, G.: The potential production of rock-based fertilizer and soil conditioner from phosphate mine wastes: A case study from Abu-Tartur plateau in the Western Desert of Egypt, J. Clean. Prod., 329, 129761, https://doi.org/10.1016/j.jclepro.2021.129761, 2021.
Amiaz, Y., Sorek, S., Enzel, Y., and Dahan, O.: Solute transport in the vadose zone and groundwater during flash floods, Water Resour. Res., 47, W10513, https://doi.org/10.1029/2011WR010747, 2011.
Ashworth, J., Keyes, D., Kirk, R., and Lessard, R.: Standard procedure in the hydrometer method for particle size analysis, Commun. Soil Sci. Plan., 32, 633–642, https://doi.org/10.1081/CSS-100103897, 2001.
Basahi, J. M., Masoud, M. H. Z., and Rajmohan, N.: Effect of flash flood on trace metal pollution in the groundwater – Wadi Baysh Basin, western Saudi Arabia, J. Afr. Earth Sci., 147, 338–351, https://doi.org/10.1016/j.jafrearsci.2018.06.032, 2018.
Becker, N., Gross, Y., and Lavee, D.: Cost–benefit analysis of restoring an ephemeral desert stream after an ecological accident, Water Policy, 22, 328–347, https://doi.org/10.2166/wp.2020.014, 2020.
Cohen, N.: Ramat Hovav industrial park in the Negev desert–Israel, Present Environ. Sustain. Dev., 1, 3–14, 2007.
Dai, S., Shin, H., and Santamarina, J. C.: Formation and development of salt crusts on soil surfaces, Acta Geotech., 11, 1103–1109, https://doi.org/10.1007/s11440-015-0421-9, 2016.
Dou, M., Mi, Q., Li, C., and Wang, Y.: Ecological desert environment suffers from industrial wastewater pollution in northwestern China, Environ. Earth Sci., 74, 3681–3683, https://doi.org/10.1007/s12665-015-4438-z, 2015.
Effat, H. A. and Elbeih, S. F.: A geospatial model for allocating potential urban–industrial zones in a desert: Case study Matrouh, Egypt, Model. Earth Syst. Environ., 6, 2033–2046, https://doi.org/10.1007/s40808-020-00806-w, 2020.
El Bastawesy, M. and Abu El Ella, E. M.: Quantitative estimates of flash flood discharge into waste water disposal sites in Wadi Al Saaf, the Eastern Desert of Egypt, J. Afr. Earth Sci., 136, 312–318, https://doi.org/10.1016/j.jafrearsci.2017.03.008, 2017.
Gordon, G., Stavi, I., Shavit, U., and Rosenzweig, R.: Oil spill effects on soil hydrophobicity and related properties in a hyper-arid region, Geoderma, 312, 114–120, https://doi.org/10.1016/j.geoderma.2017.10.008, 2018.
Gratzfeld, J. (Ed.): Extractive industries in arid and semi-arid zones: Environmental planning and management, IUCN, ISBN 2-8317-0741-2, 2003.
Greenbaum, N.: Assessment of dam failure flood and a natural, high-magnitude flood in a hyperarid region using paleoflood hydrology, Nahal Ashalim catchment, Dead Sea, Israel, Water Resour. Res., 43, W02401, https://doi.org/10.1029/2006WR004956, 2007.
IPCC: Climate Change 2007: The Physical Science Basis, Cambridge University Press, https://doi.org/10.1017/9781009157896, 2007.
Izquierdo, T., Bonnail, E., Abad, M., Dias, M. I., Prudêncio, M. I., Marques, R., Rodríguez-Vidal, J., and Ruiz, F.: Pollution and potential risk assessment of flood sediments in the urban area of the mining Copiapó basin (Atacama Desert), J. S. Am. Earth Sci., 103, 102714, https://doi.org/10.1016/j.jsames.2020.102714, 2020.
Leaver, R.: International oil and international regimes: Mirages in a desert, Aust. J. Int. Aff., 44, 143–154, https://doi.org/10.1080/10357719008445028, 1990.
Lehmann, P., Assouline, S., and Or, D.: Characteristic lengths affecting evaporative drying of porous media, Phys. Rev. E, 77, 056309, https://doi.org/10.1103/PhysRevE.77.056309, 2008.
Lehmann, P., Berli, M., Koonce, J. E., and Or, D.: Surface evaporation in arid regions: Insights from lysimeter decadal record and global application of a surface evaporation capacitor (SEC) model, Geophys. Res. Lett., 46, 9648–9657, https://doi.org/10.1029/2019GL083932, 2019.
Luna, D., Calero, J., Sancho, E. D., Luna, C., Posadillo, A., Bautista, F. M., Romero, A. A., Berbel, J., and Verdugo, C.: Technological challenges for the production of biodiesel in arid lands, J. Arid Environ., 102, 127–138, https://doi.org/10.1016/j.jaridenv.2013.11.014, 2014.
Marazuela, M. A., Vázquez-Suñé, E., Ayora, C., and García-Gil, A.: Towards more sustainable brine extraction in salt flats: Learning from the Salar de Atacama, Sci. Total Environ., 703, 135605, https://doi.org/10.1016/j.scitotenv.2019.135605, 2020.
Masoud, M. H. Z., Basahi, J. M., and Rajmohan, N.: Impact of flash flood recharge on groundwater quality and its suitability in the Wadi Baysh Basin, Western Saudi Arabia: an integrated approach, Environ. Earth Sci., 77, 395, https://doi.org/10.1007/s12665-018-7578-0, 2018.
Morin, J., Goldberg, D., and Seginer, I.: A Rainfall Simulator with a Rotating Disk, T. ASAE, 10, 0074–0077, https://doi.org/10.13031/2013.39599, 1967.
Nachshon, U., Weisbrod, N., Katzir, R., and Nasser, A.: NaCl Crust Architecture and Its Impact on Evaporation: Three-Dimensional Insights, Geophys. Res. Lett., 45, 6100–6108, https://doi.org/10.1029/2018GL078363, 2018.
Nachshon, U.: FIGS_PLUS_DATA_RESULTS_SECTION_ GOLAN_ET_AL_2024, figshare [code and data set], https://doi.org/10.6084/m9.figshare.25534285.v3, 2024.
Or, D. and Lehmann, P.: Surface Evaporative Capacitance: How Soil Type and Rainfall Characteristics Affect Global-Scale Surface Evaporation, Water Resour. Res., 55, 519–539, https://doi.org/10.1029/2018WR024050, 2019.
Parkhurst, D. L. and Appelo, C. A. J.: Description of input and examples for PHREEQC version 3 – a computer program for speciation, batch-reaction, one-dimensional transport, and inverse geochemical calculations, in: US geological survey techniques and methods, vol. 6, U.S. Geological Survey, p. 497, 2013.
Portnov, B. A. and Safriel, U. N.: Combating desertification in the Negev: dryland agriculture vs. dryland urbanization, J. Arid Environ., 56, 659–680, https://doi.org/10.1016/S0140-1963(03)00087-9, 2004.
Reynolds, R. L., Yount, J. C., Reheis, M., Goldstein, H., Chavez, P., Fulton, R., Whitney, J., Fuller, C., and Forester, R. M.: Dust emission from wet and dry playas in the Mojave Desert, USA, Earth Surf. Proc. Land., 32, 1811–1827, https://doi.org/10.1002/esp.1515, 2007.
Rudnik, G.: 2D Hydrodynamic Modelling of the 2017 Reservoir Dam Failure at Ashalim River Catchment, Dead Sea, Israel, Master thesis, Brandenburg University of Technology, 2019.
Salom, A. T. and Kivinen, S.: Closed and abandoned mines in Namibia: a critical review of environmental impacts and constraints to rehabilitation, S. Afr. Geogr. J., 102, 389–405, https://doi.org/10.1080/03736245.2019.1698450, 2020.
Schaap, M. G., Leij, F. J., and van Genuchten, M. T.: Rosetta: a computer program for estimating soil hydraulic parameters with hierarchical pedotransfer functions, J. Hydrol., 251, 163–176, https://doi.org/10.1016/S0022-1694(01)00466-8, 2001.
Schelle, H., Heise, L., Jänicke, K., and Durner, W.: Water retention characteristics of soils over the whole moisture range: a comparison of laboratory methods, Eur. J. Soil Sci., 64, 814–821, https://doi.org/10.1111/ejss.12108, 2013.
Schewe, J., Heinke, J., Gerten, D., Haddeland, I., Arnell, N. W., Clark, D. B., Dankers, R., Eisner, S., Fekete, B. M., Colón-González, F. J., Gosling, S. N., Kim, H., Liu, X., Masaki, Y., Portmann, F. T., Satoh, Y., Stacke, T., Tang, Q., Wada, Y., Wisser, D., Albrecht, T., Frieler, K., Piontek, F., Warszawski, L., and Kabat, P.: Multimodel assessment of water scarcity under climate change., P. Natl. Acad. Sci. USA, 111, 3245–3250, https://doi.org/10.1073/pnas.1222460110, 2014.
Şen, Z., Al Alsheikh, A., Al-Turbak, A. S., Al-Bassam, A. M., and Al-Dakheel, A. M.: Climate change impact and runoff harvesting in arid regions, Arab. J. Geosci., 6, 287–295, 2013.
Sharma, K. D., Kumar, S., and Gough, L. P.: Rehabilitation of lands mined for limestone in the Indian desert, Land Degrad. Dev., 11, 563–574, https://doi.org/10.1002/1099-145X(200011/12)11:6<563::AID-LDR414>3.0.CO;2-I, 2000.
Shirazi, M. A. and Boersma, L.: A Unifying Quantitative Analysis of Soil Texture, Soil Sci. Soc. Am. J., 48, 142–147, https://doi.org/10.2136/sssaj1984.03615995004800010026x, 1984.
Shumway, J. M. and Jackson, R. H.: Place Making, Hazardous Waste, And The Development Of Tooele County, Utah*, Geogr. Rev., 98, 433–455, https://doi.org/10.1111/j.1931-0846.2008.tb00311.x, 2008.
Simunek, J., Van Genuchten, M., and Sejna, M.: The HYDRUS-1D software package for simulating the one-dimensional movement of water, heat, and multiple solutes in variably-saturated media, 2005.
Skopp, J. M.: Physical properties of primary particles, in: Soil physics companion, edited by: Warrick, A. W., CRC press, 1–15, ISBN 0-8493-0837-2, 2001.
van Genuchten, M. T.: A Closed-form Equation for Predicting the Hydraulic Conductivity of Unsaturated Soils, Soil Sci. Soc. Am. J., 44, 892–898, 1980.
van Genuchten, M. T.: Analyzing crop salt tolerance data: Model description and user's manual, Washington, DC, 1983.
Zoccatelli, D., Marra, F., Smith, J., Goodrich, D., Unkrich, C., Rosensaft, M., and Morin, E.: Hydrological modelling in desert areas of the eastern Mediterranean, J. Hydrol., 587, 124879, https://doi.org/10.1016/j.jhydrol.2020.124879, 2020.