the Creative Commons Attribution 4.0 License.
the Creative Commons Attribution 4.0 License.
 | 11 Feb 2025
Spatial and temporal heterogeneity of soil respiration in a bare-soil Mediterranean olive grove
Sergio Aranda-Barranco
Penélope Serrano-Ortiz
Andrew S. Kowalski
Enrique P. Sánchez-Cañete
Soil respiration (Rs) is an important carbon flux in terrestrial ecosystems, and knowledge about this CO2 release process and the drivers involved is a key topic in the context of global change. However, temporal and spatial variability has not been studied extensively in semi-arid systems such as olive groves. In this study, we show a full year of continuous measurements of Rs with six automatic chambers in a fertigated olive grove with bare soil in the Mediterranean accompanied by modeled ecosystem respiration (Reco) estimated by decomposing net ecosystem exchange (NEE) measured using the eddy covariance (EC) technique. To study spatial variability, the automatic chambers were distributed equally under the canopy (Rs Under-Tree) and in the center of the alley (Rs Alley), and the gradient of Rs between both locations was measured in several manual campaigns in addition to angular changes about the olive trees. The results indicate that Rs Under-Tree was 3 times higher than Rs Alley in the annual computations. Higher Rs was found on the southern face, and an exponential decay of Rs was observed until the alley's center was reached. These spatial changes were used to weigh and project Rs onto the ecosystem scale, whose annual balance was 1.6–2.3 times higher than the Reco estimated using EC-derived models. Rs Under-Tree represented 39 % of the Rs of the olive grove. We found values of Q10<1 in the vicinity of the olive tree in the warm period. Outbursts of CO2 emissions associated with precipitation events were detected, especially in the alley, during dry periods and after extended periods without rain, but they were not accurately detected by EC-derived respiration models. We point out an interaction between several effects that vary in time, that are different under the canopy than in the alleys, and that the accepted models for estimating Q10 and Reco do not consider. These results show high spatial and temporal heterogeneity in soil respiration and the factors involved, which must be considered in future works in semi-arid agroecosystems.
- Article
(7207 KB) - Full-text XML
-
Supplement
(560 KB) - BibTeX
- EndNote


Soil respiration (Rs) commonly refers to the natural release of CO2 from the soil surface into the atmosphere and plays a key role in the carbon cycle. The global annual release of CO2 through Rs is ∼ 95 PgC yr−1 (Xu and Shang, 2016; Zhao et al., 2017), which is approximately 10 times higher than current emissions from fossil fuels (Friedlingstein et al., 2022). Globally, Rs is the second largest carbon flux, accounting for 85 %–90 % of gross primary production (Hashimoto et al., 2015; Jian et al., 2021). However, global Rs is not constant but increased by 0.04 PgC yr−1 between 1960 and 2012 (Zhao et al., 2017). Rs is composed of heterotrophic and autotrophic respiration. Rs is mainly influenced by the carbon supply, temperature, and soil moisture (Hursh et al., 2017), and these parameters vary unevenly with global change. In fact, annual Rs trends respond differently depending on latitude and biome, increasing mainly in boreal zones and decreasing in tropical areas (Lei et al., 2021). In contrast, in semi-arid regions such as the Mediterranean, no long-term trends are observed, although reduced rainfall in this region is expected to reduce Rs (Talmon et al., 2011) due to water limitation.
The importance of water as a limiting factor in Rs is more complex than previously thought (Leon et al., 2014). The Mediterranean climate is distinguished by irregular rainfall patterns, high evaporation rates, and water scarcity during summer months. These characteristics can drive high temporal variability in Rs because of its critical sensitivity to soil moisture. Water controls the movement of soluble substrates when moisture is scarce and availability of oxygen when it is abundant (Skopp et al., 1990). However, although Rs has an important influence on the carbon cycle feedback in Mediterranean ecosystems, the understanding of Rs in semi-arid regions is still evolving (González-Ubierna and Lai, 2019). Since heterotrophic Rs is positively correlated with soil organic carbon content (Lei et al., 2021), which is generally low in Mediterranean ecosystems (Muñoz-Rojas et al., 2012), low values of Rs are expected in such ecosystems. However, higher Rs values are found in croplands in which carbon and water respond to management (Wollenberg et al., 2016). More productivity is expected in cropland because of the increase in nutrients provided by fertilizers, soil aeration, and irrigation. Therefore, the conversion to cropland of ecosystems typical of semi-arid areas can increase Rs (Wang et al., 2023) compared with soils of natural ecosystems. However, the variety of agricultural systems in the Mediterranean is great (Malek and Verburg, 2017), which can translate into different responses of Rs for crop types and management regimes, and therefore it is necessary to study the carbon fluxes specifically for each agroecosystem and its different management regimes.
One of the predominant tree crops in the Mediterranean basin is olives (Olea europaea L.). Their cultivation has significant economic, social, and environmental consequences for this region, which accounts for more than 90 % of global production (FAOSTAT, 2023). Although allowing weed cover in alleys is widely accepted as sustainable crop management (Novara et al., 2021), weed growth is frequently controlled to avoid competition. A drawback of this practice is that the precipitation regime promotes soil erosion in situations where the soil is bare, leading to a rise in soil CO2 emissions (García-Ruiz et al., 2013). In addition, irrigation is a common practice in this crop during water scarcity periods, when olive trees typically decrease their photosynthesis and, consequently, their yield during extended drought periods (Moriana et al., 2003). These different management options and inputs influence seasonal soil CO2 emissions in Mediterranean olive agroecosystems (Montanaro et al., 2023) because they can affect the factors that control Rs. Also, root exudates can promote CO2 emission (Davidson and Janssens, 2006) and create spatial gradients in Rs in a typical olive grove.
Although soil temperature is the main driver of Mediterranean soil CO2 emissions (González-Ubierna and Lai, 2019), water availability is a limiting factor. Therefore, the typical nonlinear growth in Rs as soil temperature increases is modulated by soil moisture in semi-arid areas. Furthermore, the factor by which Rs increases for every 10 °C rise in temperature, known as the apparent Q10 (Davidson and Janssens, 2006) and frequently used to model Rs, is in turn influenced by other different drivers in semi-arid regions. Q10 is rarely measured continuously, and obtaining this parameter uninterruptedly could elucidate the existence and interdependence of more Rs drivers. Additionally, rain pulse events play a key role in semi-arid regions (e.g., the Mediterranean) during dry seasons and may alter the annual carbon balance. The Birch effect (Birch, 1964) describes how carbon dioxide emissions increase by a high rate of rapid mineralization after the soil is rewetted due to a rain pulse event. This mechanism can contribute 5 % of the total annual respiration in semi-arid regions (Delgado-Balbuena et al., 2023), can reduce the annual net carbon gain significantly (Jarvis et al., 2007), and has not been explored continuously in olive grove soils. Moreover, the expected alterations in precipitation patterns may exert more substantial impacts on Rs than projected temperature increases (Li et al., 2020). Therefore, water is a critical determinant of Rs, and the techniques used to understand Rs drivers in temperate climates (especially focused on temperature) are not applicable in Mediterranean-type climates because other drivers covary with soil moisture.
Rs measurements are usually made at specific times, which makes it difficult to identify the drivers of Rs. In olive groves, Rs has been studied using impedance measurements (Sierra et al., 2016), the respirometric method (Álvarez et al., 2007; Gómez et al., 2009), gas chromatography (Marzaioli et al., 2010), process-based modeling (Nieto et al., 2013), and manual chamber systems (Testi et al., 2008; Almagro et al., 2009; Bertolla et al., 2014; Turrini et al., 2017; Chamizo et al., 2017; Taguas et al., 2021; Panettieri et al., 2022; Montanaro et al., 2023). The chamber system is widely used; however, in most cases, measurements are performed on favorable weather days during (weekly or monthly) manual diurnal campaigns. Non-continuous measurements have limitations regarding statistical replication, temporal dependency, annual budgets, and the related level of uncertainty (Vargas and Le, 2023). It is necessary to generate precise long-term predictions of Rs under varying environmental circumstances to enhance our understanding of its impact on Reco (Sánchez-Cañete et al., 2017). Continuous measurements provide information at all temporal scales and can reveal phenomena that occur at times when sampling is not usually performed, such as at night or during rain events, and they can be key to understanding the multitude of processes influencing Rs. In this sense, the eddy covariance (EC) technique has emerged as a significant tool, enabling the assessment of ecosystem CO2 vertical fluxes over extensive spatial and temporal scales while preserving the integrity of the studied ecosystem (Reichstein et al., 2005; Baldocchi, 2020). Because most ecosystem respiration (Reco) is due to Rs, it is common to use the net ecosystem exchange (NEE) values measured with the eddy covariance technique to model Reco as a proxy for Rs. However, the models used are limited because they include aboveground respiration and do not consider the spatial heterogeneity of Rs and the multitude of determinants involved in Rs processes.
Variability in Rs is not only temporal, but also spatial (Stoyan et al., 2000), even for a “homogeneous” landscape system such as a bare-soil olive grove. Although the spatial variability of Rs in olive groves has been studied somewhat (Bertolla et al., 2014; Montanaro et al., 2023), the difference between Rs under trees versus alleys has not been studied before. In the vicinity of the olive tree, we expected to find higher Rs values because of autotrophic respiration of the roots and an increase in heterotrophic respiration due to the contribution of photo substrates (Högberg et al., 2001). On the other hand, in the alley, we expected to find lower Rs values because there are no photo substrates and negligible autotrophic respiration. Therefore, the main objectives of this study were to (i) determine the temporal and spatial variability of Rs in an olive grove; (ii) analyze the main environmental drivers of Rs and its temporal and spatial dependence, including rain pulse events; and (iii) assess modeled Reco using data from an eddy covariance tower, comparing it with the upscaled ecosystem Rs of the olive grove. To address these objectives, we analyzed a full year's worth of soil and ecosystem respiration in an olive grove in southern Spain measured with an automatic multi-chamber system.
2.1 Site description
This study was conducted in an irrigated olive grove (Olea europaea L. Arbequina) from Cortijo Guadiana (37°54′45′′ N, 3°13′40′′ W; 370 m a.s.l.) in Úbeda (Jaén, Spain). Castillo de Canena, SL owns this traditional olive grove. The region has a Mediterranean climate (Köppen classification: Csa) with dry and warm summers, a mean annual temperature of 16 °C, annual precipitation of 470 ± 160 mm, and potential evapotranspiration of 1205 ± 95 mm (n=18; IFAPA, 2022). Between March and November, the olive trees received nocturnal drip irrigation three times a week (32 L h−1 for 8 h). These trees were situated in clay loam soil and were subjected to fertigation, in which each tree received an additional 25–40 g of NPK fertilizer every night. The trees have an approximate height of 4 m, an age of ∼ 85 years, a leaf area index of 1.89 ± 0.17 m2 m−2, and an estimated canopy radius of 2.8 ± 0.3 m. The plantation layout follows a 12 × 12 m frame, resulting in a tree distribution of approximately 69–70 per hectare with 27 % canopy cover (data obtained with Google Earth and ImageJ software). In 2014, a homogeneous and flat parcel of the olive grove was selected for the application of glyphosate-based herbicide in fall and winter to prevent plant growth. Since then, the soil of the plot has remained bare most of the time and extra herbicide has been applied to prevent rebound of the herbaceous cover and keep maximum control over external conditions. For the soil characterization, see Aranda-Barranco et al. (2023).
2.2 Soil respiration
2.2.1 Continuous measurements
In June 2020, six automatic soil CO2 flux chambers were installed in an olive grove parcel treated with herbicide over PVC collars (20 cm internal diameter) inserted into the soil at similar depths 1 week before starting the measurement. For volume correction, the average height of each collar was measured (n=4) at the beginning of the installation. The system was composed of one infrared gas analyzer (IRGA, LI-8100A; Li-Cor, Lincoln, NE, USA) coupled to a 16-port multiplexer system (LI-8150; Li-Cor, Lincoln, NE, USA) with three opaque chambers (8100-104) and three clear chambers (8100-104C), the latter on bare soil. The observation interval was 2 min, and the pre-purge and post-purge time lengths were 30 and 45 s, respectively, for a whole cycle every 20 min. The multi-chamber system was configured to measure every 30 min to temporally match the eddy covariance and meteorological data. The data were downloaded monthly and processed with the SoilFlux 4.2.1 software to obtain a complete year of continuous measurements (∼ 18 000 flux values per chamber) by applying the best fit (lower residual values) to concentration changes with time (76 % exponential fit and 24 % linear fit). CO2 fluxes with a coefficient of determination (R2) lower than 0.995 were discarded. Likewise, although the vegetation on the collars was removed periodically, some CO2 fluxes were discarded because of plant regrowth on some collars. A forward–backward predictor based on autoregressive moving-average modeling (ARMA) in the time domain was used to fill the existing and generated gaps (20 % of the total dataset) and thus enable annual integration (see Fig. S1 in the Supplement). For the rest of the analysis, only direct measurements were used.
To study the spatial variability of Rs, three of these long-term chambers were placed under three different trees (Rs Under-Tree) 0.8 m from the center of the olive tree and away from the fertigation drippers, while the other three were placed outside the influence of the olive trees, in the center of the alley (Rs Alley) 5.6 m from the epicenter of each olive tree (Fig. 1). All the chambers were installed south of the trees.
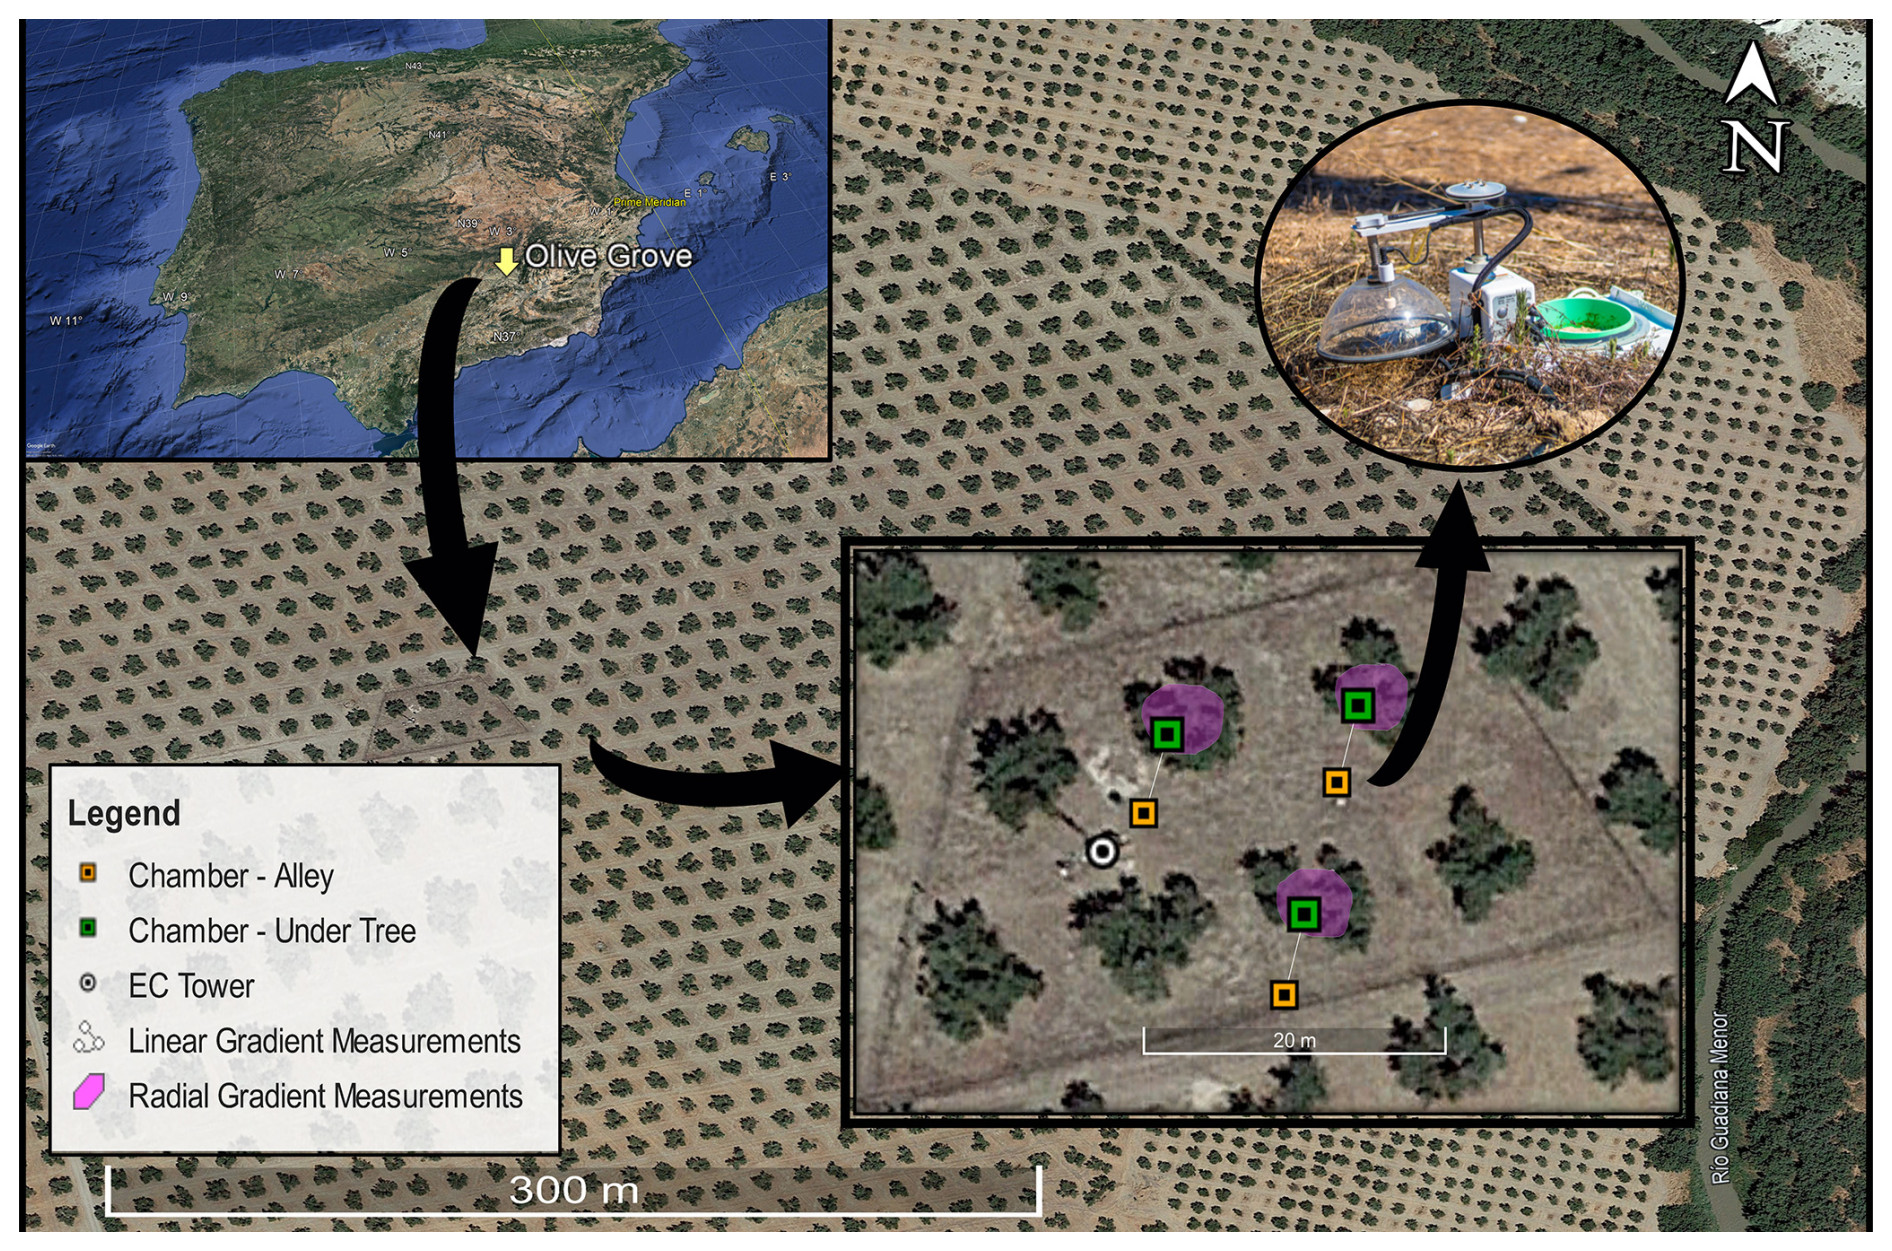
Figure 1The location of the olive grove in Spain, soil chamber distribution, area of the campaign measurements, and eddy covariance tower position of the experimental site. © Google Earth 2023.
2.2.2 Discrete campaigns
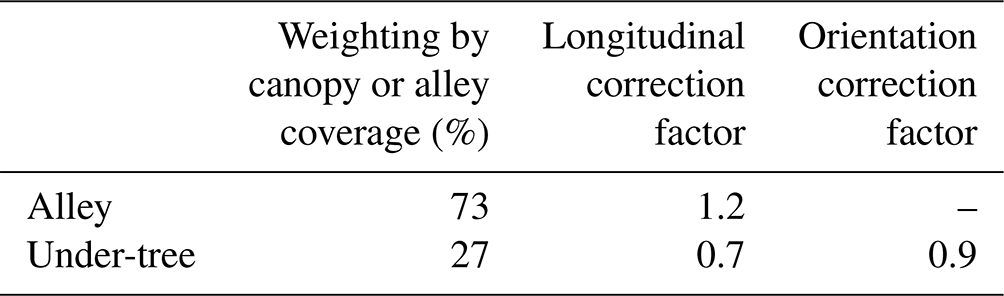
To study the spatial Rs, specific campaigns were conducted in two different setups. (1) To study the linear Rs gradient between the tree and alley chambers, 15 additional collars were installed between long-term chambers (5 collars for each tree and alley location) to accommodate manual measurement campaigns. A portable IRGA (Li-7810 attached to a Smart Chamber, Li-Cor; Lincoln, NE, USA) was used to quantify Rs manually through eight campaigns between September and December 2021. (2) To study the angular Rs gradient, 48 collars were installed around the three selected trees (16 collars for each tree) and nine campaigns were conducted during 2022 to quantify variations in Rs concerning the orientation. To project Rs onto the ecosystem scale (Rs,eco), we weighted the alley and under-tree Rs, first as a function of the ground and canopy cover, second as the average Rs value of the alley and under-tree linear gradient, and third as a correction for measuring in the south-facing direction (Table 1). For estimation of canopy coverage, an average of 50 canopy areas were measured using a Google Earth snapshot and the imageJ software. To know the part of the linear gradient that belongs to the tree and alley, another 50 canopy lengths (each as the average of four cardinal measures) were measured and averaged. The results shown in Fig. 8 (arrows) were used to know the average value of the under-tree and alley linear gradient. Simultaneous measurements of Li-7810 and Li-8100 showed a slope of 0.78 with R2=0.95. The differences in magnitude between the two instruments could be due to a time lag of between 5 and 30 min in that comparison or the two different optical techniques. Such discrepancies are found even within the same IRGA model (Kutikoff et al., 2021). Nevertheless, only relative under-tree and alley values of 7810 campaigns were used in this study.
Table 1Correction and weighting coefficients for the homogeneous calculation of Rs,eco (see Fig. 8).
2.3 Ecosystem respiration
Throughout the study's duration, Reco was estimated from NEE measurements made within the olive grove using the EC technique. An EC tower was set up in the center of the agroecosystem, with instruments positioned at a height of 9.3 m (5.3 m above the canopy). These instruments were used to monitor CO2 levels and wind speeds at 10 Hz. Gas densities were measured using an enclosed-path IRGA (Li-Cor 7200; Lincoln, NE, USA). Simultaneously, wind speeds in the three vector components were recorded using a sonic anemometer (CSAT-3; Campbell Scientific, Logan, UT, USA).
EddyPro software version 7.0.8 computed the half-hourly NEE. Anomalies such as spikes, trends, dropouts, and abrupt variations in the eddy covariance data were filtered using the methodology outlined by Vickers and Mahrt (1997). Time lags between gas concentrations and wind speeds were compensated for using covariance maximization. Half-hourly values of means, variances, and covariances were computed using the Reynolds decomposition rules. Double rotation of coordinates and spectral corrections for high frequency (Fratini et al., 2012) and low frequency (Moncrieff et al., 2006) were applied. Finally, the resulting fluxes were filtered according to the quality control method proposed by Mauder et al. (2013), and additional filters were applied to the half-hourly fluxes using the methodology described by Chamizo et al. (2017).
Approximately 48 % of the data gaps in the agroecosystem measurements were attributed to missing data in the eddy covariance system, primarily stemming from adverse meteorological conditions, nighttime stability conditions, instrumentation malfunctions, or quality control filters. We employed empirical modeling to fill in the missing data. Within the continuous eddy covariance database, we used the marginal distribution sampling technique (Reichstein et al., 2005) to replace missing values. This method is based on the replacement of missing values using a time window of several adjacent days. After replacing the missing data, we applied two semi-empirical models to partition NEE into two components: gross primary production (GPPeco) and Reco. The Reichstein et al. (2005) model Reco-NT is nighttime-based and extends an exponential function of daytime respiration based on nighttime data (with the assumption that GPPeco is negligible during nighttime periods) to estimate daytime periods. The Lasslop et al. (2010) model estimates respiration (Reco-DT) by fitting the light-response curve during the daytime. Missing data replacement and partitioning were performed using the REddyPro R package (Wutzler et al., 2018).
2.4 Environmental measurements
Soil temperature (Ts) and soil water content (SWC) were measured at a depth of 5 cm near each chamber using a thermistor (LI-8150-203; Li-Cor, Lincoln, NE, USA) and ECH2O model EC-5 soil moisture probes (Decagon Devices, Inc., Pullman, WA, USA). In addition, complementary environmental measurements were performed at the experimental site. The air temperature and relative humidity were recorded using a thermohygrometer (HC2S3; Rotronic, AG, Bassersdorf, Switzerland) positioned at a height of 5 m. The vapor pressure deficit (VPD) was computed using the data provided by the thermohygrometer. Incoming and outgoing components of shortwave and longwave radiation were monitored using a four-component radiometer (CNR-4; Kipp and Zonen, Delft, the Netherlands) positioned at a height of 7 m and situated 2 m away from the tower. This setup allowed the determination of the net radiation and albedo. Incident and reflected photosynthetically active radiation (PAR) values were also measured at 7 m using photodiodes (quantum sensor; Li-190, Lincoln, NE, USA). These meteorological data were sampled at 30 s intervals, averaged over 30 min periods, and subsequently stored in a data logger (CR3000; CSI).
2.5 Rain pulse events
The days between precipitation (PPT) events were counted to identify rain pulses. Intervals between PPT events (hereafter inter-event periods, IEPs) were counted in days from the last PPT event, with a magnitude higher than 0.4 mm. The daily timescale was selected to avoid confounding the diurnal Rs variability and to achieve robust analyses. Once the event is reached, if there is rain on the following day, the IEP is reset to 1. The Rs 1 d before the PPT event was taken as a reference. The Rs event response effect (ΔRs) was measured as the difference between the mean daytime Rs after the event and the mean daytime Rs before the event.
The increase in the soil water content (ΔSWC) was calculated analogously to ΔRs. An event was considered to be a rain pulse one when the value of the difference of Rs for the previous day was > 2.5 medians of the entire Rs time series and coincided with a precipitation event. A potential fit was performed with the data, excluding those whose value of the residual exceeded 3 µmol CO2 m−2 s−1.
2.6 Q10 calculations
Weekly windows were used to calculate Q10. For this, an exponential adjustment was conducted according to
to calculate Q10 according to
where Ts is the soil temperature (°C), a is the Rs intercept at a soil temperature of 0 °C, and b serves as the temperature coefficient, indicating the temperature sensitivity of Rs and playing a role in the calculation of Q10 (Lloyd and Taylor, 1994).
2.7 Statistical analysis
We used 30 min values to characterize the diurnal variability, Q10, and spatial gradients of Rs. Data at daily scales were used for the rest of the analysis, including a description of the rainfall pulses, the seasonal variability, and the establishment of significant differences between the trees and alleys. Polynomial curve fitting was used to optimize the relationship between ΔSWC variations as a function of the independent variables of precipitation and the previous SWC. The Shapiro–Wilk test determined the non-normality of the variables. The probability distribution of the variables was evaluated using the kernel density. Boxplots and nonparametric statistical tests of two independent samples (Mann–Whitney test) were performed on the principal subsets of soil respiration, soil temperature, soil water content, and Q10 to identify significant differences in the averages (three chambers) of these variables. The annual balances were calculated as the sum of the daily values, and the error was twice the square root of the accumulated variance of the standard deviation of the data. The graphs and statistical analyses were performed using MATLAB (version R2020a).
3.1 Seasonal variability in Rs and environmental conditions
Significant differences were found between Rs under trees and in alleys. Throughout the measurement year, Rs Under-Tree was 11.5 ± 3.8 µmol CO2 m−2 s−1 and Rs Alley was 4.3 ± 2.3 µmol CO2 m−2 s−1, which means 2.7 times (Mann–Whitney test; p<0.001; n = 17 500) more Rs under the tree (Fig. 2a) than in the alley. The kernel density shows that the highest frequency of Rs Alley was found to be around 1.5 µmol CO2 m−2 s−1 (due to the low winter values), whereas for Rs Under-Tree it was close to that of the median (11.0 µmol CO2 m−2 s−1).
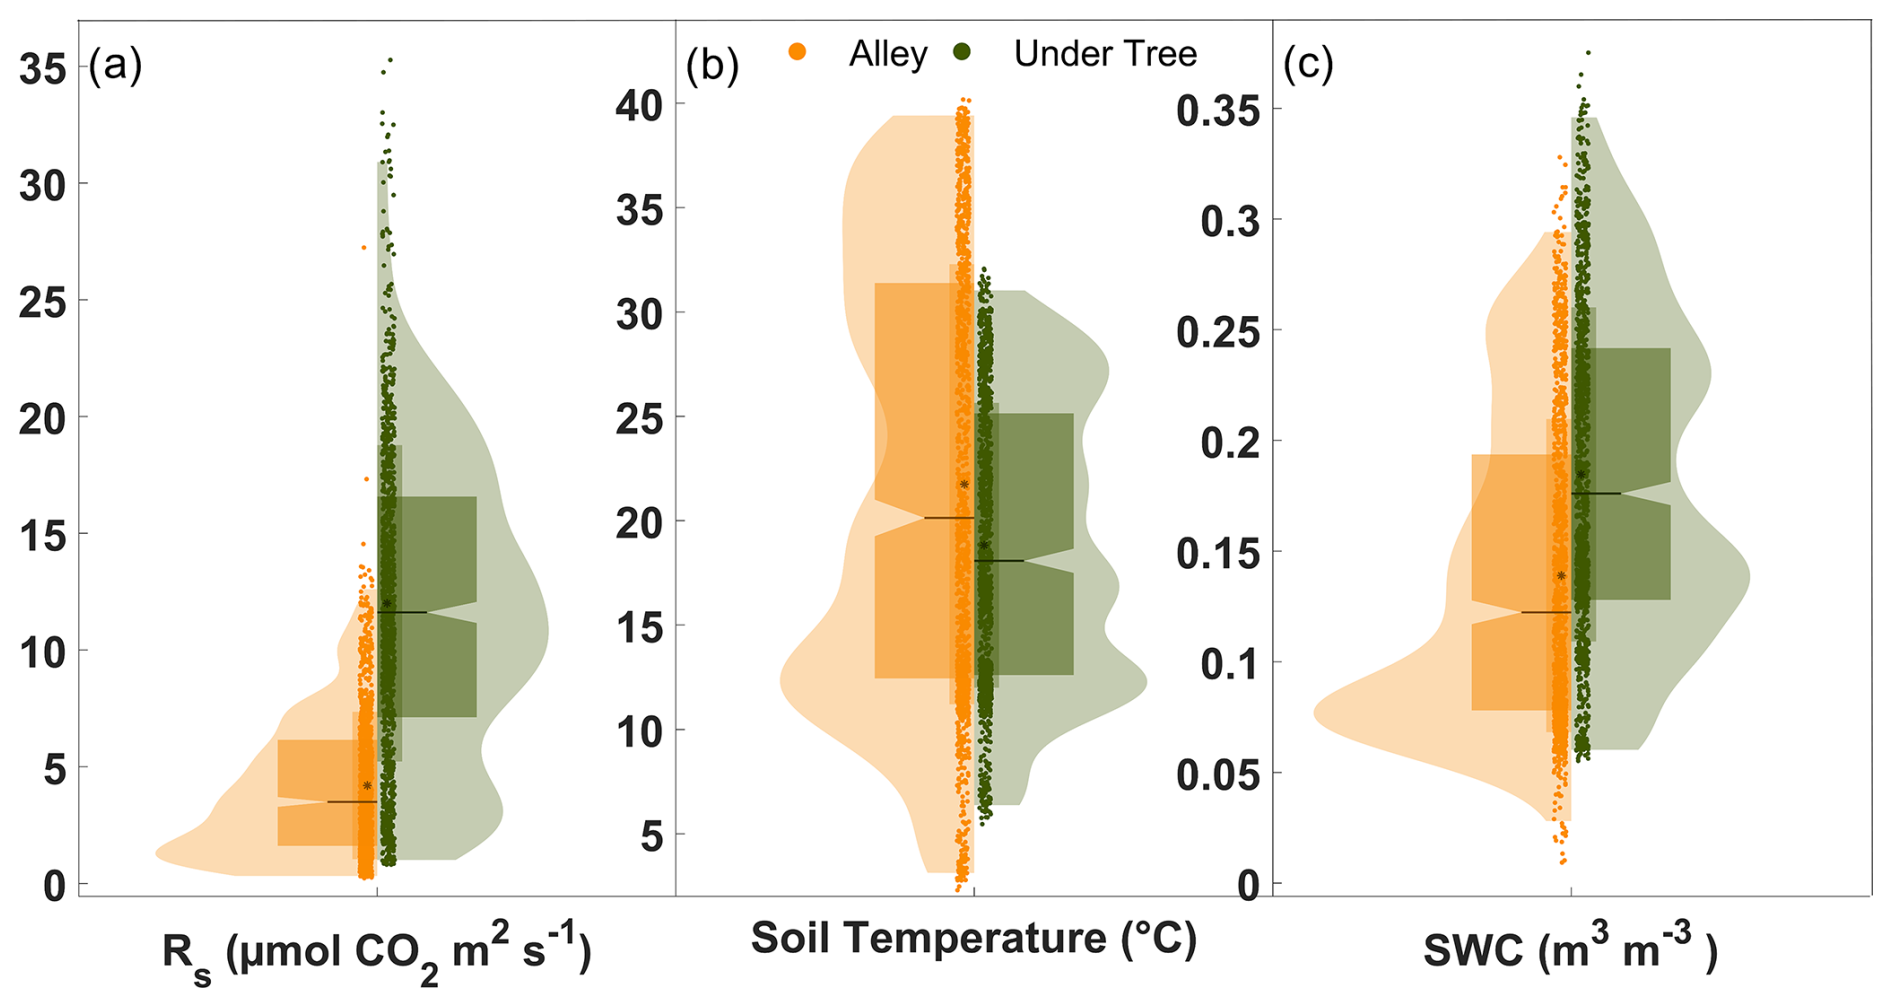
Figure 2Violin plots showing the daily averages of (a) soil respiration, (b) soil temperature, and (c) soil water content. Orange and green indicate alley and under-tree measurements, respectively, each representing the average of three chambers. The horizontal lines (at the notch) indicate the median, and the black dots represent the mean. The curve area is the kernel density, and the wide box represents the range q1–q3.
High seasonal variability in Rs was observed. For both locations, Rs increased in the warmer months and decreased in the colder months (Fig. 3a), showing quite different values between the months. Daily average minima of Rs Alley=0.4 µmol CO2 m−2 s−1 and Rs Under-Tree=3.2 µmol CO2 m−2 s−1 were reached in January for both spatial locations. In contrast, the maximum Rs Alley occurred in April (11.0 µmol CO2 m−2 s−1), while the maximum Rs Under-Tree occurred in May (23.9 µmol CO2 m−2 s−1). The Rs values of both spatial locations were only similar in April, coinciding with the herbicide application. In general, there was greater variability in the Rs data under the tree (±3.8 µmol CO2 m−2 s−1; SD of data at 30 min) than in the alleys (±2.3 µmol CO2 m−2 s−1; SD of data at 30 min), which is visible in the entire daily time series (Fig. 3a). The ratio of Rs Under-Tree to Rs Alley varied throughout the year. In the coldest months, although respiration decreased in both locations, it was more noticeable in the alley, so that magnitudes of up to 7 times more were reached under the tree compared with the alleys (see Fig. S3) when the values of SWC in both locations were equal.
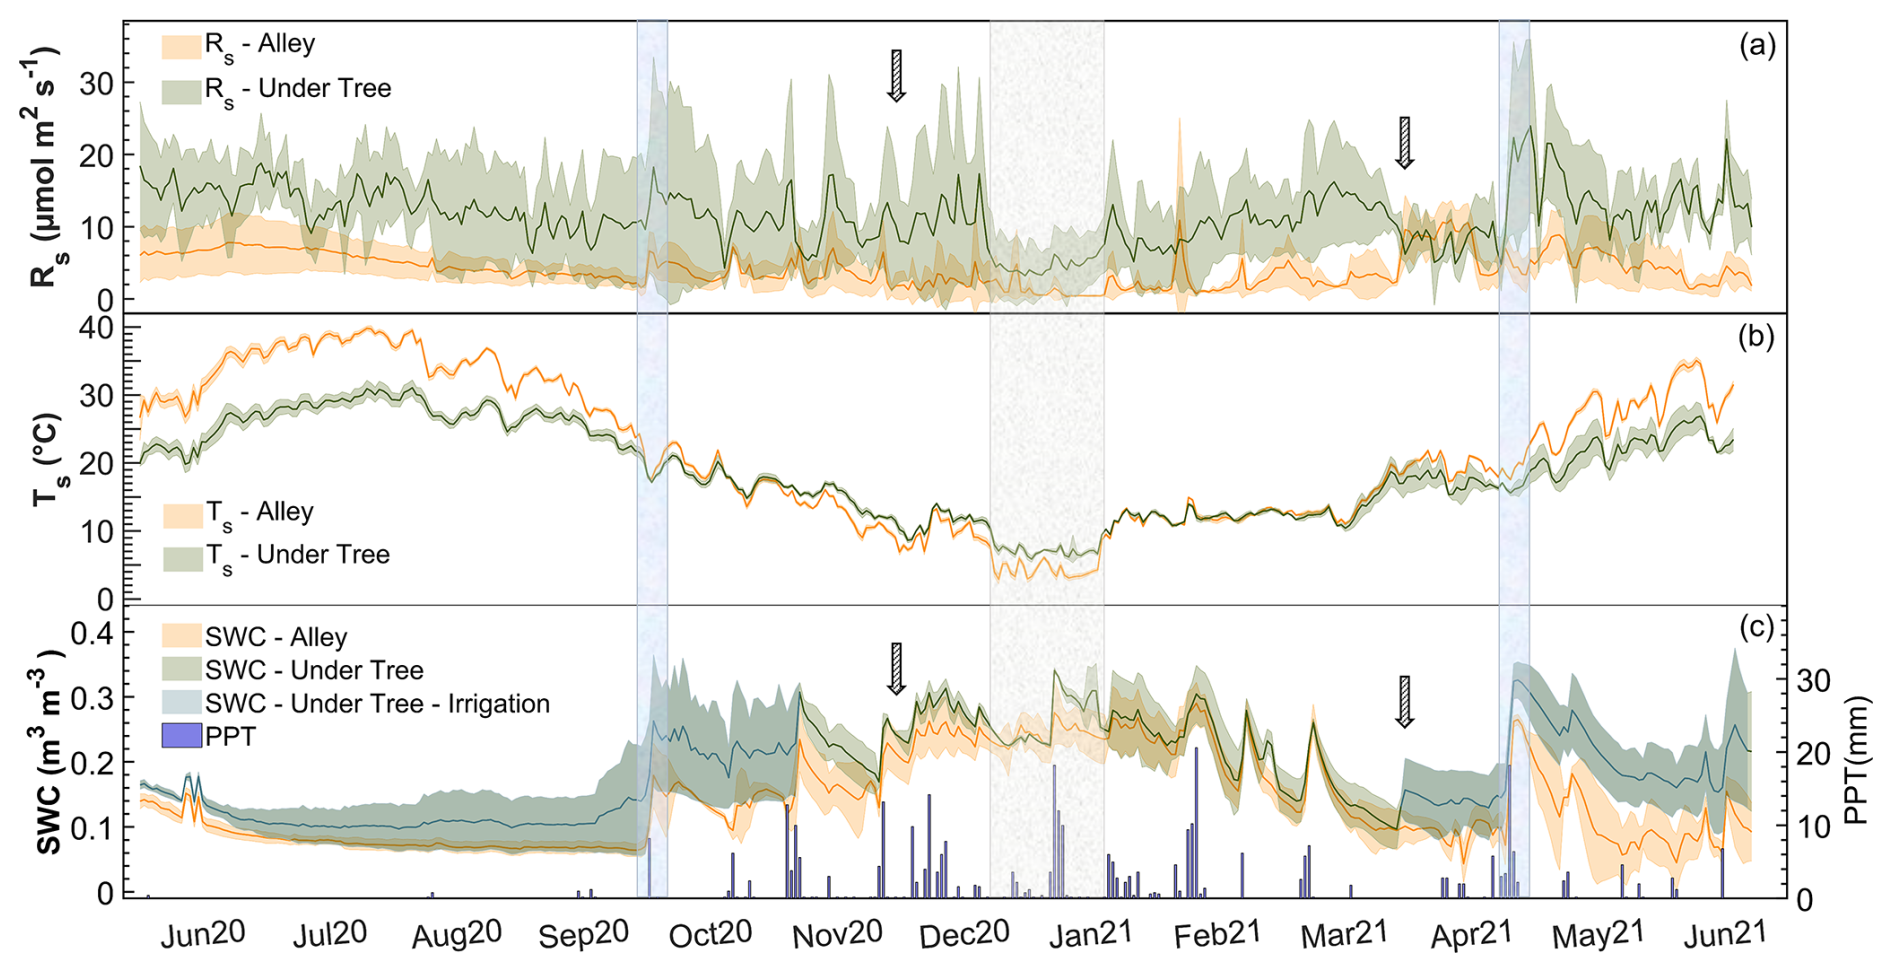
Figure 3Seasonal variability in daily averages under the tree and in the alley of (a) soil respiration (Rs), (b) soil temperature (Ts), and (c) soil water content (SWC) and cumulative daily precipitation (PPT). Solid lines represent the mean of the three chambers, and the shaded area is the standard deviation. The first arrow indicates the olive harvest, and the second arrow indicates the herbicide application. The blue rectangles indicate two important rain pulses, whereas the gray rectangle indicates the period of the lowest values of Rs and Ts.
Differences were observed between Ts and SWC under trees and in alleys (Fig. 2b, c). During the year of measurement, the average daily values were °C, °C, SWC m3 m−3, and SWC m3 m−3, so that Ts Under-Tree was 13 % lower (Mann–Whitney test; p<0.001; n = 17 500) than Ts Alley and SWCUnder-Tree was 33 % higher (Mann–Whitney test; p<0.001; n = 17 500). However, Ts and SWC showed large seasonal variability in the olive grove (Fig. 3b, c). In this way, Ts Under-Tree was higher than Ts Alley in the coldest months, showing a buffer effect of the trees on Ts. In general, Ts was more variable in the alley. More pronounced seasonal variability was observed in the alleys than under the tree, with Ts maxima in July of 31.1 °C under the tree and 39.8 °C in the alley, whereas the minimum Ts was 5.9 °C under the tree and 2.8 °C in the alley (January). The temperature variability of the soil was damped in the proximity of the olive tree, so that the temperature was higher than that of the alley in the cold months and vice versa. From June to September, the high average daily Ts coincided with the absence of precipitation. The end of the summer (September) presented the lowest daily SWC values of SWCUnder-Tree=0.10 m3 m−3 and SWCAlley=0.04 m3 m−3 (Fig. 3b). The first rainfall raised the SWC until it reached maxima of SWCUnder-Tree=0.34 m3 m−3 and SWCAlley=0.29 m3 m−3, so that they became equal later (December) after 1 month without irrigation. The return of irrigation in March again causes a difference in the SWC that is maintained for the rest of the time series. The annual precipitation was 322 mm, mostly in fall, winter, and spring (Fig. 3c), when 75 rain episodes were quantified, with up to 27 % of the events having more than 4 mm d−1 and a maximum of 21 mm d−1; 48 % of the events occurred on successive days (inter-event period IEP = 1) and accounted for 53 % of the accumulated PPT (Fig. S2a).
3.2 Diurnal and spatial variability in Rs chambers
The spatial variability in Rs in the six chambers and the three tree–alley chamber pairs is shown by the inter-chamber variability in Fig. 4. In the alleys, we found daily variability with a maximum Rs at midday, coinciding with the maximum temperatures (Fig. 4). However, the typical daily bell pattern was not always detected in the three chambers. During July, one alley chamber consistently showed no diurnal variability. In general, in winter, diurnal variability was detected, with up to 3 µmol CO2 m−2 s−1 more at midday than at night (data not shown). In spring, Rs was between 5 and 9 µmol CO2 m−2 s−1 higher at midday compared to at night (Fig. 4d–f). On the other hand, the high variability of the fluxes under the trees caused the daily trend in Rs to be statistically insignificant (pvalue=0.57; n=240). However, we find an exception in the hottest summer months, when soil respiration decreases in the afternoon and the VPD increases (pvalue<0.05; n=240; Fig. 5a–c).
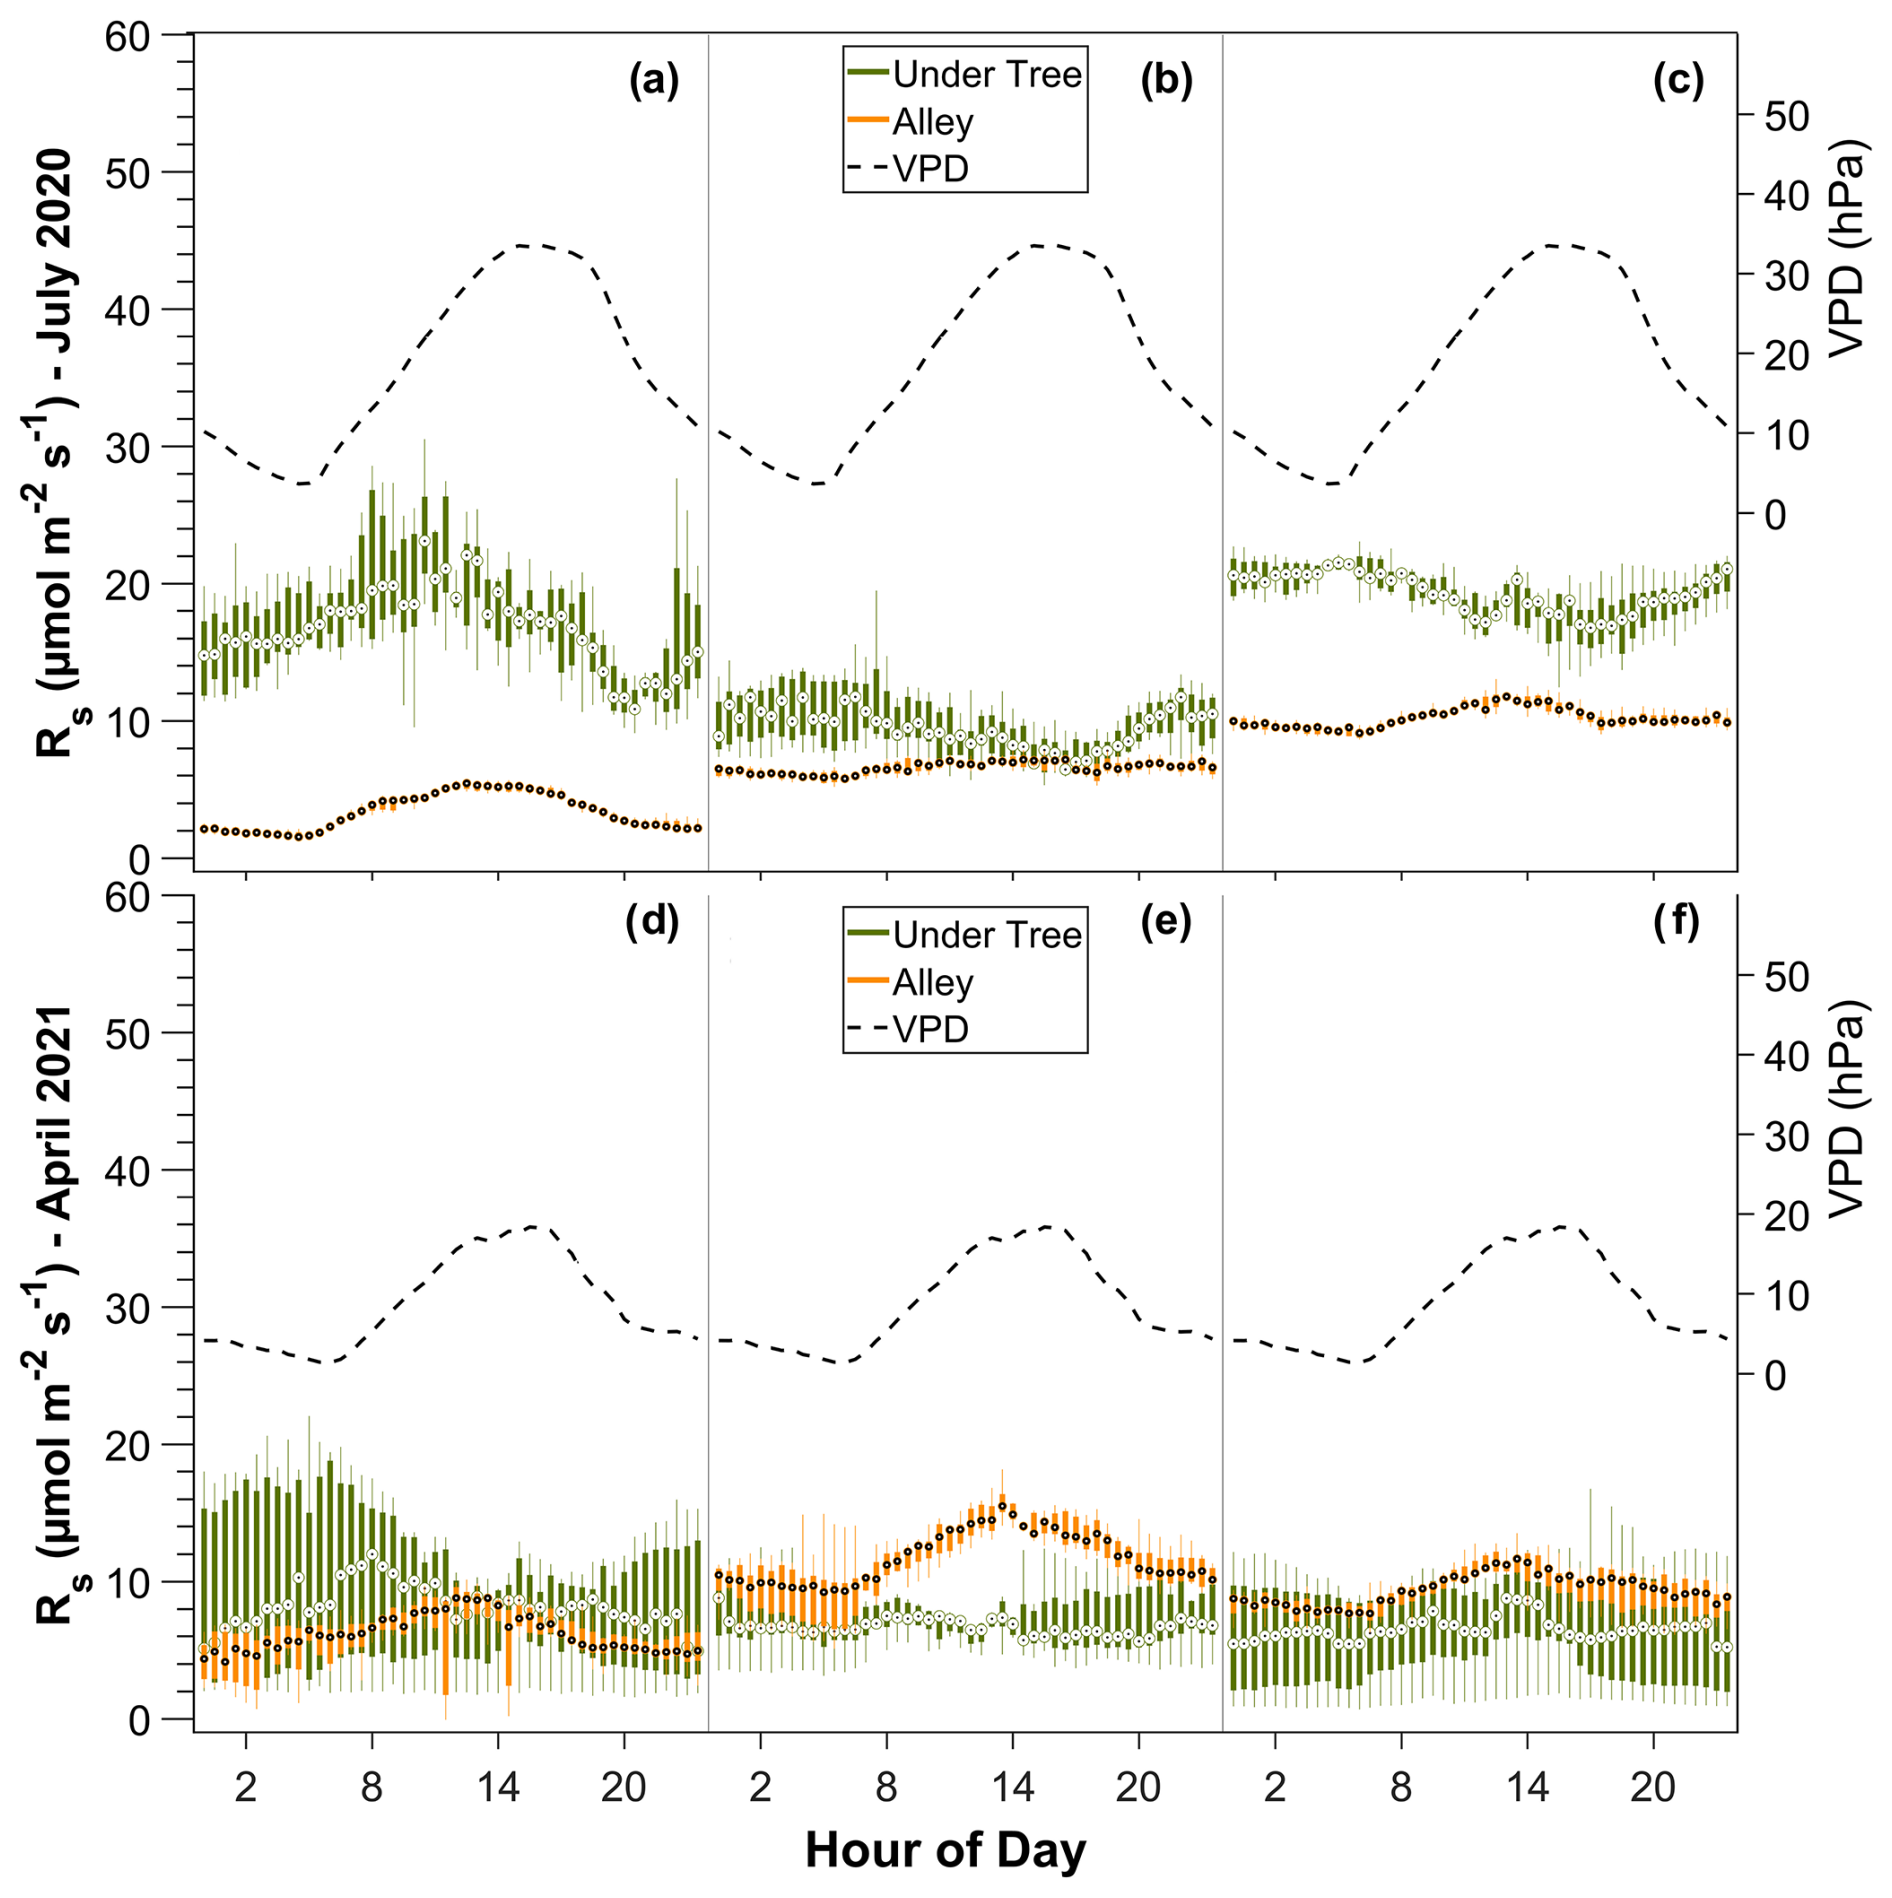
Figure 4Daily variability of Rs in the three pairs of alley and under-tree chambers over 1 week in July (a, b, c) and 1 week in April (d, e, f). Each panel represents a tree–alley pair for six chambers in total. The bars represent boxplots of 30 min data during the week.
Moreover, we found marked spatial variability in Rs, both under the canopy and in the alleys. In the alleys, sometimes up to 3 times more respiration is observed in one chamber compared to another (Fig. 4: compare panels a and c), but these differences between the chambers, in turn, vary over time in such a way that a given chamber can sometimes measure the greatest number of CO2 emissions and sometimes the lowest number of CO2 emissions (switch in magnitude of chambers 2 and 3 between July and April; Fig. 4: compare panels b/c and e/f).
3.3 Q10 variability
Seasonal variability was found in weekly Q10 values, especially under the tree (Fig. 5). In the alley, Q10 ranged between 1.2 (warm months) and 2.0 (cold months), whereas, under the tree, Q10 ranged between 0.6 (warm months) and 1.8 (cold months). In general, Q10 Under-Tree was lower and more variable than in the alley. The values for the entire study period were and (Mann–Whitney test; p<0.01). Hysteresis behavior was identified for Rs Alley in the summer data when plotted with both Ts and SWC. A linear relationship was found between Q10 and the SWC and soil temperature under the tree (; R2=0.36) such that, as the temperature increased and the SWC decreased, Q10<1 values were obtained. This relationship was not observed in the alley.
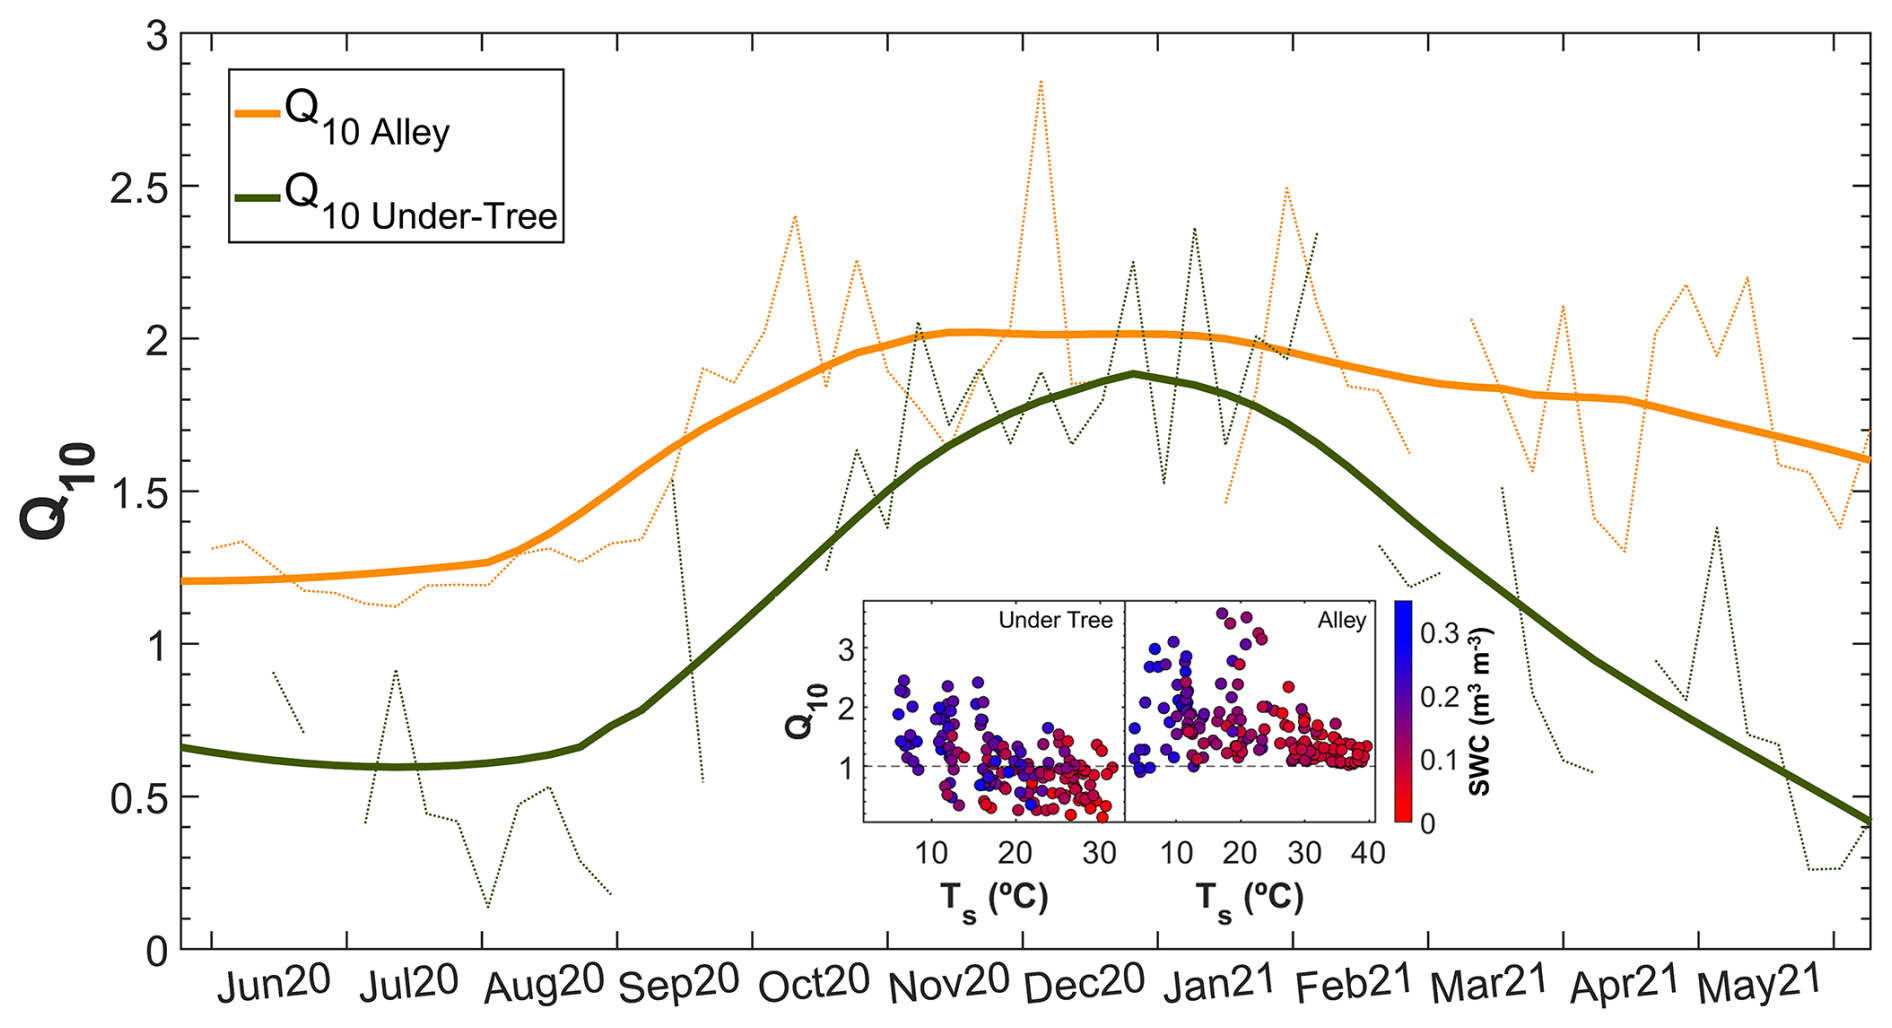
Figure 5Seasonal variability in the Q10 parameter in the alley and under-tree chambers. The dashed lines are the weekly Q10 values, and the solid lines are the moving average daily values (±14 d adjacent window). The inner figure shows the relationship of the weekly Q10 with the weekly average soil temperature and SWC for the two locations.
3.4 Rain pulse events: Rs and Reco
Of the 75 precipitation events, 41 were accompanied by enhanced Rs. This was especially frequent when rain fell on dry soil, and the increased Rs rates followed the longest IEPs, as shown in Fig. 6a. The PPT size does not have much influence on ΔRs (data not shown). However, the four highest Rs values were found in the lowest IEP and PPT in the alleys but were excluded from the regression as they were statistically classified as anomalies. In this way, notable rain pulses were detected when the IEP was large and SWC < 15 % (Fig. 7a), whereas rainfall pulses were scarce in months when the soil contained a moderate amount of water (> 15 %). The relationship between Rs and PPT was lost, with SWC values higher than 15 % in alleys and 20 % under trees (Fig. 7b, c). The increase in Rs with the appearance of a PPT event followed a nearly linear relationship in the alleys when SWC < 15 % (pvalue < 0.01; r=0.902), whereas, under the trees, the increase occurred when SWC < 20 % and was less pronounced (pvalue = 0.06; r=0.456). The Reco values obtained via modeling appear not to respond to rainfall pulses (Fig. 7d), whether the soil was previously dry (pvalue=0.78; ) or not (pvalue = 0.59; r=0.119). The rain pulse events implied annual accumulated fluxes of 310 g C m−2 in the alleys and 110 g C m−2 under the trees.
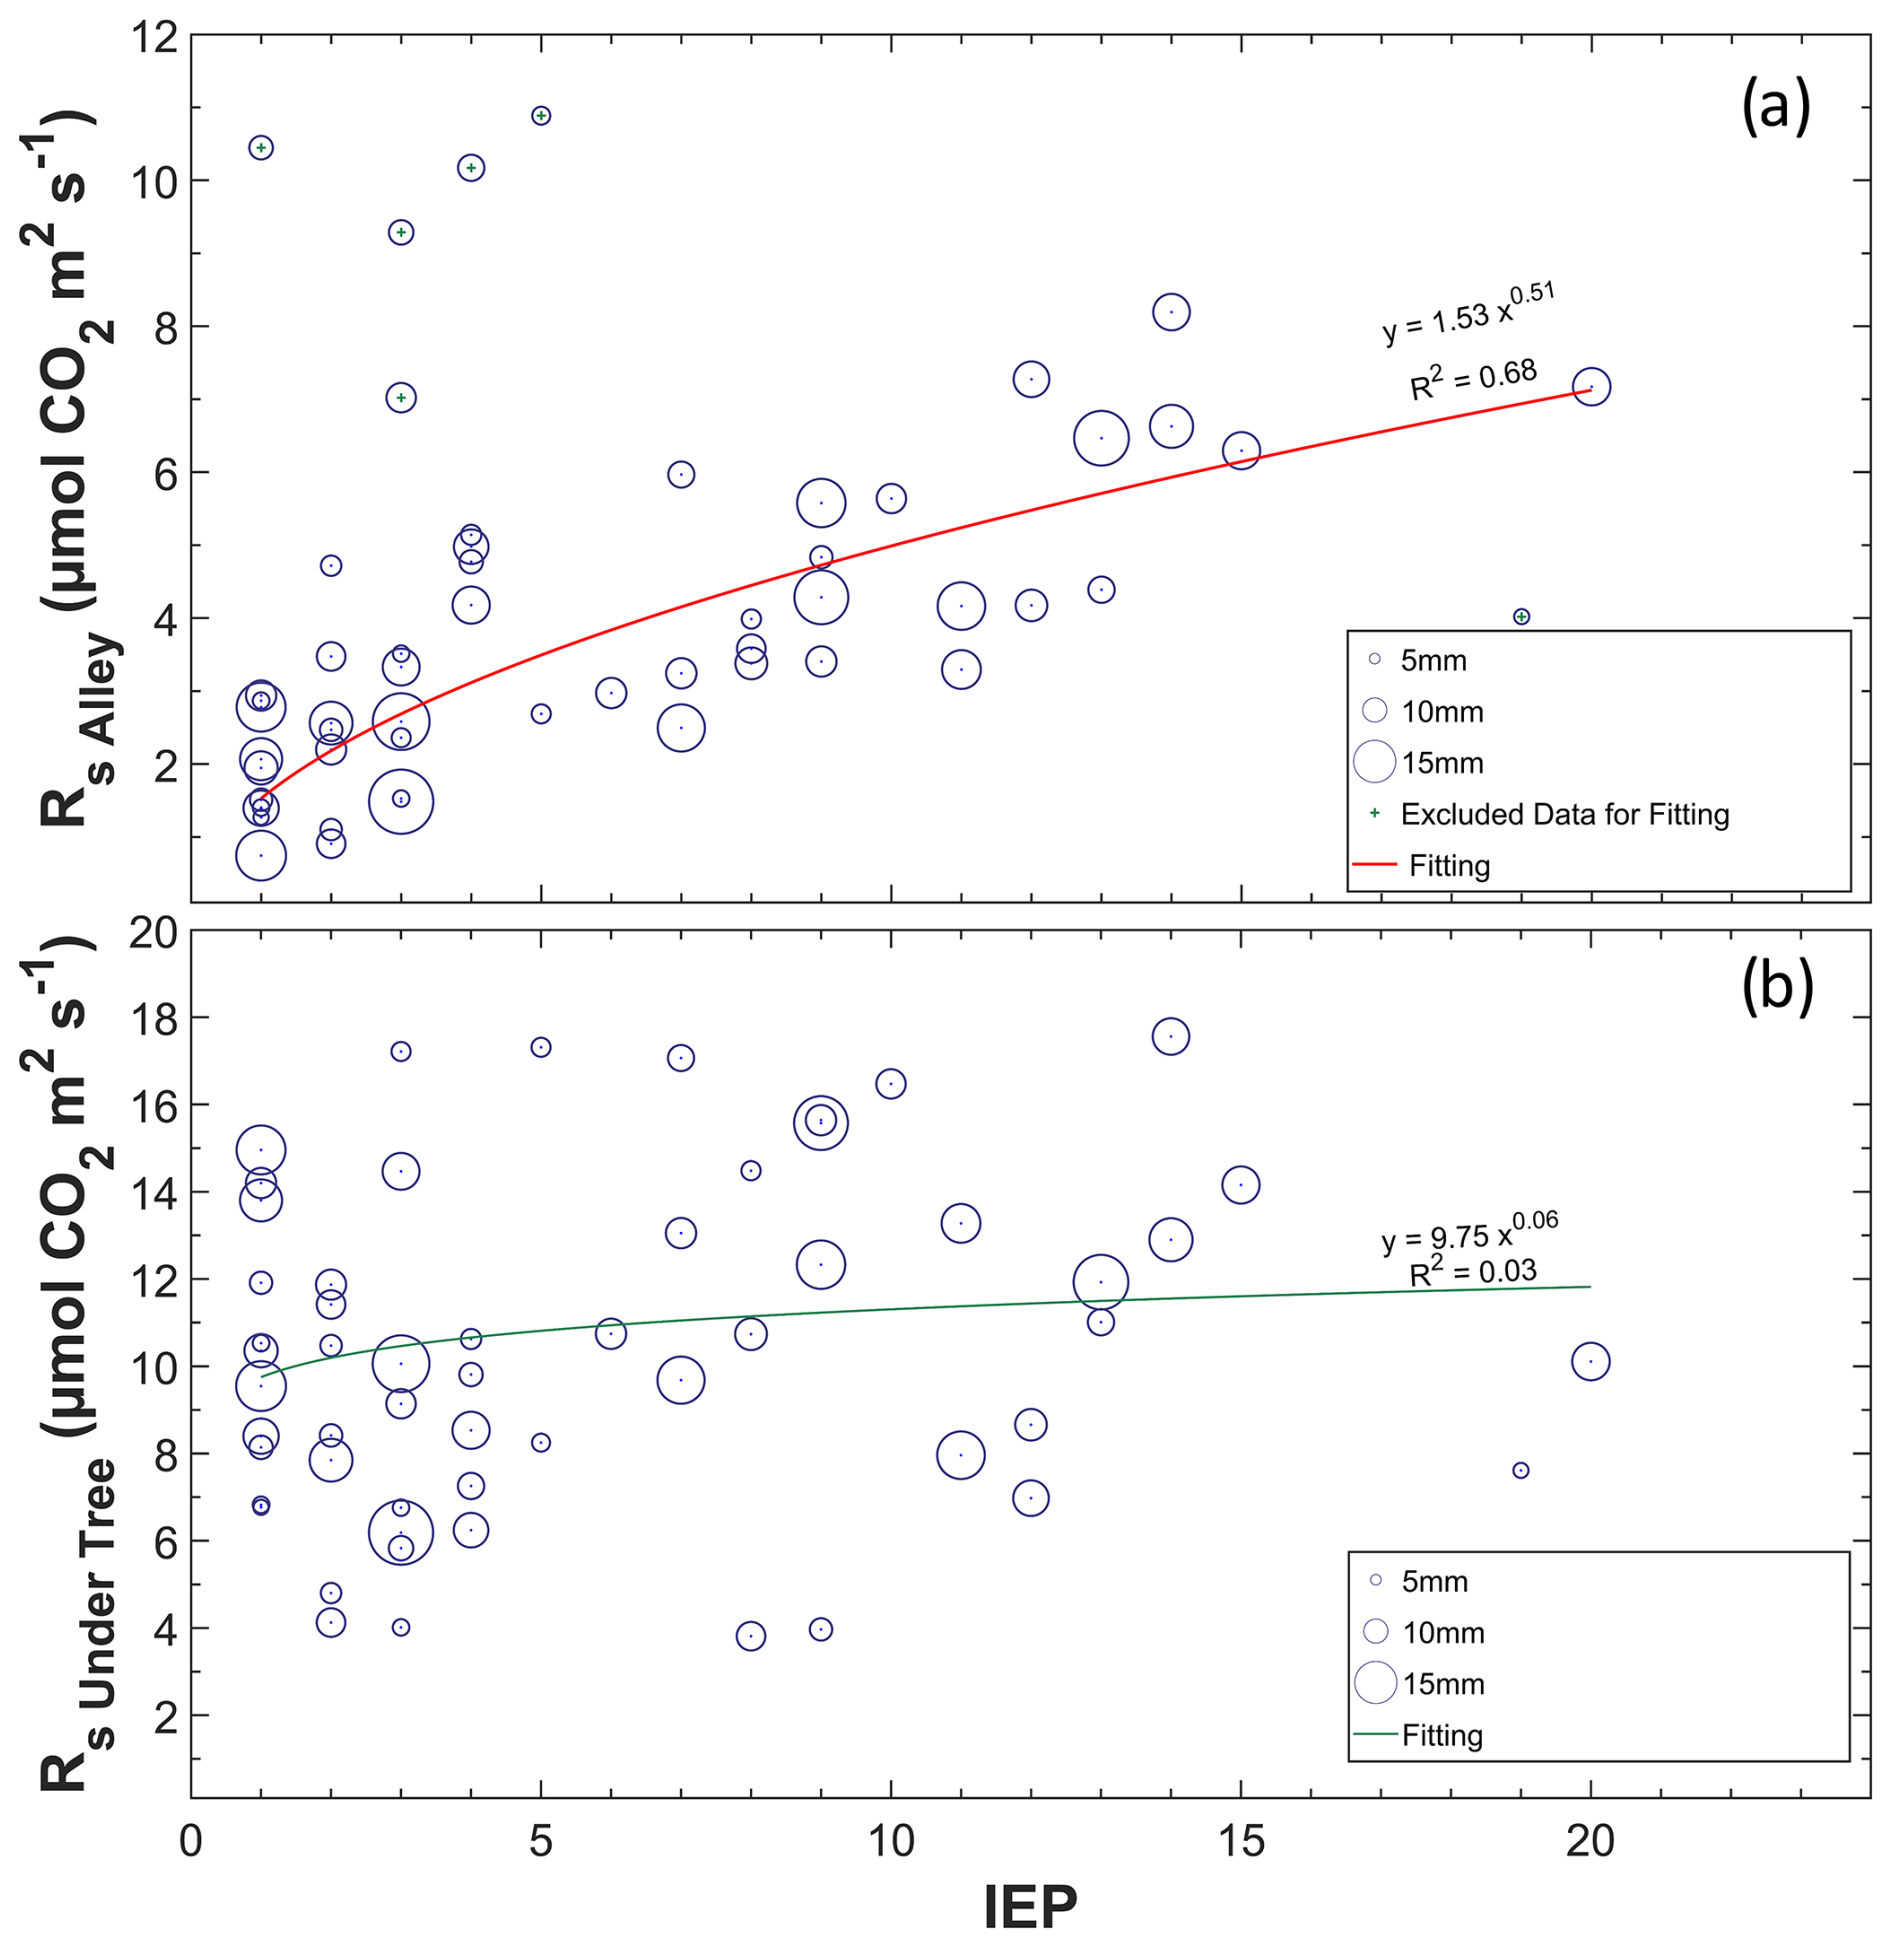
Figure 6Relationship between the inter-event period (IEP) and daily Rs in alleys (a) and under trees (b). The different sizes refer to the relative magnitude of the precipitation event, with the minimum being 0.4 mm and the maximum being 21 mm (daily values).
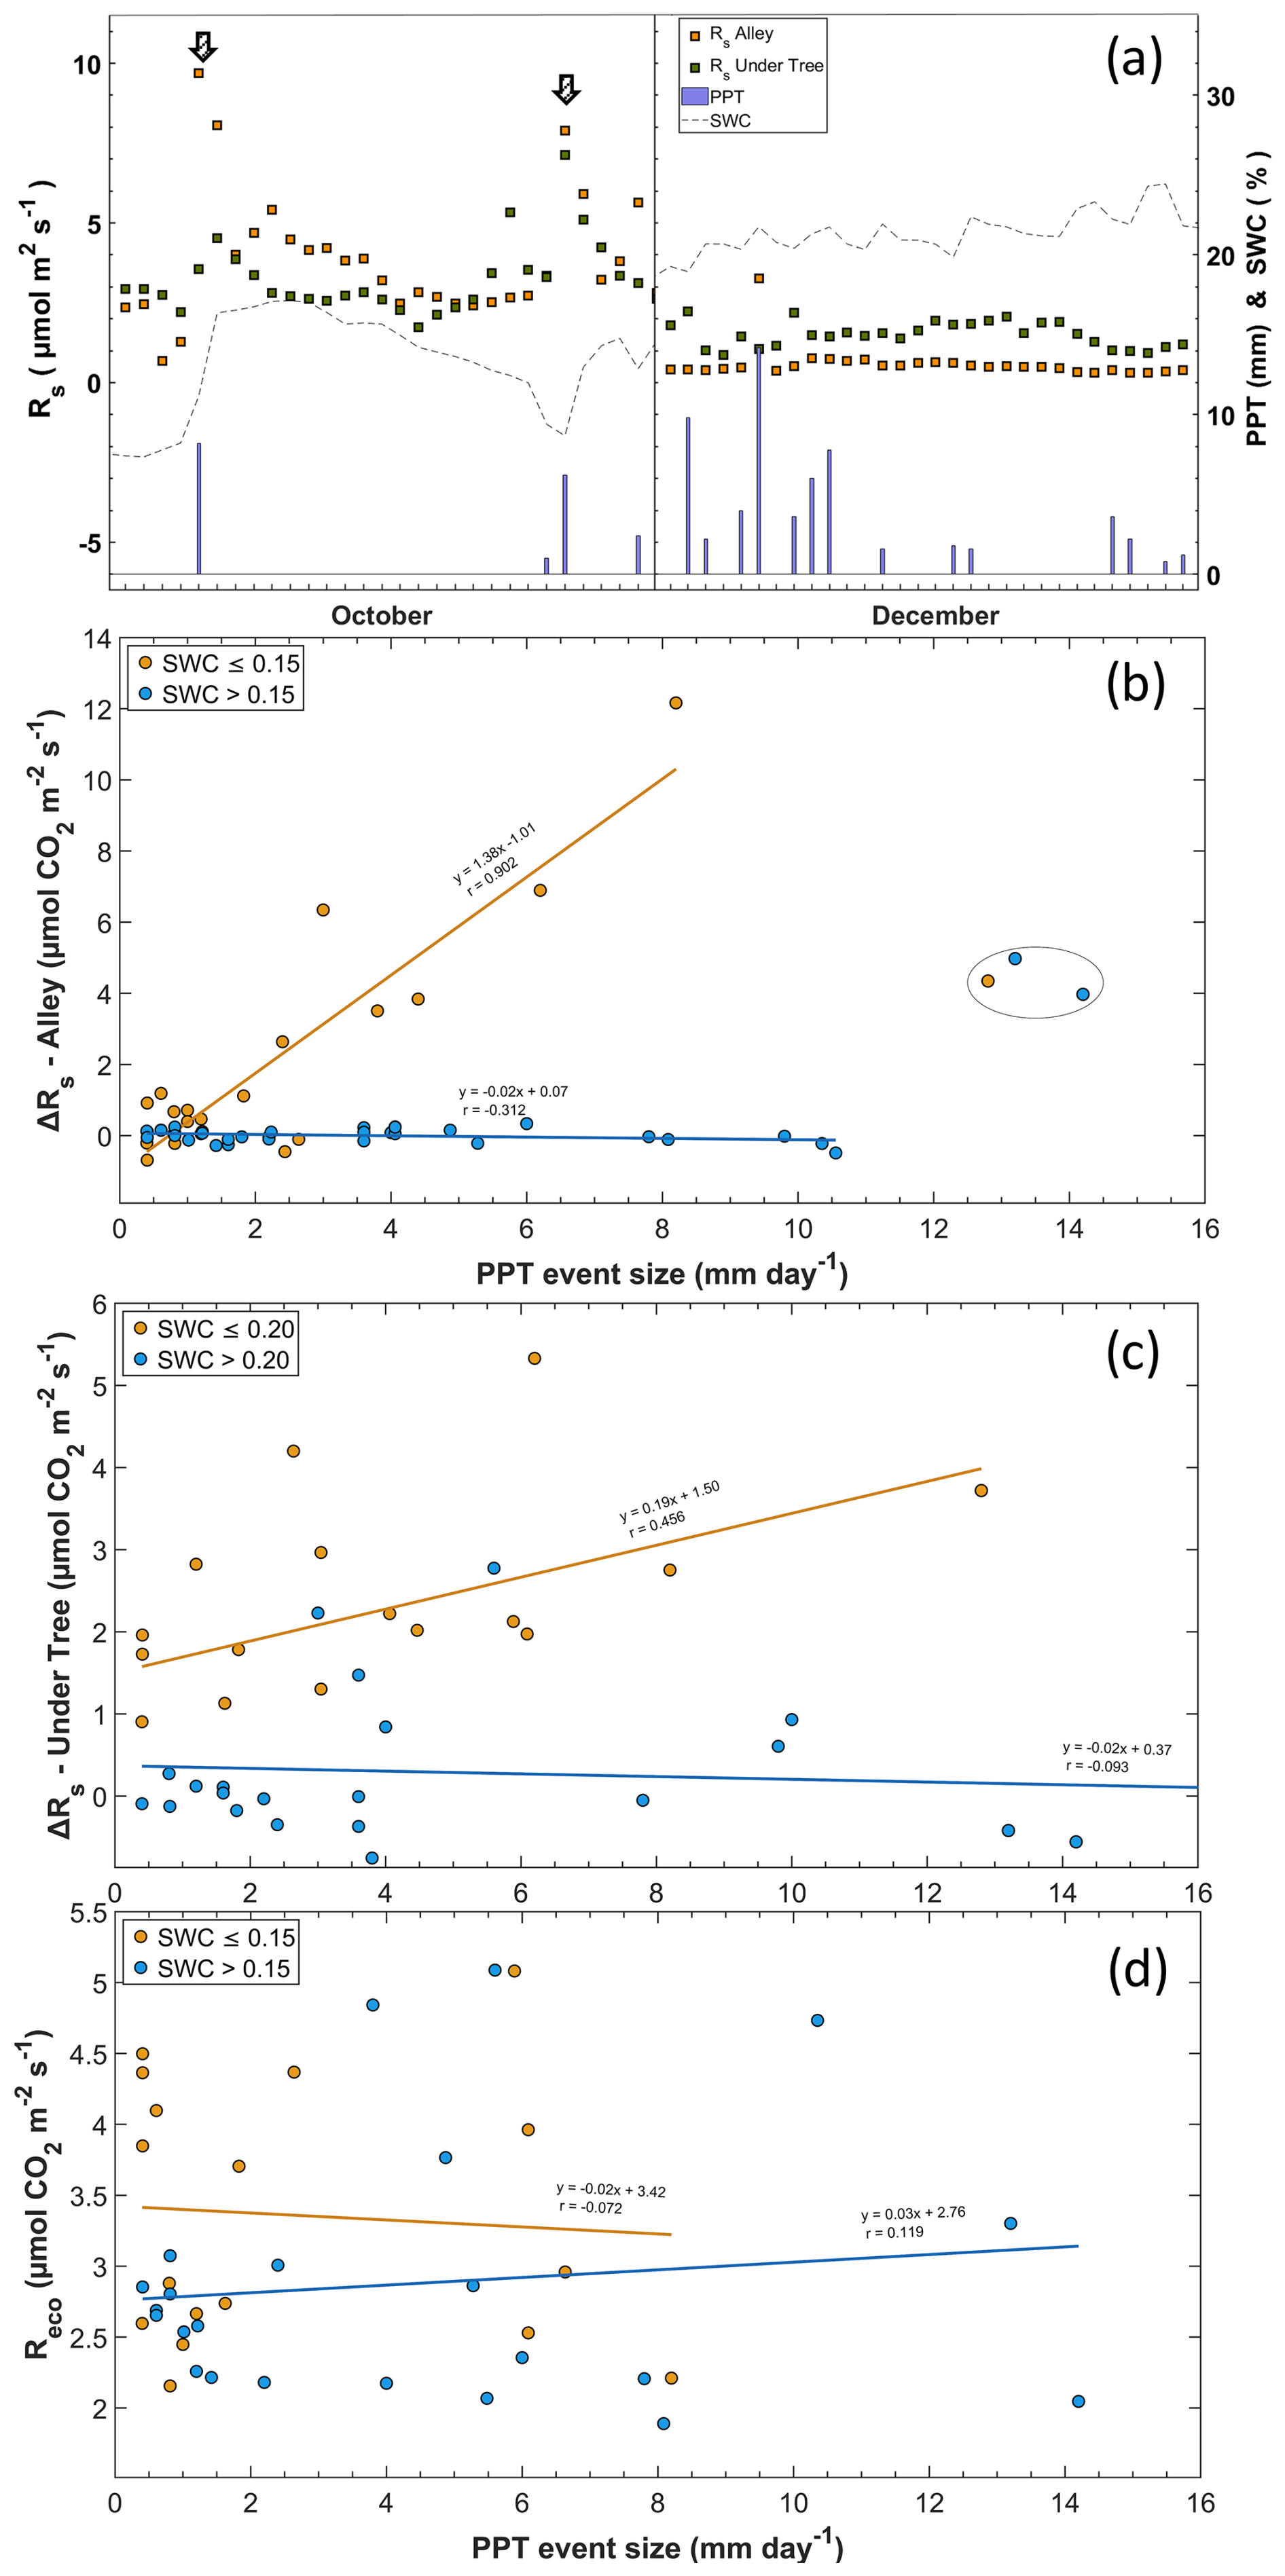
Figure 7Relationship between rainfall and Rs. (a) Rain pulses in a period with low SWC at the onset of the rain event (a; left) and a period with moderate SWC (a; right). (b) The arrows indicate the moment of the pulse and the relationship between the size of the PPT event (mm d−1) and the variation in the soil respiration rate (ΔRs; µmol CO2 m−2 s−1) in the alley and (c) under the tree. Measurements inside the circle are outside the fit. (d) Relationship between the size of the PPT event (mm d−1) and ecosystem respiration (Reco; µmol CO2 m−2 s−1). The lines represent linear regressions, and r is the correlation coefficient.
3.5 Spatial gradients
Manual measurement campaigns revealed exponential transitions in both Rs and Ts in longitudinal gradients from the tree to the alley (Fig. 8a and b). From 3.2 m away (fourth collar from the tree), significant differences in Rs and Ts (Mann–Whitney test; p<0.05) were found relative to the chamber closest to the tree. However, from 3.2 m outwards, Ts stabilized, while Rs continued to decrease slightly. Because the average distance under the canopy from the epicenter of the trees was 2.8 ± 0.3 m, we can differentiate these two independent areas in terms of different Rs behaviors. Thus, to project the value of Rs onto the ecosystem scale, two areas were considered in which the value used for the weighted projection was the midpoint of the interpolation between the sampled points on the linear gradient (arrows in Fig. 8a). Regarding angular gradients, Rs was higher on the southern side than on the northern side (n=27; p<0.05) during the sampling campaigns (Fig. 8c), and the temperature was higher on the eastern side (Fig. 8d) than on the northern side (n=27; p<0.05). The high variability in SWC was driven by punctual irrigation and prevented detection of significant differences in SWC. Because the chamber was installed in the south, it was weighted according to these differences to scale up Rs (Table 1).
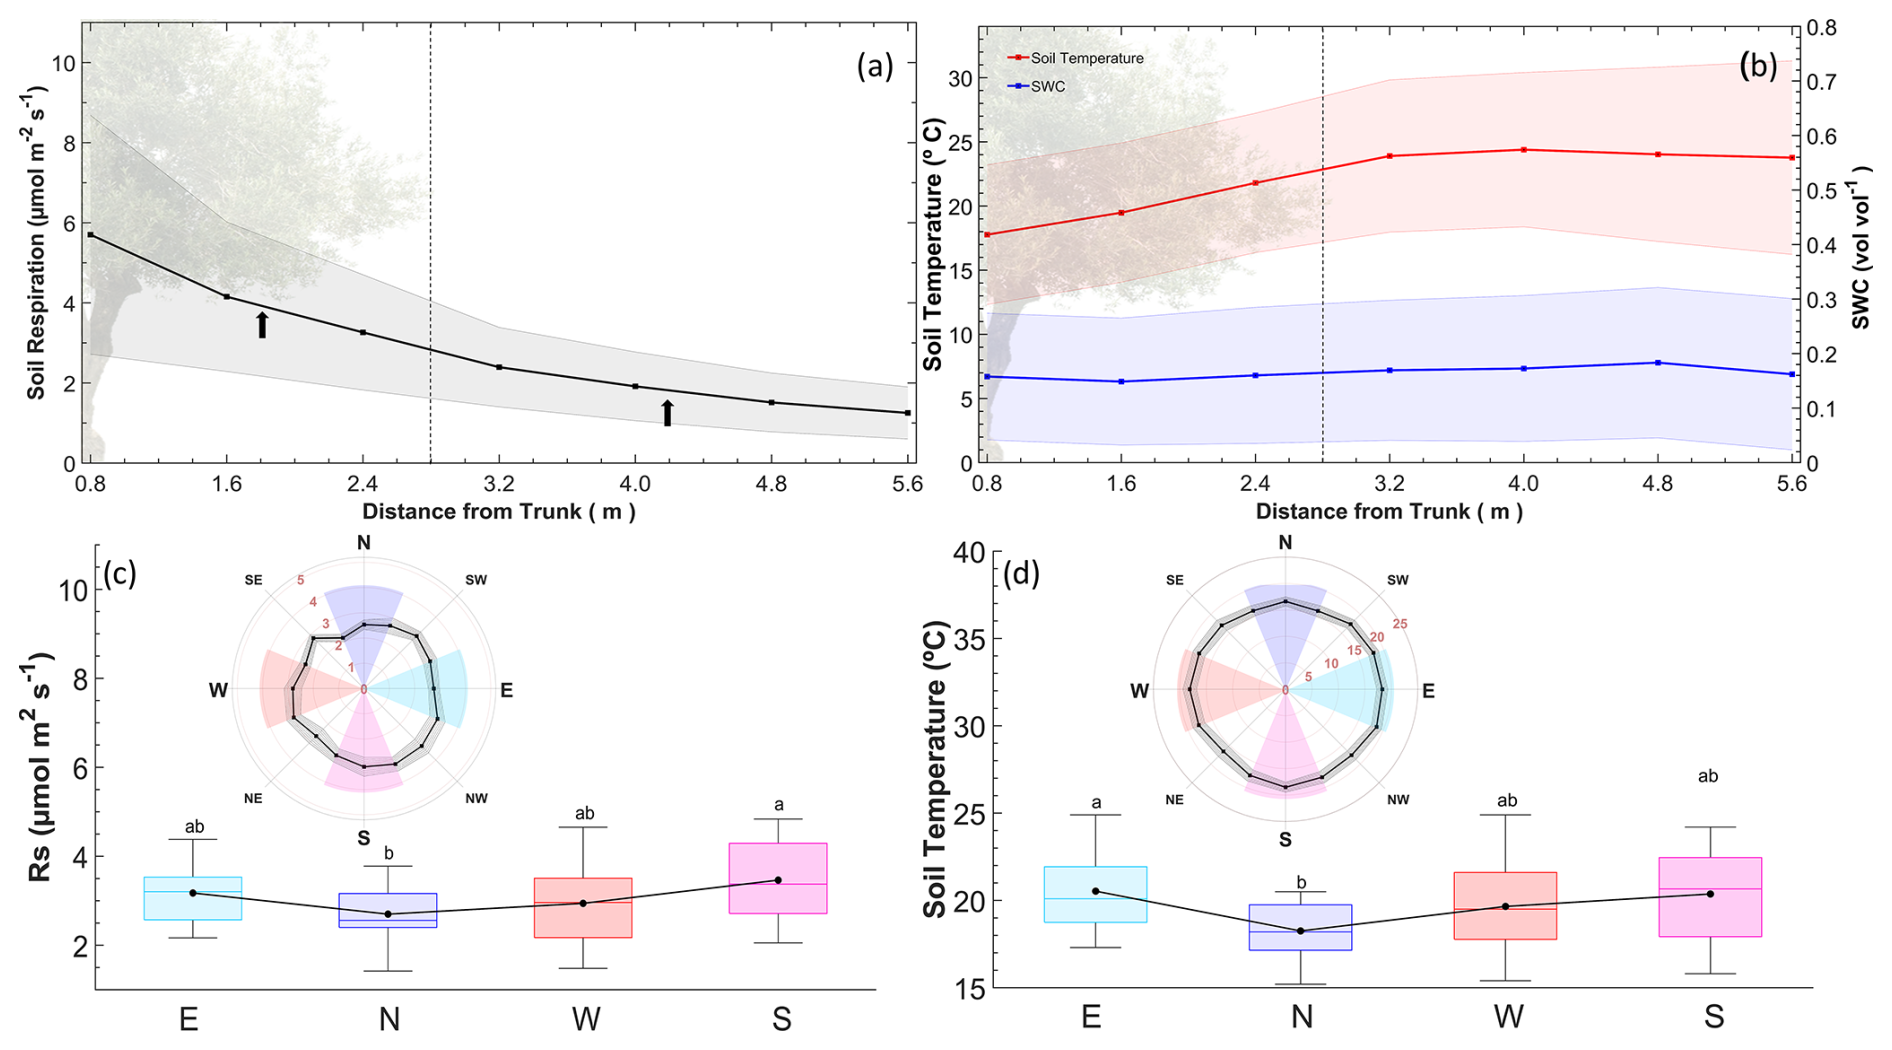
Figure 8Longitudinal and angular gradients of Rs, Ts, and SWC. (a) Rs measurements in a longitudinal gradient from the tree to alley collars. Each point represents the average (± standard deviation) of the manual measurement collar, and the line is a longitudinal interpolation. The dashed vertical line refers to the separation between the under-tree and alley regions of the transect (black arrows). The midpoint of the gradient of each region is considered the weighting factor for Rs. (b) Ts and SWC variations in a longitudinal gradient from the tree to alley collars (ncollar=8). (c–d) Angular gradient of Rs and Ts and differences between the orientations. Each point represents a manual measurement collar, and the line represents a longitudinal interpolation. Areas in the angular graphic represent the cardinal grouping of the three measurements, and the boxplot refers to the nine campaigns (n=27).
3.6 Upscaled Rs,eco vs. modeled Reco
The response of NEE, soil respiration upscaled to the ecosystem level (Rs, eco), and Reco to various rainfall pulses is represented in Fig. 9, and we can observe that they respond in different ways. The occurrence of a PPT event in September implied increases of 5 µmol CO2 m−2 s−1 in Rs,eco and 3 µmol CO2 m−2 s−1 in NEE, whereas Reco did not respond (Fig. 9). Similar patterns occurred in the other rainfall events in November and June. These increases in Rs,eco that were not reflected in Reco may indicate an underestimation of respiration balances as well as errors in GPPeco. Regardless of rainfall, Reco was underestimated for Rs,eco in the warm months, whereas in the cold months the magnitudes of both approaches were similar (Fig. 10b, c). On average, Rs Under-Tree represented 39 % of the Rs,eco, although the fraction was variable, with a maximal contribution of 55 % (winter) and a minimal contribution of 25 % (Fig. 10a). The soil surface classified as “under trees” represents 27 % of the olive grove, which indicates that in winter half of the soil respiration of the olive grove originates in a soil that covers a quarter of the total surface of the land.
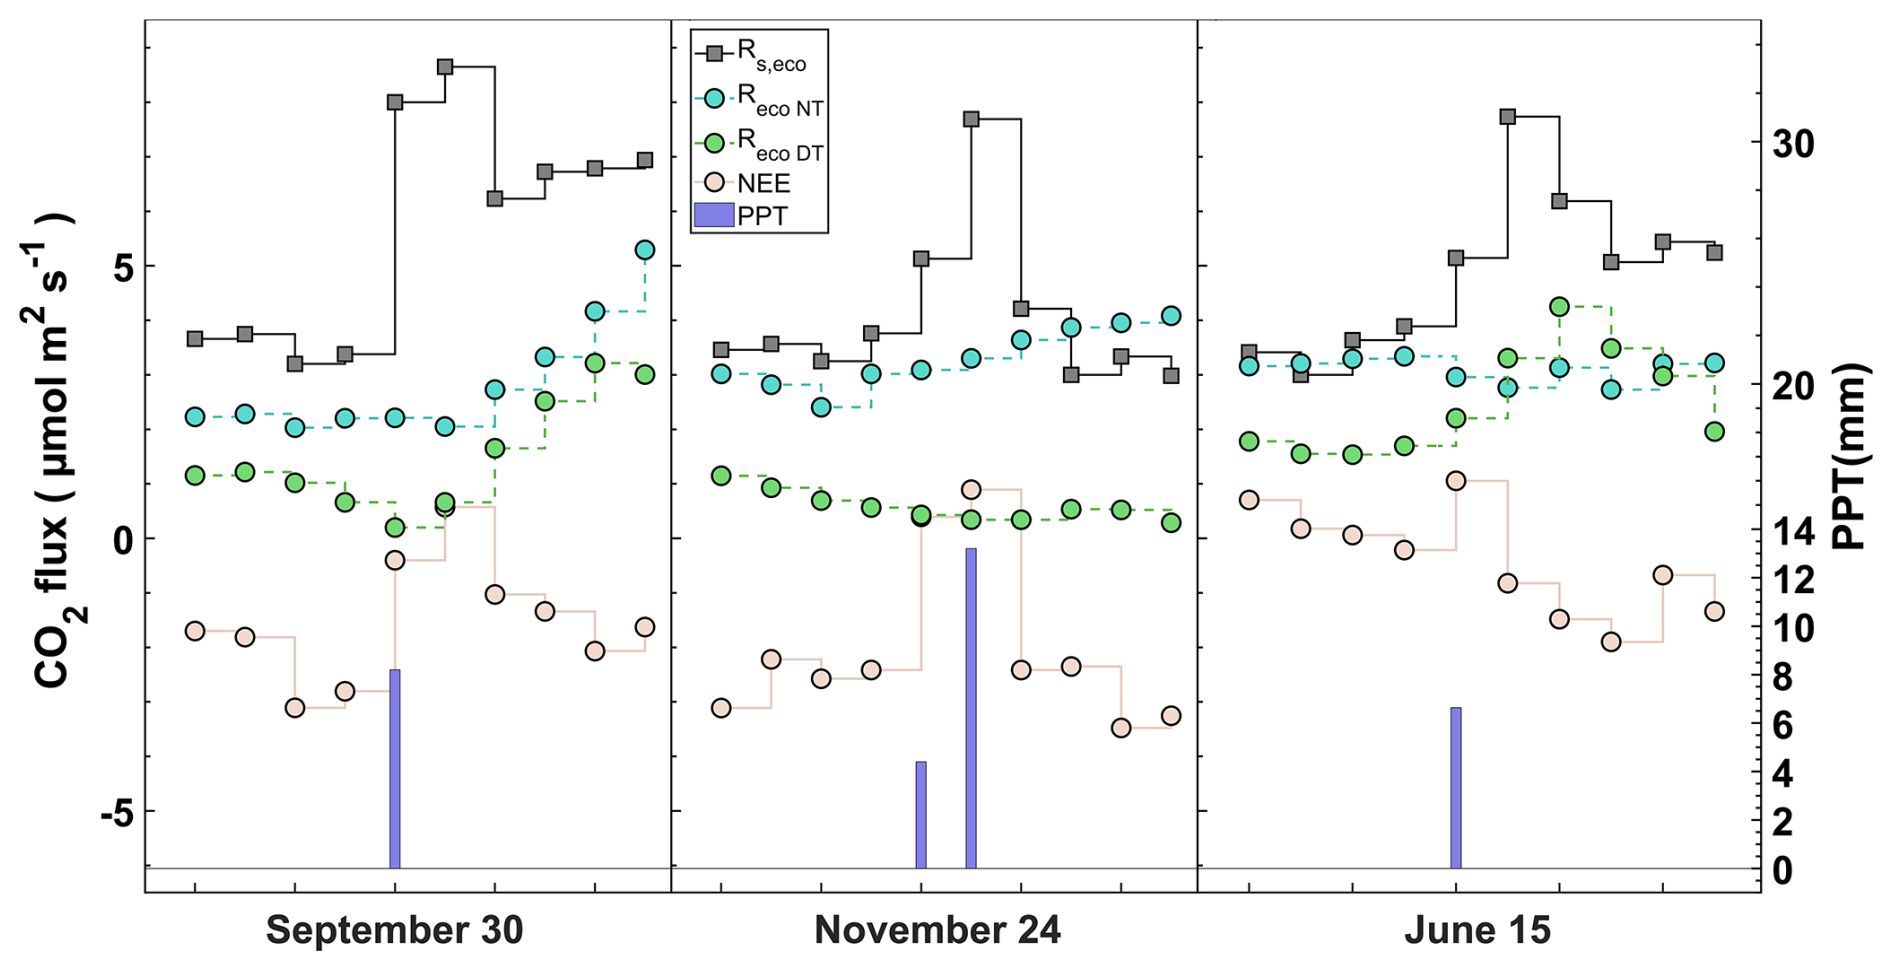
Figure 9Response of CO2 fluxes (daily average) to a precipitation event at three different times in the time series. Net ecosystem exchange (NEE), soil respiration upscaled to the ecosystem level (Rs, eco), nighttime modeled ecosystem respiration (Reco-NT), and daytime modeled ecosystem respiration (Reco-DT).
We show two approaches with the annually integrated Reco as the combination of measurement and empirical modeling based on EC data ( g C m−2; g C m−2) and upscaling through chamber data (Rs,eco = 2100±50 g C m−2). During the warm months, the magnitudes of the chamber and nighttime EC approaches are quite different, although they are consistent in the temporal variation. However, although the magnitudes are closer during the cold months, there is an inverse relationship between the two approaches. The daytime approach neither covaries with nor has similar magnitudes to respiration data from chambers during the hot months. On the contrary, the Reco-DT response is more similar to chamber respiration, indicating a greater influence of Rs Under-Tree on the ecosystem (Fig. 10a, c).
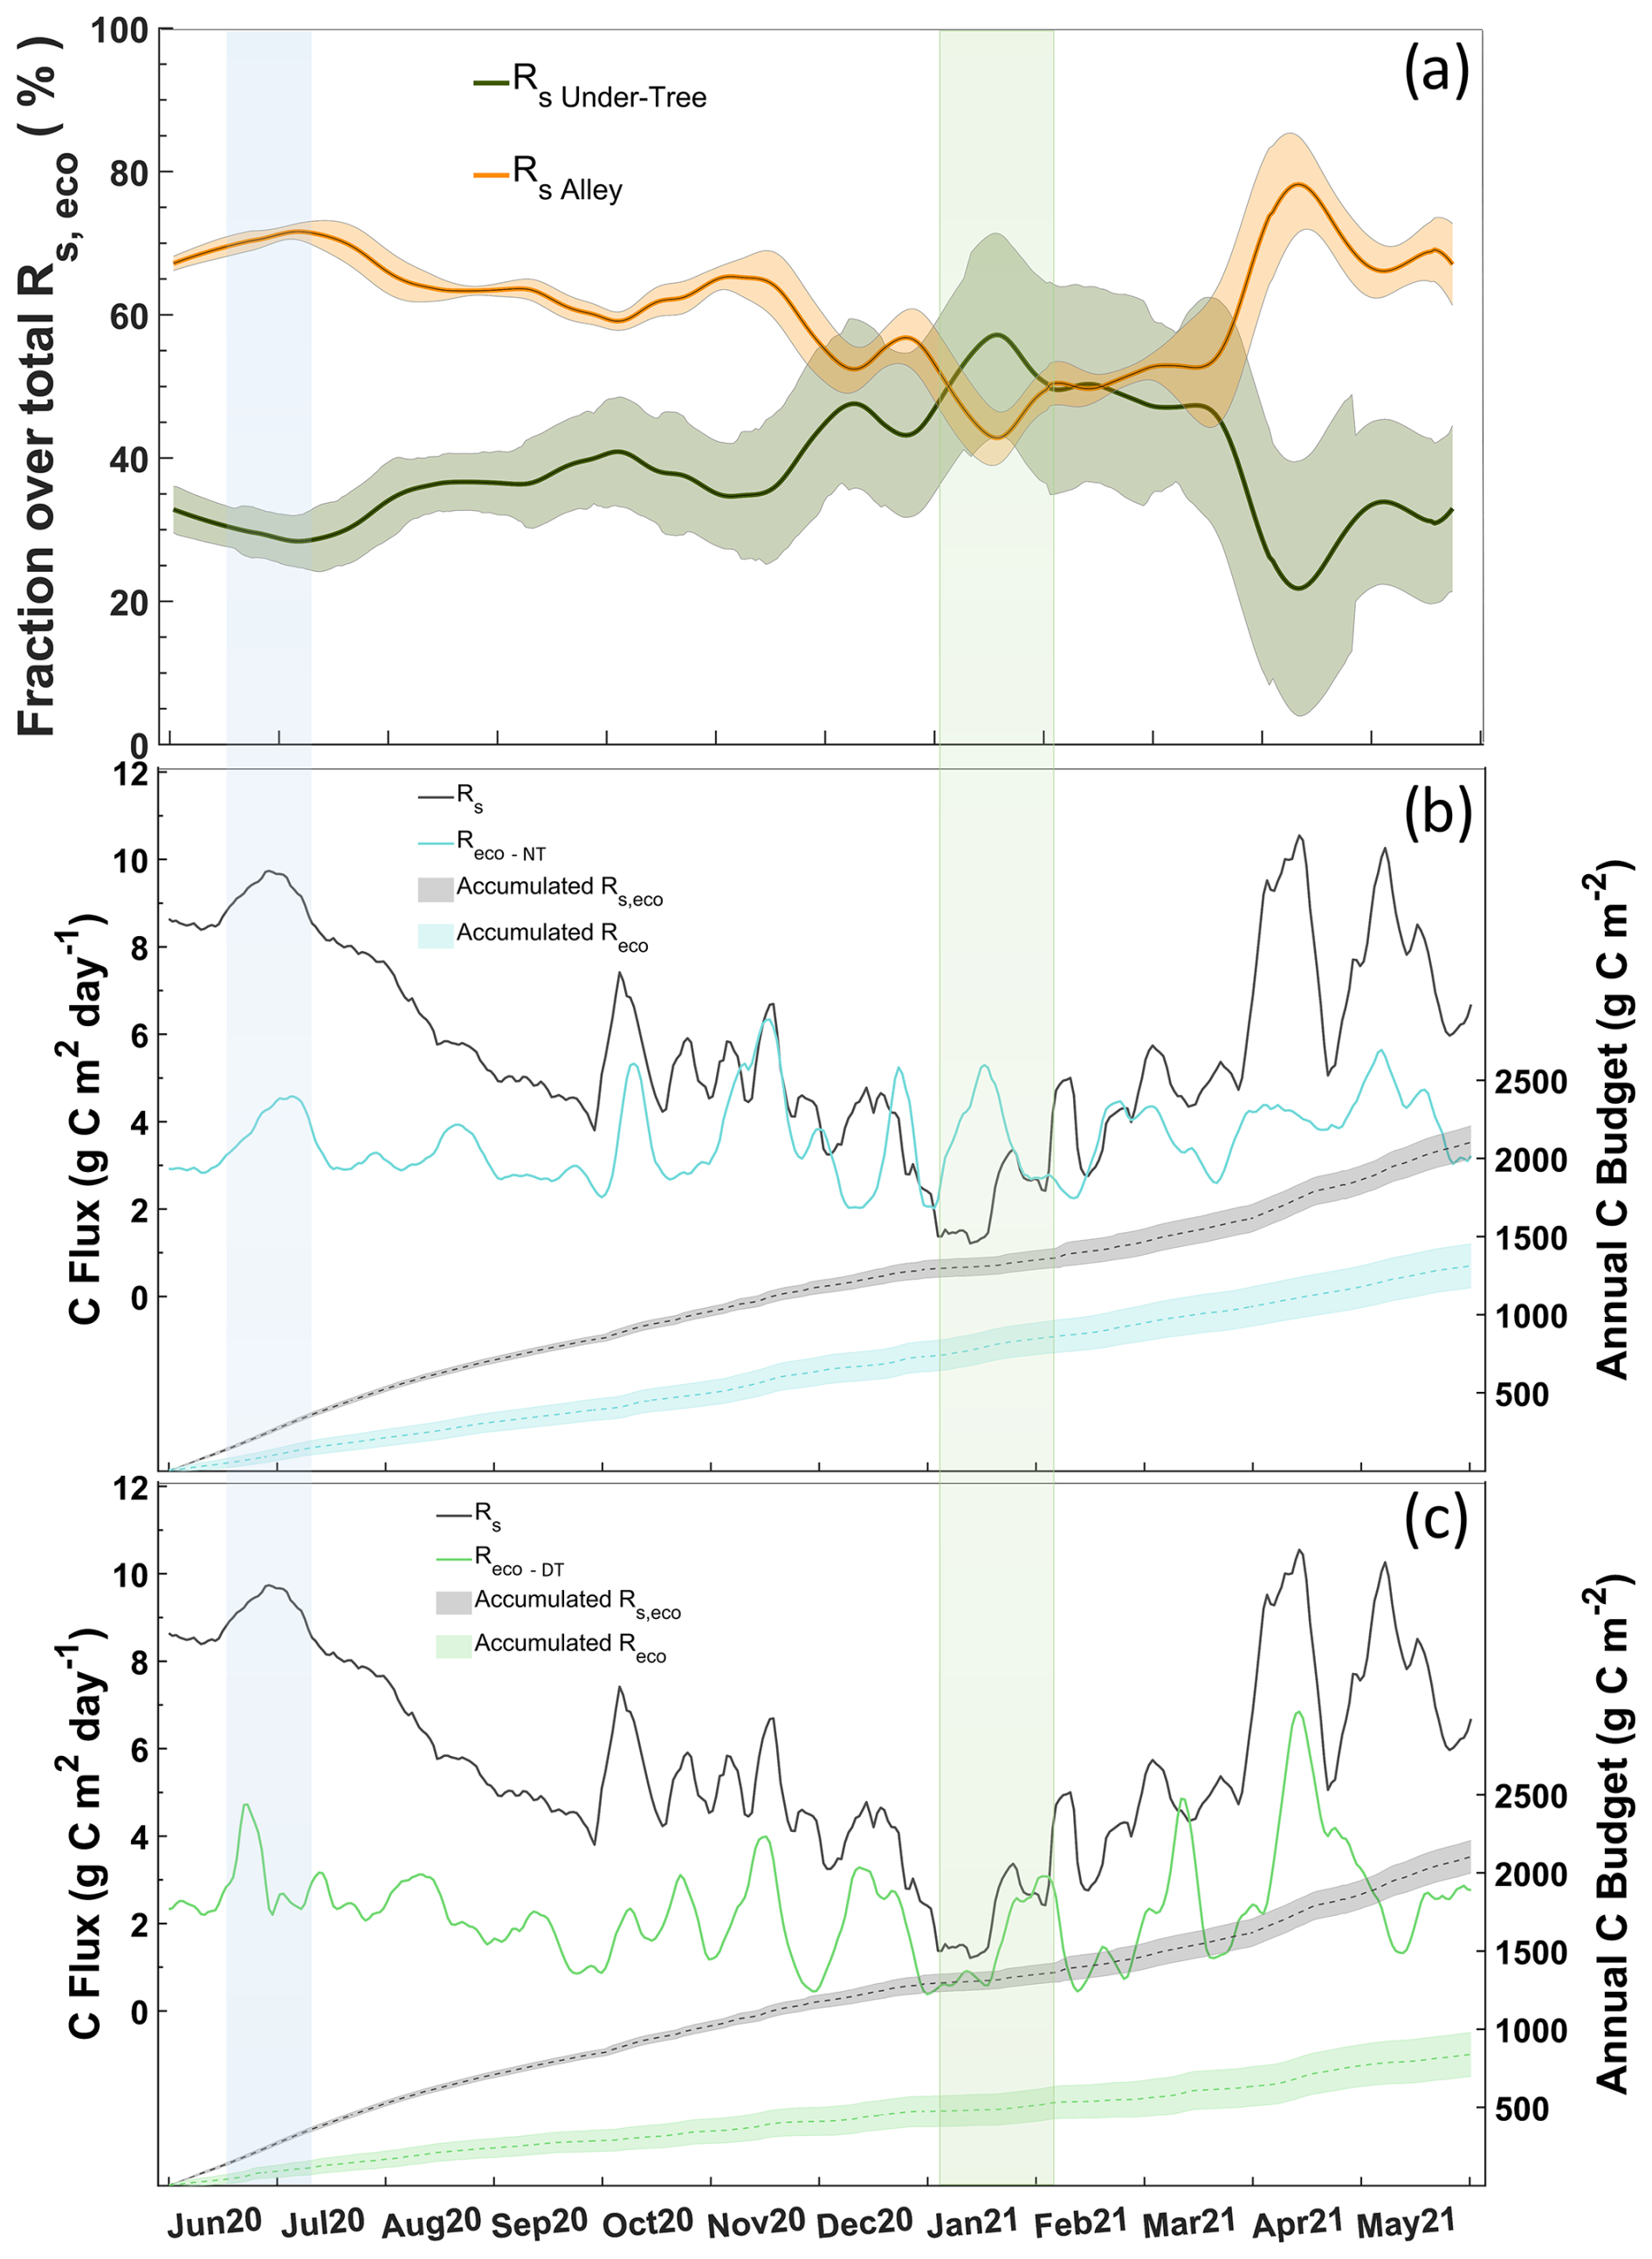
Figure 10(a) Fraction of daily Rs Alley and Rs Under-Tree overestimated Rs,eco. (b) Daily values of Rs,eco and Reco-NT during the year (left) and the cumulative value of both (right). (c) Daily values of Rs,eco and Reco-DT during the year (left) and the cumulative value of both (right). The blue rectangle marks the warm period and great Rs Alley influence. The green rectangle is the cold period and great Rs Under-Tree influence.
This study relies on a dataset spanning 1 continuous and complete year of respiration fluxes at the soil and ecosystem scales and provides significant insights into the temporal and spatial variations of olive grove respiration as well as their influencing factors. The abundance and continuity of half-hourly measurements under trees and in alleys allow us to describe processes and trends that have not been described in olive groves by typical studies based on manual campaigns.
4.1 Spatial differences
Our findings affirmed a clear seasonal variability of Rs and its main drivers (SWC and Ts), which is reflected in a wide range of values compared with other studies using chambers. Bertolla et al. (2014) and Testi et al. (2008) measured daily values between 1.3 and 8.8 µmol m2 s−1 (n=16) and between 2.3 and 5.9 µmol m2 s−1 (n=5; monthly) near the trunks of irrigated olive trees, whereas our study showed a wider range of 3.2–23.9 µmol m2 s−1 (n=365; daily). Such differences could be explained by the difference in the tree ages (85 years for our individuals versus primarily juvenile individuals of between 2 and 7 years), which means larger root systems. Juveniles will have less root development, and their autotrophic and heterotrophic respiration is expected to be lower than that of an adult individual. In our study, we can deduce a predominant influence of respiration associated with the roots on the total soil activity, since Rs was increasing as the measurements approached the trunks and Rs Under-Tree exceeded on average 3 times that observed in the alleys. This excess changed during the year, being between 2 and 15 times higher during the warmest and coldest months, respectively (Fig. S3a). Since the soil water content was similar in the cold period (Fig. S3c), the big differences could be due to (i) heterotrophic respiration decreases in the alleys due to the additive effect of a higher Q10 (Fig. 5) and a greater decrease in the temperature under the canopy (Fig. S3b) as well as (ii) a higher heterotrophic Rs Under-Tree value due to a higher temperature compared to the alleys and differences in the substrate due to the addition of root exudates and superficial leaf litter (Davidson and Janssens, 2006), meaning higher soil organic carbon under the tree canopy. The contribution of heterotrophic respiration to the total respiration is complex to estimate (Comeau et al., 2018), and these data are not available. Nevertheless, considering that the magnitude of Rs Alley during the winter was very small, we assumed that the contribution of heterotrophic respiration under the tree is also small; therefore, the Rs Under-Tree value was largely controlled by rhizosphere respiration (Rz), which is the sum of heterotrophic respiration linked to the root system and autotrophic respiration for maintenance and growth of the roots.
Continuous measurements allowed us to study the contribution of each location to the total Rs. Despite the total canopy fraction under trees being only 27 % in our agroecosystem, there are periods where the proportion of Rs Under-Tree contributes more than 50 % to Rs,eco (Fig. 10a). Therefore, it cannot be assumed that the Rs Alleys values are representative of olive groves and, most likely, of mosaic tree crops such as savannas or dehesas. In fact, in other systems with open area–canopy distributions (Tang et al., 2005), Rs Under-Tree was 1 order of magnitude greater than Rs Alley; however, because the spatial gradients of Rs were not quantified, the estimate at the ecosystem scale is unknown. In this study, we quantified the gradient between the measurements taken under the trees and in the alleys and found an exponential decrease as we moved away from the trunk that allowed us to perform a simple upscaling. Although the influence of the roots extends gradually throughout the crop, its effect on respiration appears to be reduced significantly around a 3 m separation. Therefore, for this experimental site, the canopy radius (2.8 m on average) can be a good proxy for determining the significant separation between the under-tree rooting zone and alley. Other studies have established a random collar-sampling map (for instance, see Turrini et al., 2017) with different separation distances around the olive tree, which makes it difficult to integrate the role of rhizosphere respiration if distance correction factors are not applied (Table 1). Moreover, we found more respiration on the southern side of the trees, where the temperature was also higher. Although the campaigns in which the gradient data were taken only covered 4 of the 12 months of the year and spatial differences may also vary over time, we have used the data obtained to weigh and scale the values of Rs at the ecosystem scale and thus estimate Rs,eco.
4.2 Eddy covariance model comparison
The use of automatic chambers made it possible to assess annual balances of Rs. In the estimation of the model Reco with data derived from EC, we obtain annual balances of 850 gC m−2 (daytime approach) and 1300 gC m−2 (nighttime approach), whereas, if we project Rs at the ecosystem scale (Rs,eco), we obtain 2100 g C m−2 (Fig. 10b). The values obtained here with chambers may be similar to those found in grassland meadows (1990 g C m−2; Bahn et al., 2008) and higher than other previous estimations in olive groves (860 ± 150 g C m−2), although they were measured in monthly or bimonthly campaigns (Jian et al., 2021). A priori, Rs,eco should be less than Reco because Rs,eco is a fraction of Reco (). However, the accumulated values obtained from the chamber (Rs,eco) are higher those obtained from EC (Reco), especially in summer. The difference between Rs,eco and Reco could be related to the temporal mismatch between the two approaches. The chamber method takes snapshots of Rs, whereas the NEE partitioning method uses a 7 d sliding window for its calculations. Furthermore, errors may be made in the NEE partitioning method, such as the underestimation of nocturnal fluxes due to low turbulence or the erroneous assumption that nocturnal respiration can be perfectly extrapolated to daytime respiration. On the other hand, during the day, we observe inverse relationships of with those that models based on NEE partitioning usually assume (Q10 values < 1 in Fig. 5) and that could lead to an erroneous estimate of Reco by the daytime method. Moreover, the greater the role of aboveground tree respiration in Reco, the worse the relationship between Rs,eco and Reco-NT (Fig. 10a, b), which indicates that the widely accepted partitioning model based on Reichstein et al. (2005) does not apply to this semi-arid ecosystem. It is unsurprising that Lasslop et al. (2010) had greater agreement when the influence of Rs Under-Tree was greater (Fig. 10), since Reco calculated it from the photosynthetic organisms' activity. Since each model is based on different mechanisms, we can say that no method faithfully represents the ecosystem, and furthermore there are more drivers than just temperature and SWC; these are also interrelated. Therefore, more research into the application of these models in other semi-arid systems is necessary. Despite this, when a multi-chamber system is not available, we recommend for this type of ecosystem the use of daytime models in cold seasons and the use of nighttime models in hot seasons, when most of the contribution to Rs comes from the heterotrophic respiration of the alleys.
4.3 Rs drivers
Q10 differs in the alley and tree base in terms of magnitude and seasonal evolution (Fig. 5). In the alley, Q10>1 was always found, but under the canopy we found periods with Q10 values close to 1. This means that the variation in Rs during this period is decoupled from changes in soil temperature. In addition, Q10<1 values during summer indicated that respiration decreased as temperature increased. That is, the respiration of the under-tree rooting zone of the tree canopy was associated with soil temperature. Therefore, the traditional parameter Q10, determined through field measurements of Rs and temperature (Davidson and Janssens, 2006), cannot be used to define the respiration of Mediterranean ecosystems because of their large spatial and temporal heterogeneity, in which there are plants that inhibit their respiration at high temperatures. The Q10 values obtained in this study were calculated using 7 d windows and soil temperature measurements at a depth of 5 cm. However, these results may vary depending on the length of the time window and the depth of the temperature sensors, as the temperature propagation through the soil introduces a time lag that can influence the estimates (Barron-Gafford et al., 2011; Hamerlynck et al., 2013). It is currently known that variations in Q10 are controlled by soil and vegetation factors and not only by climate (Chen et al., 2020). Therefore, although the global value of Q10 is estimated to be 1.5 (Bond-Lamberty and Thomson, 2010), the variability of the reported Q10 is enormous, reaching values higher than 200 in ecosystems with very low temperatures (Mikan et al., 2002). Conversely, Q10 values less than 1 have been found in other regions with semi-arid climates that include a dry period such as continental monsoon (Han and Jin, 2018), suggesting that this is not found exclusively in olive groves but may be common in water-limited ecosystems with dry periods. In addition, the regressions used to obtain Q10 are usually not good when the water content in the soil is low (Wang et al., 2014) and the Rs−Tsoil relationship disappears or even becomes negative, as we can see in Fig. 5.
The areas with the greatest uncertainty in global Rs prediction models are semi-arid regions (Warner et al., 2019), where water acts as a limiting factor and Rs decreases, even with increasing temperature (Zhao et al., 2017). For example, in Mediterranean mountain grasslands, temperature is no longer a good predictor (Bahn et al., 2008). In our study, we observed a coincidence in the alley of the reduction in Rs with the prolonged decrease in soil moisture in the prolonged summer drought (July–September), indicating a connection between Rs and humidity (Fig. 3). Thus, even if the temperature increases in July, Rs in the two locations appears to decrease. However, Rs Under-Tree also decreased with the advance of summer, even though SWCUnder-Tree remained relatively constant due to irrigation. Also, Rs Under-Tree was practically constant throughout the day, except in summer, when there was a negative relationship with temperature. This decoupling could be explained by a reduction in root exudates due to reduced photosynthesis of olive trees that could be induced by an increase in the VPD. It is known that tree photosynthesis modulates soil respiration (Högberg et al., 2001) as metabolic activity is related to the closure of stomata at high temperatures (Tang et al., 2005; Makita et al., 2018). CO2 assimilation decreases with high VPD values when olive trees close their stomata (Fernández and Moreno, 1999), affecting the NEE (Chamizo et al., 2017). Here, we observed that GPP values also decrease with soil temperature in the summer months (data not shown). However, we also observed negative Ts and Rs ratios at night, so the mechanism could have a delay of hours and there may be additional mechanisms that we cannot elucidate. Stomatal closure has an impact on the rhizosphere because it inhibits the transport of photosynthetic products or carbohydrates from photosynthesis (which in turn depends on ecophysiological and meteorological factors) by the phloem, decreasing root activity and exudates and thus decreasing under-tree rooting zone respiration (Rz). Therefore, Rz may be dynamically linked to vegetative growth, climate, or competition, all linked to the CO2 assimilation capacity of olive trees (Aranda-Barranco et al., 2023). Tang et al. (2005) established that the translocation time of photosynthetic products from leaves to roots can be between 7 and 12 h. The lag for the isotopic signal of photosynthesis in trees to appear at Rs is in the range of days in other ecosystems (Ekblad and Högberg, 2001), which seems to indicate that stomatal closure would have an immediate effect (hours) on the reduction in CO2 transport to the rhizosphere, whereas it would have a later effect (days) on the reduction in root exudates. The reduction in Rs at high VPD values is observed both at night and during the day and at times with and without irrigation. Nevertheless, the association between photosynthesis and Rs Under-Tree can be confused with the relationship between Ts and Rs, and more study is needed in this regard to establish the connection between VPD and Rz.
Therefore, the response of Rs to temperature fluctuations is not only influenced by soil temperature, making it crucial to consider additional factors such as SWC, photosynthesis, or precipitation events when modeling Rs in Mediterranean environments (González-Ubierna and Lai, 2019). In our study, we see that the variations of SWC are higher in the alleys (Fig. S2a); therefore, the variability of the relationship between Rs and Ts will be higher if they are conditioned by humidity. In addition, the drivers are interrelated as temperature-dependent responses that are further influenced by soil moisture and precipitation (Hursh et al., 2017). Furthermore, we only identified hysteresis behavior in summer in alleys, which could indicate diurnal changes in SWC close to some critical value for the Rs–Tsoil relationship. However, also finding the hysteresis pattern with SWC indicates that there is another factor involved in Rs, in addition to temperature.
4.4 Rain pulse events
Although the main transport process is molecular diffusion, rain pulse events can also produce an immediate release of CO2 by displacing gas within the pores (Inglima et al., 2009). Marañón-Jiménez et al. (2011) suggest that a significant portion of the CO2 released within the first 2 h after water is added likely originates from the degassing of CO2-rich air trapped in the soil pores. CO2 adsorbed to the surface of soil particles (Ravikovitch et al., 2005) and stimulation of microbial activity can increase soil respiration (Jarvis et al., 2007). Rain pulses can be the most important driver in terms of the seasonal trend of soil CO2 efflux in semi-arid ecosystems (Leon et al., 2014). We can see that water is a limiting factor for Rs, with a large rainfall pulse after the summer drought (first rectangle on the left; Fig. 3); however, in periods with a high SWC, this relationship is lost (Fig. 7). Other studies in olive grove alleys (Testi et al., 2008; Sierra et al., 2016; Chamizo et al., 2017) have shown Rs values between 0.5 and 1.6 µmol m2 s−1 (ncollar ∼ 10) based on field campaign measurements taken outside of rainy days. In contrast, using automatic measurements, we found a higher variability of 0.4–11.3 µmol m2 s−1 (n=365) but with a median of 1.5 µmol m2 s−1 (Fig. 2a), which is within the range of the other studies. This reflects the fact that continuous measurements can detect rain pulse events that tend to fall outside the usual ranges. The conventional daytime and nighttime methods for Reco partitioning via eddy covariance data modeling appear not to respond to rainfall pulses, whether the soil was previously dry or not (Fig. 8d), and this becomes evident when we observe how only the chamber fluxes respond to a PPT event.
In our study, rain pulses were detected on 11 % of the days of the year, which implied that up to 18 % of the CO2 emissions occurred on days with rain pulses and that 15 % of the Rs,eco emissions came from rain pulses. However, the variability in the pulse length was high, with pulses lasting between the high-intensity moment of the first hour and up to several days. Given that the duration of the pulses is usually between 3 and 6 h at our site and the intensity of rain pulse events decreases with successive events, we can be more cautious and estimate that the total ecosystem contribution of rain pulses is less than 15 %, as is the case for other semi-arid areas (Delgado-Balbuena et al., 2023), where a 5 % contribution was estimated. At the ecosystem scale, we observed slight pulse signals with a lag of several days; therefore, the NEE models based exclusively on radiation or temperature may not be the most accurate for real-time characterization of this phenomenon. However, incorporating soil water content into these models would significantly enhance their predictive ability for the Birch effect.
The effect of rain pulse events on Rs is spatially dependent in agroecosystems with two vegetation levels. The rain pulse events were higher with greater time elapsed since the last rain episode confirmed that mineralization falls off in successive cycles as the amount of carbon declines (Birch, 1964), but this relationship was only described in the alleys (Fig. 8), whereas the rain pulse events under the trees were not statistically significant (Fig. 7). This could be because (i) the rain pulse events are higher in drier soils (Morillas et al., 2017), so the pulses may be less noticeable in irrigated areas; (ii) the rain pulses are inhibited by the tree canopy, implying rain interception (in fact, we can see a lower ΔSWC during rainy episodes under the trees); (iii) this process is more difficult to observe when soil respiration is largely autotrophic, as the Birch effect primarily involves heterotrophic respiration (Birch, 1964); and (iv) the carbon supply and the different soil characteristics lead to different CO2 release responses (Barnard et al., 2020). Rainfall pulses are reduced when vegetation cover is present (Liang et al., 2023) because the intensity of the event on the ground decreases and soil respiration rates in grasslands typically decline after multiple rewetting cycles (Fierer and Schimel, 2002). Also, porosity may be greater in the alleys, since the usual treatment before the start of herbicide application in 2014 was the establishment of a vegetal cover to increase porosity (Basche and DeLonge, 2017) and therefore volumetric displacement (Marañón-Jiménez et al., 2011). In general, this region shows a paradoxical increase in extreme precipitation events, even as the total annual amount decreases (Zittis et al., 2021). Therefore, this phenomenon of releasing CO2 could gain importance in the future in Mediterranean ecosystems. The implications of different management regimes in Mediterranean agroecosystems could be crucial for climate change mitigation strategies, as they could lead to Rs reductions (Wollenberg et al., 2016; Montanaro et al., 2023) with the use of covers that reduce losses of CO2 from precipitation events.
Continuous measurement with a multi-chamber system revealed a higher range of Rs values than those previously reported in olive groves. Rs Under-Tree was on average 3 times higher than Rs Alley, especially in the cold months, when 50 % of the Rs at the ecosystem level came from Rs Under-Tree, even though the canopy fraction represents only 27 %. Therefore, it cannot be assumed that Rs Alley is representative of olive grove soil respiration. Also, consistent patterns showing a higher Rs on the southern side of the tree individuals and an exponential decrease from the trees to the alley center allowed us to calculate the accumulated Rs at the ecosystem level.
The annual accumulation was 2100 g C m−2 and twice the Reco obtained through eddy covariance. The greater the role of tree respiration in the Rs of the ecosystem, the worse the relationship between the Rs behavior of the chambers and the modeled Reco-NT, showing that temperature-based models are insufficient in olive groves in the cold months. Furthermore, inverse relationships between Rs and temperature were found in summer (Q10 less than 1), indicating that the variation of Rs during this period is decoupled from changes in soil temperature. Although the underlying processes driving this observation need further study, this could be related to a reduction in newly produced photosynthates given a high VPD since GPP also decreased with soil temperature in summer.
Finally, high pulses of CO2 were observed when rain fell on dry soil, and they were higher with longer rain-free periods. The tree structure reduced the relationship and magnitude of the pulses with precipitation, thus reflecting interception. The pulses were determined by the previous soil moisture conditions, and the detection of the pulses was lost when aboveground respiration and soil respiration were observed together with eddy covariance. The continuity of the measurements allowed clear spatial differences to be established in the response of Rs to changes in temperature, soil moisture, and rainfall pulses. All these findings show spatial and temporal variability in Rs and its drivers that should be considered in future studies of soil CO2 respiration in Mediterranean agroecosystems.
The code and dataset are available in the Mendeley Digital Repository: https://doi.org/10.17632/9gwr9bft4k.1 (Aranda-Barranco, 2025).
The supplement related to this article is available online at https://doi.org/10.5194/soil-11-213-2025-supplement.
SAB and EPSC conceived the experimental design of the study and were responsible for the installation and maintenance of the soil chambers. SAB led the fieldwork, data processing, analysis, and preparation of the results. SAB also directed the preparation of the first draft of the paper. EPSC and POS supervised the work. ASK reviewed the English grammar. All the authors contributed to revising and correcting the final draft.
The contact author has declared that none of the authors has any competing interests.
Publisher's note: Copernicus Publications remains neutral with regard to jurisdictional claims made in the text, published maps, institutional affiliations, or any other geographical representation in this paper. While Copernicus Publications makes every effort to include appropriate place names, the final responsibility lies with the authors.
Sergio Aranda-Barranco acknowledges the support of the FPU grant from the Ministry of Universities of Spain (grant no. FPU19/01647). Thanks are given to the group of Castillo de Canena for the use of their farm as an experimental site and their people for continuous cooperation as well as to Manuel Martos for collecting data with the portable chamber during the manual campaigns. We appreciate Elise Pendall's comments during the review process.
This research has been supported by the “Plan Propio” and “Unidades de Excelencia” program from the UGR; the Consejería de Economía, Conocimiento, Empresas y Universidad, Junta de Andalucía (grant nos. C-EXP-366-UGR23 and P18-RT-3629); the Consejería de Universidad, Investigación e Innovación and Gobierno de España and Unión Europea – NextGenerationEU (BIOD22_001 and BIOD22_002); the Ministerio de Ciencia e Innovación (grant nos. PID2020-117825GB-C21 and PID2020-117825GB-C22); and the Ministerio de Universidades (grant no. FPU19/01647).
This paper was edited by Katerina Georgiou and reviewed by Kendalynnn Morris, Elise Pendall, and one anonymous referee.
Almagro, M., López, J., Querejeta, J. I., and Martínez-Mena, M.: Temperature dependence of soil CO2 efflux is strongly modulated by seasonal patterns of moisture availability in a Mediterranean ecosystem, Soil Biol. Biochem., 41, 594–605, https://doi.org/10.1016/j.soilbio.2008.12.021, 2009.
Álvarez, S., Soriano, M. A., Landa, B. B., and Gómez, J. A.: Soil properties in organic olive groves compared with that in natural areas in a mountainous landscape in southern Spain, Soil Use Manag., 23, 404–416, https://doi.org/10.1111/j.1475-2743.2007.00104.x, 2007.
Aranda-Barranco, S.: DataSet: Spatial and temporal heterogeneity of soil respiration in a bare-soil Mediterranean olive grove Time Series of Li8100 Soil respiration, SWC and Tsoil in Es-Cnd, V1, Mendeley Data [code, data set], https://doi.org/10.17632/9gwr9bft4k.1, 2025.
Aranda-Barranco, S., Serrano-Ortiz, P., Kowalski, A. S., and Sánchez-Cañete, E. P.: The temporary effect of weed-cover maintenance on transpiration and carbon assimilation of olive trees, Agr. Forest Meteorol., 329, 109266, https://doi.org/10.1016/j.agrformet.2022.109266, 2023.
Bahn, M., Rodeghiero, M., Anderson-Dunn, M., Dore, S., Gimeno, C., Drösler, M., Williams, M., Ammann, C., Berninger, F., Flechard, C., Jones, S., Balzarolo, M., Kumar, S., Newesely, C., Priwitzer, T., Raschi, A., Siegwolf, R., Susiluoto, S., Tenhunen, J., Wohlfahrt, G., and Cernusca, A.: Soil respiration in European grasslands in relation to climate and assimilate supply, Ecosystems, 11, 1352–1367, https://doi.org/10.1007/s10021-008-9198-0, 2008.
Baldocchi, D. D.: How eddy covariance flux measurements have contributed to our understanding of Glob. Change Biol., 26, 242–260, https://doi.org/10.1111/gcb.14807, 2020.
Barnard, R. L., Blazewicz, S. J., and Firestone, M. K.: Rewetting of soil: Revisiting the origin of soil CO2 emissions, 147, 107819, https://doi.org/10.1016/j.soilbio.2020.107819, 2020.
Barron-Gafford, G. A., Scott, R. L., Jenerette, G. D., and Huxman, T. E.: The relative controls of temperature, soil moisture, and plant functional group on soil CO2 efflux at diel, seasonal, and annual scales, J. Geophys. Res.-Biogeo., 116, G01023, https://doi.org/10.1029/2010JG001442, 2011.
Basche, A. and DeLonge, M.: The Impact of Continuous Living Cover on Soil Hydrologic Properties: A Meta-Analysis, Soil Sci. Soc. Am. J., https://doi.org/10.2136/sssaj2017.03.0077, 2017.
Bertolla, C., Caruso, G., and Gucci, R.: Seasonal changes in soil respiration rates in olive orchards, Acta Hortic., 1057, 275–280, https://doi.org/10.17660/ActaHortic.2014.1057.30, 2014.
Birch, H. F.: Mineralisation of plant nitrogen following alternate wet and dry conditions, Plant Soil, 20, 43–49 https://doi.org/10.1007/BF01378096, 1964.
Bond-Lamberty, B. and Thomson, A.: Temperature-associated increases in the global soil respiration record, Nature, 464, 579–582, https://doi.org/10.1038/nature08930, 2010.
Chamizo, S., Serrano-Ortiz, P., López-Ballesteros, A., Sánchez-Cañete, E. P., Vicente-Vicente, J. L., and Kowalski, A. S.: Net ecosystem CO2 exchange in an irrigated olive orchard of SE Spain: Influence of weed cover, Agr. Ecosyst. Environ., 239, 51–64, https://doi.org/10.1016/j.agee.2017.01.016, 2017.
Chen, S., Wang, J., Zhang, T., and Hu, Z.: Climatic, soil, and vegetation controls of the temperature sensitivity (Q10) of soil respiration across terrestrial biomes, Glob. Ecol. Conserv., 22, e00955, https://doi.org/10.1016/j.gecco.2020.e00955, 2020.
Comeau, L.-P., Lai, D. Y. F., Cui, J. J., and Farmer, J.: Separation of soil respiration: a site-specific comparison of partition methods, SOIL, 4, 141–152, https://doi.org/10.5194/soil-4-141-2018, 2018.
Davidson, E. A. and Janssens, I. A.: Temperature sensitivity of soil carbon decomposition and feedbacks to climate change, Nature, 440, 165–173, https://doi.org/10.1038/nature04514, 2006.
Delgado-Balbuena, J., Loescher, H. W., Aguirre-Gutiérrez, C. A., Alfaro-Reyna, T., Pineda-Martínez, L. F., Vargas, R., and Arredondo, T.: Dynamics of short-term ecosystem carbon fluxes induced by precipitation events in a semiarid grassland, Biogeosciences, 20, 2369–2385, https://doi.org/10.5194/bg-20-2369-2023, 2023.
Ekblad, A. and Högberg, P.: Natural abundance of 13C in CO2 respired from forest soils reveals speed of link between tree photosynthesis and root respiration, Oecologia, 127, 305–308, https://doi.org/10.1007/s004420100667, 2001.
FAOSTAT: Food and Agriculture Organization of the United Nations Statistical Dataset, https://www.fao.org/faostat/en/#data, last access: 9 September 2023.
Fernández, J. E. and Moreno, F.: Water use by the olive tree, Journal of Crop Production, 2, 101–162, https://doi.org/10.1300/J144v02n02_05, 1999.
Fierer, N. and Schimel, J. P.: Effects of drying-rewetting frequency on soil carbon and nitrogen transformations, Soil Biol. Biochem., 34, 777–787, https://doi.org/10.1016/S0038-0717(02)00007-X, 2002.
Fratini, G., Ibrom, A., Arriga, N., Burba, G., and Papale, D.: Relative humidity effects on water vapour fluxes measured with closed-path eddy-covariance systems with short sampling lines, Agr. Forest Meteorol., 165, 53–63, https://doi.org/10.1016/j.agrformet.2012.05.018, 2012.
Friedlingstein, P., O'Sullivan, M., Jones, M. W., Andrew, R. M., Gregor, L., Hauck, J., Le Quéré, C., Luijkx, I. T., Olsen, A., Peters, G. P., Peters, W., Pongratz, J., Schwingshackl, C., Sitch, S., Canadell, J. G., Ciais, P., Jackson, R. B., Alin, S. R., Alkama, R., Arneth, A., Arora, V. K., Bates, N. R., Becker, M., Bellouin, N., Bittig, H. C., Bopp, L., Chevallier, F., Chini, L. P., Cronin, M., Evans, W., Falk, S., Feely, R. A., Gasser, T., Gehlen, M., Gkritzalis, T., Gloege, L., Grassi, G., Gruber, N., Gürses, Ö., Harris, I., Hefner, M., Houghton, R. A., Hurtt, G. C., Iida, Y., Ilyina, T., Jain, A. K., Jersild, A., Kadono, K., Kato, E., Kennedy, D., Klein Goldewijk, K., Knauer, J., Korsbakken, J. I., Landschützer, P., Lefèvre, N., Lindsay, K., Liu, J., Liu, Z., Marland, G., Mayot, N., McGrath, M. J., Metzl, N., Monacci, N. M., Munro, D. R., Nakaoka, S.-I., Niwa, Y., O'Brien, K., Ono, T., Palmer, P. I., Pan, N., Pierrot, D., Pocock, K., Poulter, B., Resplandy, L., Robertson, E., Rödenbeck, C., Rodriguez, C., Rosan, T. M., Schwinger, J., Séférian, R., Shutler, J. D., Skjelvan, I., Steinhoff, T., Sun, Q., Sutton, A. J., Sweeney, C., Takao, S., Tanhua, T., Tans, P. P., Tian, X., Tian, H., Tilbrook, B., Tsujino, H., Tubiello, F., van der Werf, G. R., Walker, A. P., Wanninkhof, R., Whitehead, C., Willstrand Wranne, A., Wright, R., Yuan, W., Yue, C., Yue, X., Zaehle, S., Zeng, J., and Zheng, B.: Global Carbon Budget 2022, Earth Syst. Sci. Data, 14, 4811–4900, https://doi.org/10.5194/essd-14-4811-2022, 2022.
García-Ruiz, J. M., Nadal-Romero, E., Lana-Renault, N., and Beguería, S.: Erosion in Mediterranean landscapes: Changes and future challenges, Geomorphology, 198, 20–36, https://doi.org/10.1016/j.geomorph.2013.05.023, 2013.
Gómez, J. A., Sobrinho, T. A., Giráldez, J. V., and Fereres, E.: Soil management effects on runoff, erosion and soil properties in an olive grove of Southern Spain, Soil Till. Res., 102, 5–13, https://doi.org/10.1016/j.still.2008.05.005, 2009.
González-Ubierna, S. and Lai, R.: Modelling the effects of climate factors on soil respiration across Mediterranean ecosystems, J. Arid Environ., 165, 46–54, https://doi.org/10.1016/j.jaridenv.2019.02.008, 2019.
Hamerlynck, E. P., Scott, R. L., Sánchez-Cañete, E. P., and Barron-Gafford, G. A.: Nocturnal soil CO2 uptake and its relationship to subsurface soil and ecosystem carbon fluxes in a Chihuahuan Desert shrubland, J. Geophys. Res.-Biogeo., 118, 1593–1603, https://doi.org/10.1002/2013JG002495, 2013.
Han, M. and Jin, G.: Seasonal variations of Q10 soil respiration and its components in the temperate forest ecosystems, northeastern China, Eur. J. Soil Biol., 85, 36–42, https://doi.org/10.1016/j.ejsobi.2018.01.001, 2018.
Hashimoto, S., Carvalhais, N., Ito, A., Migliavacca, M., Nishina, K., and Reichstein, M.: Global spatiotemporal distribution of soil respiration modeled using a global database, Biogeosciences, 12, 4121–4132, https://doi.org/10.5194/bg-12-4121-2015, 2015.
Högberg, P., Nordgren, A., Buchmann, N., Taylor, A. F. S., Ekblad, A., Högberg, M. N., Nyberg, G., Ottosson-Löfvenius, M., and Read, D. J.: Large-scale forest girdling shows that current photosynthesis drives soil respiration, Nature, 411, 789–792, https://doi.org/10.1038/35081058, 2001.
Hursh, A., Ballantyne, A., Cooper, L., Maneta, M., Kimball, J., and Watts, J.: The sensitivity of soil respiration to soil temperature, moisture, and carbon supply at the global scale, Glob. Change Biol., 23, 2090–2103, https://doi.org/10.1111/gcb.13489, 2017.
IFAPA: Instituto Andaluz de Investigación y Formación Agraria, Pesquera, Alimentaria y de la Producción Ecológica (IFAPA), Estaciones Agroclimáticas, https://www.juntadeandalucia.es/agriculturaypesca/ifapa/ria/servlet/FrontController, last access: 17 March 2022.
Inglima, I., Alberti, G., Bertolini, T., Vaccari, F. P., Gioli, B., Miglietta, F., Cotrufo, M. F., and Peressotti, A.: Precipitation pulses enhance respiration of Mediterranean ecosystems: The balance between organic and inorganic components of increased soil CO2 efflux, Glob. Change Biol., 15, 1289–1301, https://doi.org/10.1111/j.1365-2486.2008.01793.x, 2009.
Jarvis, P., Rey, A., Petsikos, C., Wingate, L., Rayment, M., Pereira, J., Banza, J., David, J., Miglietta, F., Borghetti, M., Manca, G., and Valentini, R.: Drying and wetting of Mediterranean soils stimulates decomposition and carbon dioxide emission: The “Birch effect”, Tree Physiol., 27, 929–940, https://doi.org/10.1093/treephys/27.7.929, 2007.
Jian, J., Vargas, R., Anderson-Teixeira, K., Stell, E., Herrmann, V., Horn, M., Kholod, N., Manzon, J., Marchesi, R., Paredes, D., and Bond-Lamberty, B.: A restructured and updated global soil respiration database (SRDB-V5), Earth Syst. Sci. Data, 13, 255–267, https://doi.org/10.5194/essd-13-255-2021, 2021.
Kutikoff, S., Lin, X., Evett, S. R., Gowda, P., Brauer, D., Moorhead, J., Marek, G., Colaizzi, P., Aiken, R., Xu, L., and Owensby, C.: Water vapor density and turbulent fluxes from three generations of infrared gas analyzers, Atmos. Meas. Tech., 14, 1253–1266, https://doi.org/10.5194/amt-14-1253-2021, 2021.
Lasslop, G., Reichstein, M., Papale, D., Richardson, A., Arneth, A., Barr, A., Stoy, P., and Wohlfahrt, G.: Separation of net ecosystem exchange into assimilation and respiration using a light response curve approach: Critical issues and global evaluation, Glob. Change Biol.,16, 187–208, https://doi.org/10.1111/j.1365-2486.2009.02041.x, 2010.
Lei, J., Guo, X., Zeng, Y., Zhou, J., Gao, Q., and Yang, Y.: Temporal changes in global soil respiration since 1987, Nat. Commun., 12, 403, https://doi.org/10.1038/s41467-020-20616-z, 2021.
Leon, E., Vargas, R., Bullock, S., Lopez, E., Panosso, A. R., and La Scala, N.: Hot spots, hot moments, and spatio-temporal controls on soil CO2 efflux in a water-limited ecosystem, Soil Biol. Biochem., 77, 12–21, https://doi.org/10.1016/j.soilbio.2014.05.029, 2014.
Li, J., Pei, J., Pendall, E., Fang, C., and Nie, M.: Spatial heterogeneity of temperature sensitivity of soil respiration: A global analysis of field observations, Soil Biol. Biochem., 141, 107675, https://doi.org/10.1016/j.soilbio.2019.107675, 2020.
Liang, Z., Rasmussen, J., Poeplau, C., and Elsgaard, L.: Priming effects decrease with the quantity of cover crop residues – Potential implications for soil carbon sequestration, Soil Biol. Biochem., 184, 109110, https://doi.org/10.1016/j.soilbio.2023.109110, 2023.
Lloyd, J. and Taylor, J. A.: On the Temperature Dependence of Soil Respiration, Funct. Ecol., 8, 315–323, https://doi.org/10.2307/2389824, 1994.
Makita, N., Kosugi, Y., Sakabe, A., Kanazawa, A., Ohkubo, S., and Tani, M.: Seasonal and diurnal patterns of soil respiration in an evergreen coniferous forest: Evidence from six years of observation with automatic chambers, PLoS One, 13, e0192622, https://doi.org/10.1371/journal.pone.0192622, 2018.
Malek, Ž. and Verburg, P.: Mediterranean land systems: Representing diversity and intensity of complex land systems in a dynamic region, Landsc. Urban Plan., 165, 102–116, https://doi.org/10.1016/j.landurbplan.2017.05.012, 2017.
Marañón-Jiménez, S., Castro, J., Kowalski, A. S., Serrano-Ortiz, P., Reverter, B. R., Sánchez-Cañete, E. P., and Zamora, R.: Post-fire soil respiration in relation to burnt wood management in a Mediterranean mountain ecosystem, Forest Ecol. Manage., 261, 1436–1447, https://doi.org/10.1016/j.foreco.2011.01.030, 2011.
Marzaioli, R., D'Ascoli, R., De Pascale, R. A., and Rutigliano, F. A.: Soil quality in a Mediterranean area of Southern Italy as related to different land use types, Appl. Soil Ecol., 44, 205–212, https://doi.org/10.1016/j.apsoil.2009.12.007, 2010.
Mauder, M., Cuntz, M., Drüe, C., Graf, A., Rebmann, C., Schmid, H. P., Schmidt, M., and Steinbrecher, R.: A strategy for quality and uncertainty assessment of long-term eddy-covariance measurements, Agr. Forest Meteorol., 169, 122–135, https://doi.org/10.1016/j.agrformet.2012.09.006, 2013.
Mikan, C. J., Schimel, J. P., and Doyle, A. P.: Temperature controls of microbial respiration in arctic tundra soils above and below freezing, Soil Biol. Biochem., 34, 1785–1795, https://doi.org/10.1016/S0038-0717(02)00168-2, 2002.
Moncrieff, J., Clement, R., Finnigan, J., and Meyers, T.: Chapter: Averaging, Detrending, and Filtering of Eddy Covariance Time Series, 7–31, in: Handbook of Micrometeorology, edited by: Lee, X., Massman, W., and Law, B., Part of the book series: Atmospheric and Oceanographic Sciences Library (ATSL, Vol. 29), Kluwer Academic Publishers, https://doi.org/10.1007/1-4020-2265-4_2, 2006.
Montanaro, G., Doupis, G., Kourgialas, N., Markakis, E., Kavroulakis, N., Psarras, G., Koubouris, G., Dichio, B., and Nuzzo, V.: Management options influence seasonal CO2 soil emissions in Mediterranean olive ecosystems, Eur. J. Agron., 146, 126815, https://doi.org/10.1016/j.eja.2023.126815, 2023.
Moriana, A., Orgaz, F., Pastor, M., and Fereres, E.: Yield responses of a mature olive orchard to water deficits, J. Am. Soc. Hortic. Sci., 128, 425–431, https://doi.org/10.21273/jashs.128.3.0425, 2003.
Morillas, L., Roales, J., Portillo-Estrada, M., and Gallardo, A.: Wetting-drying cycles influence on soil respiration in two Mediterranean ecosystems, Eur. J. Soil Biol., 82, 10–16, https://doi.org/10.1016/j.ejsobi.2017.07.002, 2017.
Muñoz-Rojas, M., Jordán, A., Zavala, L. M., De la Rosa, D., Abd-Elmabod, S. K., and Anaya-Romero, M.: Organic carbon stocks in Mediterranean soil types under different land uses (Southern Spain), Solid Earth, 3, 375–386, https://doi.org/10.5194/se-3-375-2012, 2012.
Nieto, O. M., Castro, J., and Fernández-Ondoño, E.: Conventional tillage versus cover crops in relation to carbon fixation in Mediterranean olive cultivation, Plant Soil, 365, 321–335, https://doi.org/10.1007/s11104-012-1395-0, 2013.
Novara, A., Cerda, A., Barone, E., and Gristina, L.: Cover crop management and water conservation in vineyard and olive orchards, Soil Till. Res., 208, 104896, https://doi.org/10.1016/j.still.2020.104896, 2021.
Panettieri, M., Moreno, B., de Sosa, L. L., Benítez, E., and Madejón, E.: Soil management and compost amendment are the main drivers of carbon sequestration in rainfed olive trees agroecosystems: An evaluation of chemical and biological markers, Catena, 214, 106258, https://doi.org/10.1016/j.catena.2022.106258, 2022.
Ravikovitch, P. I., Bogan, B. W., and Neimark, A. V.: Nitrogen and carbon dioxide adsorption by soils, Environ. Sci. Technol., 39, 4990–4995, https://doi.org/10.1021/es048307b, 2005.
Reichstein, M., Falge, E., Baldocchi, D., Papale, D., Aubinet, M., Berbigier, P., Bernhofer, C., Buchmann, N., Gilmanov, T., Granier, A., Grünwald, T., Havránková, K., Ilvesniemi, H., Janous, D., Knohl, A., Laurila, T., Lohila, A., Loustau, D., Matteucci, G., Meyers, T., Miglietta, F., Ourcival, J. M., Pumpanen, J., Rambal, S., Rotenberg, E., Sanz, M., Tenhunen, J., Seufert, G., Vaccari, F., Vesala, T., Yakir, D., and Valentini, R.: On the separation of net ecosystem exchange into assimilation and ecosystem respiration: Review and improved algorithm, Glob. Change Biol., 11, 1424–1439, https://doi.org/10.1111/j.1365-2486.2005.001002.x, 2005.
Sánchez-Cañete, E. P., Scott, R. L., van Haren, J., and Barron-Gafford, G. A.: Improving the accuracy of the gradient method for determining soil carbon dioxide efflux, J. Geophys. Res.-Biogeo., 122, 50–64, https://doi.org/10.1002/2016JG003530, 2017.
Sierra, M., Martinez, F. J., Braojos, V., Romero-Freire, A., Ortiz-Bernad, I., and Martin, F. J.: Chemical stabilization of organic carbon in agricultural soils in a semi-arid region (SE Spain), J. Agr. Sci., 154, 87–97, https://doi.org/10.1017/S002185961500012X, 2016.
Skopp, J., Jawson, M. D., and Doran, J. W.: Steady-State Aerobic Microbial Activity as a Function of Soil Water Content, Soil Sci. Soc. Am. J., 54, 1619–1625, https://doi.org/10.2136/sssaj1990.03615995005400060018x, 1990.
Stoyan, H., De-Polli, H., Böhm, S., Robertson, G. P., and Paul, E. A.: Spatial heterogeneity of soil respiration and related properties at the plant scale, Plant Soil, 222, 203–214, https://doi.org/10.1023/a:1004757405147, 2000.
Taguas, E. V., Marín-Moreno, V., Díez, C. M., Mateos, L., Barranco, D., Mesas-Carrascosa, F. J., Pérez, R., García-Ferrer, A., and Quero, J. L.: Opportunities of super high-density olive orchard to improve soil quality: Management guidelines for application of pruning residues, J. Environ. Manage., 293, 112785, https://doi.org/10.1016/j.jenvman.2021.112785, 2021.
Talmon, Y., Sternberg, M., and Grünzweig, J. M.: Impact of rainfall manipulations and biotic controls on soil respiration in Mediterranean and desert ecosystems along an aridity gradient, Glob. Change Biol., 17, 1108–1118, https://doi.org/10.1111/j.1365-2486.2010.02285.x, 2011.
Tang, J., Baldocchi, D. D., and Xu, L.: Tree photosynthesis modulates soil respiration on a diurnal time scale, Glob. Change Biol., 11, 1298–1304, https://doi.org/10.1111/j.1365-2486.2005.00978.x, 2005.
Testi, L., Orgaz, F., and Villalobos, F.: Carbon exchange and water use efficiency of a growing, irrigated olive orchard, Environ. Exp. Bot., 63, 168–177, https://doi.org/10.1016/j.envexpbot.2007.11.006, 2008.
Turrini, A., Caruso, G., Avio, L., Gennai, C., Palla, M., Agnolucci, M., Tomei, P. E., Giovannetti, M., and Gucci, R.: Protective green cover enhances soil respiration and native mycorrhizal potential compared with soil tillage in a high-density olive orchard in a long term study, Appl. Soil Ecol., 116, 70–78, https://doi.org/10.1016/j.apsoil.2017.04.001, 2017.
Vargas, R. and Le, V. H.: The paradox of assessing greenhouse gases from soils for nature-based solutions, Biogeosciences, 20, 15–26, https://doi.org/10.5194/bg-20-15-2023, 2023.
Vickers, D. and Mahrt, L.: Quality control and flux sampling problems for tower and aircraft data, J. Atmos. Ocean. Tech., 14, 512–526, https://doi.org/10.1175/1520-0426(1997)014<0512:QCAFSP>2.0.CO;2, 1997.
Wang, B., Zha, T. S., Jia, X., Wu, B., Zhang, Y. Q., and Qin, S. G.: Soil moisture modifies the response of soil respiration to temperature in a desert shrub ecosystem, Biogeosciences, 11, 259–268, https://doi.org/10.5194/bg-11-259-2014, 2014.
Wang, Y., Luo, G., Li, C., Ye, H., Shi, H., Fan, B., Zhang, W., Zhang, C., Xie, M., and Zhang, Y.: Effects of land clearing for agriculture on soil organic carbon stocks in drylands: A meta-analysis, Glob. Change Biol., 29, 547–562, https://doi.org/10.1111/gcb.16481, 2023.
Warner, D. L., Bond-Lamberty, B., Jian, J., Stell, E., and Vargas, R.: Spatial Predictions and Associated Uncertainty of Annual Soil Respiration at the Global Scale, Global Biogeochem. Cy., 33, 1733–1745, https://doi.org/10.1029/2019GB006264, 2019.
Wollenberg, E., Richards, M., Smith, P., Havlík, P., Obersteiner, M., Tubiello, F. N., Herold, M., Gerber, P., Carter, S., Reisinger, A., van Vuuren, D. P., Dickie, A., Neufeldt, H., Sander, B. O., Wassmann, R., Sommer, R., Amonette, J. E., Falcucci, A., Herrero, M., Opio, C., Roman-Cuesta, R. M., Stehfest, E., Westhoek, H., Ortiz-Monasterio, I., Sapkota, T., Rufino, M. C., Thornton, P. K., Verchot, L., West, P. C., Soussana, J. F., Baedeker, T., Sadler, M., Vermeulen, S., and Campbell, B. M.: Reducing emissions from agriculture to meet the 2 °C target, Glob. Change Biol., 22, 3859–3864, https://doi.org/10.1111/gcb.13340, 2016.
Wutzler, T., Lucas-Moffat, A., Migliavacca, M., Knauer, J., Sickel, K., Šigut, L., Menzer, O., and Reichstein, M.: Basic and extensible post-processing of eddy covariance flux data with REddyProc, Biogeosciences, 15, 5015–5030, https://doi.org/10.5194/bg-15-5015-2018, 2018.
Xu, M. and Shang, H.: Contribution of soil respiration to the global carbon equation, J. Plant Physiol., 203, 16–28, https://doi.org/10.1016/j.jplph.2016.08.007, 2016.
Zhao, Z., Peng, C., Yang, Q., Meng, F. R., Song, X., Chen, S., Epule, T. E., Li, P., and Zhu, Q.: Model prediction of biome-specific global soil respiration from 1960 to 2012, Earth's Future, 5, 715–729, https://doi.org/10.1002/2016EF000480, 2017.
Zittis, G., Bruggeman, A., and Lelieveld, J.: Revisiting future extreme precipitation trends in the Mediterranean, Weather Clim. Extrem., 34, 100380, https://doi.org/10.1016/j.wace.2021.100380, 2021.