the Creative Commons Attribution 4.0 License.
the Creative Commons Attribution 4.0 License.
 | 06 Jun 2024
Estimations of soil metal accumulation or leaching potentials under climate change scenarios: the example of copper on a European scale
Julie-Maï Paris
Isabelle Lamy
Bertrand Guenet
Contaminant inputs to soil are highly dependent on anthropogenic activities, while contaminant retention, mobility, and availability are highly dependent on soil properties. The knowledge of partitioning between soil solid and solution phases is necessary to estimate whether deposited amounts of contaminants will be either transported with runoff or accumulated. Besides, runoff is expected to change during the next century due to changes in climate and in rainfall patterns. In this study, we aimed to estimate at the European scale the areas with a potential risk due to contaminant leaching (LP). We also defined, in the same way, the surface areas where limited copper (Cu) leaching occurred, leading to potential accumulation (AP) areas. We focused on Cu widely used in agriculture either in a mineral form or in association with organic fertilizers, resulting in high spatial variations in the deposited and incorporated amounts in soils, as well as in European policies of application. We developed a method using both Cu partition coefficients (Kf) between total and dissolved Cu forms and runoff simulation results for historical and future climates. The calculation of Kf with pedo-transfer functions allowed us to avoid any uncertainties due to past management or future depositions that may affect total Cu concentrations. Areas with a high potential risk of leaching or of accumulation were estimated over the 21st century by comparing Kf and runoff to their respective European medians. Thus, at three distinct times, we considered a grid cell to be at risk of LP if its Kf was low compared to the European median and if its runoff was high compared to the European median of the time. Similarly, a grid cell was considered to be at risk of AP if its Kf was high and its runoff was low compared to its respective European median of the time. To deal with uncertainties in climate change scenarios and the associated model prediction, we performed our study with two atmospheric greenhouse gas representative concentration pathways (RCPs), defined according to climate change associated with a large set of socio-economic scenarios found in the literature. We used two land surface models (ORCHIDEE and LPJmL, given soil hydrologic properties) and two global circulation models (ESM2m and CM5a, given rainfall forecasts). Our results show that, for historical scenarios, 6.4 ± 0.1 % (median, median deviation) and 6.7 ± 1.1 % of the grid cells of the European land surfaces experience LP and AP, respectively. Interestingly, we simulate a constant surface area with LP and AP for around 13 % of the grid cells, which is consistent with an increase in AP and a decrease in LP. Despite large variations in LP and AP extents, depending on the land surface model used for estimations, the two trends were more pronounced with RCP 6.0 than with RCP 2.6, highlighting the global risk of combined climate change and contamination and the need for more local and seasonal assessments. Results are discussed to highlight the points requiring improvement to refine predictions.
- Article
(2115 KB) - Full-text XML
-
Supplement
(1008 KB) - BibTeX
- EndNote


At a large spatial scale, trace element contents in soils are highly variable in relation to the trace element contents of the soil parental rocks and local anthropogenic inputs of various origins (Flemming and Trevors, 1989; Salminen and Gregorauskiene, 2000; Noll, 2003). Some trace elements like copper (Cu) or zinc are required for several biological mechanisms, but, when highly concentrated, they may have toxic effects on soil organisms (Giller et al., 1998). In particular, Cu is widely used as a fungicide, especially against downy mildew in vineyard parcels (Komárek et al., 2010), but it is also used in industrial processes. Besides, Cu applications to soils are numerous, in the mineral form or within the organic fertilizers applied, leading to a global European limit in terms of application. At the European scale, a gradient of soil Cu concentrations can be found: from typical baseline values between 5 to 20 mg Cu kg−1 (Salminen and Gregorauskiene, 2000) to values larger than 100 mg Cu kg−1, common in cultivated soils and especially in vineyards parcels (Ballabio et al., 2018). It is commonly accepted to conceptually partition the total soil Cu content into different pools of Cu forms in close equilibrium. Briefly, three pools can be defined: a so-called “inert” pool corresponding to Cu included in minerals, a so-called “labile” pool corresponding to Cu that is sorbed to soil constituents but that can be mobilized according to environmental conditions, and a smallest “mobile” pool corresponding to Cu in the soil solution that may be readily available for living organisms but also for transport within soil horizons (West and Coombs, 1981; Rooney et al., 2006; Broos et al., 2007). Schematically, these pools are governed by processes like exchange, complexation, or sorption. Also, local soil characteristics such as organic matter, pH, or cationic exchange capacity can affect the proportion of Cu in these different pools (Vidal et al., 2009). Any modifications to the soil properties or soil solution composition may thus affect the Cu equilibrium between sorbed and solution phases. The pool of Cu in the solution phase can be assimilated to a potential pool of Cu leaching. Conversely, Cu bound to the solid phases can be assimilated to a potential pool of Cu accumulation in soil. Depending on the main process involved, for a given amount of Cu deposited in soil, the proportions of leached and accumulated Cu can vary from place to place and with time. However, studies simulating whether the soil will rather leach or accumulate a contaminant are scarce, especially at a large spatial scale. Knowing and predicting this leaching or retention, however, could allow us to highlight contaminated areas with a potential to leach, disperse, or accumulate contaminants and could therefore help in long-term environmental management.
Concurrently, climate change due to anthropogenic activities is expected to impact rainfall patterns in the forthcoming decades, leading to changes in the frequency and intensity of weather events at regional and local levels (Christensen and Christensen, 2003). For instance, an increase in rain- and snowfall events in winter in northern Europe but a decrease in summer in the Mediterranean region are projected; this extends to northward regions (Douville et al., 2021), with the extent of rain- and snowfall alterations depending on climate change. Thus, climate change will alter the soil water flows throughout the century (Mimikou et al., 2000). For instance, an increase in rainfall intensity and in water accumulation in the soil surface due to limited water infiltration may induce large runoff (Chu et al., 2019). Changes in runoff will also change the fluxes of elements or of particulates in the soil solution, as has been shown for Cu (Babcsányi et al., 2016). However, predicting how these runoff changes will relate to elemental contaminant fluxes in the coming decades remains difficult.
In this framework, our aim was twofold: (i) to estimate the areas that are the most likely to lose soil Cu within the soil solution and water flows, hereafter named leaching potential (LP) areas, for the historical period (2001–2005) and (ii) to predict their changes according to different climate change scenarios. Additionally, we aimed to estimate the areas that are the most likely to accumulate Cu, hereafter named accumulation potential (AP) areas. We hypothesized that the processes of Cu accumulation or leaching can be described by the combined effects of local runoff amounts and of local soil properties controlling the partitioning of total Cu in sorbed and solution species. Due to the lack of information about the future Cu deposition, whatever its form, we developed a method using the partitioning coefficient (Kf) at the equilibrium between solid and solution phases to determine areas with high or low potentials for leaching, whatever the total Cu concentration. Regarding the lack of data about future deposited amounts at a large scale, using Kf was necessary to estimate the Cu mobility potential. The LP or AP areas were thus estimated through the combined use of Kf, calculated with the help of pedo-transfer functions, and of soil runoff amounts extracted from Earth system simulations. With the use of Kf, we avoided the uncertainties due to past land management and previous Cu deposition and focused on risks arising from future deposition. To do so, we first reviewed the empirical equations estimating Cu's Kf based on soil properties to highlight generic soil properties governing this partitioning. From this review, we extracted the best compromise Kf equation to estimate partitioning at the regional scale, which ensures more accurate Kf calculations based on pedo-geochemical data that are typically recorded in soil surveys and, thus, are mainly available. This allowed us to estimate Cu's Kf values to be used at the European scale based on pedo-geochemical soil surveys without the knowledge of soil Cu total content. We then focused on the current state of the climate and its projected changes over the 21st century based on two climate change scenarios. The rainfall predictions were analyzed at a 0.5° resolution, which is a common scale for land surface models, allowing a multi-comparison to capture the variability in soil properties and rainfall regimes. To capture the difficulties in runoff prediction and to disentangle the uncertainties between the rainfall prediction and runoff calculations of land surface models, we used a set of simulations provided by the Inter-Sectoral Impact Model Intercomparison Project (ISIMIP). These simulations used different land surface models driven by different climate forcings computed by different climate models. For each scenario and each coupling of land surface model and climate forcing, we estimated the LP or AP of each grid cell by means of comparison between the local values of Kf and of runoff and the respective calculated European median that is less affected by extreme values than the arithmetic mean.
2.1 Equations to estimate copper Kf
The rigorous definition of Kf is based on the concentration ratio of sorbed vs. solution species (here Cu) at the equilibrium. Yet, for practical reasons of measurement and applicability, Kf is conventionally derived from total Cu and not from sorbed Cu (Degryse et al., 2009). A general form of the Cu partition coefficient between the soil and solution – Kf – can be used to describe Cu concentrations in the sorbed and solution phases, defined according to Eq. (1):
where Cutotal is the total Cu content of soil (in mg kg−1), Cusolution is the Cu content of the soil solution (in mg L−1), and n stands for the variation in binding strength with metal loading (Groenenberg et al., 2010). A low Kf reflects a high proportion of Cu in the solution for a given total Cu content of the soil. Kf can vary as a function of different soil parameters (Degryse et al., 2009; Elzinga et al., 1999) and can also be estimated using Eq. (2):
with Xi being the different soil parameters and ai being the corresponding coefficient associated with the parameter.
Numerous studies in the literature have attempted the determination of the value of Kf using Eq. (2) based on statistical relationships between soil pedo-geochemical parameters, Cu in the solution, and total Cu measurements. The soil pedo-geochemical parameter Xi and its associated coefficient ai can differ depending on the study and the data set used for the estimation. For the purposes of this study, Kf is estimated at the European Union level; thus, the formula chosen strikes the best balance between the accuracy of the relationship and its applicability on a wide scale. Thus, the equation must
- i.
include only parameters that are measured in large soil surveys,
- ii.
be fitted to a large range of each soil parameter,
- iii.
focus on in situ long-term contamination and not on laboratory experiments.
On December 2020, we first conducted bibliographic research on Web of Science (WOS) looking for the following: ‑Cu ” AND ‑availab* ” AND ‑soil ” AND TOPIC function. We then completed this search by examining the references cited in the articles found. We collected the available relationships for estimating Kf on the basis of soil pedo-geochemical characteristics and/or total Cu. We selected only relationships that were based on commonly collected soil pedo-geochemical characteristics – such as soil organic matter (OM) or soil organic carbon (OC), dissolved organic carbon (DOC), cationic exchange capacity (CEC), clay percentage, and pH – constituting the most frequently reported values from large-scale soil surveys.
2.2 Soil data
This study used European data on various soil parameters, in particular pH and organic carbon (OC), obtained from the Joint Research Centre's (JRC) LUCAS topsoil data. The data set is limited only to the territories of European Union member states. The aforementioned data set provides information on pH (Panagos et al., 2022; Ballabio et al., 2016; ESDAC – European Commission, 2024; Panagos et al., 2012) and OC contents (Panagos et al., 2022; de Brogniez et al., 2015; ESDAC – European Commission, 2024; Panagos et al., 2012). The data have been re-gridded with CDO commands (Schulzweida, 2019) to a spatial resolution of 0.5° (equivalent to approximately 50 km). This was done to match the resolution of the land surface models that were used to estimate the runoff. The resulting runoff data are presented in Sect. 2.3.
2.3 Runoff data from land surface models
Runoff is computed in land models based on incoming precipitation, calculated evapotranspiration, and soil hydrologic capacities. To estimate changes in soil runoff during the 21st century and to reduce uncertainties, we used two typical land surface scheme models (LSMs) – namely ORCHIDEE (Krinner et al., 2005) and LPJmL (Sitch et al., 2003)– and two global circulation models (GCMs) providing climate projections – namely IPSL-CM5a (Dufresne et al., 2013) and GDFL-ESM2m (Dunne et al., 2012), further named CM5a and ESM2m, respectively. Our study exploited simulations conducted as part of the Inter-Sectoral Impact Model Intercomparison Project Phase 2b (ISIMIP2b), which supplied simulations of land surface models driven by binding scenarios from the period 1861–2099 (Frieler et al., 2017). Further details of the protocol used can be found in the ISIMIP2b documentation (The Inter-Sectoral Impact Model Intercomparison Project, 2021). The ISIMIP2b utilizes harmonized climate forcings derived from gridded, daily bias-adjusted climate data of various CMIP5 (Coupled Model Intercomparison Project 5) global circulation models (GCMs) (Frieler et al., 2017; Lange, 2016), as well as global annual atmospheric CO2 concentration and harmonized annual land use maps (Klein Goldewijk et al., 2017). The application of bias-corrected climate data ensures that the climate used by the land surface models is consistent with observations over the last 40 years of the historical period. We compared the historical data calculated by the different models with three 5-year periods distributed over the 21st century: 2001–2005, called the historical scenario; 2051–2055; and 2091–2095. In order to simulate the 2051–2055 and 2091–2095 periods, we used two century-scale scenarios called representative concentration pathways (RCPs). These scenarios have been defined by the Intergovernmental Panel on Climate Change (IPCC) (van Vuuren et al., 2011) and correspond to common socio-economic pathways followed by the world's population. Here, we focused on RCP 2.6, which represents an active reduction in greenhouse gas emissions to comply with the Paris Agreement, and RCP 6.0, which represents more or less “business as usual”. RCP 2.6 is predicted to produce a radiation forcing of 2.6 W m−2, whereas RCP 6.0 would result in a radiation forcing of 6 W m−2.
For each combination of LSMs (LPJmL or ORCHIDEE) and GCMs (CM5a or ESM2m), we calculated the mean over 5 years for three evenly spaced periods of the 21st century: 2001–2005, 2051–2055, and 2091–2095. The cross scheme of two land surface models and two GCMs enabled us to establish whether estimations of runoff are influenced more by rainfall projections provided by the GCMs or by the representation of soil hydrologic characteristics provided by the LSMs. When predictions are driven by soil hydrologic properties, the highest differences in runoff predictions are expected between couplings of the same LSM with different GCMs (e.g., LPJmL_CM5a is closer to LPJmL_ESM2m than to ORCHIDEE_CM5a). Contrarily, when predictions are driven by rainfall projections, the highest differences in runoff predictions are expected between couplings of the same GCM with different LSMs (e.g., LPJmL_CM5a is closer to ORCHIDEE_CM5a than to LPJml_ESM2m).
2.4 Assessment of AP and LP areas
AP or LP areas were assessed by comparing the Kf and runoff values of each grid cell with their corresponding spatial median. Median runoff was computed for the whole of Europe for each 5-year period studied per model. LP areas were characterized by low Kf and high runoff, while AP areas were characterized by the opposite (see Eqs. 3 and 4). We identified grid cells with unusually high or low values, later referred to as anomalies, as grid cells above or below 1 mean absolute deviation (MAD). MAD was computed as median(|xi|−median(x)), with x being successive runoff, and Kf was computed for the grid cells where it can be estimated (see Eqs. 3 and 4).
For each combination of LSM (ORCHIDEE or LPJmL) and GCM (CM5a or ESM2m) and for each time period (t=2001–2005, 2051–2055, or 2019–2095), with the two climate change scenarios (RCP 2.6 or RCP 6.0) applied for the periods 2051–2055 and 2091–2095, we have defined LP and AP areas as follows:
-
Areas with soils exhibiting high potentiality of Cu leaching (LP areas, referred to as LP) under the 1-MAD threshold for a 5-year mean time period t were defined as areas where grid cells i have
-
Areas with soils exhibiting low potentiality of leaching and high Cu accumulation potentiality (AP areas, referred to as AP) under the 1 MAD-threshold for a 5-year mean time period t were defined as areas where grid cells i have
The benefit of this approach is that anomaly identification is not affected by the set of coefficients chosen to compute Kf, and it removes the absolute nature of the values. However, it focus on the deviation from the median.
We choose to calculate the MAD of each time period to emphasize the spatial variability. Anomaly identification could also be done using the historical runoff as a reference and looking at its change with time. However, when considering the actual rainfall regime as a reference, we consider the fact that the current environmental risk includes the spatial risk variability.
In the next sections, the results of the temporal trends are presented using the median per model and the mean over the four models.
We used R 4.1.2 (R Core Team, 2021) to compute anomalies and to create the figures.
3.1 Kf estimations at the European scale
The empirical equations extracted from our literature review to estimate Kf are given in Table 1. We collected 15 equations allowing us to calculate Kf as the coefficient of partitioning between total Cu and Cu in the solution. Among these equations, pH was found to be the more decisive factor in Kf estimation (8 out of 15 relationships). Indeed, Kf is positively correlated to pH so that the more alkaline the soil is, the higher the ratio of total Cu to Cu in the solution is. Soil organic matter (OM) and OC are parameters in the Kf equations less often (4 out of 15 relationships), but, when present, the partial slope for OM or OC is higher than that for pH, which means that a small variation in soil OM content affects more Cu partitioning than a small variation in pH. Three of the four papers concerned found a positive relationship between OM and Kf, while Mondaca et al. (2015) found a negative partial slope for soil OM or dissolved OC (Table 1, Eq. 10b). However, Eq. (12d) was fitted on arid soils from Chile and includes a positive partial slope for the CEC. The CEC value can be viewed as a proxy for the sum of clay and soil OM contents so that the whole partial slope of OM is compensated for in that particular situation.
Table 1Transfer functions reviewed from the literature to estimate partitioning coefficient of Cu. RV stands for response variable, and Int. stands for intercept. Most studies fitted Kf defined as Kf= [Cu]soil [Cu] (in L kg−1), Cusoil or Cu tot (in mg kg−1), DOC (dissolved organic carbon) (in mg L−1), OM (soil organic matter) (in %), and CEC in (cmol kg−1); the standard errors around fitted coefficients are reported when indicated in the original article.
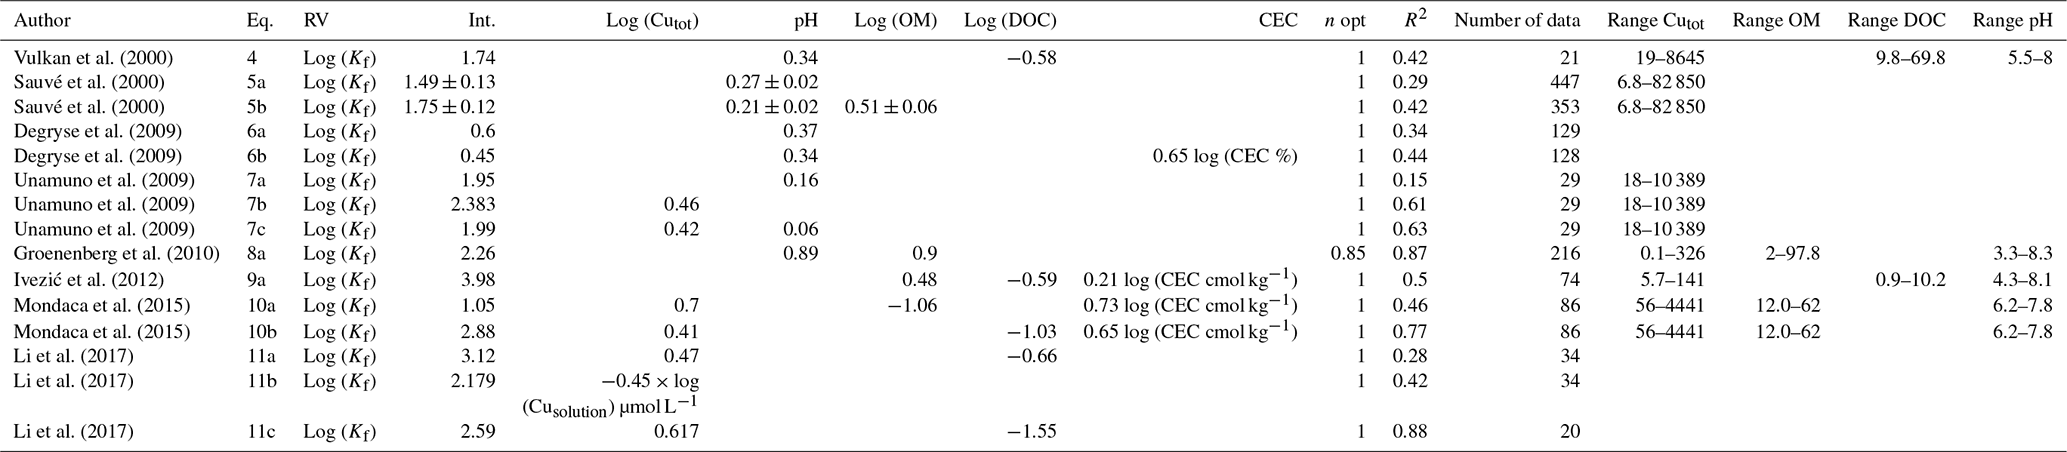
Over the 15 equations, the estimation of Kf according to Sauvé et al. (2000) with Eqs. (5a) or (5b) (Table 1) is the most robust, as determined over a wide range of soils (more than 400 points). The estimations are based on a large gradient of in situ total soil Cu concentrations, even though the highest total soil Cu concentration is higher than what was observed in Europe with the JRC's soil survey (Ballabio et al., 2018). Sauvé et al. (2000) proposed two equations based on a compilation of about 400 data points from long-term contaminated samples. One of the equations considers OM values, whereas the other does not due to a lack of information in the gathered data. Finally, due to the well-known importance of OM for binding with Cu, Eq. (5b) was selected for our application at the Europe scale, and Kf was calculated as follows:
with Kf in liters per kilogram (L kg−1) and with OM being the soil organic matter content calculated as OM = 2 × OC, in accordance with the JRC, following Pribyl (2010).
Kf values display a range of 4600 to 21 500 L kg−1, with a median value of 9829 L kg−1. Kf values below 8000 L kg−1 and above 12 000 L kg−1, respectively, represent low and high anomalies for Kf. On the European scale, a heterogeneous distribution can be seen when using Eq. (5b), as shown in (Fig. 1).
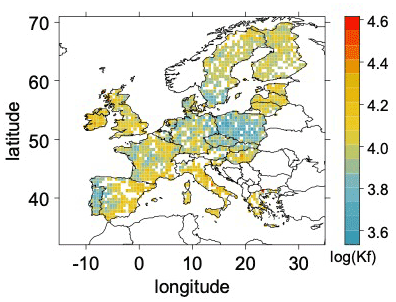
Figure 1Map of log10(Kf) in Europe at 0.5° following Eq. (5b) as applied to soil Cu contents. White pixels correspond to pixels without OC measurements and, consequently, no Kf estimations.
Beyond the administrative borders (e.g., Switzerland and Norway), in certain mountain areas, there is a lack of OC data, which are supplied by the JRC. Cu partitioning in the soil solution is low around the Mediterranean, the UK, and Baltic and Nordic regions, with high Kf (> 12 000 L kg−1). This accounts for 29.9 % of the grid cells, where deposited Cu can thus accumulate in soils. On the contrary, high partitioning of Cu into the soil solution can be found in 20.1 % of the grid cells, where values of Kf are low (< 8000 L kg−1), thus providing soils with a tendency to furnish copper to other ecosystems, depending on the runoff. This occurs, for instance, near Portugal and Poland.
3.2 Modeling potential Cu leaching and accumulation in European soils for the historical period (2001–2005)
Over the two LSMs and the two GCMs, the runoff values during the 2001–2005 period varied between 0 (LPJmL_CM5a and LPJmL_ESM2m) and 5.4 mm d−1 (LPJmL_CM5a). The mean runoff value over the two LSMs and the two GCMs is 1.1 mm d−1 (± 0.1 standard deviations) (data shown in Fig. S1 in the Supplement). For this period, the 1-MAD threshold gives rather similar low and high runoff anomalies between couplings of LSMs and GCMs: below 0.6, 0.6, 0.7, and 0.6 mm d−1 and above 1.3, 1.2, 1.3, and 1.1 mm d−1, respectively, for ORCHIDEE_CM5a, ORCHIDEE_ESM2m, LPJmL_CM5a, and LPJmL_ESM2m. In addition, 21.7 %, 22.1 %, 20.2 %, and 21.1 % of the grid cells constitute low runoff anomalies, and 28.2 %, 27.9 %, 29.8 %, and 28.9 % of the grid cells constitute high runoff anomalies (see Table S1).
Figure 2 represents the LP and AP areas for the 2001–2005 period and for the different combinations of LSMs and GCMs. The number of grid cells with LP and AP areas varied among the LSM and GCM combinations (Fig. 3 with the historical scenario and Table S1). However, spatial patterns are well conserved, with more similarities between the same LSM than between the same GCM. Globally, LP areas are located mostly in northern Portugal, with scattered points around France, Germany, and Scandinavia, while AP areas are mostly found in the southeast of Spain and the southern Adriatic coast of Italy and at scattered points in Hungary. However, with the ORCHIDEE LSM, AP areas in southern Spain are larger, and LP areas in France and eastern Europe are more scattered than with the LPJmL LSM.
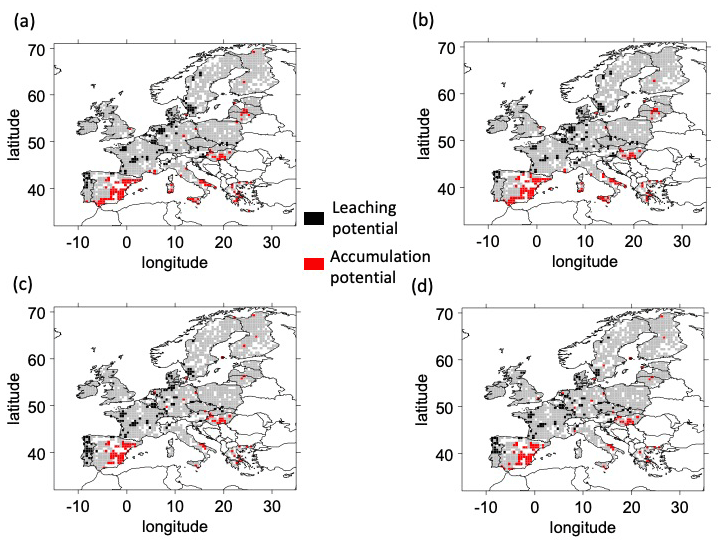
Figure 2Areas of potential for Cu leaching (LP) and accumulation (AP) over the historical (2001–2005) period for the combinations of land surface schemes (ORCHIDEE in a, b; LPJmL in c, d) and climate forcings (CM5a in a, c; ESM2m in b, d). White pixels correspond to pixels without OC measurement and, consequently, no Kf estimations.
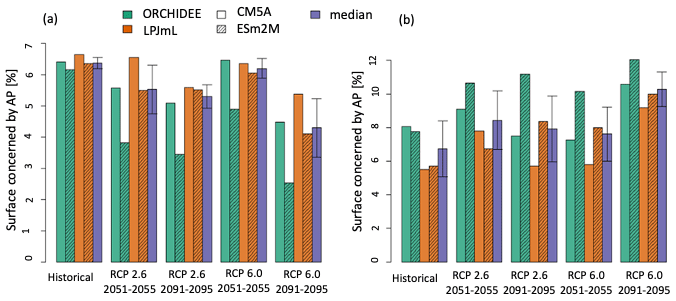
Figure 3Percentage of the grid cells with Cu LP (a) and AP (b) for the different scenarios (historical: 2001–2005, RCP 2.6 horizon 2050 and 2090 and RCP 6.0 horizon 2090). The four combinations of the two LSMs (ORCHIDEE in green and LPJmL in orange) and the two climate forcings (CM5a fill bars and ESM2m dashed bar), as well as the median (purple) of the four models and the median deviations (bar), are plotted.
Over the four combinations of LSMs and GCMs, LP was detected in 6.4 ± 0.1 % (median, median deviation) of the grid cells (Fig. 3a), and AP was detected in 6.7 ± 1.1 % of the grid cells (Fig. 3b). Areas with LP are almost equal between all combinations of LSMs and GCMs, even if ESM2m forcing leads to slightly fewer areas with LP than CM5a. Many more AP areas are predicted by the ORCHIDEE LSM. The LPJmL_CM5a combination has the smallest percentage of grid cells with AP with 5.5 %, while ORCHIDEE_CM5A has the largest percentage with 8.0 % (Fig. 3b).
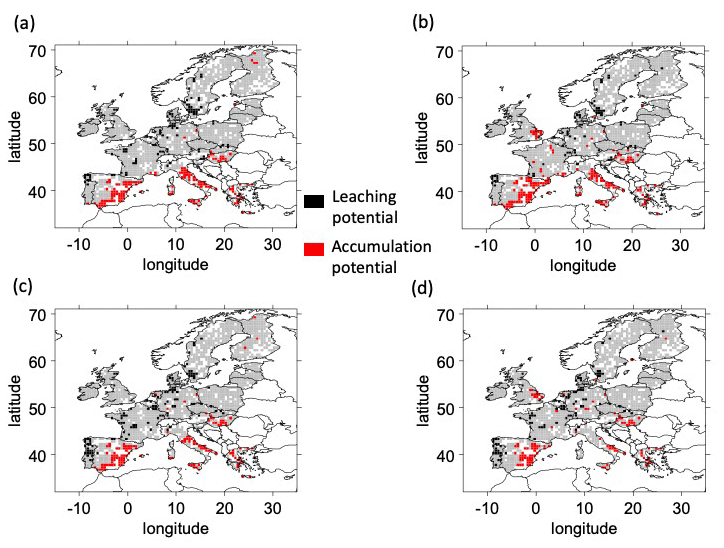
Figure 4Areas of potential for Cu leaching (LP) and accumulation (AP) over the RCP 2.6 2051–2055 period for the different combinations of land surface schemes (ORCHIDEE in a, b; LPJmL in c, d) and climate forcings (CM5a in a, c; ESM2m in b, d). White pixels correspond to pixels without OC measurements and, consequently, no Kf estimations.
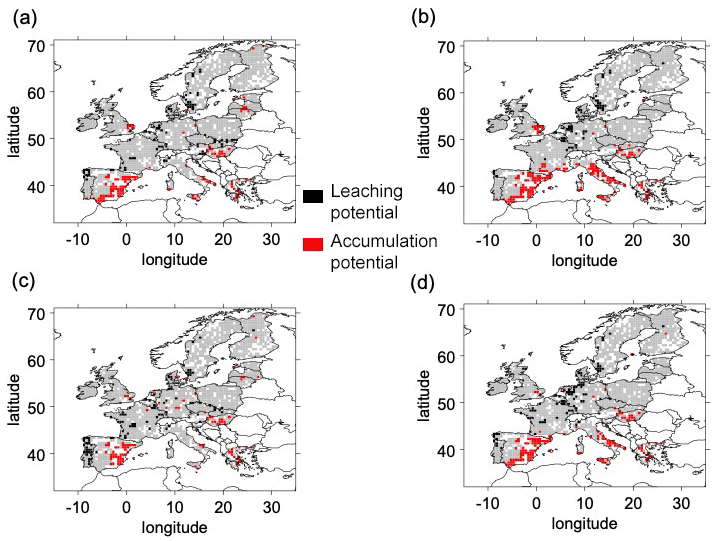
Figure 5Areas of potential for Cu leaching (LP) and accumulation (AP) over the RCP 2.6 2091–2095 period for the different combinations of land surface schemes (ORCHIDEE in a, b; LPJmL in c, d) and climate forcings (CM5a in a, c and ESM2m in b, d). White pixels correspond to pixels without OC measurements and, consequently, no Kf estimations.
3.3 Modeling the changes in the LP areas over the century according to the different RCPs
For the two chosen climate change scenarios, median runoffs per model are expected to increase over the century for the combinations of the two LSMs and the two GCMs. For the 2051–2055 period, predicted runoff is 1.1 ± 0.1 mm d−1 with RCP 2.6 and RCP 6.0 (mean, standard deviation of the two LSMs and the two GCMs over the 5 years) (see Fig. S2 for RCP 2.6 and Fig. S4 for RCP 6.0). For the 2091–2095 period, predicted runoff is also 1.1 ± 0.1 mm d−1 with RCP 2.6 but 1.0 ± 0.1 mm d−1 with RCP 6.0 (mean, standard deviation of the two LSMs and the two GCMs over the 5 years) (Fig. S3 for RCP 2.6 and Fig. S5 for RCP 6.0). Table S1 shows that the number of grid cells defined as high anomalies for runoff tends to decrease by the 2091–2095 period, while the number of grid cells defined as low anomalies for runoff tends to increase. However, tendencies for the 2051–2055 period are variable with, in some cases, an increase or a decrease in percentage in comparison to the previous or subsequent periods (see Table S1). Furthermore, among the different periods of climate change scenarios, the ratio of LP areas (in terms of percentage) over areas of high anomalies for runoff is not constant (see Table S1).
The change in the areas in Europe with LP for the different climate scenarios and the different LSM and GCM combinations over the century is presented (in terms of percentage) in Fig. 3a. Compared to the historical values, and whatever the scenario, the median percentage of grid cells with LP in 2091–2095 decreases by 1.2 ± 0.3 percentage points (median, median deviation) for RCP 2.6 and by 2.1 ± 0.5 percentage points for RCP 6.0. Hence, for the 2091–2095 period, the percentage of surfaces with LP is 5.3 ± 0.3 % (median, median deviation) for RCP 2.6 and 4.3 ± 0.6 % for RCP 6.0. Areas where LP was detected are relatively similar for all the time periods and climate change scenarios and for all LSM and GCM combinations, except for ORCHIDEE_ESM2m, which always predicted the smallest percentage of areas with LP. Indeed, for ORCHIDEE_ESM2m, the percentage of areas with LP is from 59 % (RCP 6.0, 2091–2095) to 79 % (RCP 6.0, 2051–2055) smaller than the median percentage of surfaces with LP (see Fig. 3a).
The change in the LP's median during the century depends on the climate change scenario. With RCP 2.6, the median percentage of grid cells with LP varied more between the historical scenario and the 2051–2055 scenario (−0.8 ± 0.4 percentage points – median, median deviation) than between the 2051–2055 and the 2091–2095 periods (−0.4 ± 0.3 percentage points). On the contrary, with RCP 6.0, the median percentage of grid cells with LP areas decreases less from the historical scenario to the 2051–2055 scenario (−0.3 ± 0.2 percentage points – median, median deviation) than between the 2051–2055 and 2091–2095 periods (−2.0 ± 0.2 percentage points); see Fig. 3a. Furthermore, with RCP 2.6, estimations indicate that 5.5 ± 0.5 % of the grid cells demonstrate LP in 2051–2055, while this increases to 6.2 ± 0.2 % with RCP 6.0, which is similar to the 2001–2005 estimate.
For all LSM and GCM combinations and the two RCPs, LP areas are mostly detected in Portugal, northern Germany, and Scandinavia. In terms of LP risks, the combinations of GCMs and climate change scenarios mostly affect the quantity of dispersed spots in eastern Europe and in the southern regions of Portugal. By 2050, the decrease in LP areas is mostly located in the center of France, south of Portugal, and north of Germany (Fig. 4 for RCP 2.6 and Fig. 6 for RCP 6.0). By 2090, the decrease in LP areas is mostly located in the south of Portugal (Fig. 5 for RCP 2.6 and Fig. 7 for RCP 6.0).
3.4 Modeling the changes in the AP areas over the century according to the different RCPs
The change in the AP areas in Europe with the different climate scenarios and the different LSM and GCM combinations over the century is presented (in terms of percentage) in Fig. 3b. For the 2091–2095 period and for the two climate change scenarios, the percentage of grid cells in which AP is detected increases for all LSM and GCM combinations, except for ORCHIDEE_CM5a with RCP 2.6. AP area increases are highly variable between combinations of LSMs and GCMs, with a smaller increase between the historical period and 2091–2095 for RCP 2.6 than for RCP 6.0.
With RCP 2.6 and for all combinations of LSMs and GCMs, the percentage of grid cells where AP is detected increases between the historical scenario and the 2051–2055 period. Between 2051–2055 and 2091–2095, the percentage of grid cells where AP is detected increases for LSMs_ESM2m and decreases for LSMs_CM5a (see Fig. 3b).
With RCP 6.0, the percentage of areas where AP is detected increases for all LSM × GCM except with ORCHIDEE_CM5a between the historical period and the 2051–2055 period, and for all LSM × GCM combinations between the 2051–2055 and the 2091–2095 period.
For all LSM and GCM combinations and the two RCPs, AP areas are found in Sicily, eastern Europe, and southern Spain. However, the density and extent of the AP areas in these regions varied between LSM and GCM combinations and climate change scenarios (Figs. 4 and 5 for RCP 2.6 for the 2051–2055 and 2091–2095 periods, respectively, and Figs. 6 and 7 for RCP 6.0 for the 20510–2055 and 2091–2095 periods, respectively). Over the century, we found new AP areas in eastern Europe and Greece.
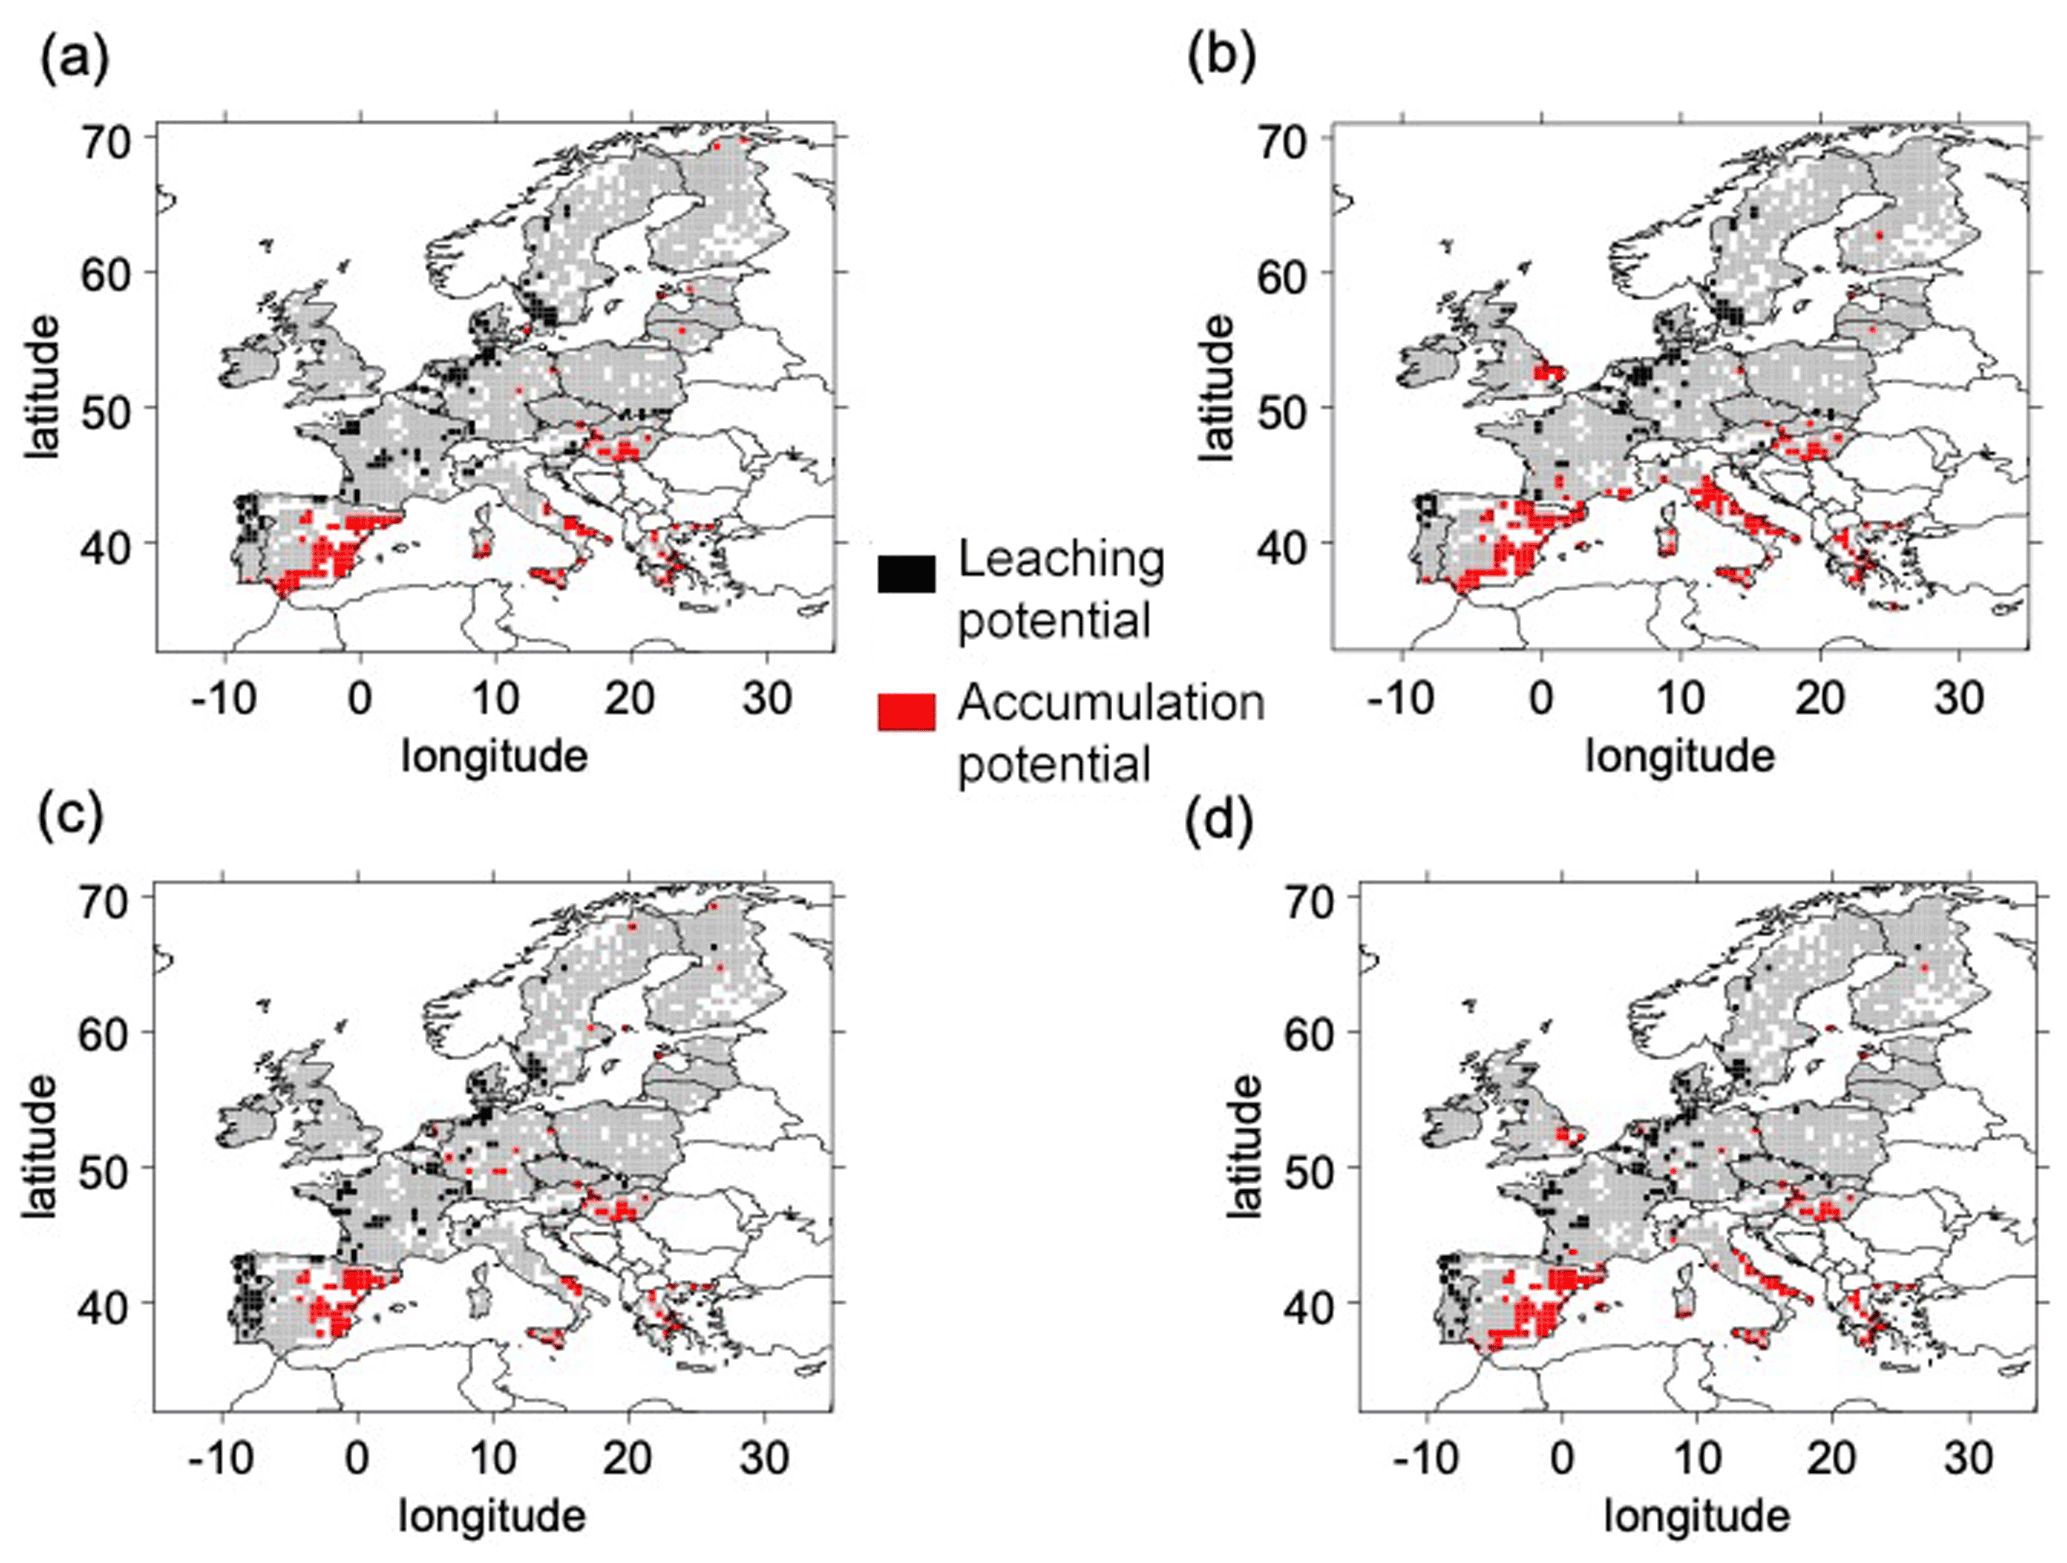
Figure 6Area of potential of leaching (LP) and accumulation (AP) over the RCP 6.0 2051–2055 period for the different combinations of land surface schemes (ORCHIDEE in a, b; LPJmL in c, d) and climate forcings (CM5a in a, c; ESM2m in b, d). White pixels correspond to pixels without OC measurements and, consequently, no Kf estimations.
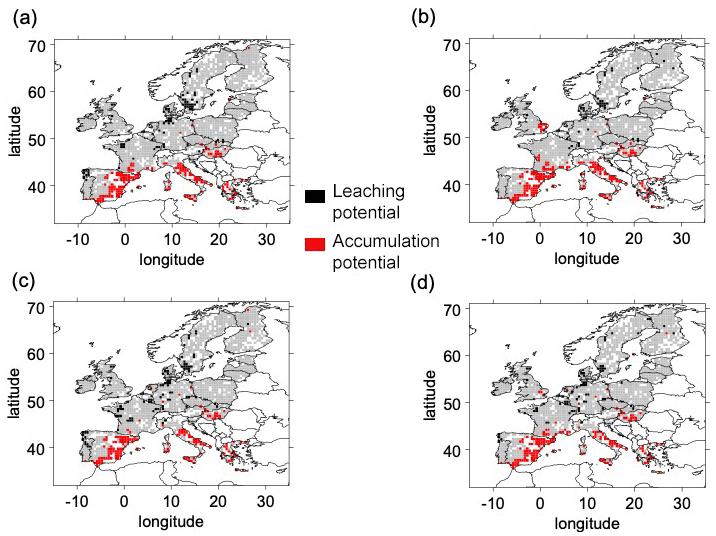
Figure 7Areas of Cu potential for leaching (LP) and accumulation (AP) over the RCP 6.0 2091–2095 period for the different combinations of land surface schemes (ORCHIDEE in a, b; LPJmL in c, d) and climate forcings (CM5a in a, c; ESM2m in b, d). White pixels correspond to pixels without OC measurements and, consequently, no Kf estimations.
Finally, over all LSM and GCM combinations and climate change scenarios, the extent of areas presenting LP and AP in each region depends on GCM rather than on LSM, with more similarities between ORCHIDEE_GCM (panels a and b in Figs. 2, 4, 5, 6, and 7) and LPJmL_GCM (panels c and d in Figs. 2, 4, 5, 6, and 7) than between LSM_CM5a (panels a and c in Figs. 2, 4, 5, 6, and 7) and LSM_ESM2m (panels b and d in Figs. 2, 4, 5, 6, and 7).
4.1 Modeling soil copper release or storage with time for contaminated soils
This study aims to identify potential leaching areas for Cu over Europe in order to identify locations where soil may play a role in the Cu transfer from soil to aquatic ecosystems. To estimate the proportion of Cu reaching the soil solution, we chose to focus on the partitioning coefficient, which was calculated based on soil properties (pH and OM here) other than total soil Cu. This specific choice of the Kf coefficient rather than considering only the soil total Cu contents was made because Cu in the solution is not strictly correlated with total Cu or with other single soil properties such as pH and soil OM, which are both known to affect Cu partitioning and mobility. Thus, taking into account the variability of soil properties at the European scale, the spatial distribution of Cu in the solution was shown to be different from the spatial distribution of total Cu (Sereni et al., 2022). However, data on Cu in the solution at large scales are not available, making the direct estimation of transport within the soil solution and of AP or LP areas without using the Kf impossible. Finally, the use of the partitioning coefficient allowed us to estimate risk areas without considering total soil Cu temporal variability and with the hypothesis that pedological soil characteristics will not change at the timescale studied. This is a strong implicit assumption, but it is needed at this stage. Indeed, even though some soil OM projections are available (Varney et al., 2022), to our knowledge, future projections of pH values at the European scale due to climate change are not available, limiting our capacity to calculate a time-dependent Kf. In particular, there are large uncertainties about the C stocks that may change as a result of climate change and dedicated policies for increasing the C stocks (Bruni et al., 2022). Besides, organic fertilizers applied to increase C stocks can change both pH and soil Cu content, leading to supplementary uncertainties (Laurent et al., 2020). Furthermore, together with rainfall and soil moisture changes, climate change is expected to also induce higher temperatures and shorter winters so that a shift in cultures toward the north is expected (Hannah et al., 2013). Therefore, areas with currently low total soil Cu levels may potentially experience a rise in Cu inputs from fungicides, which may subsequently be transported through freshwater systems. Thus, the estimations of LP and AP as computed here can be used to identify regions about to leach or accumulate high amounts of Cu and to anticipate total content modifications that could occur with an eventual change in anthropogenic activities. Indeed, land management changes due to land use changes or regulation changes may affect the use of Cu in agriculture in the future, with potential consequences for Cu leaching.
As a first step, the study conducted here could be used to highlight areas needing regulations to lower Cu input thresholds. Indeed, the changes in the LP (and AP) areas we noticed are not only the reflection of the general runoff change or of the current Cu risk but also underline areas of interest when combining risks linked to soil contamination and climate change. For instance, in eastern Europe, low Kf and high runoff result in Cu LP areas with soils that tend to transfer Cu from soils to the other ecosystems. However, in these cases, low amounts of total soil Cu contents (Ballabio et al., 2018) limit the amount of Cu exports. In parallel, in Italy, we found high-AP areas whatever the LSM and GCM combination and whatever the RCP for at least one period for each RCP examined. In these vineyard regions (Abruzo and Marche regions), annual Cu inputs are high, resulting in Cu accumulation in soil surface horizons. These high total Cu concentrations could further enter the food web (García-Esparza et al., 2006) or be exported with soil particles (Imfeld et al., 2020) due to rain erosion (El Azzi et al., 2013). Highly erosive storm events predicted to increase during the next decades in Europe are another risk factor for freshwater contamination, even in AP areas, but are often very punctual and local. Hence, to go further, localization of areas with exogenous risks of Cu dissemination must be identified to reinforce the predictions, e.g., by coupling studies of leaching potential, such as the one we conducted here, with erosion risk studies (Panagos et al., 2021) and with outlet characteristics.
4.2 Temporal change in data and scope of the modeling analysis
To reduce intra- and inter-annual variability, the modeling conducted here focused on 5-year means and thus aimed to smooth the seasonal variability of runoff. The Kf we calculated was not a dynamic value since we did not make hypotheses about the temporal change in soil organic carbon or pH. Furthermore, Kf is defined on the assumption that there is equilibrium between the solid and solution phases. This means that the amount of Cu in the solution estimated by this method may be less than that present immediately after Cu application and before equilibrium is reached (McBride et al., 1997). Nevertheless, our results showed good agreement between the four LSM and GCM combinations in terms of their projection of the number of grid cells where both LP and AP are detected, validating the use of their median to perform projections in the absence of in situ validation.
It must be noted that the scope of our predictions has limits that relate to the difficulties in predicting whether rain- and snowfall and runoff will evolve in terms of intensity and frequency. It has already been identified that, during high-load events, much more Cu was transported in the solution than during light events (Imfeld et al., 2020), but alternations between drying and rewetting events may also affect Cu partitioning between phases (Christensen and Christensen, 2003; Han et al., 2001). Also, to gain field reality at the local scale (here, up to 50 km), such as in landscapes or catchments, modeling will require accounting for the time periods of the year with higher rain- and snowfall amounts coinciding with periods of Cu use, for instance, in agriculture and vineyards (Ribolzi et al., 2002; Banas et al., 2010). Indeed, if intense rainfall occurs close to Cu fungicide applications, a larger Cu amount than what is locally computed, taking into account total Cu and Kf, may be exported through runoff (Ma et al., 2006b, a). Thus, local soil Cu budgets require the use of temporal models which account for the regular inputs and outputs of Cu from vegetation and runoff that cannot be accounting for with multi-year means. Finally, the identification of the areas with high risks of soil Cu leaching or accumulation can be viewed as a first step toward the risk change assessment of Cu contamination that would be useful for land management or Cu fertilizer application regulations.
Our approach to assessing European areas with the potential to accumulate or leach copper from soils was not straightforward but included several steps. We focused first on the methods to calculate Cu partitioning. By reviewing existing Cu Kf equations, we pointed out that pH and soil OM contents are important determinants and that, more precisely, the OM partial effect was larger than that of the pH. Then, using the European maps of soil characteristic data, we computed the map of Kf at a scale of 0.5°, highlighting areas with a high risk of leaching or accumulating Cu for a given soil. The estimation of LP and AP areas for current and future soil runoffs under two RCPs with couplings of two GCMs and two LSMs was thereafter performed by comparing anomalies for both Kf and runoffs. Hence, we provided a new method to emphasize, at the regional scale, the combined risk of both climate change and contamination. We pointed out that, despite similar projections for the end of the 21st century, the trend during the century depends on the climate change scenario. For the historical period (2001–2005), our study showed comparable numbers of grid cells where either LP or AP is detected (between [6.2 %–6.4 %] and between [5.5 %–8.0 %], respectively). During the century, AP areas were found to increase for all the LSM and GCM combinations and for the two RCPs. On the contrary, for the two RCPs and three of the four LSM GCM combinations, LP areas were found to decrease during the century compared to the current estimation. Surprisingly, the total number of grid cells where AP and LP are detected in 2091–2095 is estimated to be between 13.2 ± 1.3 % (RCP 2.6) and 14.6 ± 1.3 % (RCP 6.0). However, this was due to opposite trends in the change of LP areas that decrease and AP areas that increase during the century. We highlighted the areas of particular risk for the application of Cu, emphasizing the necessity of precise monitoring in Cu application in these areas. Future studies would make gains in precision by taking into account the change in the partitioning coefficient with soil change or different scenarios of Cu application, taking into account the various forms (e.g., mineral or organic fungicides).
The code can be provided upon request.
The data can be provided upon request. Soil data are available from ESDAC (Panagos et al., 2022; https://esdac.jrc.ec.europa.eu/, ESDAC – European Commission, 2024), and runoff data are available from ISIMIP (https://www.isimip.org/, The Inter-Sectoral Impact Model Intercomparison Project, 2021).
The supplement related to this article is available online at: https://doi.org/10.5194/soil-10-367-2024-supplement.
LS: methodology, formal analysis, data processing, writing – original draft. JMP: formal analysis, initial data processing, writing – original draft. IL: methodology conceptualization, writing – review and editing, supervision, funding acquisition. BG: methodology, conceptualization, writing – review and editing, supervision, project administration.
The contact author has declared that none of the authors has any competing interests.
Publisher’s note: Copernicus Publications remains neutral with regard to jurisdictional claims made in the text, published maps, institutional affiliations, or any other geographical representation in this paper. While Copernicus Publications makes every effort to include appropriate place names, the final responsibility lies with the authors.
Parts of this study were financially supported by the Labex BASC through the Connexion project. Laura Sereni thanks the Ecole Normale Supérieure (ENS) for funding her PhD. The authors thank Nathalie de Noblet-Ducoudré for the valuable discussions regarding this paper.
This research has been supported by the Agence Nationale de la Recherche (grant no. ANR-11-LABX-0034). This work is part of the ALAMOD project of the exploratory research program FairCarboN and received government funding managed by the Agence Nationale de la Recherche under the France 2030 program, reference ANR-22-PEXF-002-projet ALAMOD.
This paper was edited by Olivier Evrard and reviewed by two anonymous referees.
Babcsányi, I., Chabaux, F., Granet, M., Meite, F., Payraudeau, S., Duplay, J., and Imfeld, G.: Copper in soil fractions and runoff in a vineyard catchment: Insights from copper stable isotopes, Sci. Total Environ., 557/558, 154–162, https://doi.org/10.1016/j.scitotenv.2016.03.037, 2016.
Ballabio, C., Panagos, P., and Monatanarella, L.: Mapping topsoil physical properties at European scale using the LUCAS database, Geoderma, 261, 110–123, https://doi.org/10.1016/j.geoderma.2015.07.006, 2016.
Ballabio, C., Panagos, P., Lugato, E., Huang, J. H., Orgiazzi, A., Jones, A., Fernández-Ugalde, O., Borrelli, P., and Montanarella, L.: Copper distribution in European topsoils: An assessment based on LUCAS soil survey, Sci. Total Environ., 636, 282–298, https://doi.org/10.1016/j.scitotenv.2018.04.268, 2018.
Banas, D., Marin, B., Skraber, S., Chopin, E. I. B., and Zanella, A.: Copper mobilization affected by weather conditions in a stormwater detention system receiving runoff waters from vineyard soils (Champagne, France), Environ. Pollut., 158, 476–482, https://doi.org/10.1016/j.envpol.2009.08.034, 2010.
Broos, K., Warne, M. S. J., Heemsbergen, D. A., Stevens, D., Barnes, M. B., Correll, R. L., and McLaughlin, M. J.: Soil factors controlling the toxicity of copper and zinc to microbial processes in Australian soils, Environ. Toxicol. Chem., 26, 583–590, https://doi.org/10.1897/06-302R.1, 2007.
Bruni, E., Chenu, C., Abramoff, R. Z., Baldoni, G., Barkusky, D., Clivot, H., Huang, Y., Kätterer, T., Pikuła, D., Spiegel, H., Virto, I., and Guenet, B.: Multi-modelling predictions show high uncertainty of required carbon input changes to reach a 4 ‰ target, Eur. J. Soil Sci., 73, e13330, https://doi.org/10.1111/ejss.13330, 2022.
Christensen, J. H. and Christensen, O. B.: Severe summertime flooding in Europe, Nature, 421, 805–806, https://doi.org/10.1038/421805a, 2003.
Chu, H., Wei, J., Qiu, J., Li, Q., and Wang, G.: Identification of the impact of climate change and human activities on rainfall-runoff relationship variation in the Three-River Headwaters region, Ecol. Indic., 106, 105516, https://doi.org/10.1016/j.ecolind.2019.105516, 2019.
de Brogniez, D., Ballabio, C., Stevens, A., Jones, R. J. A., Montanarella, L., and van Wesemael, B.: A map of the topsoil organic carbon content of Europe generated by a generalized additive model, Eur. J. Soil Sci., 66, 121–134, https://doi.org/10.1111/ejss.12193, 2015.
Degryse, F., Smolders, E., and Parker, D. R.: Partitioning of metals (Cd, Co, Cu, Ni, Pb, Zn) in soils: concepts, methodologies, prediction and applications – a review, Eur. J. Soil Sci., 60, 590–612, https://doi.org/10.1111/j.1365-2389.2009.01142.x, 2009.
Douville, H., Raghavan, K., Renwick, J., Allan, R. P., Arias, P. A., Barlow, M., Cerezo-Mota, R., Cherchi, T., Gan, A. Y., Gergis, J., Jiang, D., Khan, A., Pokam Mba, W., Rosenfeld, D., Tierney, J., and Zolina, O.: Climate Change 2021: The Physical Science Basis, Contribution of Working Group I to the Sixth Assessment Report of the Intergovernmental Panel on Climate Change, in: Fundamental and Applied Climatology, Vol. 2, edited by: Masson-Delmotte, V., Zhai, P., Pirani, A., Connors, S. L., Péan, C., Berger, S., Caud, N., Chen, Y., Goldfarb, L., Gomis, M. I., Huang, M., Leitzell, K., Lonnoy, E., Matthews, J. B. R., Maycock, T. K., Waterfield, T., Yelekçi, O., Yu, R., and Zhou, B., Cambride Universitary Press, 13–25, https://doi.org/10.21513/2410-8758-2017-2-13-25, 2021.
Dufresne, J. L., Foujols, M. A., Denvil, S., Caubel, A., Marti, O., Aumont, O., Balkanski, Y., Bekki, S., Bellenger, H., Benshila, R., Bony, S., Bopp, L., Braconnot, P., Brockmann, P., Cadule, P., Cheruy, F., Codron, F., Cozic, A., Cugnet, D., de Noblet, N., Duvel, J. P., Ethé, C., Fairhead, L., Fichefet, T., Flavoni, S., Friedlingstein, P., Grandpeix, J. Y., Guez, L., Guilyardi, E., Hauglustaine, D., Hourdin, F., Idelkadi, A., Ghattas, J., Joussaume, S., Kageyama, M., Krinner, G., Labetoulle, S., Lahellec, A., Lefebvre, M. P., Lefevre, F., Levy, C., Li, Z. X., Lloyd, J., Lott, F., Madec, G., Mancip, M., Marchand, M., Masson, S., Meurdesoif, Y., Mignot, J., Musat, I., Parouty, S., Polcher, J., Rio, C., Schulz, M., Swingedouw, D., Szopa, S., Talandier, C., Terray, P., Viovy, N., and Vuichard, N.: Climate change projections using the IPSL-CM5 Earth System Model: From CMIP3 to CMIP5, Clim. Dynam., 40, 2123–2165, https://doi.org/10.1007/s00382-012-1636-1, 2013.
Dunne, J. P., John, J. G., Adcroft, A. J., Griffies, S. M., Hallberg, R. W., Shevliakova, E., Stouffer, R. J., Cooke, W., Dunne, K. A., Harrison, M. J., Krasting, J. P., Malyshev, S. L., Milly, P. C. D., Phillipps, P. J., Sentman, L. T., Samuels, B. L., Spelman, M. J., Winton, M., Wittenberg, A. T., and Zadeh, N.: GFDL's ESM2 global coupled climate-carbon earth system models, Part I: Physical formulation and baseline simulation characteristics, J. Clim., 25, 6646–6665, https://doi.org/10.1175/JCLI-D-11-00560.1, 2012.
El Azzi, D., Viers, J., Guiresse, M., Probst, A., Aubert, D., Caparros, J., Charles, F., Guizien, K., and Probst, J. L.: Origin and fate of copper in a small Mediterranean vineyard catchment: New insights from combined chemical extraction and δ65Cu isotopic composition, Sci. Total Environ., 463/464, 91–101, https://doi.org/10.1016/j.scitotenv.2013.05.058, 2013.
Elzinga, E. J., Van Grinsven, J. J. M., and Swartjes, F. A.: General purpose Freundlich isotherms for cadmium, copper and zinc in soils, Eur. J. Soil Sci., 50, 139–149, https://doi.org/10.1046/j.1365-2389.1999.00220.x, 1999.
ESDAC – European Commission: European Commission [data set], https://esdac.jrc.ec.europa.eu/, last access: 1 June 2024.
Flemming, C. A. and Trevors, J. T.: Copper toxicity and chemistry in the environment: a review, Water Air Soil Pollut., 44, 143–158, https://doi.org/10.1007/BF00228784, 1989.
Frieler, K., Lange, S., Piontek, F., Reyer, C. P. O., Schewe, J., Warszawski, L., Zhao, F., Chini, L., Denvil, S., Emanuel, K., Geiger, T., Halladay, K., Hurtt, G., Mengel, M., Murakami, D., Ostberg, S., Popp, A., Riva, R., Stevanovic, M., Suzuki, T., Volkholz, J., Burke, E., Ciais, P., Ebi, K., Eddy, T. D., Elliott, J., Galbraith, E., Gosling, S. N., Hattermann, F., Hickler, T., Hinkel, J., Hof, C., Huber, V., Jägermeyr, J., Krysanova, V., Marcé, R., Müller Schmied, H., Mouratiadou, I., Pierson, D., Tittensor, D. P., Vautard, R., van Vliet, M., Biber, M. F., Betts, R. A., Bodirsky, B. L., Deryng, D., Frolking, S., Jones, C. D., Lotze, H. K., Lotze-Campen, H., Sahajpal, R., Thonicke, K., Tian, H., and Yamagata, Y.: Assessing the impacts of 1.5 °C global warming – simulation protocol of the Inter-Sectoral Impact Model Intercomparison Project (ISIMIP2b), Geosci. Model Dev., 10, 4321–4345, https://doi.org/10.5194/gmd-10-4321-2017, 2017.
García-Esparza, M. A., Capri, E., Pirzadeh, P., and Trevisan, M.: Copper content of grape and wine from Italian farms, Food Addit. Contam., 23, 274–280, https://doi.org/10.1080/02652030500429117, 2006.
Giller, K. E., Witter, E., and Mcgrath, S. P.: Toxicity of heavy metals to microorganisms and microbial processes in agricultural soils: A review, Soil Biol. Biochem., 30, 1389–1414, https://doi.org/10.1016/S0038-0717(97)00270-8, 1998.
Groenenberg, J. E., Römkens, P. F. A. M., Comans, R. N. J., Luster, J., Pampura, T., Shotbolt, L., Tipping, E., and De Vries, W.: Transfer functions for solid-solution partitioning of cadmium, copper, nickel, lead and zinc in soils: Derivation of relationships for free metal ion activities and validation with independent data, Eur. J. Soil Sci., 61, 58–73, https://doi.org/10.1111/j.1365-2389.2009.01201.x, 2010.
Han, F. X., Banin, A., and Triplett, G. B.: Redistribution of heavy metals in arid-zone soils under a wetting-drying cycle soil moisture regime, Soil Sci., 166, 18–28, https://doi.org/10.1097/00010694-200101000-00005, 2001.
Hannah, L., Roehrdanz, P. R., Ikegami, M., Shepard, A. V., Shaw, M. R., Tabor, G., Zhi, L., Marquet, P. A., and Hijmans, R. J.: Climate change, wine, and conservation, P. Natl. Acad. Sci. USA, 110, 6907–6912, https://doi.org/10.1073/pnas.1210127110, 2013.
Imfeld, G., Meite, F., Wiegert, C., Guyot, B., Masbou, J., and Payraudeau, S.: Do rainfall characteristics affect the export of copper, zinc and synthetic pesticides in surface runoff from headwater catchments?, Sci. Total Environ., 741, 140437, https://doi.org/10.1016/j.scitotenv.2020.140437, 2020.
Ivezić, V., Almås, Å. R., and Singh, B. R.: Predicting the solubility of Cd, Cu, Pb and Zn in uncontaminated Croatian soils under different land uses by applying established regression models, Geoderma, 170, 89–95, https://doi.org/10.1016/j.geoderma.2011.11.024, 2012.
Klein Goldewijk, K., Beusen, A., Doelman, J., and Stehfest, E.: Anthropogenic land use estimates for the Holocene – HYDE 3.2, Earth Syst. Sci. Data, 9, 927–953, https://doi.org/10.5194/essd-9-927-2017, 2017.
Komárek, M., Čadková, E., Chrastný, V., Bordas, F., and Bollinger, J. C.: Contamination of vineyard soils with fungicides: A review of environmental and toxicological aspects, Environ. Int., 36, 138–151, https://doi.org/10.1016/j.envint.2009.10.005, 2010.
Krinner, G., Viovy, N., de Noblet-Ducoudré, N., Ogée, J., Polcher, J., Friedlingstein, P., Ciais, P., Sitch, S., and Prentice, I. C.: A dynamic global vegetation model for studies of the coupled atmosphere-biosphere system, Global Biogeochem. Cy., 19, GB1015, https://doi.org/10.1029/2003GB002199, 2005.
Lange, S.: EartH2Observe, WFDEI and ERA-Interim data Merged and Bias-corrected for ISIMIP (EWEMBI), GFZ Data Services, https://doi.org/10.5880/pik.2016.004, 2016.
Laurent, C., Bravin, M. N., Crouzet, O., Pelosi, C., Tillard, E., Lecomte, P., and Lamy, I.: Increased soil pH and dissolved organic matter after a decade of organic fertilizer application mitigates copper and zinc availability despite contamination, Sci. Total Environ., 709, 135927, https://doi.org/10.1016/j.scitotenv.2019.135927, 2020.
Li, B., Ma, Y., and Yang, J.: Is the computed speciation of copper in a wide range of Chinese soils reliable?, Chem. Spec. Bioavailab., 29, 205–215, https://doi.org/10.1080/09542299.2017.1404437, 2017.
Ma, Y., Lombi, E., Oliver, I. W., Nolan, A. L., and McLaughlin, M. J.: Long-term aging of copper added to soils, Environ. Sci. Technol., 40, 6310–6317, https://doi.org/10.1021/es060306r, 2006a.
Ma, Y., Lombi, E., Nolan, A. L., and McLaughlin, M. J.: Short-term natural attenuation of copper in soils: Effects of time, temperature, and soil characteristics, Environ. Toxicol. Chem., 25, 652–658, https://doi.org/10.1897/04-601R.1, 2006b.
McBride, M., Sauvé, S., and Hendershot, W.: Solubility control of Cu, Zn, Cd and Pb in contaminated soils, Eur. J. Soil Sci., 48, 337–346, https://doi.org/10.1111/j.1365-2389.1997.tb00554.x, 1997.
Mimikou, M. A., Baltas, E., Varanou, E., and Pantazis, K.: Regional impacts of climate change on water resources quantity and quality indicators, J. Hydrol., 234, 95–109, https://doi.org/10.1016/S0022-1694(00)00244-4, 2000.
Mondaca, P., Neaman, A., Sauvé, S., Salgado, E., and Bravo, M.: Solubility, partitioning, and activity of copper-contaminated soils in a semiarid region, J. Plant Nutr. Soil Sc., 178, 452–459, https://doi.org/10.1002/jpln.201400349, 2015.
Noll, M. R.: Trace Elements in Terrestrial Environments, J. Environ. Qual., 32, 374–374, https://doi.org/10.2134/jeq2002.3740, 2003.
Panagos, P., Van Liedekerke, M., Jones, A., and Montanarella, L.: European Soil Data Centre: Response to European policy support and public data requirements, Land Use Policy, 29, 329–338, https://doi.org/10.1016/j.landusepol.2011.07.003, 2012.
Panagos, P., Ballabio, C., Himics, M., Scarpa, S., Matthews, F., Bogonos, M., Poesen, J., and Borrelli, P.: Projections of soil loss by water erosion in Europe by 2050, Environ. Sci. Policy, 124, 380–392, https://doi.org/10.1016/j.envsci.2021.07.012, 2021.
Panagos, P., Van Liedekerke, M., Borrelli, P., Köninger, J., Ballabio, C., Orgiazzi, A., Lugato, E., Liakos, L., Hervas, J., Jones, A., and Montanarella, L.: European Soil Data Centre 2.0: Soil data and knowledge in support of the EU, Eur. J. Soil Sci., 73, e13315, https://doi.org/10.1111/ejss.13315, 2022.
Pribyl, D. W.: A critical review of the conventional SOC to SOM conversion factor, Geoderma, 156, 75–83, https://doi.org/10.1016/j.geoderma.2010.02.003, 2010.
R Core Team: R core team: R: A language and environment for statistical computing. R Foundation for Statistical Computing, Vienna, Austria, http://www.R-project.org (last access: 18 November 2021), ISBN 3-900051-07-0, 2021.
Ribolzi, O., Valles, V., Gomez, L., and Voltz, M.: Speciation and origin of particulate copper in runoff water from a Mediterranean vineyard catchment, Environ. Pollut., 117, 261–271, https://doi.org/10.1016/S0269-7491(01)00274-3, 2002.
Rooney, C. P., Zhao, F. J., and McGrath, S. P.: Soil factors controlling the expression of copper toxicity to plants in a wide range of European soils, Environ. Toxicol. Chem., 25, 726–732, https://doi.org/10.1897/04-602R.1, 2006.
Salminen, R. and Gregorauskiene, V.: Considerations regarding the definition of a geochemical baseline of elements in the surficial materials in areas differing in basic geology, Appl. Geochem., 15, 647–653, https://doi.org/10.1016/S0883-2927(99)00077-3, 2000.
Sauvé, S., Hendershot, W., and Herbert E., A.: Solid-Solution Partitioning of Metals in Contaminated Soils: Dependence on pH, Total Metal Burden, and Organic Matter, Am. Chem. Soc., 34, 1125–1131, https://doi.org/10.1021/es9907764, 2000.
Schulzweida, U.: CDO User Guide, Zenodo, https://doi.org/10.5281/zenodo.2558193, 2019.
Sereni, L., Guenet, B., and Lamy, I.: Mapping risks associated with soil copper contamination using availability and bio-availability proxies at the European scale, Environ. Sci. Pollut. R., 30, 19828–19844, https://doi.org/10.1007/s11356-022-23046-0, 2022.
Sitch, S., Smith, B., Prentice, I. C., Arneth, A., Bondeau, A., Cramer, W., Kaplan, J. O., Levis, S., Lucht, W., Sykes, M. T., Thonicke, K., and Venevsky, S.: Evaluation of ecosystem dynamics, plant geography and terrestrial carbon cycling in the LPJ dynamic global vegetation model, Glob. Change Biol., 9, 161–185, https://doi.org/10.1046/j.1365-2486.2003.00569.x, 2003.
The Inter-Sectoral Impact Model Intercomparison Project: Intersectoral Impact Model Intercomparison Project [data set], https://www.isimip.org/, last access: 28 May 2021.
Unamuno, V. I. R., Meers, E., Du Laing, G., and Tack, F. M. G.: Effect of physicochemical soil characteristics on copper and lead solubility in polluted and unpolluted soils, Soil Sci., 174, 601–610, https://doi.org/10.1097/SS.0b013e3181bf2f52, 2009.
van Vuuren, D. P., Edmonds, J., Kainuma, M., Riahi, K., Thomson, A., Hibbard, K., Hurtt, G. C., Kram, T., Krey, V., Lamarque, J. F., Masui, T., Meinshausen, M., Nakicenovic, N., Smith, S. J., and Rose, S. K.: The representative concentration pathways: An overview, Climatic Change, 109, 5–31, https://doi.org/10.1007/s10584-011-0148-z, 2011.
Varney, R. M., Chadburn, S. E., Burke, E. J., and Cox, P. M.: Evaluation of soil carbon simulation in CMIP6 Earth system models, Biogeosciences, 19, 4671–4704, https://doi.org/10.5194/bg-19-4671-2022, 2022.
Vidal, M., Santos, M. J., Abrão, T., Rodríguez, J., and Rigol, A.: Modeling competitive metal sorption in a mineral soil, Geoderma, 149, 189–198, https://doi.org/10.1016/j.geoderma.2008.11.040, 2009.
Vulkan, R., Zhao, F. J., Barbosa-Jefferson, V., Preston, S., Paton, G. I., Tipping, E., and McGrath, S. P.: Copper speciation and impacts on bacterial biosensors in the pore water of copper-contaminated soils, Environ. Sci. Technol., 34, 5115–5121, https://doi.org/10.1021/es0000910, 2000.
West, T. S. and Coombs, T. L.: Soil as the Source of Trace Elements [and Discussion], Philos. T. R. Soc. Lond. Ser. B, 294, 19–39, 1981.