the Creative Commons Attribution 4.0 License.
the Creative Commons Attribution 4.0 License.
 | 15 Jan 2024
Combining lime and organic amendments based on titratable alkalinity for efficient amelioration of acidic soils
Birhanu Iticha
Luke M. Mosley
Petra Marschner
Ameliorating soil acidity using a combination of lime and organic amendments (OAs) can be an alternative to lime alone, but determining the appropriate OA rates can be difficult. We developed a new method for calculating the combined application rate of lime and OAs (wheat straw, faba bean straw, blended poultry litter, biochar, and compost) that is based on the titratable alkalinity of OAs and the equilibrium lime buffer capacity (LBCeq) of acidic soils. The effect of calculated soil amendment rates on soil pH was validated at soil water contents of 60 %, 100 %, and 150 % of field capacity (FC). The soil used to develop and validate the method was a sandy loam with a soil pH in deionised water (pHW) of 4.84 and a soil pH in 0.01 M CaCl2 solution (pHCa) of 4.21. The LBCeq of the soil was 1657 mg CaCO3 kg−1 pH−1 (where “CaCO3 kg−1 pH−1” denotes the amount of lime required to raise the pH of 1 kg of soil by one unit). The titratable alkalinity of the OAs ranged from 11.7 cmol H kg−1 for wheat straw to 357 cmol H kg−1 for compost. At 60 % FC, faba bean and wheat straw amendment increased the soil pHW to 6.48 and 6.42, respectively, but lower pH values were reached in soil amended with less biodegradable or resistant OAs (ROAs) (i.e. blended poultry litter, biochar, and compost). At 150 % FC, the two straws increased the soil pHW to only 5.93 and 5.75, respectively, possibly due to slower decomposition under submerged conditions, resulting in limited alkalinity production, whereas amendment with ROAs produced pHW values close to 6.5. With an increasing lime-equivalent value (LEV) of the OA, from 5.8 g CaCO3 kg−1 (wheat straw) to 179 g CaCO3 kg−1 (compost), the lime requirement to reach pHW 6.5 in lime–OA combinations decreased from 2.72 to 0.09 g CaCO3 kg−1. The developed method was shown to be effective in determining the appropriate rates of OAs (with or without additional lime) for the management of acidic sandy loam soils in this study and highlights the importance of the soil water content with respect to its acid-neutralising effect.
- Article
(3908 KB) - Full-text XML
-
Supplement
(836 KB) - BibTeX
- EndNote


Acidic soils with a soil pH in deionised water (pHW) ≤5.5 are considered harmful to sensitive plants. Soil acidification can be caused by various biogeochemical processes such as oxidation and acid-dissolution reactions, root exudates, solubilisation and hydrolysis of Al3+ which releases H+, and leaching of cations (K+, Ca2+, Na+, Mg2+) (Brady and Weil, 2016; Goulding, 2016; Marschner and Noble, 2000; Mosley et al., 2014). Soil acidification in agricultural systems can also be attributed to high inputs of urea and ammonium (NH)-containing fertilisers, as protons (H+) are generated during the nitrification of NH to nitrate (NO) and by NH uptake by plants as well as by removal of alkalinity via the removal of plant material at harvest (Bolan et al., 2003; Hume et al., 2022; Iticha and Takele, 2019; Kunhikrishnan et al., 2016). Even a small decrease in soil pH can have a large impact on the nutrient availability, nitrogen fixation by soil microbes, and sustainability of crop production (Kopittke et al., 2019).
Lime and, more recently, organic amendments (OAs) can be used to improve the productivity of acidic soils (Garbowski et al., 2023). Agricultural lime (CaCO3) produces alkalinity (OH− and ions) and neutralises soil acidity by reacting with Al3+ and H+ ions to form Al(OH)3 precipitates and H2O. OAs, on the other hand, can provide alkalinity via their surface organic functional groups (e.g. carboxylic, –COO−), the presence of solid and dissolved carbonates, and the release of organic and inorganic anions, which can neutralise or remove toxic ions such as Al3+, Fe3+, Mn2+, and H+ from the soil by reacting, complexing, and binding (Brown et al., 2008; Larney and Angers, 2012; McCauley et al., 2009). Alkalinity production by OAs is related to the excess cation content and dissolution or decomposition rate of the amendments, which are in turn influenced by factors such as the chemical composition of the amendments and soil water content (Anderson et al., 2020; Cai et al., 2020; Védère et al., 2022). As a result, it is important to investigate the effect of the soil water content on the timing of OA application.
Determination of the optimum rates of lime and OAs is necessary for the efficient management of acidic soils. Lime requirement can be determined using various methods including titration, incubation, field experiments, standard buffer solutions, and predictive equations developed from measured soil properties (Aitken and Moody, 1994; Nelson and Su, 2010). Titration is considered the most effective approach for lime recommendations (Wang et al., 2015). It involves the addition of bases such as Ca(OH)2 to acidic soils in a given soil-to-liquid ratio (e.g. 1 : 5 soil to deionised water or 0.01 M CaCl2 solution) followed by measurement of changes in soil pH and pH buffering capacity (pHBC) with time to predict the lime requirement of the soils (Barouchas et al., 2013; Liu et al., 2004; Thompson et al., 2010). Titration results are often validated by experiments to determine the equilibrium lime buffer capacity (LBCeq), i.e. a measure of the amount of soil acidity that must be neutralised by the addition of lime to raise the soil pH by one unit in order to calculate the lime requirements of acidic soils (Kissel et al., 2012).
The amounts of OAs required to neutralise soil acidity and achieve a desired pH can be calculated using the alkalinity of the amendments. Alkalinity is determined by titrating acidified OAs with a base to neutrality, using either ashed amendments, i.e. potential or “ash” alkalinity (Slattery et al., 1991), or air-dried amendments, i.e. titratable or available alkalinity (Feizi et al., 2017; Fidel et al., 2017; Singh et al., 2017). The ash alkalinity method overestimates the alkalinity or liming potential of OAs due to the loss of anions such as sulfur and chlorine during the ashing process (Noble et al., 1996), leading to the underestimation of the amounts of amendments required to neutralise soil acidity. The short-term acid-neutralising effect of OAs is better determined by the available alkalinity, because potential alkalinity becomes only gradually available over a long period of time (Sakala et al., 2004).
Previous studies have shown that a combination of lime and OAs can generate more alkalinity than lime or OA alone (Butterly et al., 2021; Lauricella et al., 2021; Li et al., 2022). However, little effort has been made to develop the methods to calculate the application rates of lime combined with OAs needed to neutralise soil acidity and achieve the desired pH for plant growth. Previous research aimed at developing appropriate lime and OA combinations has been conducted in field trials, which involve mixing different rates of lime and OAs into acidic soils and determining the response of acidity and crop yield (Celestina et al., 2018; Khoi et al., 2010; Li et al., 2019). This approach is time-consuming and costly, and it is difficult to predict the soil acidity that can be neutralised. In addition, little information exists about the impact of an alkalinity-based mixture of OAs on soil pH. A laboratory method for determining lime and OA combinations based on titratable alkalinity could shorten the time required and improve the cost-effectiveness of soil acidity amelioration.
Therefore, the first aim of this study was to determine the lime requirement of acidic soil using titration and equilibration methods as well as to estimate the application rates of OAs and OA mixes based on their titratable alkalinity. The second aim was to develop a laboratory method to calculate the rates of lime and OA in combinations required to achieve a desired soil pH, based on the titratable alkalinity of the amendments and LBCeq of the acidic soil. Finally, the third aim was to assess the effect of the soil water content on amelioration by incubating acidic soil with the amendments at different soil water contents.
2.1 Collection of soil and amendments
The soil used in this study was collected from the 0–10 cm layer of the non-limed treatment from the acid soil management trial site at Sandilands on the Yorke Peninsula of South Australia. The site is located north-west of Adelaide (34∘33′14′′ S, 137∘42′14′′ E). The long-term mean annual rainfall and temperature at the site were 409 mm and 21.9 ∘C, respectively. Penlime Plus™ (Angaston lime, Penrice Quarry & Mineral, South Australia) with a neutralising value of 98 % was used as the lime source. The OAs used in this study were wheat straw, faba bean straw, blended poultry litter, biochar, and compost, which differ with respect to their decomposability. The two straws are more decomposable than the other OAs because they have not undergone decomposition. Due to its lower ratio, faba bean straw is likely to be more readily decomposable than mature wheat straw. The blended poultry litter comprised equal proportions of poultry manure and sawdust/wood shavings. The biochar was made from the pyrolysis (400 ∘C) of Eucalyptus species (sourced from Green Man Char Pty Ltd, Victoria, Australia), and the compost was prepared from a mixture of various organic wastes (sourced from Bunnings Pty Ltd, Australia). Blended poultry litter, biochar, and compost are partially decomposed, leaving few readily available compounds for decomposition after addition to soil and are, therefore, referred to as poorly decomposable or resistant amendments.
The soil and OAs were dried at 30 ∘C in a fan-forced oven. Prior to their use in the experiment, the oven-dried soil was crushed and sieved to pass through a 2 mm sieve size, and the dried OAs were ground and sieved to 0.25–2 mm.
2.2 Analysis of soil and amendments
Soil particle size distribution was determined using the hydrometer method (Bouyoucos, 1962). To measure gravimetric water content at field capacity, air-dried soil was weighed into a small container with a 10 cm diameter and 10 cm height, watered to saturation, covered at the top with plastic film to prevent evaporation, drained to a constant mass for 2 to 3 d, and reweighed. Soil pH was measured potentiometrically using a calibrated glass electrode in a soil water (1 : 5) suspension (pHW) and a soil 0.01 M CaCl2 (1 : 5) suspension (pHCa) (Rayment and Higginson, 1992). The pH and electrical conductivity (EC) of OAs were measured in a 1 : 10 amendment-to-water ratio (Singh et al., 2017). Exchangeable acidity was determined by extracting soil with 1 M KCl solution (Pansu and Gautheyrou, 2006). The cation exchange capacity (CEC) of the soil was determined using a colorimetric method after displacing cations with 1 M ammonium acetate (pH 7) and then extracting the ammonium ions with 1 M KCl (Carter and Gregorich, 2007). Total organic carbon (TOC) in the soil and OAs was determined using the Walkley and Black wet digestion method (Walkley and Black, 1934), whereas total N was determined using the Kjeldahl method (Bremner and Mulvaney, 1982). After digestion with concentrated nitric acid and hydrogen peroxide, the total concentrations of Fe and Al in soil as well as Ca, K, Mg, Na, P, and S in OAs were determined using inductively coupled plasma optical emission spectroscopy (ICP-OES). The excess cation content in the OAs was then calculated by subtracting anions (SO and H2PO) from cations (Ca2+, Mg2+, K+, and Na+) (Tang and Yu, 1999).
2.3 Properties of soil and amendments
In the Australian Soil Classification (Isbell and NCST, 2021), the soil was categorised as a Chromosol, although it is classified as Lixisol in the World Reference Base for Soil Resources (WRB; FAO, 2015). The upper A horizon, which has a sandy loam texture, was used in this experiment (Table 1). The soil pHW and pHCa measured in 1 : 5 soil-to-water or soil-to-0.01 M CaCl2 solution ratios are 4.84 and 4.21, respectively. The exchangeable acidity of the soil was 2.95 cmol kg−1. Based on the ratings of Hazelton and Murphy (2016), the soil has a moderate CEC (21.38 cmol kg−1), likely due to its TOC content (1.43 %) (Table 1).
Table 1Basic properties of the soil used in this study (mean ± SD).
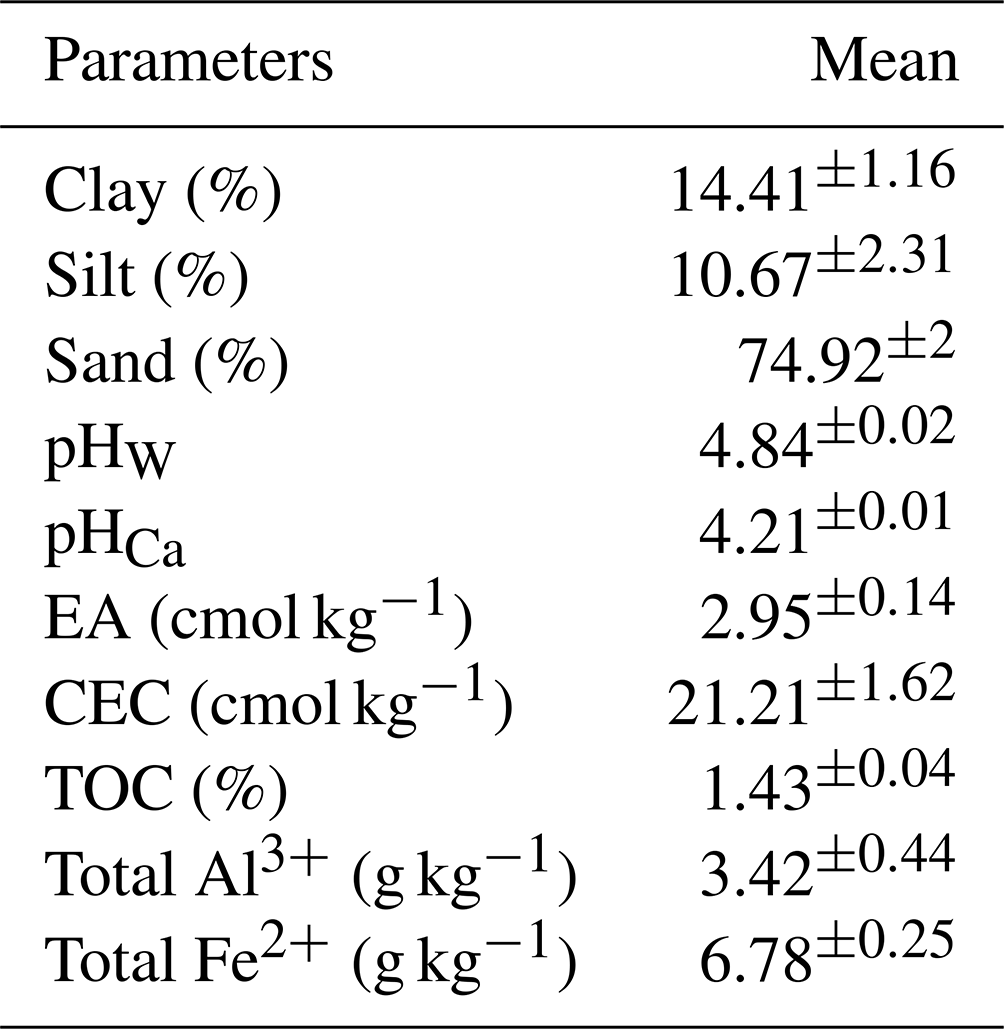
SD: standard deviation; pHW: soil pH in deionised water; pHCa: soil pH in 0.01 M CaCl2 solution; EA: exchangeable acidity; CEC: cation exchange capacity; TOC: total organic carbon.
The mean pHW of the OAs varied between 5.50 (wheat straw) and 9.75 (biochar) (Table 2). The EC of the amendments ranged from 0.55 dS m−1 for faba bean straw to 3.22 dS m−1 for compost. Total concentrations of cations were highest in compost (383 cmol kg−1) and lowest in wheat straw (53 cmol kg−1) (Table 2).
Table 2Chemical properties of organic amendments used in this study (n=3). Different letters indicate significant differences (p≤0.05).
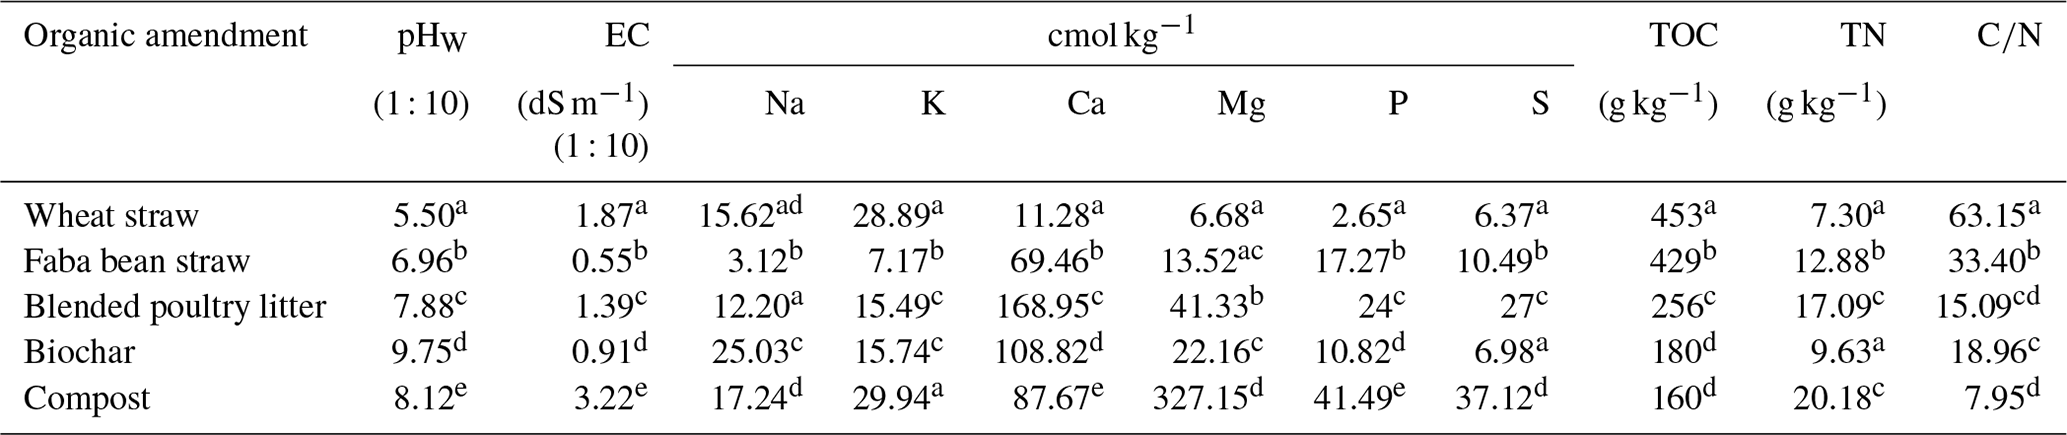
EC: electrical conductivity; TOC: total organic carbon; TN: total nitrogen; : carbon-to-nitrogen ratio.
2.4 Determination of the lime requirement of acidic soil
2.4.1 Titration with calcium hydroxide
Titrations and pH measurements in this study were carried out using 1 : 5 soil-to-deionised water or soil-to-0.01 M CaCl2 solution ratios. First, 5 g of dry soil was weighed into 50 mL polyethylene tubes in triplicate; 25 mL of deionised water or 25 mL of 0.01 M CaCl2 solution was then added into the tubes. The initial soil pH was measured after 30 min of stirring and calibration of the pH meter with standard pH 7.0 and 4.0 buffers. Next, 0.5 mL aliquots of 0.022 M Ca(OH)2 were added to the suspensions, continuously stirred, and pH measurements were taken at the end of each time interval. Based on Liu et al. (2004), the reaction time allowed between consecutive titrations to obtain constant pH measurements was 30 min. The titrations with incremental additions of 0.022 M Ca(OH)2 were carried out while recording the cumulative volume of the 0.022 M Ca(OH)2 added versus the corresponding soil pH. A digital titrator (Burette Digital Titrette® bottle-top burette, 50 mL capacity, Class A, Australian Scientific, Australia) was used for the titrations.
These data were used to plot a regression curve between incremental rates of equivalent CaCO3 (Mg ha−1) consumed and the corresponding soil pH. The regression curve was used to derive the slope, which was then used to calculate the 30 min pHBC (pHBC30) of the acidic soil. The amount of base needed to neutralise H+ (independent variable) was plotted on the x axis and the change in pH (dependent variable) was plotted on the y axis to generate the slope of the titration curve as follows:
where ΔY is the change in pH, ΔX is the amount of base consumed or protons removed to neutralise acids, is the volume of base consumed during titration (mL), and ΔH+ is the amount (mmol kg−1) of H+ removed during titration. The amount of protons (ΔH+) neutralised during the titration is equivalent to the amount of Ca(OH)2 consumed. From this model, the lime requirement (LR) of the acidic soil can be calculated as follows:
Given that the molecular weight of CaCO3 is 100 g mol−1, the amount of Ca(OH)2 consumed by the acidic soil, expressed as CaCO3 equivalent (Mg ha−1), was calculated as follows:
where V is the volume (mL) of 0.022 M Ca(OH)2 consumed to raise the initial pH of the acidic soil to the target pH, M = 0.022 is the molarity of Ca(OH)2 (in mmol mL−1), 10−9 is the conversion factor from CaCO3 (mg mmol−1) to CaCO3 (Mg mmol−1), S is the mass of soil used for the titration (0.005 kg), and Wt is the weight of soil per hectare which (in this case) was calculated as 1.5×10⁶ kg (assuming a liming depth of 0.1 m and soil bulk density of 1500 kg m−3). By using these known variables in Eq. (3), the CaCO3 (Mg ha−1) equivalent can be simply calculated as V×0.66.
The pH buffer capacity (pHBC30), expressed in mmol H+ (kg soil)−1 pH−1, was calculated from the titration curve as the inverse of the slope of the linear regression between pH and the added base (Mg CaCO3 ha−1) (Shi et al., 2019; Thompson et al., 2010). The unit of pHBC derived from the slope was Mg CaCO3 ha−1 pH−1 (where “CaCO3 kg−1 pH−1” denotes the amount of lime required to raise the pH of 1 kg of soil by one unit). This unit was converted to mg CaCO3 kg−1 pH−1 and then to mmol H+ kg−1 pH−1.
2.4.2 Equilibration experiment
An additional experiment was conducted to assess whether the 30 min titration time above was sufficient to complete the equilibrium exchange reaction between H+ and 0.022 M Ca(OH)2. As there was no significant difference between the slopes of regression lines fitted for titrations in water and 0.01 M CaCl2 (p value of 0.231 at α=0.05), the equilibration experiment was only carried out using a 1 : 5 soil-to-deionised water ratio. The experiment consisted of unamended soil (control) and soils amended with the equivalent titration point (ETP) multiplied by 0.5, 0.75, 1, 1.25, and 1.5, respectively. The ETP is the final volume of 0.022 M Ca(OH)2 solution consumed over a 30 min complete titration to achieve the target pHW of 6.5. These treatments were added in 50 mL polypropylene tubes with replicates of 5 g dried soil and 25 mL deionised water suspension. After stirring the mixture for 30 min, the initial 30 min soil pH was measured, which was used to calculate the lime buffer capacity (LBC30) for each rate of 0.022 M Ca(OH)2. Then, three drops of chloroform were added to minimise microbial activity. The tubes were covered with PARAFILM with only a small opening left for air exchange to reduce evaporation, stirred regularly, and incubated at room temperature. The pH was measured every 24 h for 5 d while stirring the suspensions. The lime buffer capacity (mg CaCO3 kg−1 pH−1) was calculated for each incubation period as follows (Kissel et al., 2007):
where V is the volume of Ca(OH)2 added (mL), M is the molarity of Ca(OH)2 used for the titration (= 0.022 M), MW is the molecular weight of CaCO3 (100 mg mmol−1), S is the weight of soil titrated (kg), pHe is the pH of the suspension taken after addition of certain volume of Ca(OH)2 and equilibration for specific incubation time, and pHo is the pH of a suspension without Ca(OH)2 taken at similar incubation time.
Total acidity, expressed as the proton (H+) concentrations that were neutralised over the incubation periods to finally attain equilibrium pH, was calculated using Eq. (5), which was derived from ΔpH × pHBC, by substituting as pHBC in Eq. (1):
where H+ is the proton concentration (mmol H+ kg−1 soil) that was neutralised at a given incubation time (ti), LBC is the lime buffer capacity (mg CaCO3 kg−1 pH−1) calculated for the incubation time (ti), ΔpH is the difference between the initial soil pH taken after 30 min of shaking the soil with base and the final soil pH taken at the incubation time (ti), 100 is the conversion factor from mg CaCO3 kg−1 pH−1 to mmol CaCO3 kg−1 pH−1, and 2 is the conversion factor from mmol CaCO3 to mmol H+.
2.4.3 Equilibrium buffer curves and lime rates
Nonlinear regression curves between soil pH and incubation time as well as between LBC and incubation time were plotted for all concentrations of 0.022 M Ca(OH)2 added to evaluate the change in soil pH and LBC over time. The curves were used to determine the equilibrium pH and LBC at equilibrium (LBCeq, i.e. the point where the pH did not change significantly with time). In addition, a linear regression was fitted between LBC30 and LBCeq, with different rates of 0.022 M Ca(OH)2 as the covariate. The regression equation between LBC30 and LBCeq was used to calculate the equilibrium lime buffer capacity (LBCeq) for the acidic soil based on the pHBC determined during the 30 min titration (LBC30). After the determination of LBCeq, the LR of the acidic soil was calculated as follows:
where LBCeq is the lime buffer capacity at equilibrium soil pH (mg CaCO3 kg−1 pH−1), pHi is the initial pHW before the addition of Ca(OH)2, pHt is the target pHW (i.e. 6.5 used in this study), and ENV is the effective neutralising value of the lime used (in percent).
2.5 Titratable alkalinity and the application rate of organic amendments
The titratable alkalinity was determined by extracting the dried OAs with acid and then back-titrating the suspension to pH 7 with base using the modified methods of Singh et al. (2017) and Yuan and Xu (2011). There was no washing step in this method. The acid-neutralising value of all of the compounds released by acid pretreatment, including any labile compounds, was estimated by back-titrating the solution. Briefly, 0.5 g of dried and sieved (0.25–2 mm) OAs were weighed into 50 mL polyethylene tubes in replicates. Then, 10 mL of 1 M HCl was added, and the mixture was shaken on a reciprocal shaker for 2 h. The suspension was allowed to stand for 24 h and then titrated with 0.5 M NaOH using a digital titrator. The amount of acid neutralised by each amendment (expressed as mmol H+ per gram OA) was calculated as the difference between the volume of 0.5 M NaOH consumed by the blank and the sample. The lime-equivalent value (LEV), expressed as CaCO3 equivalents, of the OAs was then calculated as follows:
where LEV is the lime-equivalent value (g CaCO3 kg−1 OA), 0.5 is the molarity of NaOH used for titration (mol L−1), b is the volume of NaOH consumed by the blank (mL), s is the volume of NaOH consumed by the sample (mL), MW is the molecular weight of CaCO3 (g mol−1), 2 is the moles of H+ neutralised by 1 mol of CaCO3, W is the weight of sample (kg), and 1000 is the unit conversion factor. Then, the amounts of OAs required to raise soil pH to a desired level (pHW 6.5 in this study) were calculated using the following expression:
where RAROA is the recommended application rate of OAs, LBCeq is the lime buffer capacity at equilibrium pH (mg CaCO3 kg−1 soil pH−1), pHt is the target soil pH, pHi is the initial soil pH, and 1000 is the unit conversion factor.
2.6 Calculating rates of lime and organic amendments in their combinations
The application rates in the combinations of pure lime and OAs were calculated based on the titratable alkalinity of the OAs and the CaCO3 required to raise soil pHW to 6.5 that depends on the LBCeq. The method used to calculate lime–OA combinations is illustrated in Fig. 1.
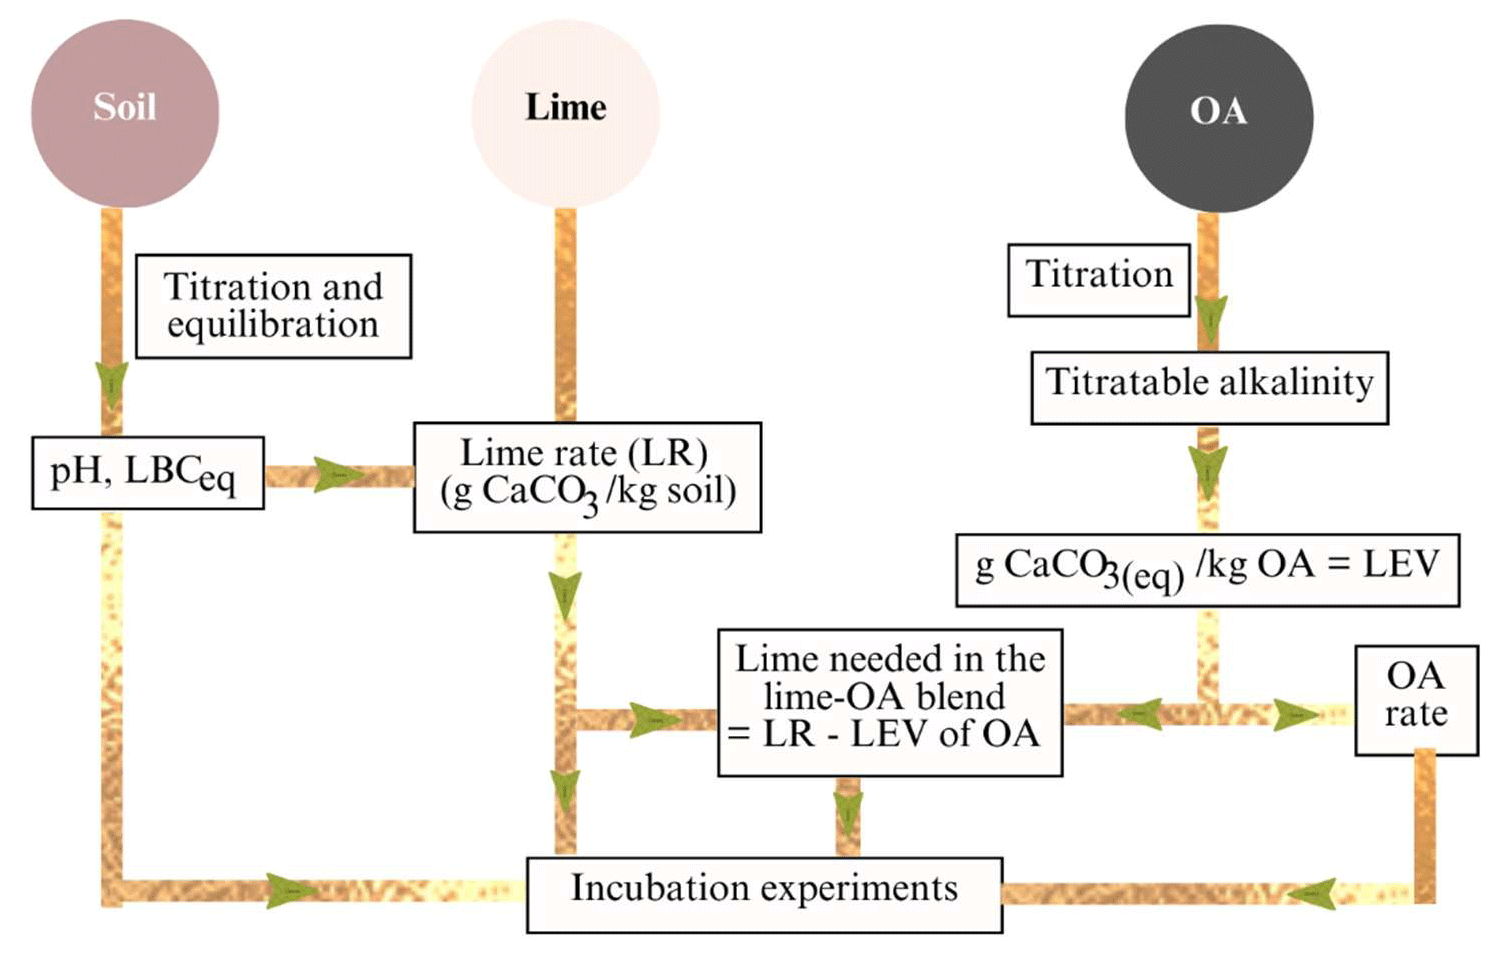
Figure 1Conceptual method used to calculate the amount of lime, organic amendments (OAs), and lime–OA combinations. LBCeq: equilibrium lime buffer capacity; LR: lime rate required to achieve pHW 6.5; LEV: lime-equivalent value.
The amount of pure lime that was combined with each OA to achieve a target pHW of 6.5 was calculated by subtracting the LEV or CaCO3 equivalent of the OA (i.e. added at 1.5 % in this study) from the lime rate using Eq. (9):
where LOAcomb is the total CaCO3 required in the lime–OA combinations to raise the pHW to 6.5, LEVOA is the lime-equivalent value or CaCO3 content of each OA (i.e. added at 15 g OA kg−1 in this study), and LRinorg is the amount of lime (i.e. inorganic source of CaCO3) needed in the combinations (g CaCO3 kg−1 soil).
2.7 Calculating organic amendment in mixes
A 50 % : 50 % alkalinity-based mixture of selected OAs was prepared by combining rapidly decomposable organic material (wheat straw or faba bean straw) with resistant organic materials (compost or biochar) to test the effect of the mixture on soil pH over time. The amount of each amendment in the two-OA mix was calculated in order to contribute 50 % of the total alkalinity (i.e. 50 % of 2.81 g CaCO3 kg−1) required to neutralise soil acidity and achieve pHW 6.5.
2.8 Validation experiments at different water contents
Incubation experiments were conducted at 60 %, 100 %, and 150 % of field capacity (FC) to validate whether the amounts of soil amendments calculated based on their titratable alkalinity could raise the soil pH to the desired level (pHW 6.5). The treatments included unamended or control soil, lime, OAs, OA mixes, and lime–OA combinations. The amendment rates calculated based on the method developed in this study are presented in Table S1 in the Supplement.
For the incubations at 60 % and 100 % FC, the amendments were mixed with 50 g soil (<2 mm) in pots in replicates. The pots were incubated in a dark room with deionised water added on a weight basis. The pH was measured after 14, 30, 60, 90, and 120 d for incubation at 60 % FC and after 10, 20, 30, 40, and 50 d for incubation at 100 % FC until equilibrium pH was attained. For incubation at 150 % FC, 5 g of air-dried soil (<2 mm) was weighed into 50 mL polyethylene plastic tubes and the amendments were mixed with the soil.
The treatments were incubated in a dark room at 150 % FC with the moisture content maintained on a weight basis. Soil pH was measured at 4, 6, 8, 10, and 12 d by adding the amount of deionised water needed to make a 1 : 5 soil-to-water ratio and shaking the suspension for 45 min.
2.9 Statistical analysis
Regression curves for the titration points and equilibration experiments were fitted using OriginPro version 2022b (9.95). Mean comparisons of titratable alkalinity and other chemical properties of OAs were carried out using a one-way ANOVA. Mean comparisons of pH values measured over time during titration and equilibration experiments, as well as the rate of H+ neutralisation with incubation time, were undertaken using a one-way repeated-measures ANOVA. Changes in the pH values of amended soils over time for validation experiments conducted at different soil water contents were also analysed using a one-way repeated-measures ANOVA. The mean comparisons, correlation analysis, and tests of significance were conducted at p≤0.05 using IBM SPSS version 28.0.1.0.
3.1 Soil pHBC30 and LBC30
The regression lines between soil pH and incremental base additions (expressed as Mg CaCO3 ha−1 equivalents; Eq. 3) were linear for titrations in water (r2=0.996) and 0.01 M CaCl2 (r2=0.999) (Fig. 2). The slopes of the regression lines were 0.92 and 0.91 pH ha Mg−1 CaCO3 for titrations in water and 0.01 M CaCl2 solution, respectively, with no significant difference between them (p=0.231).
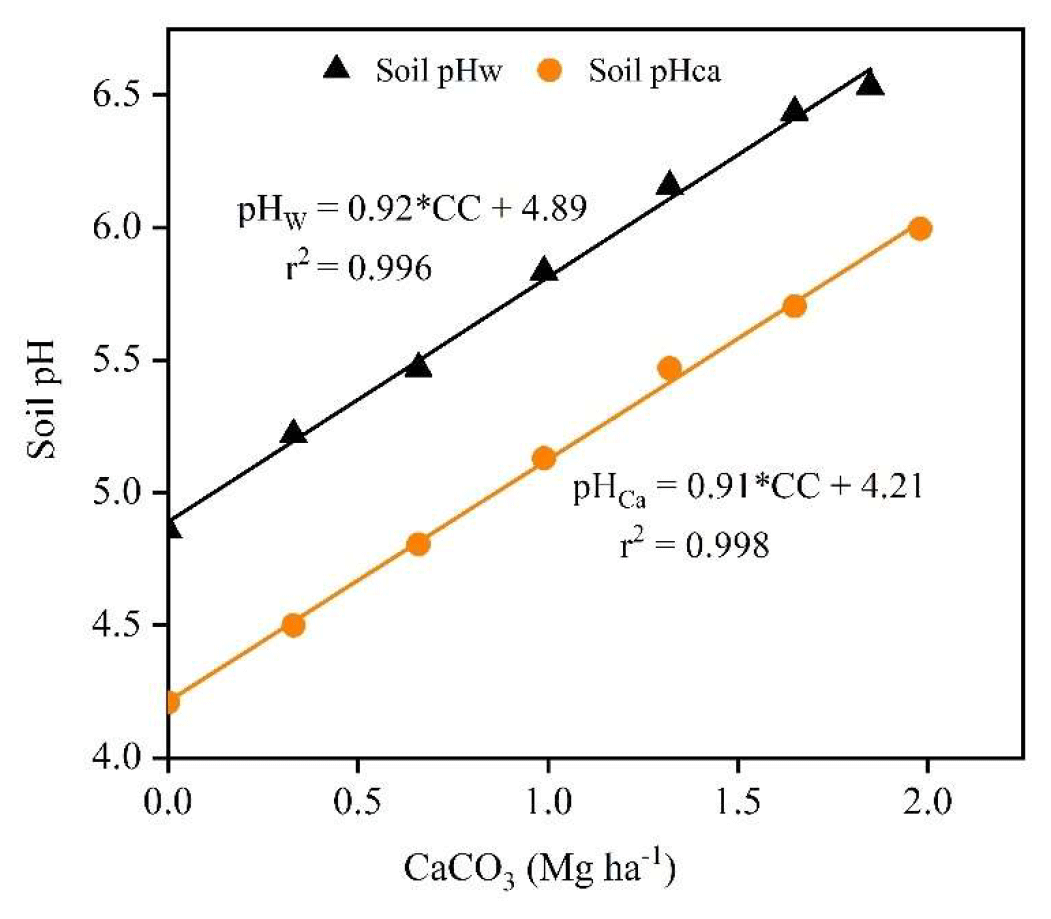
Figure 2Fitted linear regression lines for titrations to pH 6.5 in deionised water and pH 6.0 in 0.01 M CaCl2 solution after 30 min. In the equations, “CC” is the CaCO3 (Mg ha−1) consumed during titrations of the acidic soil with 0.022 M Ca(OH)2.
The buffering capacity (pHBC30) of the acidic soil was estimated from the inverse slope of the titration curve and was 1.09 Mg CaCO3 ha−1 pH−1 in water and 1.10 Mg CaCO3 ha−1 pH−1 in 0.01 M CaCl2, which are values equivalent to 14.54 and 14.66 mmol H+ kg−1 pH−1, respectively. The pHBC is the amount of H+ that is consumed to raise the soil pH by one unit, whereas LBC is the amount of CaCO3 required to raise the soil pH by one unit. As a result, pHBC expressed as LBC is more convenient for calculating the amount of lime required to neutralise soil acidity. The average values of LBC30 calculated from pHBC30 were 727 mg CaCO3 (kg soil)−1 pH−1 for titration in water and 733 mg CaCO3 (kg soil)−1 pH−1 for titration in 0.01 M CaCl2. The slightly higher pHBC30 in the 0.01 M CaCl2 solution than in water indicates that soil resistance to pH change increases when Ca2+ ions in the CaCl2 solution replace Al3+ and H+ ions in the soil exchange complex. The pHBC varied slightly across the pH values, indicating that the change in pH due to base additions is not uniform across the range of pH values.
3.2 Equilibrium pH and lime buffer capacity
The pHW and LBC of soils amended with 0.5, 0.75, 1, 1,25, and 1.5 times the ETP of 0.022 M Ca(OH)2 and incubated for 5 d using a 1 : 5 soil-to-deionised water ratio are shown in Fig. 3a and b. The pHW of unamended soil and soils amended with different rates of 0.022 M Ca(OH)2 decreased nonlinearly with incubation time until it reached a relatively constant level. In contrast, compared with its initial pH, the pHW of the unamended soil increased slightly (by 0.11 units) by 72 h (Fig. 3a). To account for this change, which was not associated with base addition, the pH value for lime-amended treatments was corrected by subtracting the change in the pH of the control soil from the observed pH at the respective incubation time.
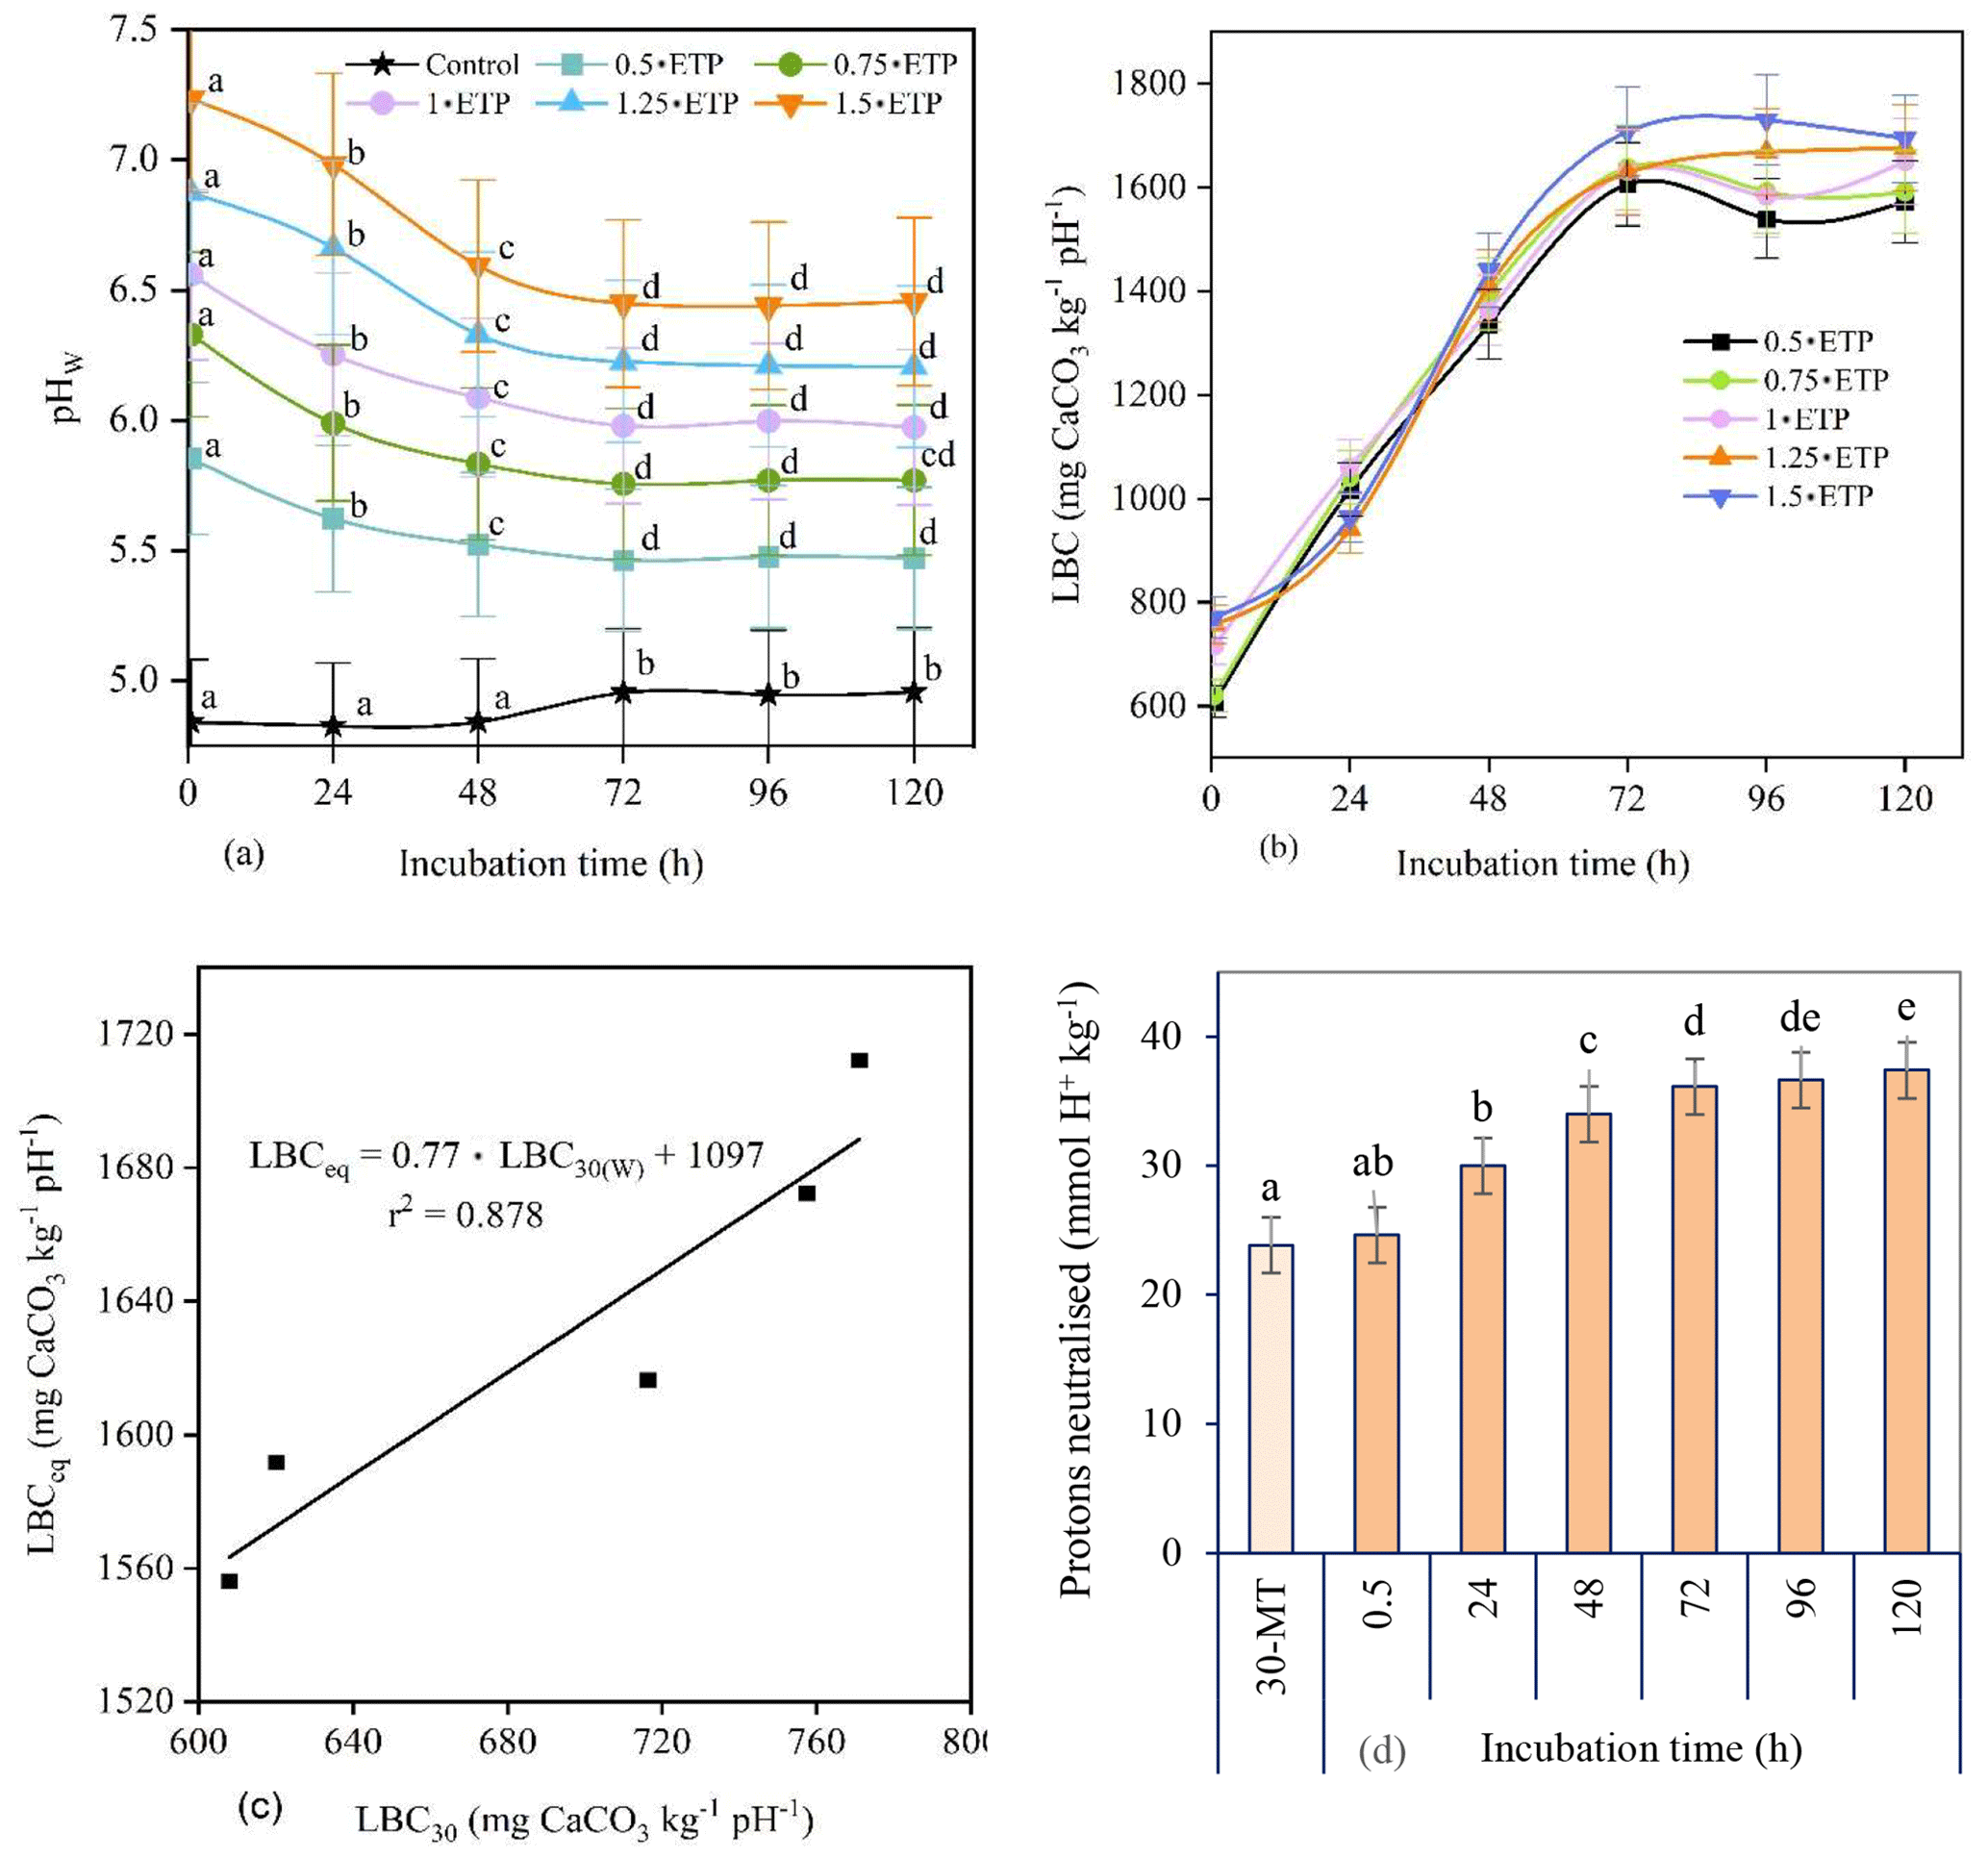
Figure 3(a) The pHW of unamended (control) and amended soils with incubation time. (b) Relationship between the lime buffer capacity (LBC, mg CaCO3 kg−1 pH−1) and incubation time. The LBC was calculated for different rates of 0.022 M Ca(OH)2 using Eq. (4). The amended soils received 0.022 M Ca(OH)2 at rates of 0.5, 0.75, 1, 1.25, and 1.5 ⋅ ETP, where the equivalent titration point (ETP) is the volume of 0.022 M Ca(OH)2 consumed during a 30 min titration in water to raise the soil pHW to 6.5 (i.e. 2.8 mL). (c) Relationship between the corrected LBCeq and the LBC30 of soils amended with different rates of 0.022 M Ca(OH)2 converted to CaCO3 equivalent. LBCeq: equilibrium lime buffer capacity (i.e. after 96–120 h); LBC30: lime buffer capacity determined after 30 min titration in water. (d) Proton concentration neutralised by 0.022 M Ca(OH)2 added at a rate of 1 ⋅ ETP during a 30 min titration (30-MT) and 5 d incubation in water. The term 30-MT represents the time required to complete a titration to achieve pHW 6.5 with a 30 min interval between each base addition, whereas 0.5 h refers to the initial time in the 5 d incubation. Pairwise comparisons using a repeated-measures ANOVA are shown, and the different letters indicate significant differences (p≤0.05) over time.
The soil pHW taken after 0.5 h for soil treated with 1⋅ETP was similar to those of the 30 min titration. However, pHW values at 0.5, 24, and 48 h of incubation were significantly different from each other and from the rest of the incubation periods for all rates of Ca(OH)2. In contrast, the pHW values obtained after 72, 96, and 120 h of incubation were similar. This indicates that the acid–base reaction had reached equilibrium after 72 h of incubation. Based on this, the trends in the regression lines shown in Fig. 3a, and the quantity of protons neutralised over time (Fig. 3d), the equilibrium pH was calculated as the average of the adjusted pH values obtained after 96 and 120 h of incubation. For example, the equilibrium pH for 1⋅ETP was 5.99 (i.e. ), implying that the 0.022 M Ca(OH)2 equivalent determined during titration in water with a 30 min equilibration time only neutralised 69 % of the soil acidity when the target pHW was 6.5.
Furthermore, the LBC was calculated using Eq. (4) with the incubation time adjusted with respect to the control (unamended) soil, i.e. dividing the observed LBC by the correction factor (CF). The CF was calculated by dividing the difference in pH between a soil amended with “a” (the rate of 0.022 M Ca(OH)2) and the control soil “c” at a specific incubation time “ti” (e.g. 24, 48, 72 h) by the difference in pH between a soil amended with the same rate of Ca(OH)2 and the control measured at 0.5 h of incubation.
The LBC had an increasing nonlinear trend with incubation time until equilibrium was reached, and values calculated for 72, 96, and 120 h incubations were not significantly different from each other (Fig. 3b) because LBCeq is obtained when the pH reaches equilibrium. By comparing the LBC values and the trends in the regression lines in Fig. 3b, the average LBC values obtained at 96 and 120 h incubations were used as LBCeq for the acidic soil in this study.
Subsequently, a regression equation was developed between adjusted LBCeq and LBC30 (measured after 0.5 h), with different amounts of Ca(OH)2 as the covariate (Fig. 3c). The LBCeq for the soils incubated with base in deionised water was then calculated from the LBC30 value. For example, for an LBC30 of 727 mg CaCO3 kg−1 pH−1, the LBCeq was 1657 mg CaCO3 kg−1 pH−1. This relationship between LBC30 and LBCeq can be used to calculate LBCeq from LBC30 data for similar soils.
3.3 Proton concentrations and lime requirements
The cumulative concentrations of protons neutralised by the added base during the 5 d incubation with 1⋅ETP are shown in Fig. 3d. Thus, 1⋅ETP incubated for 120 h neutralised 37.39 mmol H+ kg−1 soil (Eq. 5) and raised the pHW from 4.84 to 5.99, thus neutralising 36 % more protons than the initial 30 min titration (30-MT) (Fig. 3d). To raise the soil pHW to 6.5, 55 mmol H+ kg−1 must be neutralised. This corresponds to the total active acidity, as a base (OH−) neutralises not only indigenous H+ but also H+ produced by the hydrolysis of Al3+. Therefore, 2751 mg CaCO3 kg−1 soil was needed to raise the pHW to 6.5. For the lime used in this study (98 % effective neutralising value), that would be 2807 mg CaCO3 kg−1 soil (Eq. 6).
3.4 Effect of the alkalinity of organic amendments on soil pH
The titratable alkalinity of OAs ranged from 12 cmol H+ kg−1 for wheat straw to 357 cmol H+ kg−1 for compost (Table 3). Titratable alkalinity of blended poultry litter and biochar was about half that of compost (Table 3). The titratable alkalinity of OAs was significantly correlated with the EC of the amendments (, p=0.004, where “**” represents significance at the 0.01 level) (Table S2). In addition, alkalinity was moderately correlated with the inherent pH of OAs (, p=0.018, where “*” represents significance at the 0.05 level). The LEV or CaCO3 content of each OA added at 1.5 % () (i.e. 15 g kg−1 soil) (Eq. 7) varied with the titratable alkalinity of the OA (Table 3). The amounts of OAs required to neutralise soil acidity and achieve a pHW of 6.5, which was calculated based on the LEV of the amendments and the LBCeq of soil (Eq. 8), was inversely related to the alkalinity content of the amendments (Table 3).
Table 3Titratable alkalinity of organic amendments and the amount of lime combined with the organic amendments added at 1.5 % to raise the soil pHW from 4.84 to 6.5. Different letters indicate significant differences (p≤0.05).
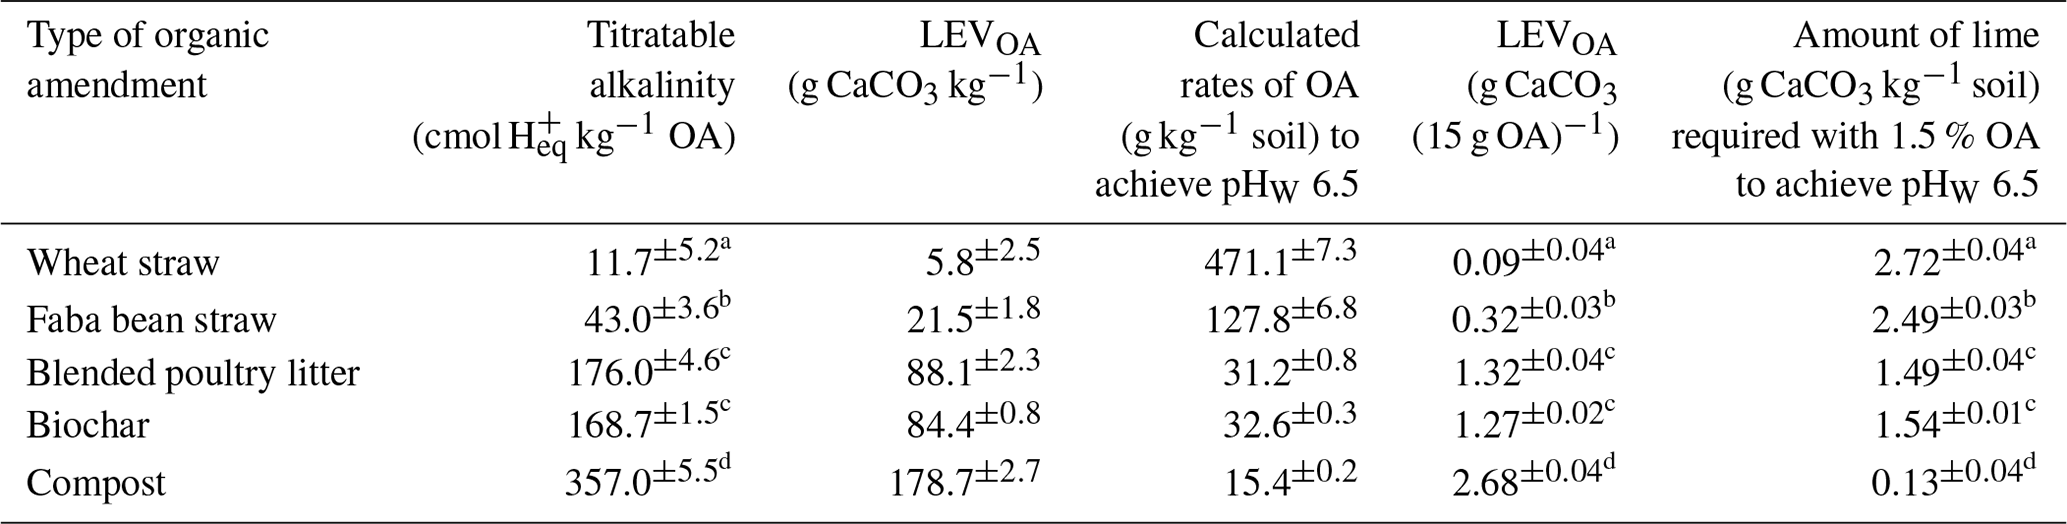
OA: organic amendment; LEV: lime-equivalent value. The sum of CaCO3 of OA (column 5) and the amount of lime (column 6) is equal to 100 % CaCO3 equivalent (2.81 g CaCO3 kg−1 soil for the soil used in this study).
Changes in soil pH (ΔpH) caused by all OAs were significantly different at all water contents (60 %, 100 %, and 150 % FC). Incubation with faba bean and wheat straw at 60 % FC increased the pHW of the soil from 4.84 to 6.53 and 6.42, respectively (Fig. 4a). For the less biodegradable or resistant OAs (ROAs) (i.e. blended poultry litter, compost, and biochar), the soil pH at 60 % FC was lower than for crop straws (Fig. 4a). Biochar resulted in a higher soil pHW (6.27) than the other ROAs.
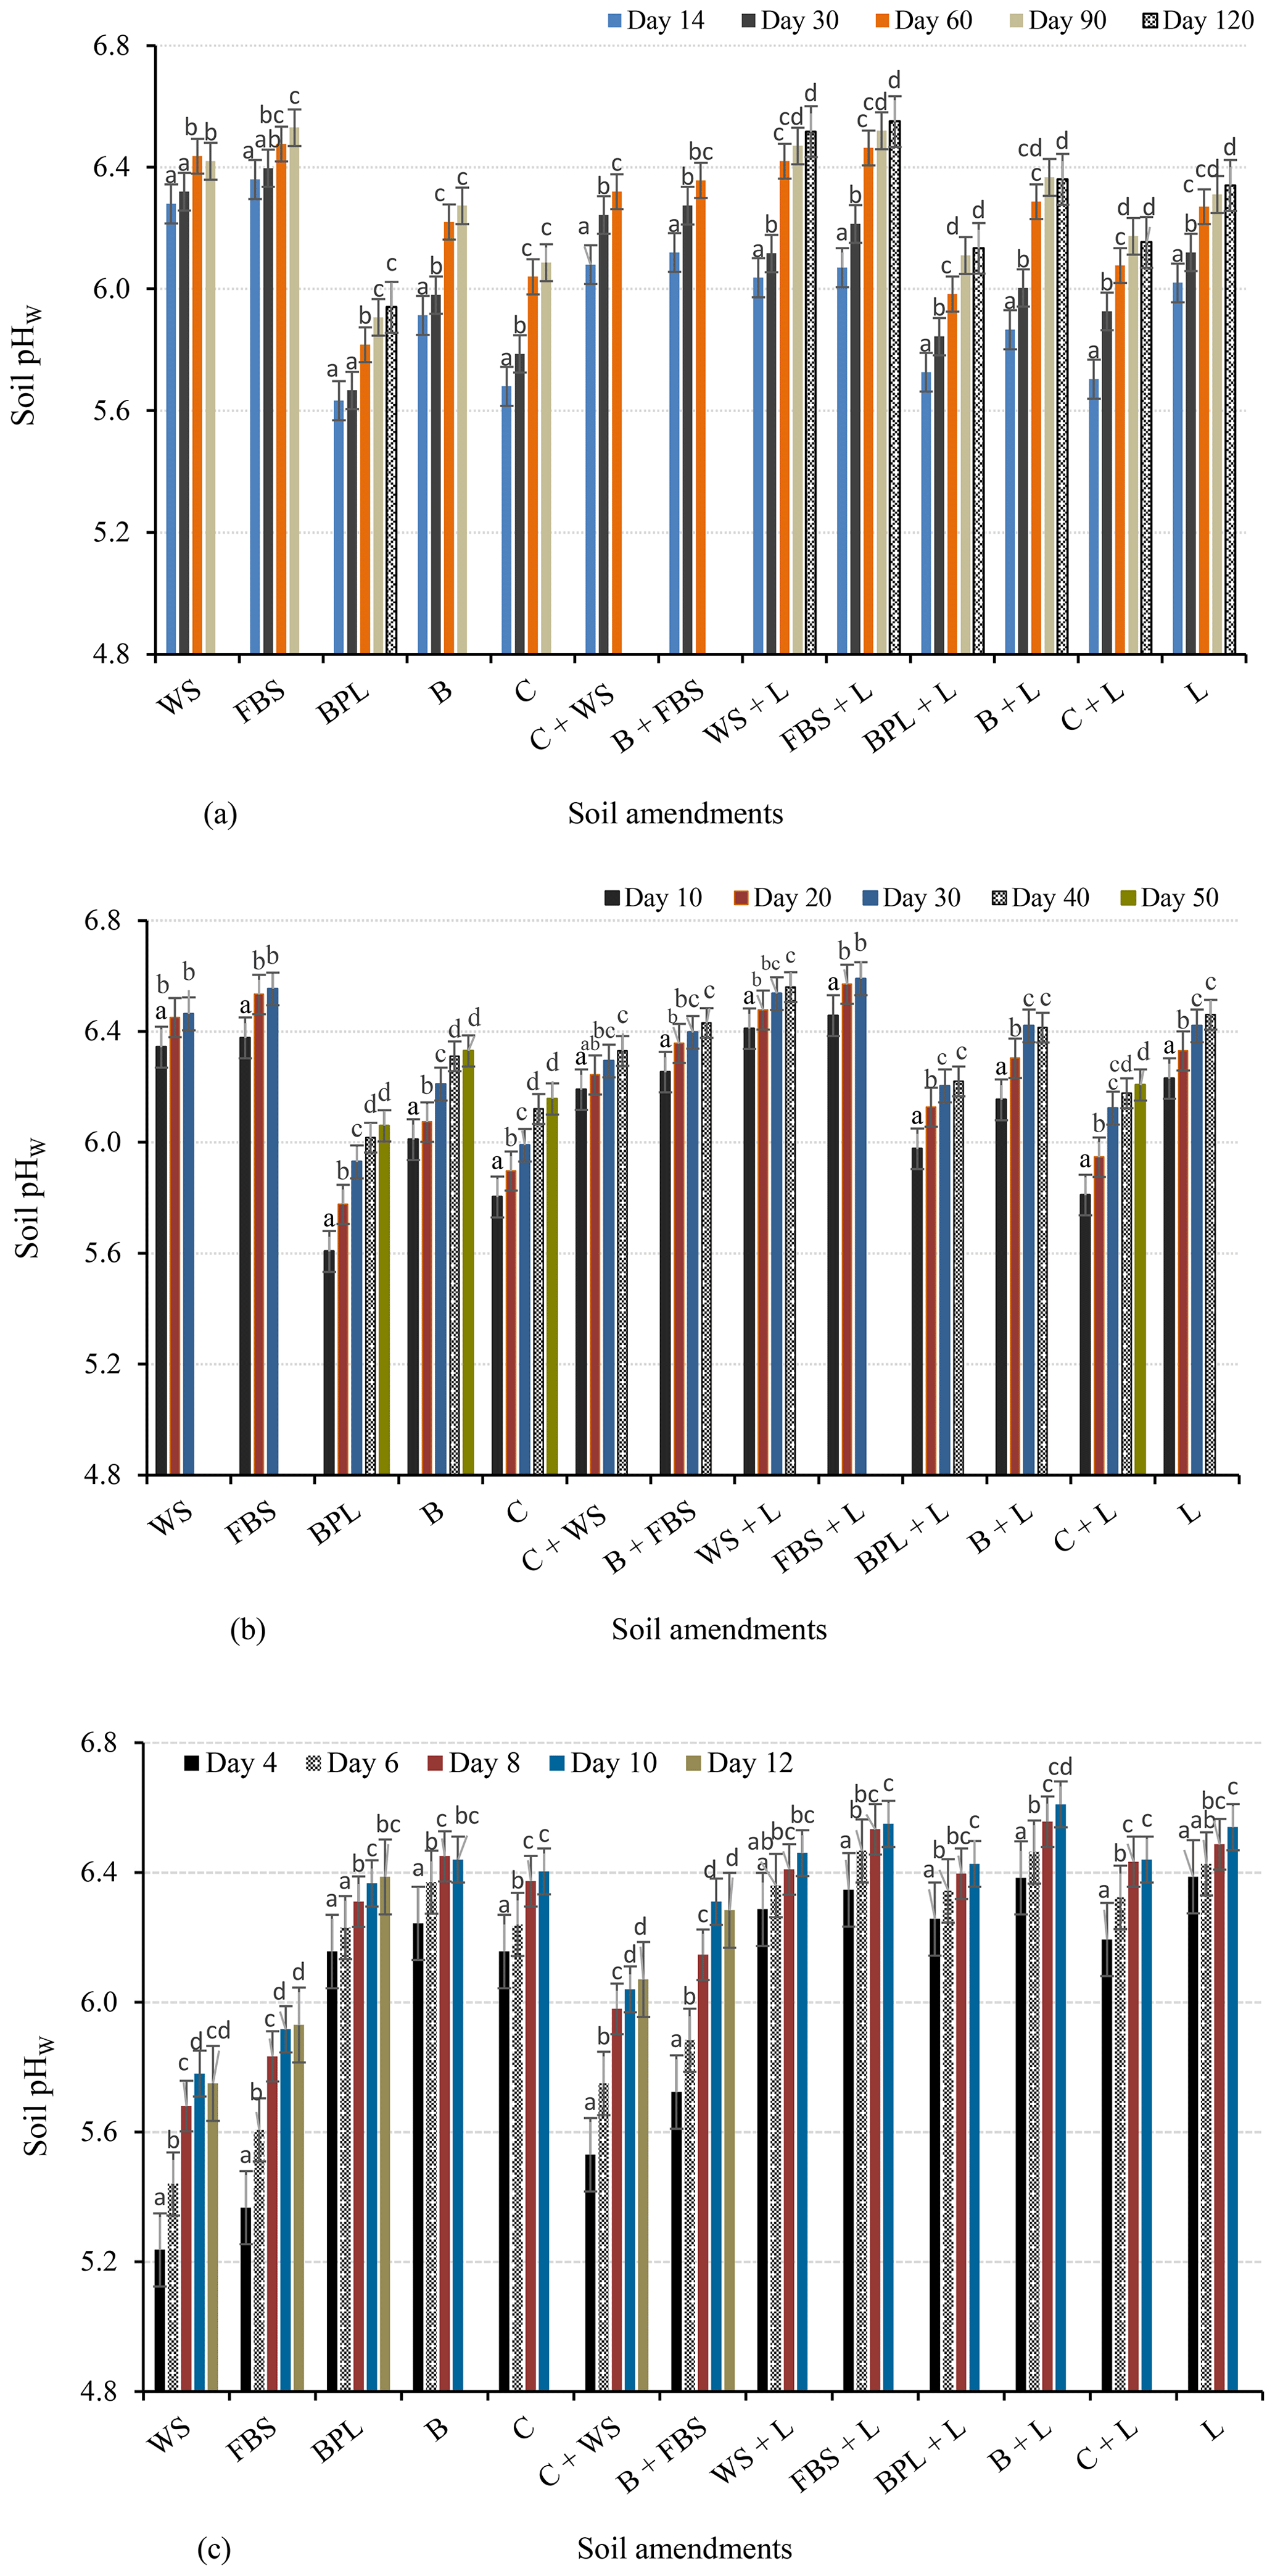
Figure 4Changes in the pHW of soils incubated with individual amendments or combinations of different amendments (a) at 60 % FC for 120 d, (b) at 100 % FC for 50 d, and (c) at 150 % FC for 12 d. Different letters indicate significant changes in the soil pH with incubation time. The final pH values represent the equilibrium pH of the treatment. WS: wheat straw; FBS: faba bean straw; BPL: blended poultry litter; B: biochar; C: compost; L: lime.
At 100 % FC, faba bean and wheat straws also resulted in a soil pH higher than ROAs, with mean pHW values of 6.55 and 6.46, respectively (Fig. 4b). At this soil moisture content, ROAs such as biochar and compost increased the soil pHW from 4.84 to 6.33 and 6.16, respectively, thus resulting in higher pH values than at 60 % FC (Fig. 4a). The rate of change in soil pH over time (ΔpH time in days) was also rapid and higher than at 60 % FC. For instance, the rates of pH change for faba-bean-straw-amended and biochar-amended soils were 0.22 and 0.13 pH units d−1 at 100 % FC, whereas these values were 0.11 and 0.07 pH units d−1 at 60 % FC, respectively. Faba-bean-straw-amended soil reached an equilibrium pH after 30 d of incubation at 100 % FC but after 90 d at 60 % FC (Fig. 4a, b). The remaining soil amendments had a similar decrease in the equilibrium period with increasing soil water content. This could be due to the increased availability of both water and air for biodegradation of OAs at 100 % FC, resulting in higher alkalinity generation and the neutralisation of acidic soil.
Soils incubated with ROAs for 12 d at 150 % FC (submerged conditions) had a higher soil pH than those incubated with faba bean and wheat straws (Fig. 4c). Biochar, compost, and blended poultry litter raised soil pHW to 6.44, 6.40, and 6.39, respectively. On the other hand, wheat and faba bean straws resulted in lower pH values (5.75 and 5.93, respectively) at 150 % FC than at the lower water content values. For all soil amendments, the rate of change in soil pH at 150 % was greater than at 100 and 60 % FC. For example, at 150 % FC, faba-bean-straw-amended and biochar-amended soils reached an equilibrium pH after 12 and 10 d (Fig. 4c), respectively, and their corresponding rates of change in pH were 0.48 and 0.64 pH units d−1.
The magnitude of change in pH or alkalinity production by straws decreased above 100 % FC, whereas that of lime and less biodegradable OAs linearly increased with soil water content. The correlation between the titratable alkalinity of amendments and changes in soil pH increased significantly with soil water content, with r2 values of 0.72, 0.75, and 0.82 at 60 %, 100 %, and 150 % FC, respectively (Table S2).
The alkalinity-based mixture of wheat straw–compost or faba bean straw–biochar that aimed to generate 50 % : 50 % total alkalinity was calculated as 235.6 g kg−1 wheat straw +7.7 g kg−1 compost or 63.9 g kg−1 faba bean straw +16.3 g kg−1 biochar, respectively. The mixes of resistant and easily biodegradable OAs are based on their alkalinity to provide the required 100 % CaCO3 to neutralise soil acidity. The 50 % : 50 % alkalinity-based mixture of resistant and easily decomposable OAs produced soil pH values that were intermediate between the individual amendments. At 60 % FC, the wheat straw and compost mixture resulted in a soil pHW of 6.32, which was 0.23 units higher than the pH changes caused by compost but 0.10 units lower than with wheat straw (Fig. 4a). The faba bean straw and biochar mixture increased pHW to 6.36, resulting in values that were higher than biochar but lower than faba bean straw. A similar trend was observed at 100 % FC, although with slightly higher equilibrium pH values of 6.33 (compost–wheat straw mix) and 6.43 (biochar–faba bean straw mix) (Fig. 4b). This shows that the pH changes by alkalinity-based OA mixes can be predicted from pH changes by individual OAs.
3.5 Effect of lime–organic amendment combinations
The amount of lime required in the lime–OA combinations was calculated using Eq. (9). When the OAs were added at 15 g kg−1, the amount of lime needed to ameliorate acidic soils in combined lime–OAs was inversely related to the titratable alkalinity of the OAs. With increasing alkalinity of the OAs from 5.8 g CaCO3 kg−1 (wheat straw) to 178.7 g CaCO3 kg−1 (compost), the lime requirement in lime–OA combinations decreased from 2.72 (wheat straw) to 0.09 g CaCO3 kg−1 (compost) (Table 3, Fig. 5). Compost addition, for example, reduced the lime requirement by 95 % compared with lime alone. Wheat straw with very low alkalinity, on the other hand, reduced lime requirement by only 3 % compared with lime alone.
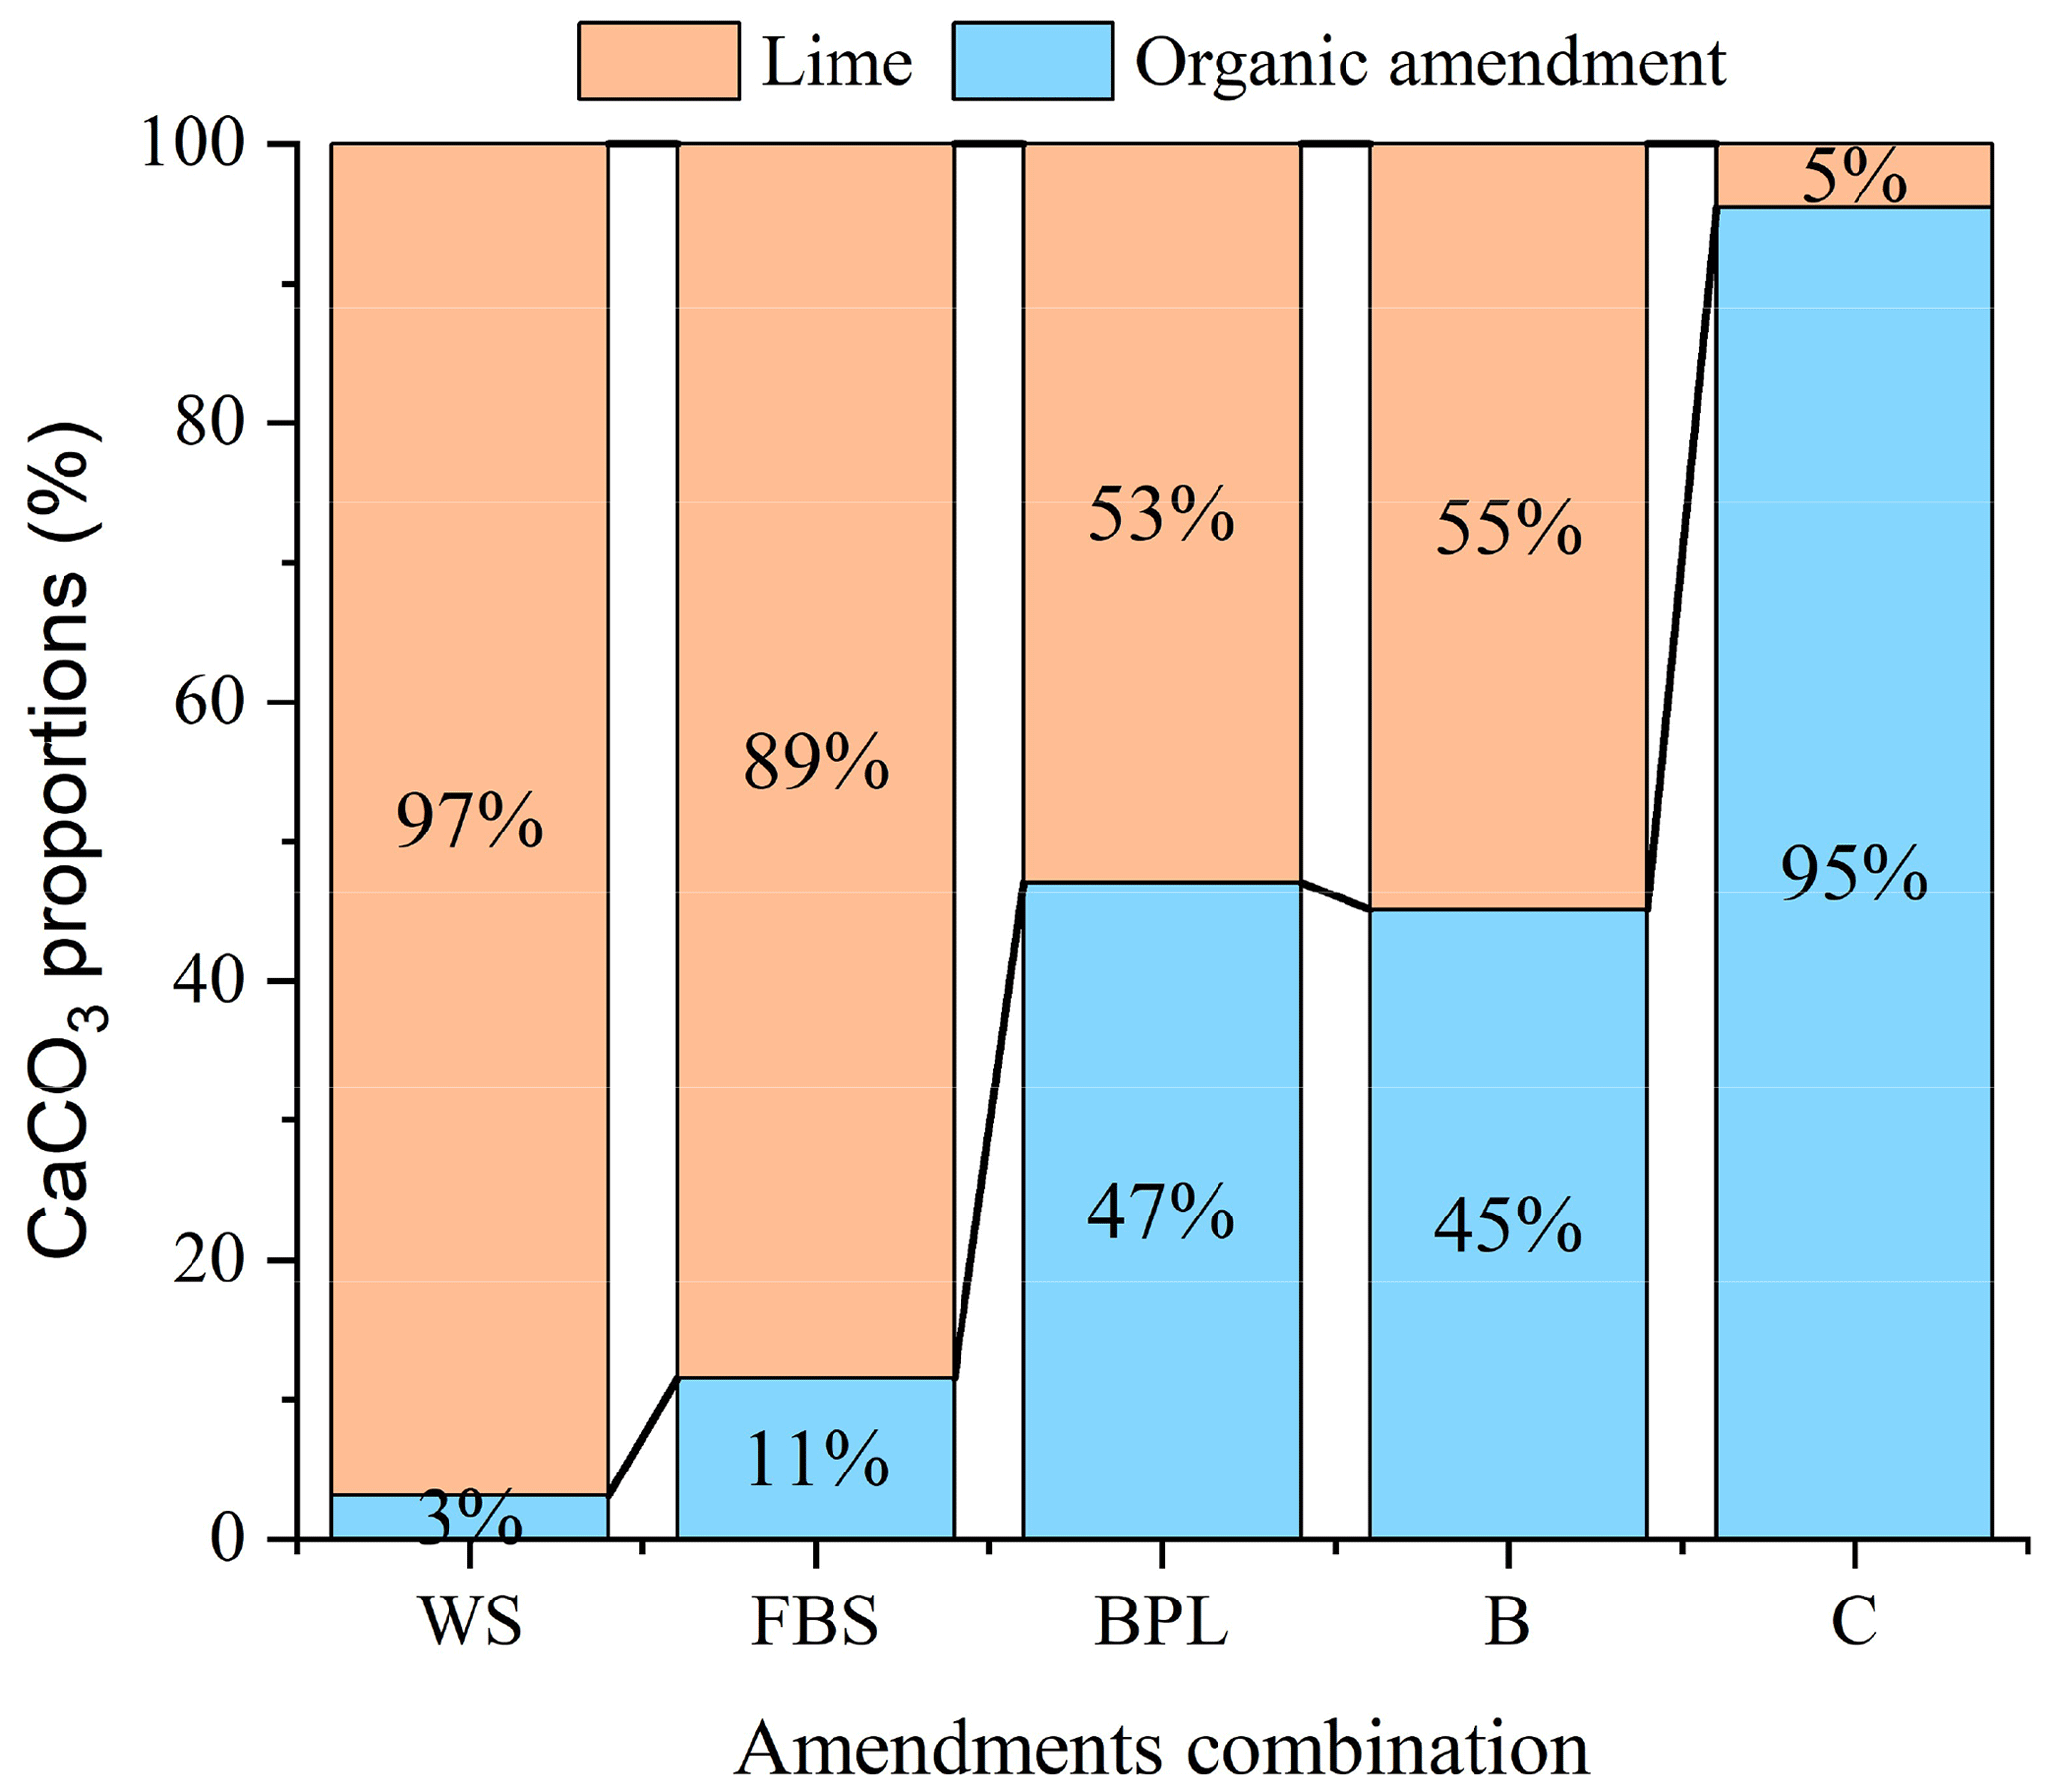
Figure 5Proportions of alkalinity generated by organic amendments (OAs) added at 15 g kg−1 and the lime required to achieve 100 % CaCO3 equivalent in combined lime–OA applications. WS: wheat straw; FBS: faba bean straw; BPL: blended poultry litter; B: biochar; C: compost.
Lime added alone increased the soil pH by 0.20 units when the soil moisture content increased from 60 % to 150 %. Combinations of lime and OAs resulted in a relatively higher soil pH than OAs alone at all incubation moisture levels (Fig. 4a, b, c). Combined additions of faba bean straw–lime resulted in a soil pHW of 6.55, followed by wheat straw–lime (pHW of 6.52), after 120 d of incubation at 60 % FC (Fig. 4a). At 100 % FC, the faba bean–lime and wheat straw–lime combinations generated a soil pHW of 6.59 and 6.56 within 30 and 40 d of incubation, respectively (Fig. 4b). At 100 % FC, lime combined with biochar, blended poultry litter, and compost increased the soil pHW to 6.41, 6.22, and 6.21, respectively. At 150 % FC, the combined lime–ROA treatments increased the soil pHW to close to 6.5 (Fig. 4c).
Our findings show that the laboratory method developed based on the titratable alkalinity of OAs and standard soil parameters (pH and LBC) can be used to accurately calculate OA rates and lime–OA combinations for the amelioration of acid soils.
4.1 Optimum application rates of soil amendments
The acidity in the soil that had to be neutralised to achieve the target pHW of 6.5 was estimated by determining an equilibrium LBC. In this study, an equilibrium pH of 5.99 was reached after 96–120 h at the equivalent CaCO3 rate determined during titration, giving an LBCeq of 1657 mg CaCO3 kg−1 pH−1. Lime requirement was then calculated by multiplying this LBCeq by the required change in soil pH. However, it should be noted that the time required to reach the equilibrium pH depends on the pHBC of the soil (Jalali and Moradi, 2020; Kissel et al., 2005; Wang et al., 2015). Hence, it is important to check this equilibrium time when using this method for different soils. LBC estimates based on 30 min titration (LBC30) did not represent the total concentrations of soil acidity that had to be neutralised to bring the pH to the desired level, as the acid–base neutralisation reactions do not attain equilibrium in this short time period (Barrow and Cox, 1990; Kissel et al., 2007; Liu et al., 2004). However, we showed that a linear regression between LBCeq and LBC30 can be used for rapid assessment, once this relationship is developed for a particular soil, without the need to conduct a long-term incubation each time. The results showed that the percent by weight () of OAs needed to achieve a soil pHW of 6.5 is inversely related to the titratable alkalinity of those amendments. The titratable alkalinity of OAs increased in the following order: wheat straw < faba bean straw < biochar < blended poultry litter < compost (Table 3). The optimum application rates of the amendments decreased in the following order: wheat straw (47.1 %) > faba bean straw (12.8 %) > biochar (3.3 %) > blended poultry litter (3.1 %) > compost (1.5 %).
4.2 Effect of different organic amendment properties on the soil pH
Alkalinity content has been previously found to be a primary measure of the acid-neutralising capacity of OAs (Noble et al., 1996; Noble and Randall, 1998). This was confirmed in the present study by the significant correlation between the soil pH and titratable alkalinity of OAs at various soil water contents. Differences in the alkalinity content of OAs has previously been found to be due to differences in the excess cation content and other physicochemical properties which are influenced by soil, climate, and management practices (Noble and Randall, 1998; Slattery et al., 1991).
Previous studies have also shown that OAs generate alkalinity in the form of hydroxyl (–OH) and carboxyl (–COOH) surface functional groups, carbonates, organic anions (e.g. oxalate and malate), inorganic anions such as sulfate (SO), phosphate (PO), silicate (SiO), and iron hydroxides (FeO–O–) (Cai et al., 2020; Dai et al., 2017; Fidel et al., 2017; Li et al., 2022; Sakala et al., 2004). These groups detoxify H+, Al3+, and other acid-forming ions through neutralisation and association reactions. Different OAs have different types and numbers of these groups.
In our experiments, the magnitude of the soil pH changes at the same soil water content was not consistently related to the titratable alkalinity of the OAs added. This suggests that other physicochemical properties of OAs (e.g. inherent pH, carbonate content, and ratio) may significantly influence soil pH changes. Biochar, for example, was added at a rate of 100 % CaCO3eq, which was comparable to the rates for compost and blended poultry litter, but biochar increased soil pH more than these amendments. This might be caused by other properties of biochar such as a high inherent pH and solid-phase carbonate content following pyrolysis (Mosley et al., 2015) as well as oxygen-rich surface functional groups and a large specific surface area, which leads to high surface adsorption of protons and Al3+ (Chintala et al., 2014; Cui et al., 2021).
We found that, when applied at similar CaCO3 equivalents, faba bean straw produced a higher soil pH than wheat straw at all soil water contents. This could be because faba bean straw has a lower than wheat straw (Table 2) and, therefore, is decomposed more quickly and results in net ammonification during the mineralisation of organic N and a pH increase. Higher total N concentrations in legumes than in cereals likely lead to a higher N-cycling rates and a faster biological decarboxylation (Butterly et al., 2013), resulting in faster and greater soil pH increases.
4.3 Impact of the soil water content on alkalinity production by organic amendments
The present study showed that changes in the soil pH by wheat and faba bean straws decreased as follows: 100 % FC > 60 % FC > 150 % FC. In contrast, the ROA soil pH increased with water content as follows: 60 % FC < 100 % FC < 150 % FC. When applied at similar CaCO3 equivalent, wheat and faba bean straws resulted in higher pH values than ROAs at 60 % FC. The more rapid soil pH changes with wheat and faba bean straws to pHW 6.53 and 6.42 compared with the other OAs at 60 % FC are likely due to the fact that crop straws decompose fast because microbial activity is high when oxygen availability is high (Grzyb et al., 2021; Jin et al., 2023), leading to the rapid release of available alkalinity. In contrast, the pH changes with ROAs were slow at 60 % FC. The lignin content of woodchips in blended poultry litter and the resistance of compost and biochar to further decomposition is likely to result in slow decomposition of these amendments, thereby reducing the release of organic anions. In addition, the water content at 60 % FC may not be high enough for the dissolution of soluble organic compounds and, thus, production of alkalinity in ROAs. As a result, soil amended with ROAs reached an equilibrium pH after 90–120 d at 60 % FC, indicating that ROAs should be added several months before planting to neutralise acidity.
We found that an increase in the soil water content from 60 % to 100 % FC reduced the time required for amended soils to reach equilibrium pH by nearly 2-fold. Thus, the soil water content should be considered when deciding on the application time and comparing the effects of amendments on soil pH (e.g. optimal application may be before a significant rainfall event).
At 150 % FC, amendment with ROAs resulted in a pHW close to 6.5, likely because there was enough water for the dissolution of soluble organic/inorganic anions and carbonates. Even after the equilibrium pH was reached, undissolved/undecomposed ROA particles were found in the suspension, causing minor deviations in the soil pHW from 6.5. However, it is unlikely that the entire acid-extractable alkalinity of the ROAs is released by water. Adeleke et al. (2017) suggested that organic anions that provide various functional groups (amino, carboxylic, phenolic) for surface adsorption of H+ and Al3+ are weak acids and do not dissolve completely in water. Acid-extractable alkalinity determined by the reaction of organic materials with acids (e.g. HCl) over a long time can also lead to the increased solubility of inorganic alkali, exposing occluded inorganic alkali and occluded conjugate bases of functional groups (Fidel, 2012), which are not soluble in water. Nevertheless, water-insoluble fractions of acid-extractable alkalinity can increase the long-term buffering capacity of acidic soils (Fidel et al., 2017; Yuan et al., 2011).
However, wheat and faba bean straws induced lower pH at 150 % FC. The lower pH with wheat and faba bean straws at 150 % FC than at the lower water contents may be because undecomposed crop straws were added at high rates, resulting in a low oxygen content at this high water content due to low decomposition rates and, thus, the limited production of alkalinity. For example, Chen et al. (2018) showed that anaerobic conditions reduced the rate of straw decomposition by 30 % compared with aerobic conditions. Reduction in organic material decomposition is associated with a limited production of organic anions (Cai et al., 2020; Xu et al., 2006b). Furthermore, anaerobic conditions may have favoured the formation of acid-forming products, such as H2S, and promoted the formation of protons from the acidic soil via the hydrolysis of Al(OH)3 and the dissolution of Fe hydroxy oxide clay minerals.
4.4 Effect of mixing soil amendments based on alkalinity production
An alkalinity-based mixture of resistant and easily decomposable OAs produced soil pH changes that were intermediate (between the two amendments). The mixtures led to greater pH increases than ROAs alone but smaller pH changes than rapidly decomposable OAs alone. Previous studies have indicated that the nutrient release and decomposition patterns of mass-based OA mixtures resulted in nonadditive responses (Gartner and Cardon, 2004; Le and Marschner, 2018). However, there is no information on how alkalinity-based mixtures of OAs affect soil pH. Our findings show that for alkalinity-based OA mixtures, pH changes in the mixes can be predicted from the pH changes in the individual amendments. The pH values can be estimated as the sum of pH changes by individual amendments multiplied by their proportion of alkalinity in the mix. Hence, mixing of OAs based on their alkalinity and ratio could promote an early pH increase due to the rapid production of alkalinity by easily decomposable amendments as well as a sustained increase later from the resistant amendments. Amendment mixtures may occur where crop residues are left in the field after harvest and are mixed with ROAs to generate the additional alkalinity required to neutralise soil acidity.
The results showed that lime–OA combinations induce a higher pH than individual OAs. For instance, the combined lime–ROA treatments increased the soil pHW to about 6.5 at 150 % FC, which can likely be attributed to the increased alkalinity production for the reasons explained above. As lime dissolution in acidic soils increases with water content (Anderson et al., 2020; Naorem et al., 2022), the combined use of lime and ROAs could be a good option for managing acidic soils forming in coastal areas and wetlands, including acid sulfate soils. Mixtures of lime and wheat and faba bean straws also produced a higher pH than lime alone. This could be due to synergetic interactions between lime and OAs, leading to high alkalinity generation. Decomposition of OAs generates CO2 which leads to the dissolution of carbonate; liming, on the other hand, may increase OA decomposition by increasing the soil pH. However, the relative effectiveness of OAs with lime in ameliorating acidic soil is not simply the sum of their neutralising capacity (Butterly and Tang, 2018), likely due to the adsorption of cations (e.g. Ca2+) released from lime on the surfaces of OAs.
This study showed that the titratable alkalinity of OA and the LBC of acidic soils can be used to accurately calculate the amounts of OAs and the lime–OA combination ratio needed to neutralise soil acidity. The alkalinity production potential of soil amendments was significantly affected by the soil amendment type and soil water content. Crop straws decomposed faster to release more alkalinity under aerobic than anaerobic conditions. On the other hand, lime and ROAs, such as compost, biochar, and blended poultry litter, led to a higher pH in soils with a high water content. Alkalinity-based mixtures of two OAs produced soil pH changes that were intermediate between the individual amendments. Lime–OA combinations, in contrast, led to positive interactions, generating more alkalinity than individual amendments. The developed method is novel because it could help to reduce the time and cost associated with conducting field experiments to determine the optimum lime–OA rates for a specific soil. This could be particularly important in situations where lime sources are unavailable or need to be transported long distances. It could also allow flexibility in adjusting the amount of lime or OAs in combined applications based on their availability and cost. The method can be reproduced in different soils, as it only requires the measurements of standard soil parameters (soil pH and LBC) and the titratable alkalinity of OAs. The study also showed that uncertainty in achieving the desired soil pH from amendment calculations based on the titratable alkalinity could be due to the soil moisture following amendment, fractions of water-insoluble alkalinity, and technical errors in measuring soil LBCeq and OA alkalinity.
The data generated in this study are available from the corresponding author upon request.
The supplement related to this article is available online at: https://doi.org/10.5194/soil-10-33-2024-supplement.
BI, LMM, and PM conceptualised the study. BI conducted soil sampling, performed the experiments, and drafted the manuscript with editorial contributions from the two co-authors.
The contact author has declared that none of the authors has any competing interests.
Publisher’s note: Copernicus Publications remains neutral with regard to jurisdictional claims made in the text, published maps, institutional affiliations, or any other geographical representation in this paper. While Copernicus Publications makes every effort to include appropriate place names, the final responsibility lies with the authors.
Birhanu Iticha received a University of Adelaide Research Scholarship and is supported by the GRDC project on management of subsoil acidity. We would also like to thank Brian Hughes, Ruby Zelda Hume, and Bonnie Armour for their assistance with collecting the soil.
The research has been supported by The University of Adelaide and GRDC.
This paper was edited by Rafael Clemente and reviewed by Bernhard Wehr and one anonymous referee.
Adeleke, R., Nwangburuka, C., and Oboirien, B.: Origins, roles and fate of organic acids in soils: A review, S. Afr. J. Bot., 108, 393–406, https://doi.org/10.1016/j.sajb.2016.09.002, 2017.
Aitken, R. L. and Moody, P. W.: The effect of valence and ionic-strength on the measurement of pH buffer capacity, Soil Res., 32, 975–984, https://doi.org/10.1071/SR9940975, 1994.
Anderson, G. C., Pathan, S., Easton, J., Hall, D. J., and Sharma, R.: Short-and long-term effects of lime and gypsum applications on acid soils in a water-limited environment: 2. soil chemical properties, Agronomy, 10, 1987, https://doi.org/10.3390/agronomy10121987, 2020.
Barouchas, P. E., Moustakas, N., and Liopa-Tsakalidi, A.: A rapid procedure to calculate lime requirements based on single titration with base, Arch. Agron. Soil Sci., 59, 317–325, https://doi.org/10.1080/03650340.2011.621421, 2013.
Barrow, N. and Cox, V.: A quick and simple method for determining the titration curve and estimating the lime requirement of soil, Soil Res., 28, 685–694, https://doi.org/10.1071/SR9900685, 1990.
Bolan, N. S., Adriano, D. C., and Curtin, D.: Soil acidification and liming interactions with nutrient and heavy metal transformation and bioavailability, Adv. Agron., 78, 215–272, https://doi.org/10.1016/S0065-2113(02)78006-1, 2003.
Bouyoucos, G. J.: Hydrometer method improved for making particle size analyses of soils 1, Agron. J., 54, 464–465, https://doi.org/10.2134/agronj1962.00021962005400050028x, 1962.
Brady, N. C. and Weil, R. R.: The nature and properties of soils, Pearson Education, Columbus, EUA, ISBN 978-0133254488, 2016.
Bremner, J. M., and Mulvaney, C. S.: Nitrogen-Total, in: Methods of soil analysis. Part 2. Chemical and microbiological properties, edited by: Page, A. L., Miller, R. H., and Keeney, D. R., American Society of Agronomy, Soil Science Society of America, Madison, Wisconsin, 595–624, https://doi.org/10.2134/agronmonogr9.2.2ed, 1982.
Brown, T. T., Koenig, R. T., Huggins, D. R., Harsh, J. B., and Rossi, R. E.: Lime effects on soil acidity, crop yield, and aluminum chemistry in direct-seeded cropping systems, Soil Sci. Soc. Am. J., 72, 634–640, https://doi.org/10.2136/sssaj2007.0061, 2008.
Butterly, C. and Tang, C.: Evaluating rates of organic amendments with lime for treating acid soils, Managing subsoil acidity, GRDC DAN00206, Department of Primary Industries, 2018.
Butterly, C. R., Baldock, J. A., and Tang, C.: The contribution of crop residues to changes in soil pH under field conditions, Plant Soil, 366, 185–198, https://doi.org/10.1007/s11104-012-1422-1, 2013.
Butterly, C. R., Costello, B., Lauricella, D., Sale, P., Li, G., and Tang, C.: Alkalinity movement down acid soil columns was faster when lime and plant residues were combined than when either was applied separately, Eur. J. Soil Sci., 72, 313–325, https://doi.org/10.1111/ejss.12945, 2021.
Cai, Z., Xu, M., Zhang, L., Yang, Y., Wang, B., Wen, S., Misselbrook, T. H., Carswell, A. M., Duan, Y., and Gao, S.: Decarboxylation of organic anions to alleviate acidification of red soils from urea application, J. Soil. Sediment., 20, 3124–3135, https://doi.org/10.1007/s11368-020-02630-2, 2020.
Carter, M. R. and Gregorich, E. G. (Eds.): Soil sampling and methods of analysis, CRC press, https://doi.org/10.1201/9781420005271, 2007.
Celestina, C., Midwood, J., Sherriff, S., Trengove, S., Hunt, J., Tang, C., Sale, P., and Franks, A.: Crop yield responses to surface and subsoil applications of poultry litter and inorganic fertiliser in south-eastern Australia, Crop Pasture Sci., 69, 303–316, https://doi.org/10.1071/CP17439, 2018.
Chen, X., Xu, Y., Gao, H.-j., Mao, J., Chu, W., and Thompson, M. L.: Biochemical stabilization of soil organic matter in straw-amended, anaerobic and aerobic soils, Sci. Total Environ., 625, 1065–1073, https://doi.org/10.1016/j.scitotenv.2017.12.293, 2018.
Chintala, R., Mollinedo, J., Schumacher, T. E., Malo, D. D., and Julson, J. L.: Effect of biochar on chemical properties of acidic soil, Arch. Agron. Soil Sci., 60, 393–404, https://doi.org/10.1007/s42773-022-00138-1, 2014.
Cui, L., Fan, Q., Sun, J., Quan, G., Yan, J., Hina, K., Wang, H., Zhang, Z., and Hussain, Q.: Changes in surface characteristics and adsorption properties of 2, 4, 6-trichlorophenol following Fenton-like aging of biochar, Sci. Rep.-UK, 11, 4293, https://doi.org/10.1038/s41598-021-82129-z, 2021.
Dai, Z., Zhang, X., Tang, C., Muhammad, N., Wu, J., Brookes, P. C., and Xu, J.: Potential role of biochars in decreasing soil acidification-a critical review. Sci. Total Environ., 581, 601–611, https://doi.org/10.1016/j.scitotenv.2016.12.169, 2017.
FAO: World Reference Base for Soil Resources, FAO, Rome, ISBN 978-92-5-109004-6, 2015.
Feizi, M., Jalali, M., and Renella, G.: Available alkalinity and N mineralization are key factors regulating soil pH value of an organically amended Iranian agricultural soil, Arid Land Res. Manag., 31, 140–158, https://doi.org/10.1080/15324982.2016.1278055, 2017.
Fidel, R. B.: Evaluation and implementation of methods for quantifying organic and inorganic components of biochar alkalinity, Thesis, Iowa State University, https://doi.org/10.31274/etd-180810-290, 2012.
Fidel, R. B., Laird, D. A., Thompson, M. L., and Lawrinenko, M.: Characterization and quantification of biochar alkalinity, Chemosphere, 167, 367–373, https://doi.org/10.1016/j.chemosphere.2016.09.151, 2017.
Garbowski, T., Bar-Michalczyk, D., Charazińska, S., Grabowska-Polanowska, B., Kowalczyk, A., and Lochyński, P.: An overview of natural soil amendments in agriculture, Soil Till. Res., 225, 105462, https://doi.org/10.1016/j.still.2022.105462, 2023.
Gartner, T. B. and Cardon, Z. G.: Decomposition dynamics in mixed-species leaf litter, Oikos, 104, 230–246, https://doi.org/10.1111/j.0030-1299.2004.12738.x, 2004.
Goulding, K. W. T.: Soil acidification and the importance of liming agricultural soils with particular reference to the United Kingdom, Soil Use Manage., 32, 390–399, https://doi.org/10.1111/sum.12270, 2016.
Grzyb, A., Wolna-Maruwka, A., and Niewiadomska, A.: The significance of microbial transformation of nitrogen compounds in the light of integrated crop management, Agronomy, 11, 1415, https://doi.org/10.3390/agronomy11071415, 2021.
Hazelton, P. and Murphy, B.: Interpreting soil test results: What do all the numbers mean?, CSIRO publishing, ISBN 9781486303960, 2016.
Hume, R., Marschner, P., Schilling, R. K., Mason, S., and Mosley, L. M.: Detection of agriculturally relevant lime concentrations in soil using mid-infrared spectroscopy, Geoderma, 409, 115639, https://doi.org/10.1016/j.geoderma.2021.115639, 2022.
Isbell, R. F. and NCST: The Australian Soil Classification, 3rd Edn., CSIRO Publishing, ISBN 9781486314775, 2021.
Iticha, B. and Takele, C.: Digital soil mapping for site-specific management of soils, Geoderma, 351, 85–91, https://doi.org/10.1016/j.geoderma.2019.05.026, 2019.
Jalali, M. and Moradi, A.: Measuring and simulating pH buffer capacity of calcareous soils using empirical and mechanistic models, Arch. Agron. Soil Sci., 66, 559–571, https://doi.org/10.1080/03650340.2019.1628344, 2020.
Jin, S., Huang, Y., Dong, C., Bai, Y., Pan, H., and Hu, Z.: Effects of different straw returning amounts and fertilizer conditions on bacteria of rice's different part in rare earth mining area, Sci. Rep., 13, 412, https://doi.org/10.1038/s41598-023-27553-z, 2023.
Khoi, C. M., Guong, V., Trung, P. N. M., and Nilsson, S. I.: Effects of compost and lime amendment on soil acidity and N availability in acid sulfate soil, 19thWorld Congress of Soil Science, Soil Solutions for a Changing World, 1–6 August 2010, Brisbane, Australia, 2010.
Kissel, D., Isaac, B., Hitchcock, R., Sonon, L., and Vendrell, P.: Lime requirement by measurement of the lime buffer capacity, Report, University of Georgia, Atlanta, 1–9, 2005.
Kissel, D., Sonon, L., and Cabrera, M.: Rapid measurement of soil pH buffering capacity, Soil Sci. Soc. Am. J., 76, 694–699, https://doi.org/10.2136/sssaj2011.0091, 2012.
Kissel, D. E., Isaac, R. A., Hitchcock, R., Sonon, L. S., and Vendrell, P. F.: Implementation of soil lime requirement by a single-addition titration method, Commun. Soil Sci. Plan., 38, 1341–1352, https://doi.org/10.1080/00103620701328735, 2007.
Kopittke, P. M., Menzies, N. W., Wang, P., McKenna, B. A., and Lombi, E.: Soil and the intensification of agriculture for global food security, Environ. Int., 132, 105078, https://doi.org/10.1016/j.envint.2019.105078, 2019.
Kunhikrishnan, A., Thangarajan, R., Bolan, N. S., Xu, Y., Mandal, S., Gleeson, D. B., Seshadri, B., Zaman, M., Barton, L., and Tang, C.: Functional relationships of soil acidification, liming, and greenhouse gas flux, Adv. Agron., 139, 1–71, https://doi.org/10.1016/bs.agron.2016.05.001, 2016.
Larney, F. J. and Angers, D. A.: The role of organic amendments in soil reclamation: A review, Can. J. Soil Sci., 92, 19–38, https://doi.org/10.4141/cjss2010-064, 2012.
Lauricella, D., Butterly, C. R., Weng, Z. H., Clark, G. J., Sale, P. W. G., Li, G., and Tang, C.: Impact of novel materials on alkalinity movement down acid soil profiles when combined with lime, J. Soil. Sediment., 21, 52–62, https://doi.org/10.1007/s11368-020-02747-4, 2021.
Le, T. H. X. and Marschner, P.: Mixing organic amendments with high and low ratio influences nutrient availability and leaching in sandy soil, J. Soil Sci. Plant Nutr., 18, 952–964, https://doi.org/10.4067/S0718-95162018005002703, 2018.
Li, G., Condon, J., Hayes, R., Moroni, J. S., Lowrie, R., Lowrie, A., and Price, A.: Amelioration of subsoil acidity using organic amendments, GRDC DAN00206, Department of Primary Industries, 2019.
Li, K., Lu, H., Nkoh, J. N., Hong, Z., and Xu, R.: Aluminum mobilization as influenced by soil organic matter during soil and mineral acidification: A constant pH study, Geoderma, 418, 115853, https://doi.org/10.1016/j.geoderma.2022.115853, 2022.
Liu, M., Kissel, D. E., Vendrell, P. F., and Cabrera, M. L.: Soil lime requirement by direct titration with calcium hydroxide, Soil Sci. Soc. Am. J., 68, 1228–1233, https://doi.org/10.2136/sssaj2004.1228, 2004.
Marschner, B. and Noble, A. D.: Chemical and biological processes leading to the neutralisation of acidity in soil incubated with litter materials, Soil Biol. Biochem., 32, 805–813, https://doi.org/10.1016/S0038-0717(99)00209-6, 2000.
McCauley, A., Jones, C., and Jacobsen, J.: Soil pH and organic matter, Nutrient management module 8, no. 2, 1–12, Montana State University, http://www.msuextension.org (last access: 11 January 2024), 2009.
Mosley, L. M., Fitzpatrick, R. W., Palmer, D., Leyden, E., and Shand, P.: Changes in acidity and metal geochemistry in soils, groundwater, drain and river water in the Lower Murray River after a severe drought, Sci. Total Environ., 485, 281–291, https://doi.org/10.1016/j.scitotenv.2014.03.063, 2014.
Mosley, L. M., Willson, P., Hamilton, B., Butler, G., and Seaman, R.: The capacity of biochar made from common reeds to neutralise pH and remove dissolved metals in acid drainage, Environ. Sci. Pollut. R., 22, 15113–15122, https://doi.org/10.1007/s11356-015-4735-9, 2015.
Naorem, A., Jayaraman, S., Dalal, R. C., Patra, A., Rao, C., and Lal, R.: Soil inorganic carbon as a potential sink in carbon storage in dryland soils – A review, Agriculture, 12, 1256, https://doi.org/10.3390/agriculture12081256, 2022.
Nelson, P. N. and Su, N.: Soil pH buffering capacity: a descriptive function and its application to some acidic tropical soils, Soil Res., 48, 201–207, https://doi.org/10.1071/SR09150, 2010.
Noble, A., Zenneck, I., and Randall, P.: Leaf litter ash alkalinity and neutralisation of soil acidity, Plant Soil, 179, 293–302, https://doi.org/10.1007/BF00009340, 1996.
Noble, A. D. and Randall, P. J.: Ameliorating acid soils with organic materials: effects of amendments derived from coal on yield and composition of young wheat plants grown on an acid red podzol, Commun. Soil Sci. Plan., 29, 3023–3043, https://doi.org/10.1080/00103629809370174, 1998.
Pansu, M. and Gautheyrou, J.: Handbook of soil analysis: mineralogical, organic and inorganic methods, Springer Science & Business Media, https://doi.org/10.1007/978-3-540-31211-6, 2006.
Rayment, G. E. and Higginson, F. R.: Australian laboratory handbook of soil and water chemical methods, Inkata Press, Melbourne, ISBN 0909605688, 1992.
Sakala, G. M., Rowell, D. L., and Pilbeam, C. J.: Acid–base reactions between an acidic soil and plant residues, Geoderma, 123, 219–232, https://doi.org/10.1016/j.geoderma.2004.02.002, 2004.
Shi, R., Liu, Z., Li, Y., Jiang, T., Xu, M., Li, J., and Xu, R.: Mechanisms for increasing soil resistance to acidification by long-term manure application, Soil Till. Res., 185, 77–84, https://doi.org/10.1016/j.still.2018.09.004, 2019.
Singh, B., Dolk, M. M., Shen, Q., and Camps-Arbestain, M.: Biochar pH, Electrical Conductivity and Liming Potential, in: Biochar: A Guide to Analytical Methods, edited by: Singh, B., Camps-Arbestain, M., and Lehmann, J., 23–38, CSIRO Publishing, https://doi.org/10.1071/9781486305100, 2017.
Slattery, W. J., Ridley, A. M., and Windsor, S. M.: Ash alkalinity of animal and plant products, Aust. J. Exp. Agr., 31, 321–324, https://doi.org/10.1071/EA9910321, 1991.
Tang, C. and and Yu, Q.: Impact of chemical composition of legume residues and initial soil pH on pH change of a soil after residue incorporation, Plant Soil, 215, 29–38, https://doi.org/10.1023/A:1004704018912, 1999.
Thompson, J. S., Kissel, D. E., Cabrera, M. L., and Sonon, L. S.: Equilibration reaction from single addition of base to determine soil lime requirement, Soil Sci. Soc. Am. J., 74, 663–669, https://doi.org/10.2136/sssaj2009.0168, 2010.
Védère, C., Lebrun, M., Honvault, N., Aubertin, M.-L., Girardin, C., Garnier, P., Dignac, M.-F., Houben, D., and Rumpel, C.: How does soil water status influence the fate of soil organic matter? A review of processes across scales, Earth-Sci. Rev., 234, 104214, https://doi.org/10.1016/j.earscirev.2022.104214, 2022.
Walkley, A. and Black, I. A.: An examination of the Degtjareff method for determining soil organic matter, and a proposed modification of the chromic acid titration method, Soil Sci., 37, 29–38, https://doi.org/10.1097/00010694-193401000-00003, 1934.
Wang, X., Tang, C., Mahony, S., Baldock, J. A., and Butterly, C. R.: Factors affecting the measurement of soil pH buffer capacity: approaches to optimize the methods, Eur. J. Soil Sci., 66, 53–64, https://doi.org/10.1111/ejss.12195, 2015.
Xu, J. M., Tang, C., and Chen, Z. L.: Chemical composition controls residue decomposition in soils differing in initial pH, Soil Biol. Biochem., 38, 544–552, https://doi.org/10.1016/j.soilbio.2005.06.006, 2006b.
Yuan, J. H. and Xu, R. K.: The amelioration effects of low temperature biochar generated from nine crop residues on an acidic Ultisol, Soil Use Manage., 27, 110–115, https://doi.org/10.1111/j.1475-2743.2010.00317.x, 2011.
Yuan, J.-H., Xu, R.-K., and Zhang, H.: The forms of alkalis in the biochar produced from crop residues at different temperatures, Bioresource Technol., 102, 3488–3497, https://doi.org/10.1016/j.biortech.2010.11.018, 2011.