the Creative Commons Attribution 4.0 License.
the Creative Commons Attribution 4.0 License.
 | 18 Apr 2024
A millennium of arable land use – the long-term impact of tillage and water erosion on landscape-scale carbon dynamics
Lena Katharina Öttl
Florian Wilken
Anna Juřicová
Pedro V. G. Batista
Peter Fiener
In the last decades, soils and their agricultural management have received great scientific and political attention due to their potential to act as a sink of atmospheric carbon dioxide (CO2). Agricultural management has strong potential to accelerate soil redistribution, and, therefore, it is questioned if soil redistribution processes affect this potential CO2 sink function. Most studies analysing the effect of soil redistribution upon soil organic carbon (SOC) dynamics focus on water erosion and analyse only relatively small catchments and relatively short time spans of several years to decades. The aim of this study is to widen this perspective by including tillage erosion as another important driver of soil redistribution and by performing a model-based analysis in a 200 km2 sized arable region of northeastern Germany for the period since the conversion from forest to arable land (approx. 1000 years ago). The spatially explicit soil redistribution and carbon (C) turnover model SPEROS-C was applied to simulate lateral soil and SOC redistribution and SOC turnover. The model parameterisation uncertainty was estimated by simulating different realisations of the development of agricultural management over the past millennium. The results indicate that, in young moraine areas, which are relatively dry but have been intensively used for agriculture for centuries, SOC patterns and dynamics are substantially affected by tillage-induced soil redistribution processes. To understand the landscape-scale effect of these redistribution processes on SOC dynamics, it is essential to account for long-term changes following land conversion as typical soil-erosion-induced processes, e.g. dynamic replacement, only take place after former forest soils reach a new equilibrium following conversion. Overall, it was estimated that, after 1000 years of arable land use, SOC redistribution by tillage and water results in a current-day landscape-scale C sink of up to 0.66 ‰ yr−1 of the current SOC stocks.
- Article
(5019 KB) - Full-text XML
- BibTeX
- EndNote


Soils play an important role in the global carbon (C) cycle (Bellamy et al., 2005; Berhe et al., 2008; Lal, 2004) and have received great scientific (e.g. Amelung et al., 2020; Bellassen et al., 2022; Van Oost et al., 2007) and political attention as one of the cornerstones to tackle climate change, e.g. the 4 ‰ Initiative (Minasny et al., 2017), Article 3.4 of the Kyoto Protocol (United Nations Framework Convention on Climate Change, 1998), and the IPCC Special Report (Intergovernmental Panel on Climate Change, 2019).
A substantial loss of soil organic carbon (SOC) to the atmosphere before industrialisation is generally associated with the conversion of (natural) forest sites to cropland (Lal, 2019; Le Quéré et al., 2016; Sanderman et al., 2017). However, tillage operations and water erosion lead to an accelerated lateral redistribution of SOC within agricultural landscapes (Montgomery, 2007). In consequence, the spatial variability of SOC within the soils of arable landscapes increase, but this also creates complex interactions between changing SOC profiles, site-specific C mineralisation and sequestration, and potential losses to aquatic ecosystems (Doetterl et al., 2016). In a nutshell, (i) the removal of SOC-rich topsoil at erosional areas stimulates dynamic replacement of C via fresh photosynthates and the uplift of more reactive subsoil minerals (Harden et al., 1999; Stallard, 1998). (ii) During transport by different erosion agents, some SOC might be mineralised due to erosion-induced aggregate breakdown (Doetterl et al., 2016); however, this has a relatively short-lived effect due to the episodic nature of erosion processes (Van Oost and Six, 2023). (iii) At depositional sites, SOC is buried in deeper soil layers and hence is protected from fast mineralisation (Berhe et al., 2008; Rumpel and Kögel-Knabner, 2011; Stallard, 1998). (iv) In the case of water erosion, SOC will also partly enter aquatic ecosystems, where it is either buried in sedimentary deposits or mineralised during fluvial transport (Aufdenkampe et al., 2011; Battin et al., 2009).
The impact of soil redistribution on C dynamics has been assessed in various studies as reviewed in, e.g. Doetterl et al. (2016), Kirkels et al. (2014), and Van Oost and Six (2023). Such studies have often benefited from a strong modelling component, which has been explored by both process-oriented models and more conceptual approaches. Most process-oriented studies focused on water-erosion-prone micro-catchments, where field surveys regarding spatial patterns of SOC and erosion, or general erosion monitoring, can be used for model development and testing (e.g. Doetterl et al., 2012; Van Oost et al., 2005; Wilken et al., 2017a). The focus on small erosion-prone catchments has several implications: (i) results can only be partially generalised as these small-scale water erosion studies tend to be located in steeper areas; (ii) water erosion studies are often associated with loess-burden soils (e.g. Dlugoß et al., 2012; Li et al., 2007; Wilken et al., 2017a), which, although highly erodible, are also deep and display a low sensitivity to soil truncation regarding crop productivity; and (iii) the focus on water erosion makes it difficult to close the C balance as the fate of SOC after leaving the micro-catchment is open to debate (Aufdenkampe et al., 2011; Battin et al., 2009; Van Oost and Six, 2023). Apart from these process-oriented studies, there are also regional (Lugato et al., 2018; Nadeu et al., 2015) and even global (Naipal et al., 2018; Van Oost et al., 2007) model-based estimates of the effect of soil redistribution on SOC stocks, which are based on coupled conceptual soil erosion and C turnover models. These (water erosion) modelling studies give valuable insights for large areas but are mostly focused on current erosion and C turnover (e.g. Nadeu et al., 2015; Van Oost et al., 2007), while long-term effects of erosion-induced C dynamics after centuries or even millennia of land management are ignored. In consequence, model results might overestimate the effect of intensive modern agriculture as they typically only take the last 50 to 100 years into account (e.g. Dlugoß et al., 2012; Nadeu et al., 2015; Wilken et al., 2017b). Only a few of these regional studies addressed longer timescales (e.g. Bouchoms et al., 2017; Wang et al., 2017), which is a prerequisite to compare today's SOC profiles with model outputs in regions with a long agricultural land use history.
However, such long-term regional erosion and C turnover modelling is obviously challenged by the rapid decline in data accessibility and quality when moving back for centuries or even millennia. Apart from natural factors (e.g. climate, topography, soil cover, soil development), it is most challenging to reconstruct factors governed by agricultural practices (e.g. crop rotations, productivity, modification of soil cover, tillage methods). Moreover, estimates of initial (undisturbed) soil conditions (especially SOC stock profiles) are required to initiate long-term modelling. The existing long-term modelling studies (Bouchoms et al., 2017; Wang et al., 2017) used undisturbed soil profiles from long-term arable land, while, to our knowledge, studies accounting for the decline in SOC following conversion from forest to arable land in combination with erosion-induced C fluxes have not been carried out. Moreover, tillage erosion has been shown to be the main soil redistribution process in different parts of the world (e.g. Gerontidis et al., 2001; Lobb et al., 1995; Van Oost et al., 2003), and ignoring its effects on long-term C dynamics might lead to spurious conclusions.
Any large-scale and long-term study faces the challenge of assumption-based input data. Hence, the aim of large-scale and long-term modelling must be to simulate plausible patterns instead of process-based reconstruction. The aims of this study are (i) to simulate long-term changes (1000 years) in soil profiles in an agricultural landscape heavily affected by tillage erosion and less affected by water erosion, (ii) to perform a model-based soil redistribution and SOC turnover analysis for a larger area (about 200 km2) in order to avoid a systematic bias typically found in small-scale studies focussing on erosion processes in steep areas, and (iii) to model the long-term effect of soil redistribution when moving from a SOC-rich forest soil to a heavily eroded arable soil after 1000 years of cultivation.
2.1 Study area
The study area covers an area of 196 km2 and is located in the Quillow river catchment about 100 km north of Berlin in northeastern Germany (Fig. 1). It represents a typical ground moraine landscape formed after the retreat of the Weichselian glaciers ca. 20 000–15 000 years ago (shaded area in Fig. 1; Lüthgens et al., 2011). The area is characterised by a hilly topography with short summit–footslope distances (on average 35 m) and a mean slope (± standard deviation) of ca. 4.4 % ± 3.7 %. A large number of kettle holes that were formed by the delayed melting of bigger ice blocks (Anderson, 1998) are typical landscape elements. Drainage is only possible via sub-surface flow from the kettle holes (Lischeid et al., 2017). The kettle holes can be filled with water or (degraded) peat or are covered by colluvial material resulting from arable land use over centuries (Van der Meij et al., 2019).
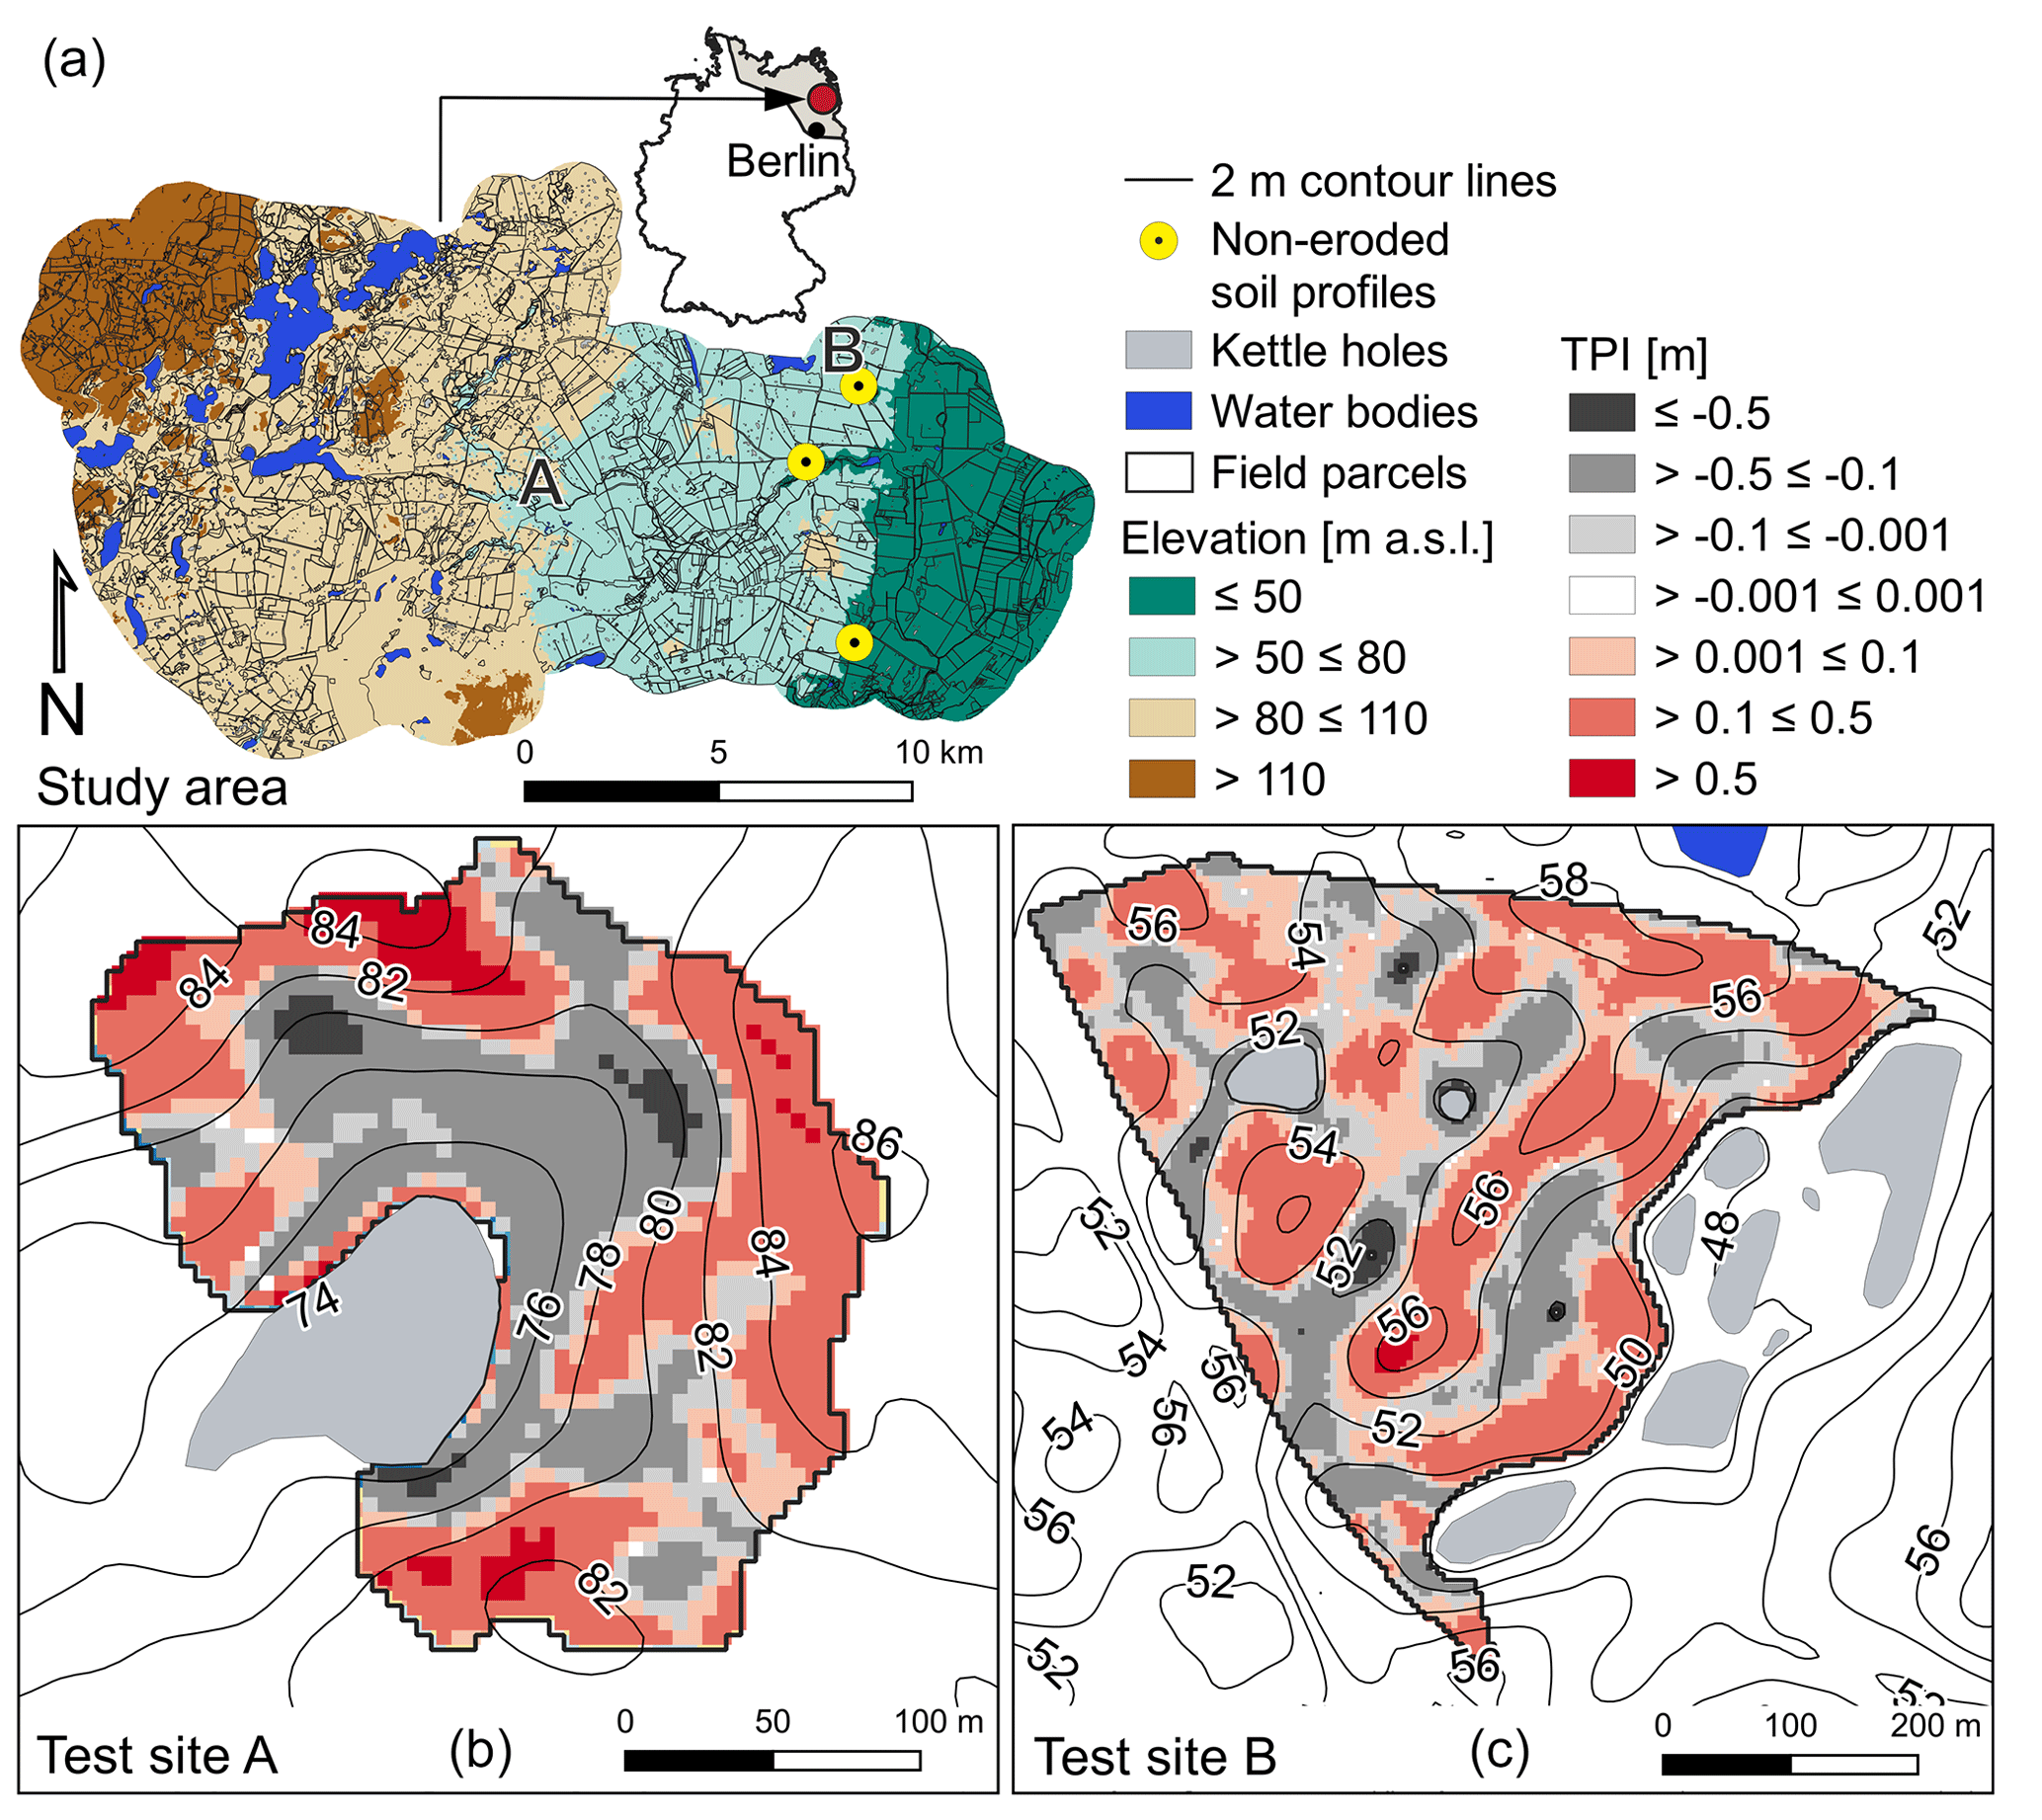
Figure 1The study area is located north of Berlin in the young moraine landscape of northeastern Germany, indicated by the grey area of the inset map (a). Location of the two test sites A and B (black letters), as well as of the four non-eroded soil profiles used for calibration (yellow circles) within the study area. Thereby, the yellow circle close to test site B represents two profiles. Topographic position index (TPI) in metres and kettle holes of test site A (b) and B (c) with 2 m contour lines (black lines). Positive TPI values indicate hilltops and knolls, while negative TPI values represent depressions.
The land cover of the study area is dominated by arable land and pasture (ca. 70 %), followed by wetlands and lakes (ca. 16 %), while only a small part is made up of forest (ca. 11 %) and settlements (ca. 3 %; Heinrich et al., 2018). Some parts of the study area have been used for agriculture since Neolithic times (ca. 5500 BCE; Behre, 2008), while it is assumed that agricultural land use became widespread approximately in 1000 CE (Behre, 2008; Herrmann, 1985). Intensive mechanisation of agriculture started in the second half of the 20th century. This was accompanied by a substantial increase in field sizes during the socialistic era of the German Democratic Republic (Bayerl, 2006), resulting in recent average field sizes of 21 ha (± 20 ha). The region is characterised by a relatively dry subcontinental climate, with an average annual air temperature of 9.4 °C and a mean annual precipitation of 466 mm (20-year average, 2001–2020, DWD meteorological station at Grünow; DWD Climate Data Center (CDC), 2018, 2021).
The soil pattern of the region follows the heterogeneity of Pleistocene deposits and has been strongly modified by soil redistribution over the past centuries (Deumlich et al., 2010; Sommer et al., 2008; Koszinski et al., 2013). Nowadays, non-eroded soils can only be found in ca. 20 % of the arable land, mainly at lower midslopes or flat plateaus. Thereby, extremely eroded soils occur at hilltops, ridges, and slope shoulders, while strongly eroded soils are found from slope shoulders to upper midslopes. Groundwater-influenced colluvial soils have developed at footslopes of closed depressions, which are often covering fossil peat (see more details in Öttl et al., 2021).
Within the Quillow study area, two agricultural fields (Fig. 1) were chosen to test the plausibility of the modelling results (i.e. current estimates of SOC stocks and patterns). They were selected because of existing SOC data from previous studies (Wehrhan and Sommer, 2021; Wilken et al., 2020). Test site A is located approximately in the centre of the study area, belonging to the village Christianenhof (53.3550° N, 13.6643° E), and has a size of ca. 4.4 ha and a mean slope of 8.7 % ± 3.9 %. Test site B is in the northeast of the study area, close to the village Holzendorf (53.3836° N, 13.7818° E), and has an area of ca. 20.5 ha and a mean slope of 5.5 % ± 2.9 %.
2.2 Modelling approach
The spatially explicit soil redistribution and C turnover model SPEROS-C (Dlugoß et al., 2012; Fiener et al., 2015; Van Oost et al., 2005) was applied for modelling tillage- (TIL) and water-induced (WAT) soil redistribution in the mesoscale study catchment over the past millennium. Thereby, lateral soil and SOC redistribution, SOC turnover, and vertical mixing within the profile (spatial and vertical resolutions of 5 m × 5 m and 10 increments of 0.1 m soil depth increments, respectively) were simulated. To isolate C fluxes that occur solely due to total soil redistribution (TOT is the sum of TIL and WAT), a reference run simulating C fluxes without lateral soil redistribution was calculated, i.e. vertical C fluxes solely due to C input and decomposition. Modelling soil redistribution and C dynamics required estimating and calibrating model input parameters and their uncertainty, as well as evaluating the model outputs. The single steps are described in detail in the following section.
2.2.1 Modelling soil redistribution and SOC dynamics
Tillage-induced (TIL) soil redistribution is calculated based on a diffusion-type equation developed by Govers et al. (1994) (Eq. 1). The net soil flux due to tillage Qtil (kg m−1 yr−1) can be written as
whereby ktil is the tillage transport coefficient (kg m−1 yr−1), s is the local slope (%), h is the height at a given point of the hillslope (m), and x is the soil translocation distance in horizontal direction (m). The local tillage-induced soil redistribution rate Etil (kg m−1 yr−1) is calculated as
Thereby, the intensity of the calculated erosion rates is determined by the ktil, and the change in slope gradient determines the spatial pattern of tillage-induced soil redistribution.
Water-induced (WAT) soil redistribution is calculated according to a slightly modified approach of the Revised Universal Soil Loss Equation (RUSLE; Renard et al., 1997), which is described in detail in Van Oost et al. (2000). A local transport capacity Tc (kg m−1 yr−1; Eq. 3) determines whether erosion, sediment transport, or deposition occurs. If the sediment inflow is higher than Tc, the excess is deposited, while the Tc is further routed downstream.
In the above, ktc is the transport capacity coefficient (m); P, C, K, and R are the RUSLE factors; and LS2D is a grid-cell-specific topographic factor calculated following Desmet and Govers (1996).
With regard to the SOC turnover model, SOC stocks are modelled for a soil profile with 10 soil layers of 0.1 m. The model equations describing the SOC depth profile and SOC decay are based on the Introductory Carbon Balance Model (ICBM; Andrén and Kätterer, 1997; Kätterer and Andrén, 1999). The ICBM considers a young (Y) and old (O) C pool with different turnover rates (kY=0.8 yr−1, kO=0.006 yr−1). The fraction of the annual flux from Y to O is determined by the humification coefficient h. External environmental factors relating to climate and soils are combined in the factor r, and the mean annual C input to the soil is represented by the parameter i (Andrén and Kätterer, 1997). The dynamics of the two SOC pools are described by the following differential equations (Andrén and Kätterer, 1997):
SOC turnover rates are assumed to decrease exponentially with depth due to a decreasing influence of environmental conditions (Eq. 6; Rosenbloom et al., 2001).
Annual C input i (g C m−2 yr−1) is derived from crops (ic) and manure (im; Eq. 7). Thereby, ic is made up of an aboveground and a belowground component. Crop residues are determined by the residue-to-aboveground-biomass (AGBM) ratio (Res). The fraction of C input from roots and rhizodeposition (pz) at a given soil depth z (m) is defined by the root-to-AGBM ratio (RS). For ic, a C content (Ccont) of 0.45 is used (Eq. 8; Tum and Günther, 2011).
The C input into the soil is modelled by assuming an exponential root density profile (Gerwitz and Page, 1974; Van Oost et al., 2005), while manure input is only assigned to the plough layer (or layers). The allocation of total root dry matter to each soil layer z (m) was calculated according to a reference soil depth zr=0.25 m (Van Oost et al., 2005) and a constant c that determines the proportion of the roots per soil layer (pz; Eq. 9).
The humification coefficient h is weighted according to the proportion of the source of i and depends on clay content cp (%) (Eq. 10; Kätterer and Andrén, 1999).
The temperature response factor r that accounts for the environmental influence on SOC decay is calculated with the following exponential Q10 function (Kätterer et al., 1998; Van Oost et al., 2005):
Thereby, r is estimated with a Q10 value of 2.07 (Kätterer et al., 1998) and a temperature T (°C) calibrated for this study (as described below) and by correcting temperature by the annual mean temperature of central Sweden (+5.4 °C; Andrén and Kätterer, 1997).
With regard to the soil profile update, after every time step, the SOC profile is updated considering yearly soil loss and gain due to tillage and water erosion. At eroding sites, a fraction of SOC from the first subsoil layer equal to the thickness of the eroded layer is incorporated into the plough layer. Hence, erosion also leads to an uplift of soil into the deepest layer. At depositional sites, a fraction of the SOC from the plough layer is shifted downwards into a buried plough layer. The underlying subsoil layers are further buried according to the depth of the soil deposition in that time step (Dlugoß et al., 2012; Van Oost et al., 2005). Topographic change corresponding to soil redistribution was not taken into account to avoid blurring the mass balance of SOC. As this overstates the amount of buried C, we created two model runs of vertical C fluxes, either taking deeply buried C (> 1 m soil depth) into account or not to show the effect of deep C burial on the C balance of the whole study region.
To account for the development of tillage implements and practices (Fig. 2a, Table in the Appendix), plough depth was updated with time but kept constant through periods without significant changes in historical plough development. Based on a literature review, we changed plough depth from 0.1 m for the first 800 years of the model simulations to 0.2 m for 1800–1900 CE and to 0.3 m for 1900–2000 CE (Fig. 2c). The yearly vertical C fluxes are then calculated following the profile update.
2.2.2 Model implementation
One of the major challenges in performing a model-based analysis of the impacts of 1000 years of soil erosion upon C fluxes in an area of ca. 200 km2 is to estimate reasonable model inputs and to determine appropriate model parameters. Obviously, this is associated with large uncertainties and requires substantial simplifications. It is important to note that the model allows a reasonable analysis of the importance of soil redistribution for the C balance of the entire study area, but it is not expected to exactly mimic the current observational data.
In terms of model realisations, due to the uncertainties in the main model input parameters for the erosion modelling and to account for the varying importance of TIL and WAT, we created nine model realisations (R1–R9, Table 1). The realisations were simulated by a combination of low, medium, and high water erosion pathways, indicated by the minimum, the mean, and the maximum values of the C, K, and R factors, as shown in Fig. 2b, with a low, medium, and high tillage erosion pathway using the different ktil values from Fig. 2a. The theoretical background that led to the erosion pathways is explained in detail in the next paragraphs. It is important to note that the variation in TIL and WAT is set to the relative importance of tillage and water erosion in the region as determined in earlier studies (Öttl et al., 2021; Wilken et al., 2020). Due to the large computing requirements in simulating 1000 years for roughly 8 × 10⁶ raster cells of the entire study area, we only modelled the different realisations for the test fields (Fig. 1; together, roughly 10 × 103 raster cells). The most plausible realisation (as defined below) was later used to model the entire study area.
Table 1Combination of three scenarios of the tillage-induced (TIL) soil redistribution parameter ktil with three scenarios of the water-induced (WAT) soil redistribution parameters (C, K, and R factor) results in nine realisations.
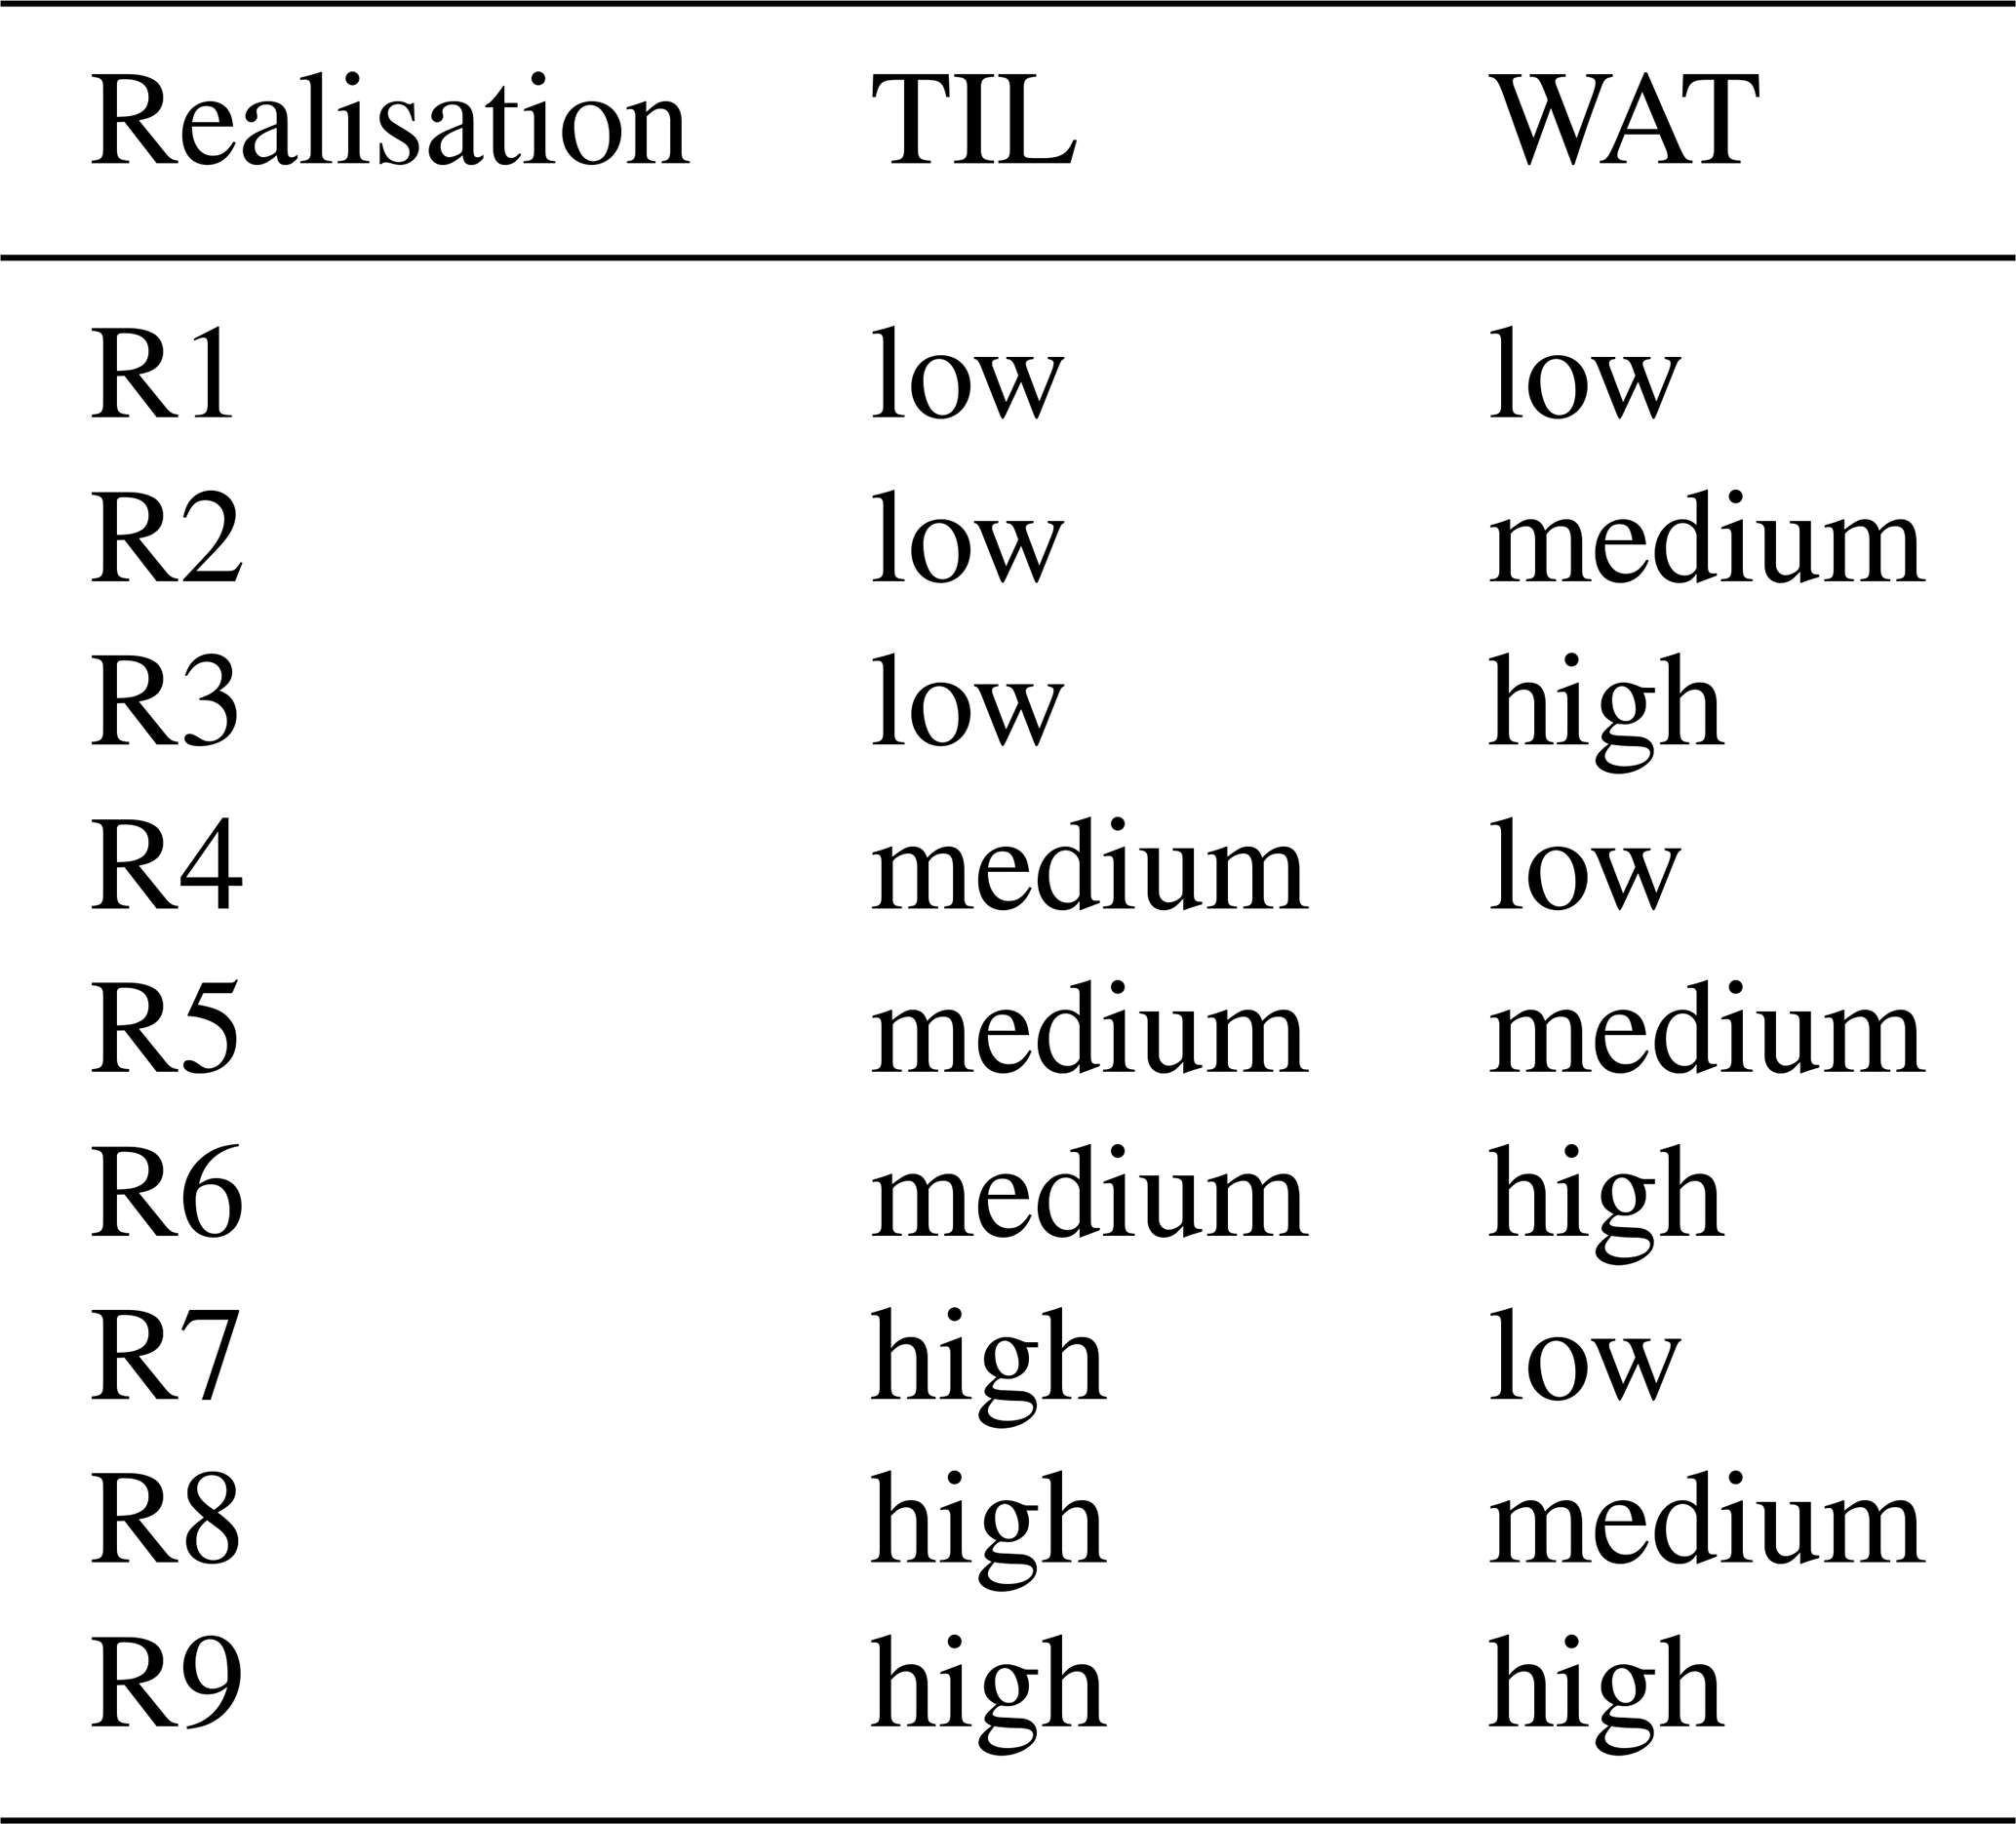
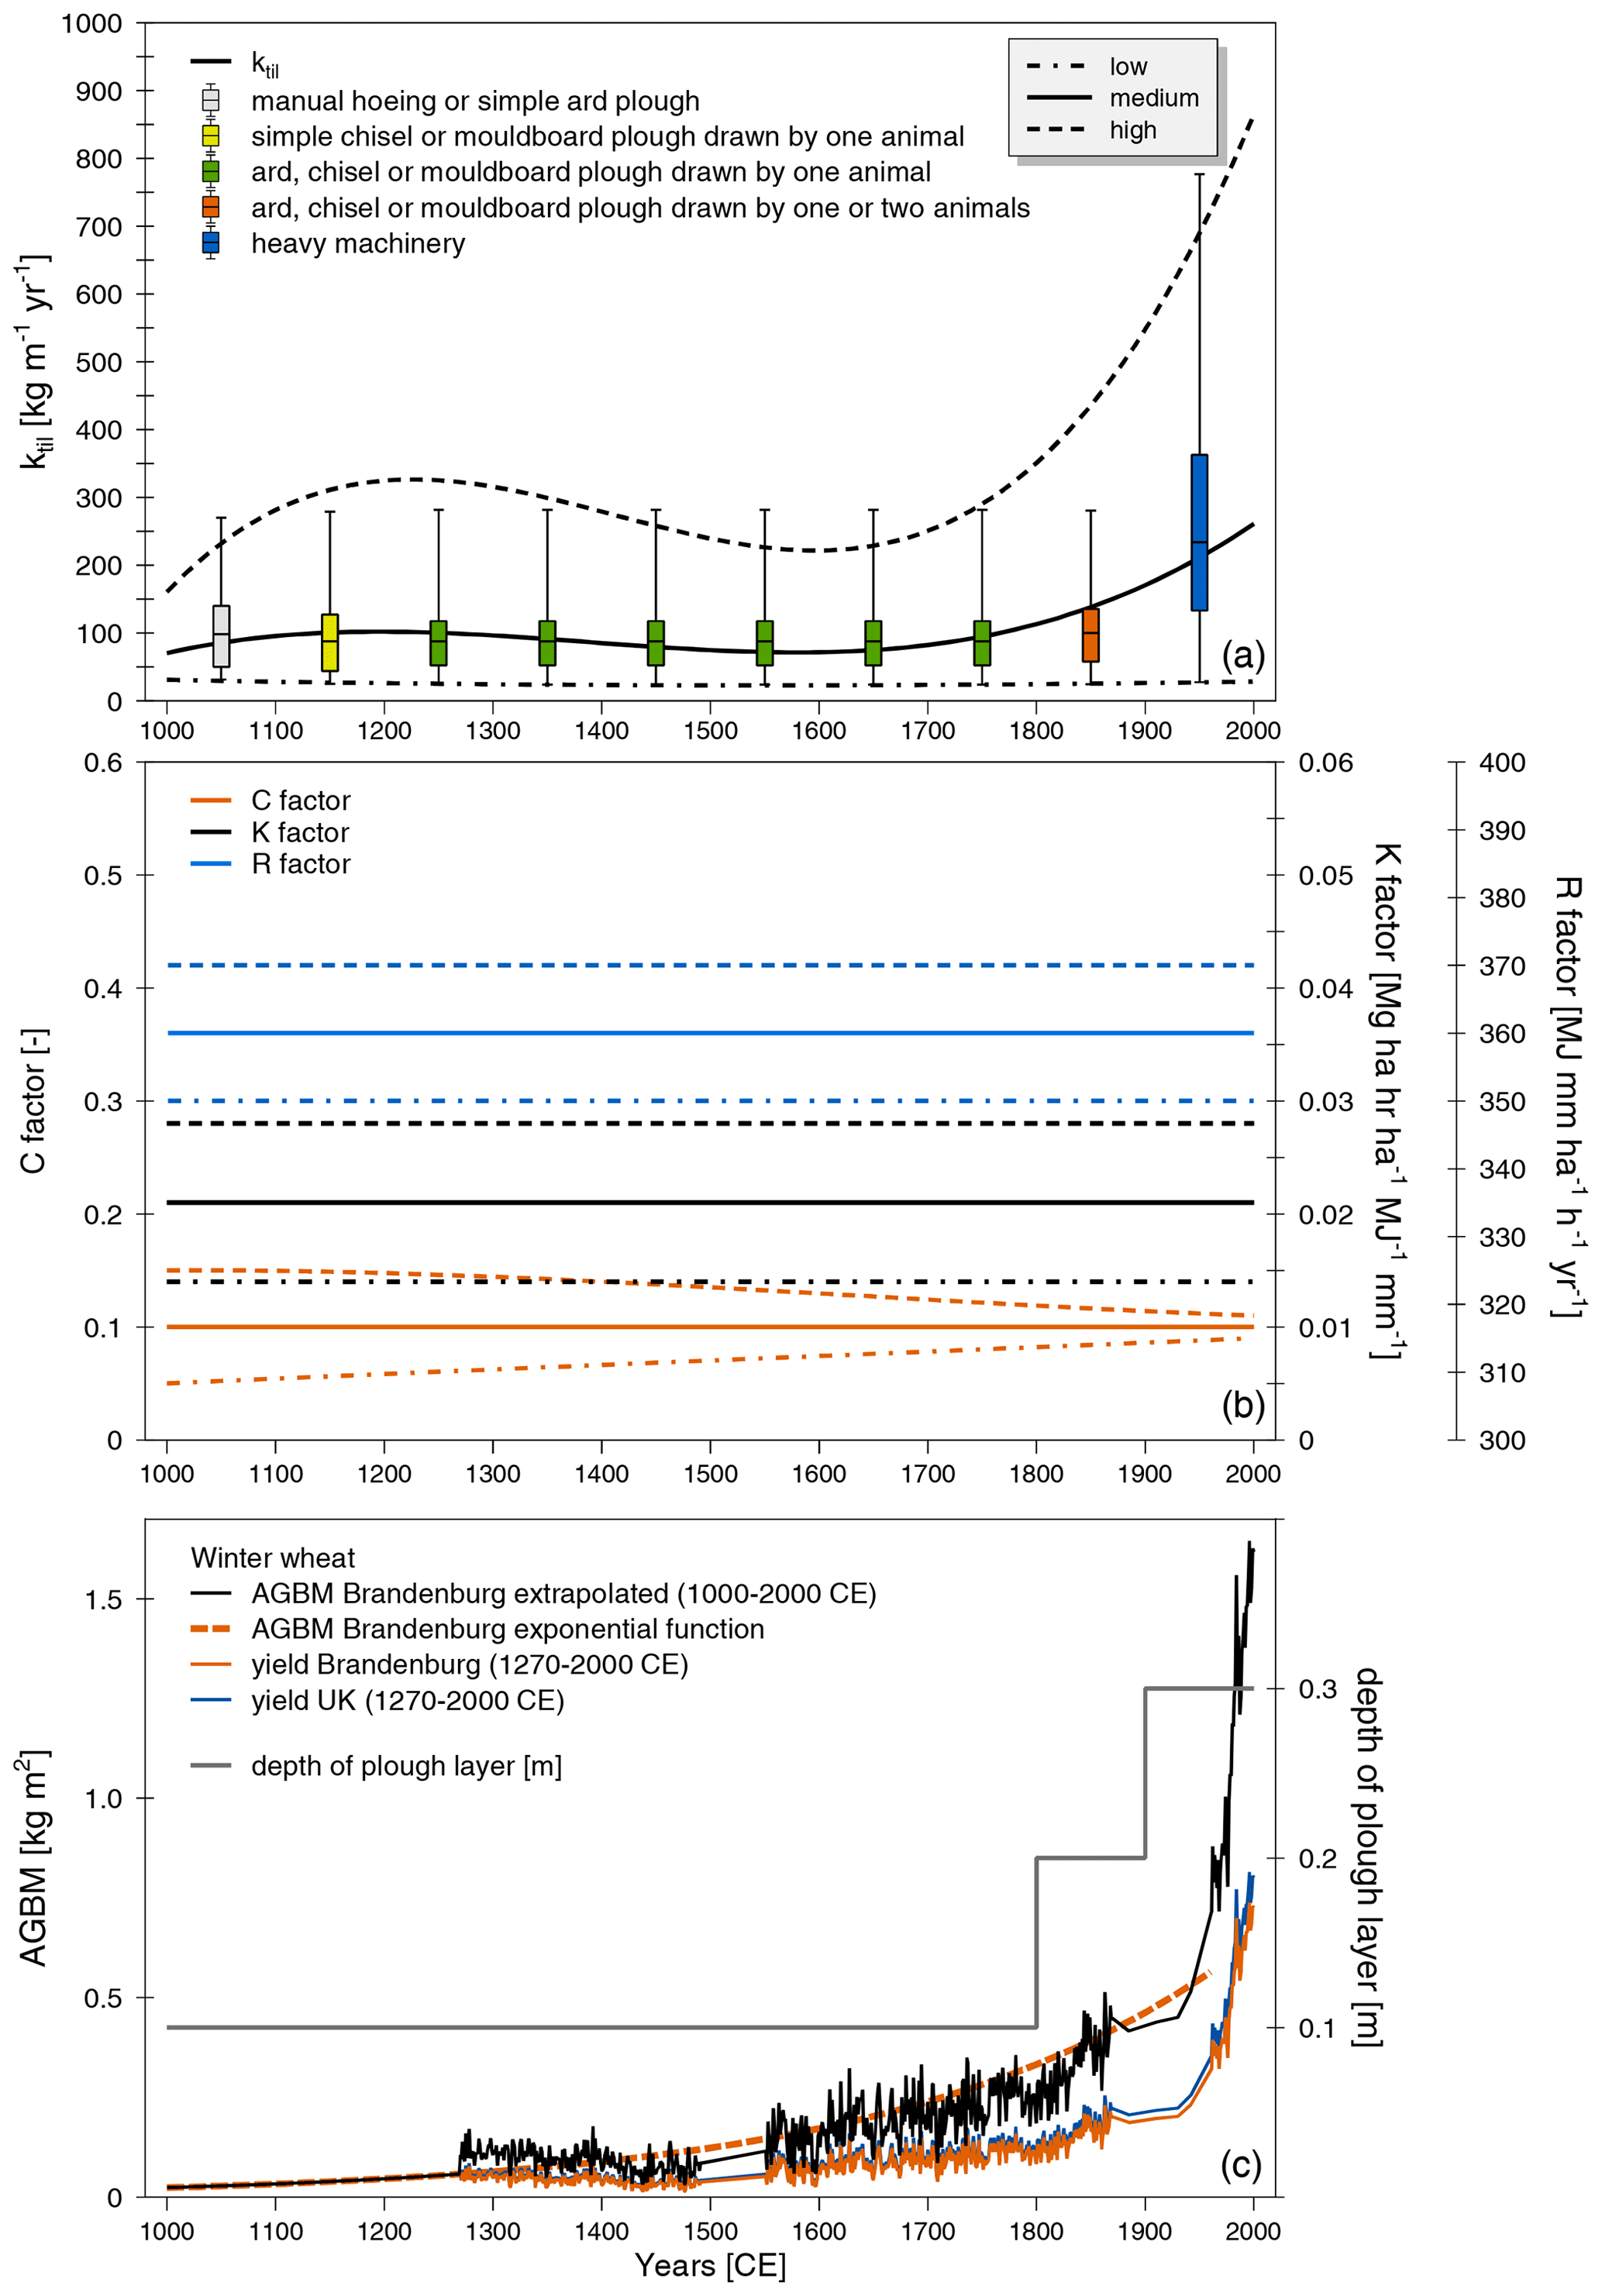
Figure 2Range of reasonable input parameters for modelling tillage- (a) and water-induced soil redistribution (b) and SOC dynamics (c) for the model period of 1000 years. The range of parameters in (a) and (b) (dashed-dotted for the lower range and dashed lines for the upper range; solid line represents the mean) is used in the different model realisations. Please notice the different scales of the y axes. Abbreviations: ktil is the tillage transport coefficient; AGBM refers to aboveground biomass; and C, R, and K factors are the factors of the RUSLE (Eq. 3). Information on data sources and an explanation of the parameters can be found in the text.
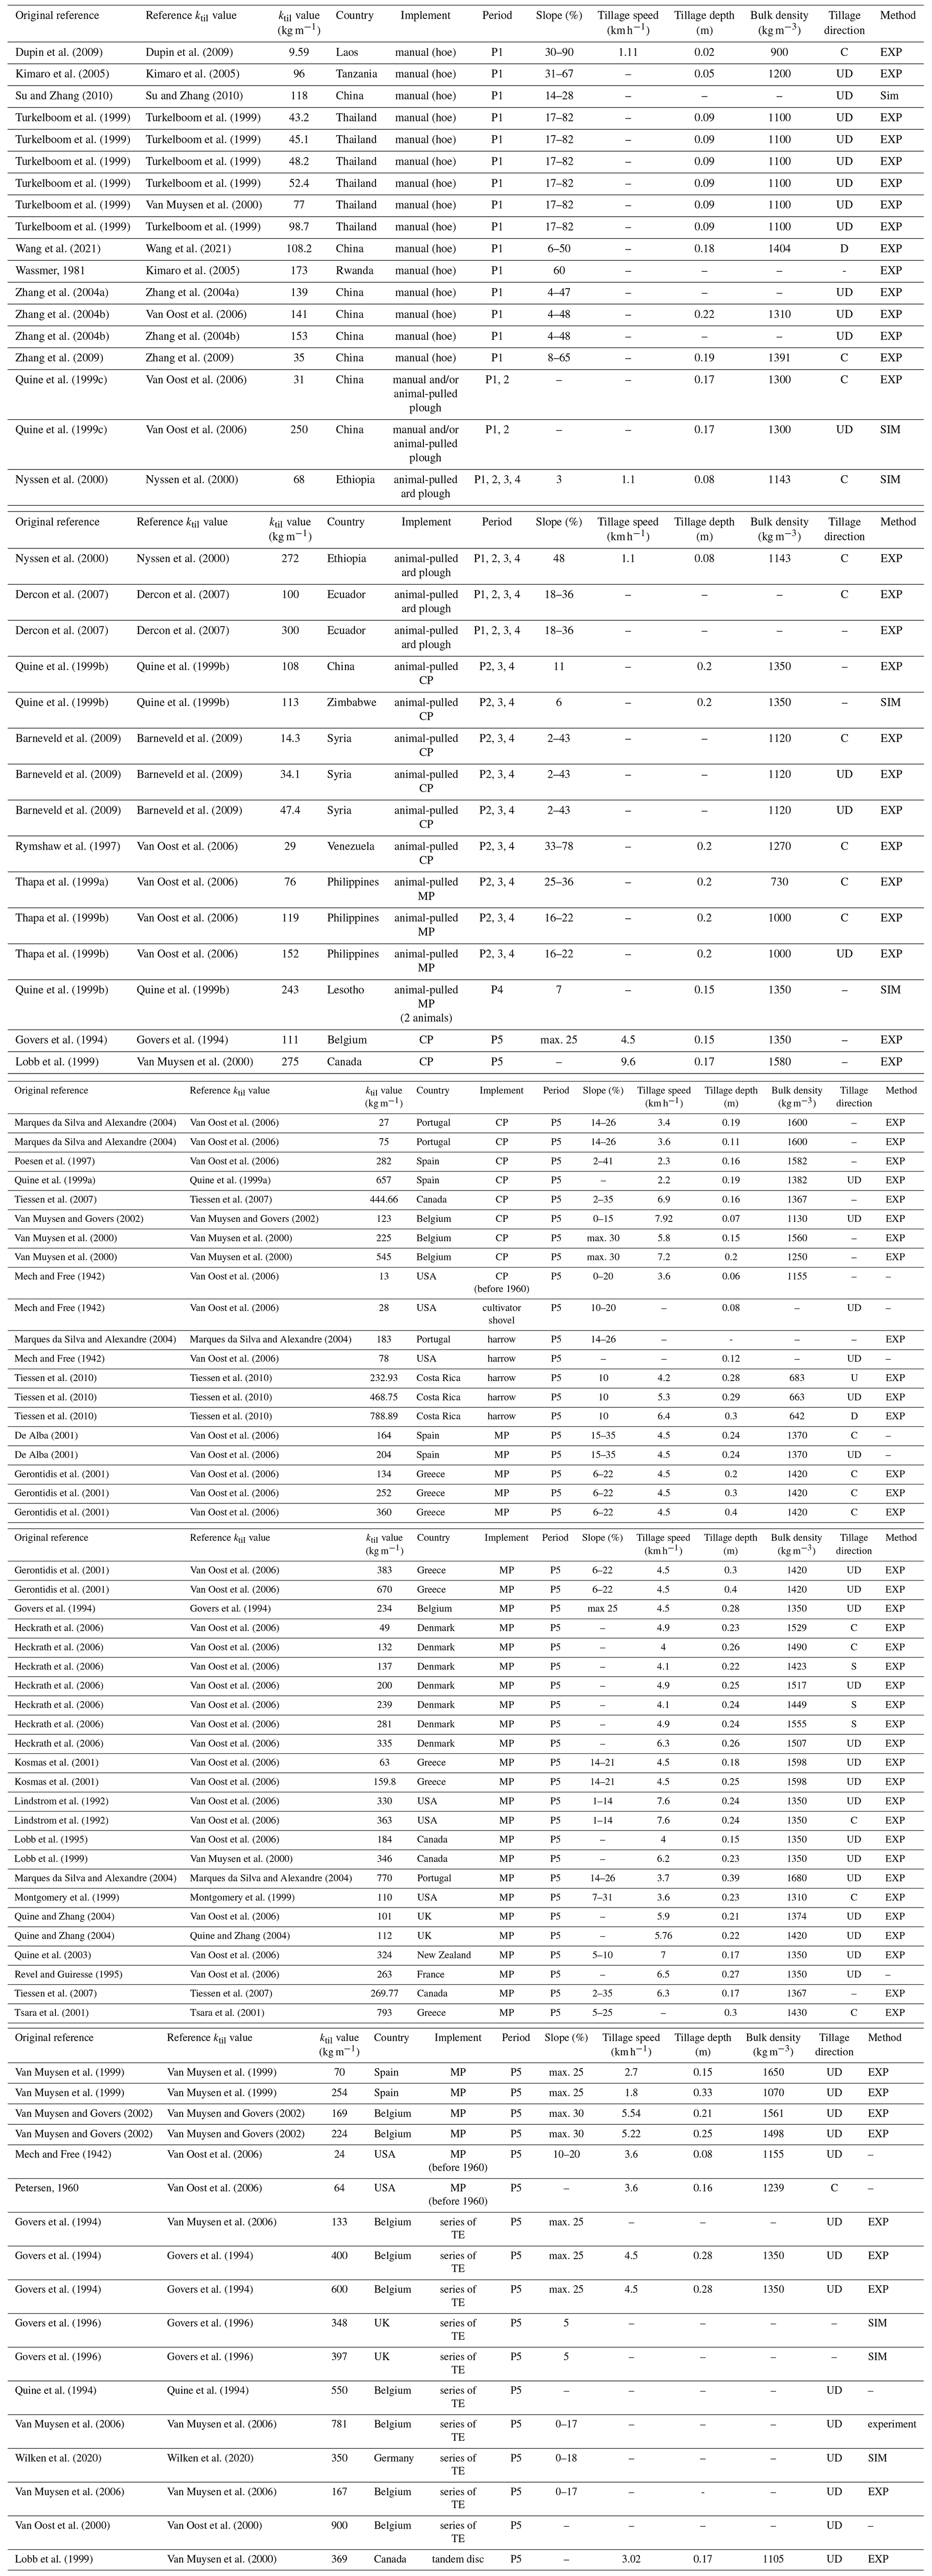
With regard to tillage-induced soil redistribution, a comprehensive literature review (comprising 47 original publications representing 137 ktil values; Table ) was performed to assess the tillage erosion intensity of different soil cultivation techniques. According to the land use history of the study region, the model period was subdivided into five periods representing different soil cultivation techniques.
For the first period (1000–1100 CE), the median ktil of 98 kg m−1 (min. 9, max. 300 kg m−1) was calculated from 23 ktil values for manual hoeing or the use of a simple ard (Table ). Although the medieval mouldboard plough was invented around 200–900 CE (Van der Meij et al., 2019), it was assumed that not every farmer practised mouldboard ploughing and that manual hoeing or simple ard ploughs were still widely used in the first period (Behre, 2008; Herrmann, 1985).
For the second period (1100–1800 CE), it was assumed that an increasing number of farmers used a rudimentary chisel or mouldboard plough drawn by an animal as the turning plough was introduced around 1000 CE (Behre, 2008; Herrmann, 1985). As not much further information is available until the end of the 18th century, we used a set of 30 ktil literature values representing an ard, chisel, or mouldboard plough drawn by a single animal. The median ktil of these studies is 88 kg m−1 (min. 14, max. 300 kg m−1; Table ).
The fourth period (1800–1900 CE) was characterised by the industrial revolution that tremendously changed the way land was managed. From 1800 onwards, the so-called “Ruchadlo”, a steep-turning tipping plough (Herrmann, 1985), and the “Mecklenburgischer Haken”, for seedbed preparation, were used (Behre, 2008). Both implements were pulled by animals (oxen or horses). A median ktil of 100 kg m−1 (min. 14, max. 300 kg m−1) was calculated from 15 ktil values for an ard, chisel, or mouldboard plough pulled by one or two animals (Table ).
The last period (1900–2000 CE) is characterised by the introduction of automotive tractors that were able to pull heavy implements; in consequence, the ploughing depths increased to 20–40 cm (Behre, 2008; Bork et al., 1998; Van der Meij et al., 2019). The median ktil of 234 kg m−1 (min. 13, max. 900 kg m−1) was calculated from 69 ktil values for tractor-pulled heavy machinery (early and recent chisel and mouldboard plough, harrow, cultivator, tandem disc, etc.; Table ).
With regard to water-induced soil redistribution, a range of C factor values were estimated to represent the changes in crop cover and/or management throughout the simulation period (Fig. 2b). As such, two different conditions were assumed: for the upper limit of the parameter space, it is assumed that the crop cover was low (i.e. high C factor) at the beginning of the simulation period due to relatively lower yields and high row spacing. For the lower limit, it is assumed that a much lower historic C factor might be reasonable due to a high vegetation cover related to a high proportion of weeds and grasses between the crops, which decreased over time due to improved weeding methods. To account for this uncertainty over time, we assumed that, at 1000 CE, the C factor might be either 50 % higher or lower than the current mean value. This range decreased according to a polynomial function (degree =3) until reaching ± 10 % of the current value in 2000 CE. The current mean C factor of 0.1 was calculated assuming a small-grain crop rotation (e.g. winter wheat – winter wheat – winter barley – winter rapeseed), typically applied under today’s conditions (Deumlich et al., 2002; Öttl et al., 2021; Schwertmann et al., 1987).
The soil erodibility factor K was assumed to remain constant throughout the simulation period and was calculated based on a soil group map (Bundesministerium der Finanzen, 2007; Rust, 2006), following the approach as described in DIN ISO (2017). The area-weighted mean K factor of 0.021 Mg ha h ha−1 MJ−1 mm−1 was used as medium realisation (Fig. 2b). The lower and upper parameter values used for creating the model realisations are the area-weighted mean plus or minus the standard deviation of the K factor, respectively (0.021 ± 0.007 Mg ha h ha−1 MJ−1 mm−1).
The rainfall erosivity factor R was calculated based on a long-term precipitation reconstruction for Europe (1500-2000 CE; Pauling et al., 2005) and the approach of Diodato et al. (2017) developed to estimate long-term erosion changes from historic precipitation data. As no precipitation data were available for the period 1000–1500 CE, the mean R factor of the available data (362 MJ mm ha−1 h−1 yr−1 for 1500–2000 CE) was used as the mean for the whole modelling period (Fig. 2b). To address a potential range in the R factor, we used the mean ± 95 % confidence interval (362 ± 8.3 MJ mm ha−1 h−1 yr−1; Fig. 2b).
For this study, a constant transport capacity coefficient ktc of 150 m was used as this value was found to be suitable for cropland and a grid resolution of 5 m × 5 m (Dlugoß et al., 2012; Van Oost et al., 2003). The grid-cell-specific topographic factor LS2D was calculated based on a digital elevation model (DEM; derived from airborne laser scanning; original spatial resolution of 1 m resampled to 5 m; Landesamt für Umwelt, Gesundheit und Verbraucherschutz Brandenburg und Landesvermessung und Geobasisinformation Brandenburg, 2012). The support practice factor P is 1.0 for all realisations for the whole modelling period as no erosion control practices are assumed.
Both water and tillage erosion are sensitive to field sizes and layouts, which, according to historic maps and later aerial photographs, substantially changed over time. As we could not reconstruct field layout over 1 millennium for the entire test area, it was decided to use recent field layouts. However, as the recent fields are very large, this leads to an underestimation of potential field border effects.
With regard to SOC turnover, to model SOC dynamics over 1000 years, SPEROS-C needs yearly estimates of C inputs based on AGBM and estimates of ploughing depths (Fig. 2c) as these variables change the C incorporation into the soil. To calculate the temporal evolution of AGBM (Fig. 2c), yield data for the federal state of Brandenburg from 1950 to 2018 CE (Federal Statistical Office, 1990–2018; Staatliche Zentralverwaltung für Statistik, 1956–1990) were combined with a long-term winter wheat yield dataset of the UK (1270–2014 CE; Ritchie and Roser, 2013). Yield was converted to AGBM by multiplying with the harvest index (HI; Donald and Hamblin, 1976), which determines the proportion of yield to total biomass for specific crop species. The HI was calculated with winter wheat grain and straw data from Brandenburg (mean HI = 0.449; Kuratorium für Technik und Bauwesen in der Landwirtschaft e. V. (KTBL), 1951). We assumed that, for every third year of the simulation, the AGBM would not be harvested in order to account for the so-called “three-field economy” (Rösener, 1985; Volkert, 1991), i.e. a crop rotation regime that has been commonly used in Germany since medieval times and in which a field is left fallow every third year.
While changes in AGBM and ploughing depths can be reasonably estimated based on existing data, it is hardly possible to estimate the temporal (or even spatial) variability of other model parameters used in ICBM, e.g. root:shoot ratio and manure application. Therefore, we used SOC depth distributions from four standard soil profiles representing undisturbed (i.e. non-eroded) arable soils in the study area (soil database of ZALF e.V. and Sommer et al. (2020); Fig. 1) and values from the literature as initial model parameters (Table 2). We assumed that, at the beginning of the modelling period, the soils had higher SOC stocks due to the conversion from forest to cropland at the onset of agricultural use. A mean SOC depth profile from three undisturbed soil profiles located in a forest in close proximity to the study area (Calitri et al., 2021) was used for the calibration of the first year of the model period (green line in Fig. 3).
Sommer et al. (2020)Van Oost et al. (2005)Van Oost et al. (2005)Verch (2020)Herbrich et al. (2018)Van Oost et al. (2005)Dlugoß et al. (2012)DWD Climate Data Center (CDC) (2018)Behre (2008)Herrmann (1985)Table 2Model input parameters for modelling SOC dynamics in agricultural soils as determined by Monte Carlo simulations (n=1000). The initial values are varied by ± 10 % for sampling, and the final value is the parameter set that yielded the highest Nash–Sutcliffe model efficiency. The references prove that the initial values and their ranges are valid assumptions.
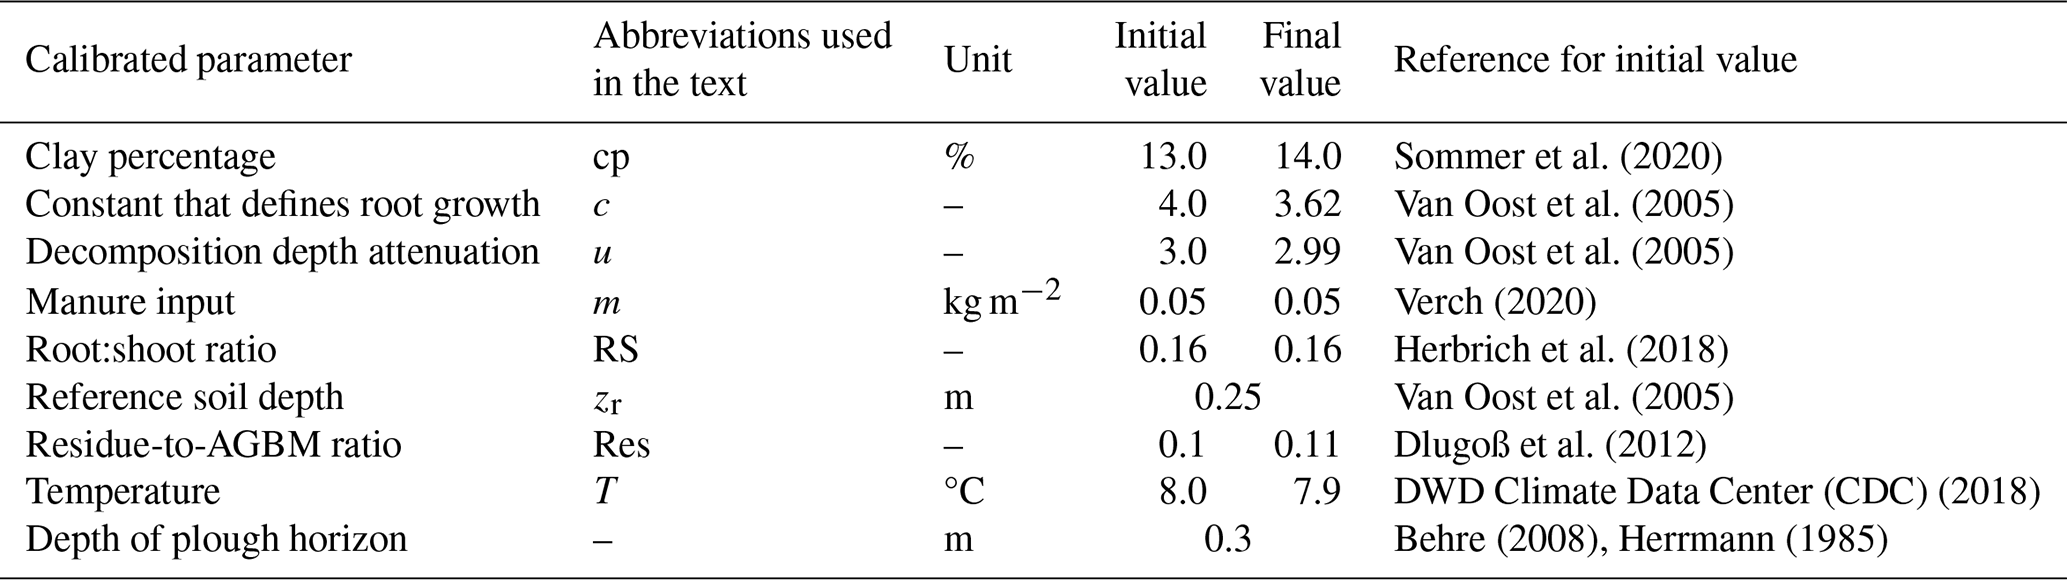
The initial model parameters were later optimised to derive a model parameter set used for the entire modelling period (second year onwards). That is, first we varied the initial parameter values one at a time until they matched the observation data (i.e. combination of the four non-eroded SOC depth profiles; orange line in Fig. 3). Second, the obtained representative initial values for the observed SOC profile were used in a Monte Carlo simulation (n=1000). Each parameter was sampled from a uniform distribution in a range of ± 10 % around its initial value, which resulted in 1000 different modelled SOC–depth profiles. Hence, we considered not only the direct influence of each parameter on the model output but also the joint influence due to interactions between the parameters (Pianosi et al., 2016). The parameter set which yielded the highest Nash–Sutcliffe model efficiency (Nash and Sutcliffe, 1970) was selected for the final modelling (black stars in Fig. 3).
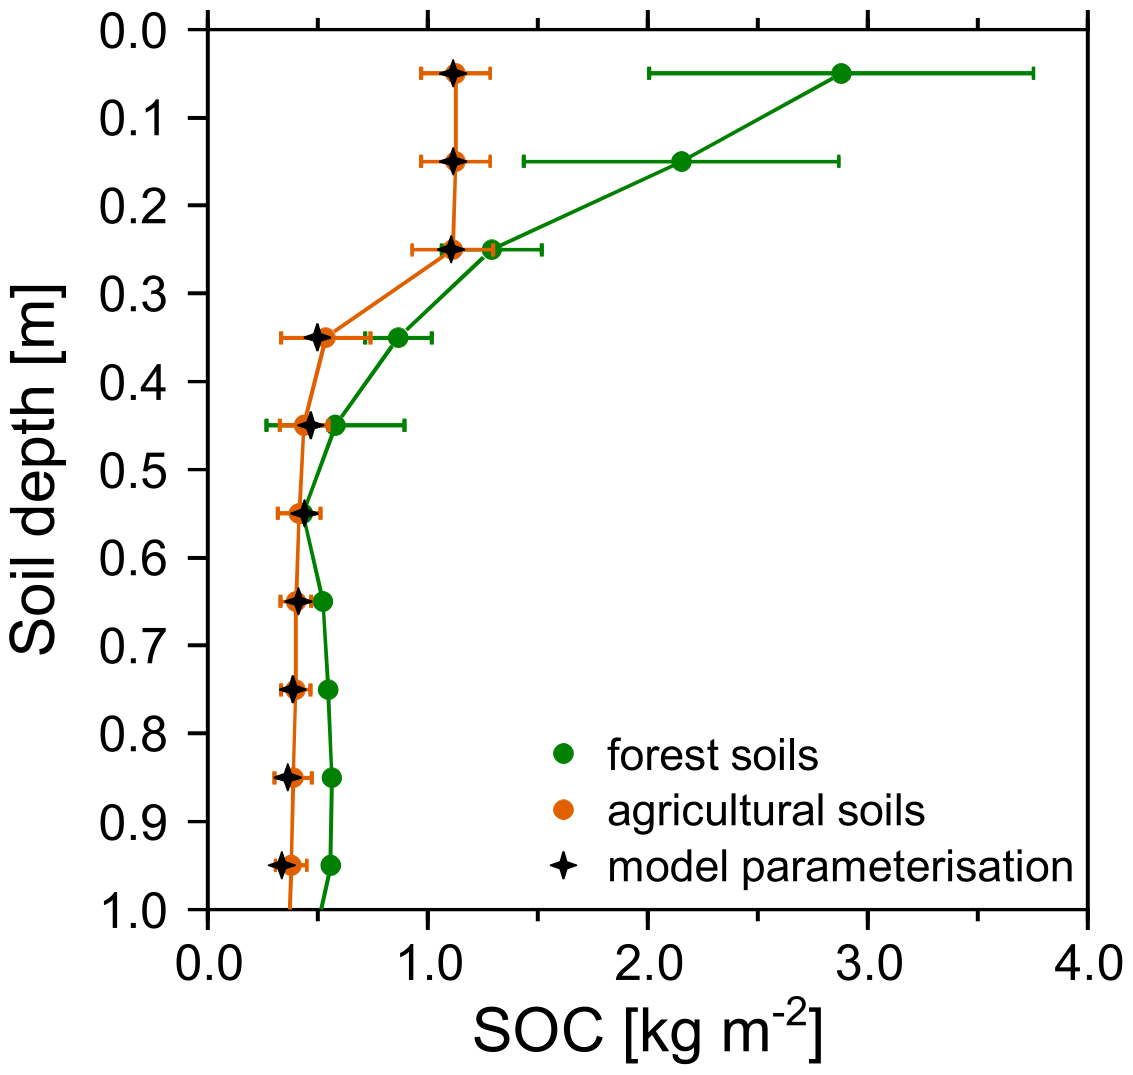
Figure 3Depth profile of the mean observed SOC stocks for the forest (green) and agricultural soils (orange) with error bars of ± 1 standard deviation. The forest soils are used as the initial soil condition, while the calibration of the agricultural soils is used as the parameterisation for modelling the 1000 years (black stars).
In terms of model evaluation, a straightforward, traditional model-testing approach to the correspondence between observational data and model outputs after simulating 1000 years of soil redistribution and C turnover in a study area of about 200 km2 is obviously hardly possible. There are no commensurate quantitative measurements of erosion available at this spatiotemporal scale, and it is not appropriate to directly compare soil truncation or SOC patterns of individual fields with a model output based on a parameterisation for the entire study area. As such, we focused on an investigative model evaluation approach (Baker, 2017), in which two independent datasets were used to evaluate the model’s capability to consistently represent the long-term erosion-induced C balance for the study area.
The first independent data used for model evaluation were derived from a remote sensing approach for identifying spatial patterns of severe soil erosion and soil truncation. Typical features in the study area are signs of soil truncation at hilltops, which most likely result from prolonged tillage erosion (Deumlich et al., 2010; Sommer et al., 2008). We qualitatively defined heavily eroded areas as the locations where bright subsoil material could be identified at the land surface by remote sensing images, which is indicative of the partial incorporation of glacial till into the plough layer due to extreme soil truncation (Fig. 4). The exposure of such subsoil material implies that ca. 1 m of soil was removed by erosion (Van der Meij et al., 2017).
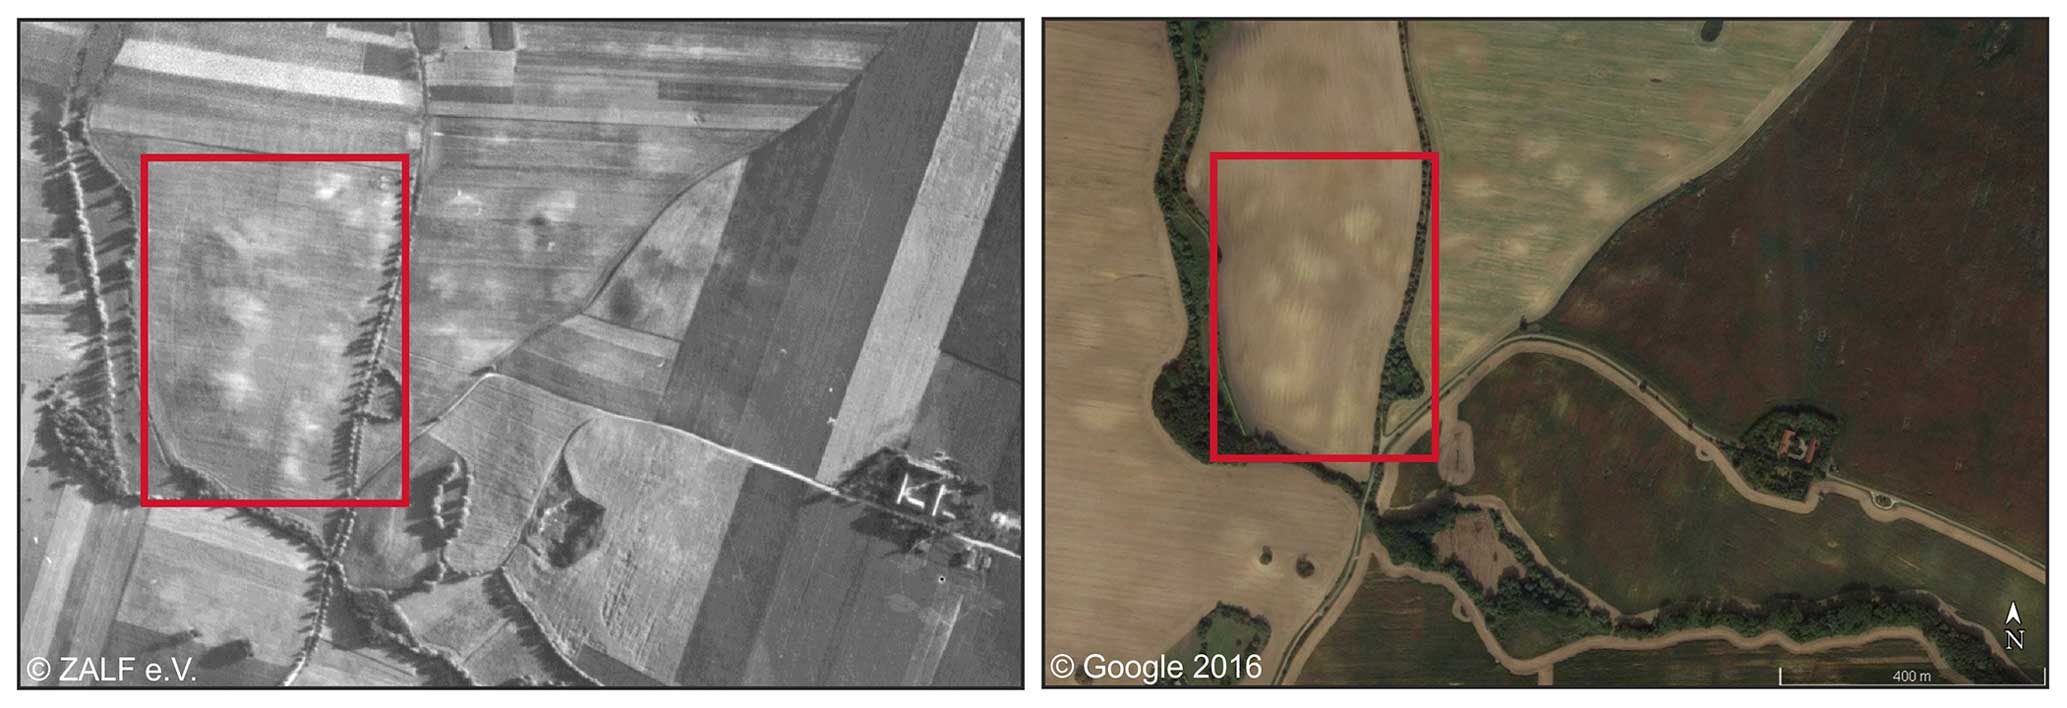
Figure 4Exemplary aerial photos of the study area showing eroded hilltops as indicated by the lighter soil colours. Notice that the aerial photo to the left was taken in 1953 (© ZALF e.V.), while the one to the right is from 6 September 2016 (© Google).
Heavily eroded areas can be straightforwardly detected by using remote sensing data for the entire catchment area. Therefore, 24 multispectral Sentinel-2 satellite images (ESA, 2015) acquired during bare-soil conditions were classified (support vector machine tool; ArcGIS version 10.7.1, ESRI, 2019). As the classification can only be performed for fields with bare-soil conditions at the time of satellite image acquisition, about 21 % of the study area (ca. 1.5 × 10⁶ raster cells) was classified, whereby 6 % of the study area was classified as heavily eroded (ca. 4.2 × 10⁵ raster cells). As hilltop erosion might also lead to a movement of the surface-exposed subsoil into the surrounding areas not affected by erosion, a buffer of −5 m was created on the inside of the area, resulting in 5.2 km2 or 2.1 × 10⁵ raster cells being classified as heavily eroded. These raster cells are used to evaluate the consistency of the modelled erosion patterns, which have been shown to be dominated by tillage erosion in a previous study (Wilken et al., 2020).
The second source of independent model evaluation data was derived from measured SOC stocks for two different test sites in the study area. For test site A (Fig. 1b), plough layer SOC stocks are available from a nested sampling design (20 m × 20 m; see Wilken et al., 2020) carried out in 2018. The data were geostatistically interpolated using a kriging approach to a regular grid with 5 m × 5 m resolution. At test site B (Fig. 1c), the topsoil SOC stocks were derived from a regression analysis of ground truth SOC measurements (first 0.15 m) against multispectral images taken by a remotely piloted aircraft system (Wehrhan and Sommer, 2021). Both observed SOC patterns were compared to model outputs.
The modelling approach resulted in a millennium of annual vertical C fluxes due to soil redistribution by tillage and water leading to a change in SOC stocks, as well as lateral C export by water erosion. According to the model evaluation (Sect. 3.2), realisation R4 (medium TIL, low WAT; Table 1) was used for the model analysis of the entire study area.
3.1 Results of modelling erosion-induced C flux dynamics for 1000 years
The modelled C fluxes without soil redistribution indicated a C loss to the atmosphere following conversion to arable land for about the first 800 years of the simulation (Fig. 5a, b; without (w/o) soil redistribution), with some interannual variability of vertical C fluxes due to the three-field economy (i.e. crops left on the field every third year). The resulting decrease in SOC stocks (Fig. 5e) was more pronounced for the first 500 years, nearly reaching a new equilibrium around 1700 CE. Soils turned into a slight C sink in the beginning of the 19th century after an abrupt change in modelled plough depth from 0.1 to 0.2 m. This changed again at the beginning of the 20th century, after the modelled plough depth was increased to 0.3 m, and especially after the end of the three-field economy, which substantially reduced the modelled soil C input (Fig. 5a, b; w/o soil redistribution). Finally, soils turned into a C sink again after 1950 due to the extremely increased yields (associated with a substantial increase in soil C input) following the end of the Second World War (Fig. 2c).
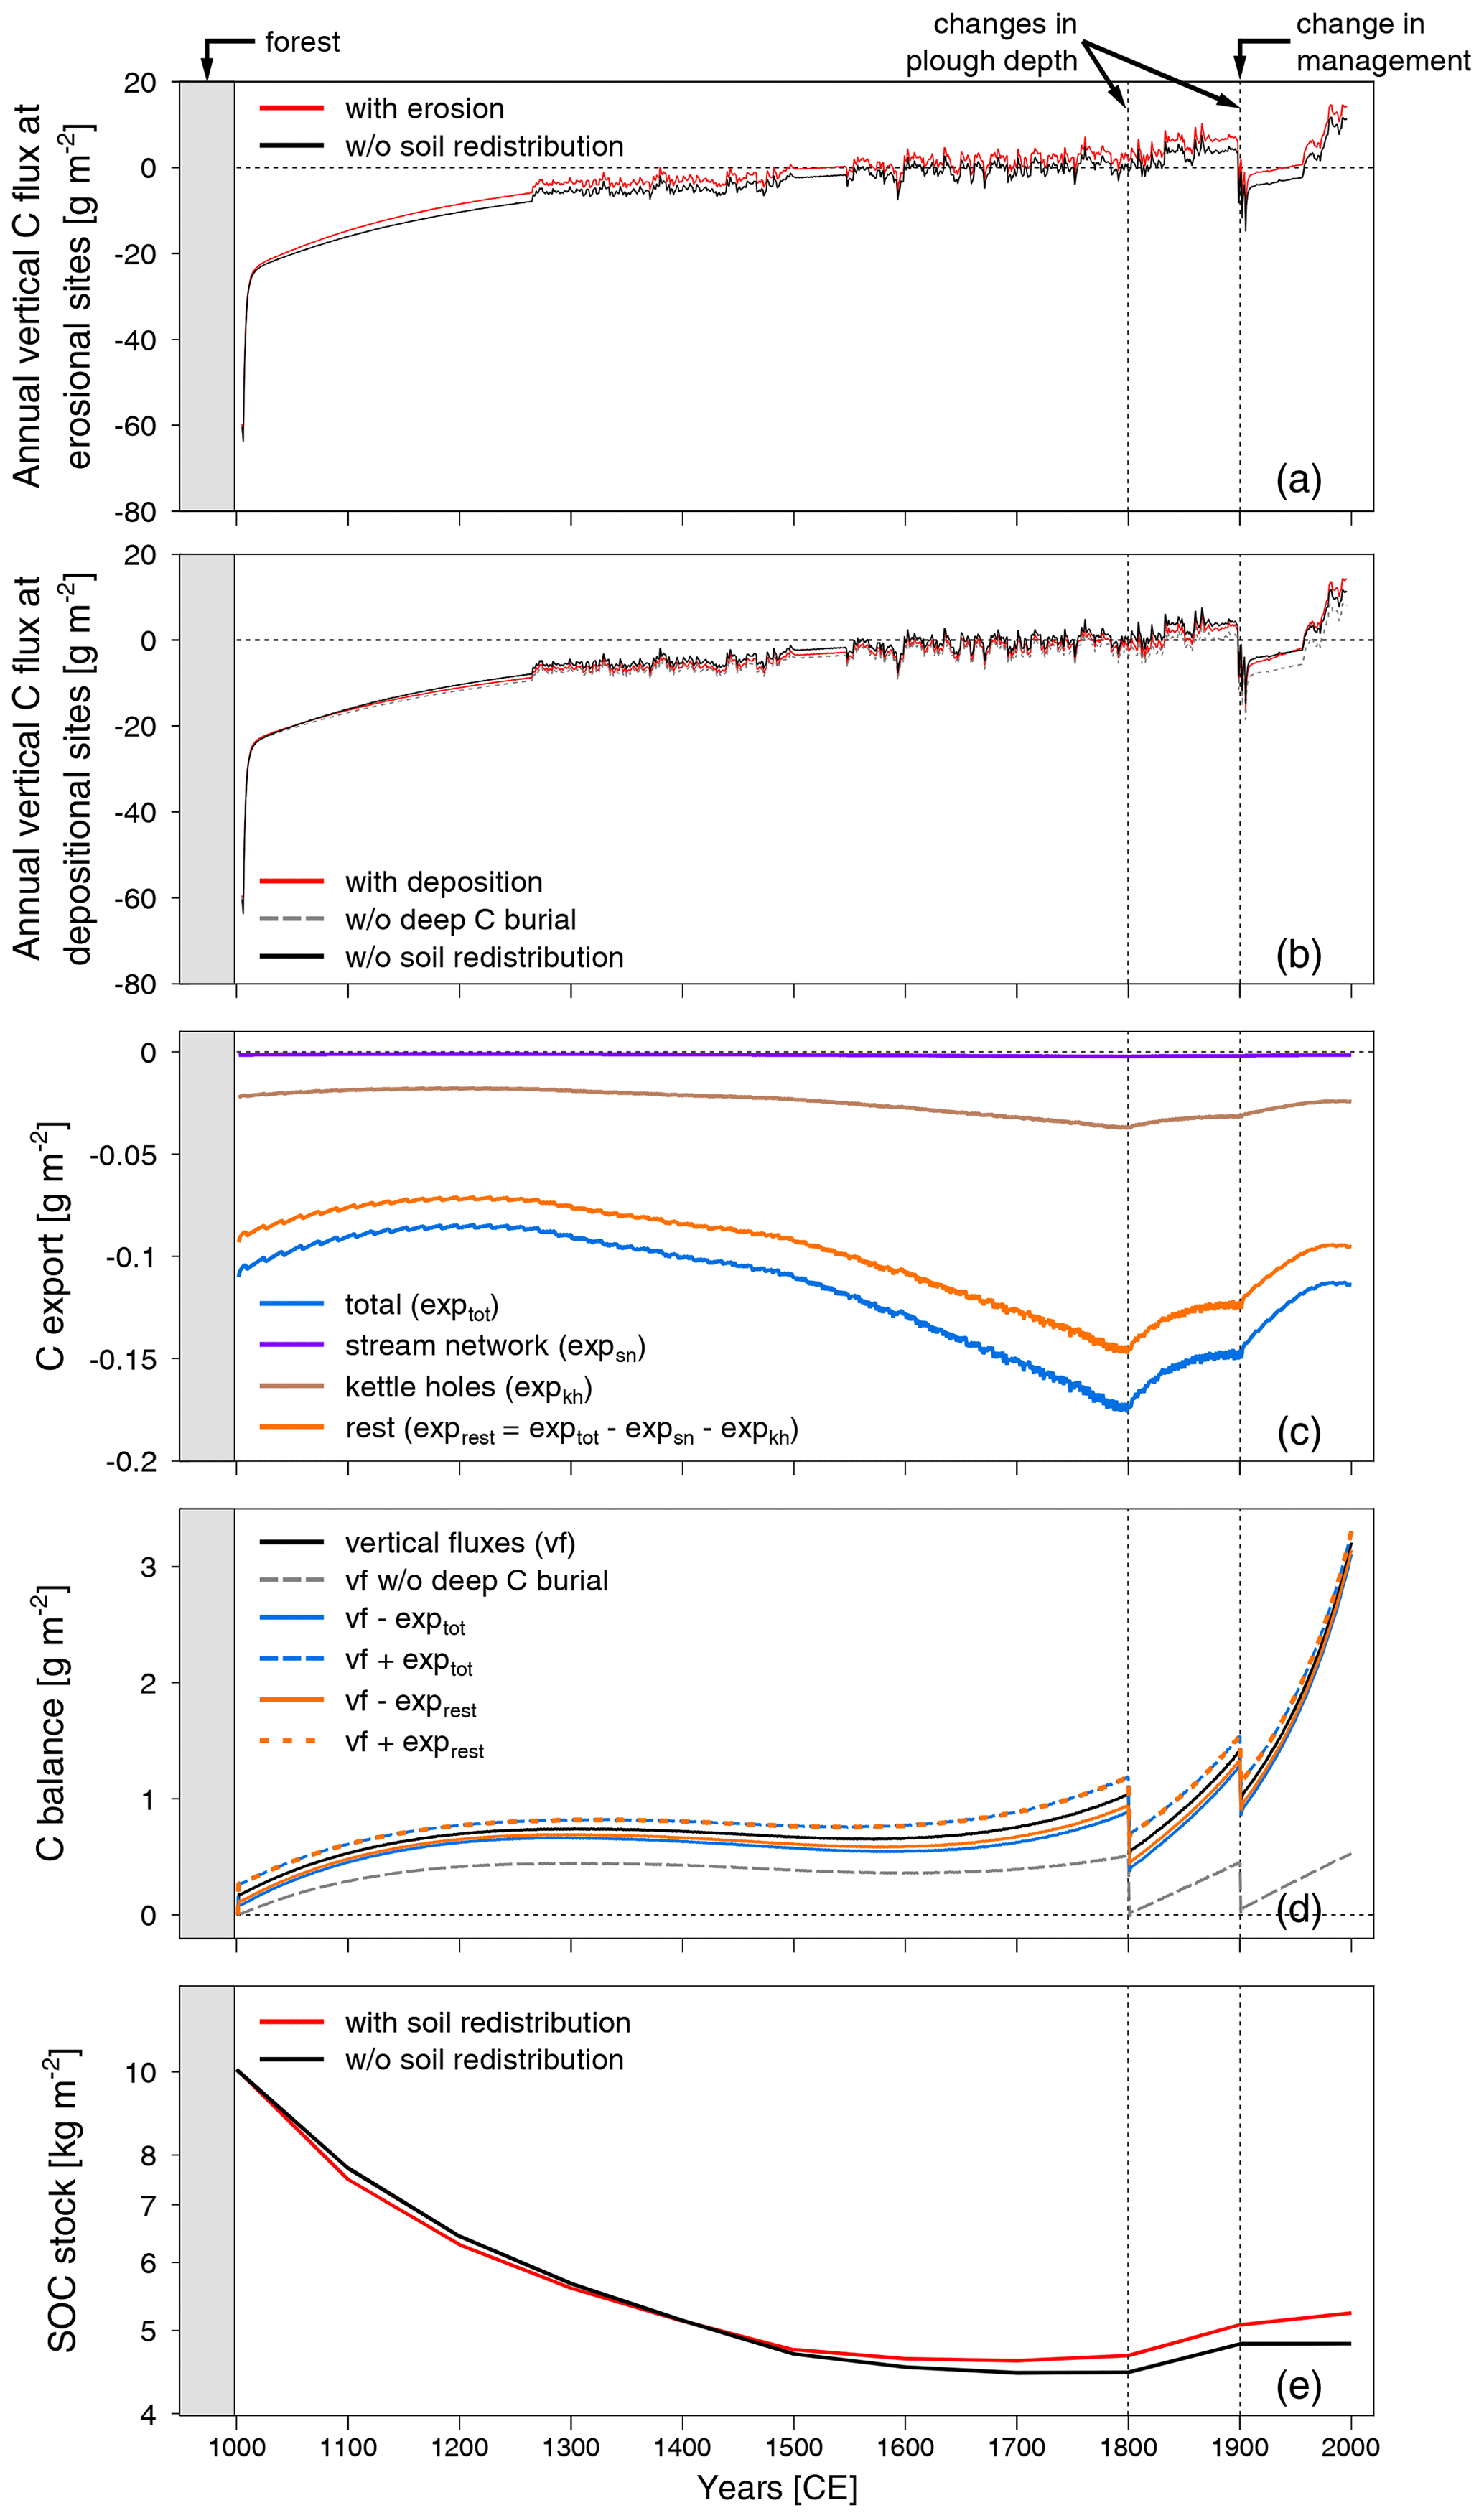
Figure 5Temporal variation (1000 years) of annual vertical C fluxes, lateral C export, C balance, and SOC stocks modelled for the study region (R4) following conversion from forest to agricultural land (grey boxes). Plough depth was increased from 0.1 to 0.2 m and to 0.3 m in the years 1800 and 1900, respectively (vertical dotted lines). Until 1900, AGBM was left on the field every third year. Vertical C fluxes at erosional (a) and depositional sites (b), total lateral C export (c), soil-redistribution-induced C balance of all modelled fluxes (d), and mean soil SOC stocks of the entire study area (e; log-scaled y axis). Notice that negative vertical C fluxes indicate a loss of C to the atmosphere, while positive C fluxes indicate a gain in soil C.
Based on the model simulations with the representation of lateral soil redistribution processes, we found that, at erosional sites (Fig. 5a), the C loss to the atmosphere was less pronounced compared to sites without soil redistribution, and from about 1550 CE onwards, eroded soils became a C sink. From this time onwards, the C sink function steadily increased until 1900 CE, when it dropped due to changes in soil C input (i.e. end of the three-field economy). The C sink function at eroding positions increased more pronouncedly again in the 20th century compared to sites without soil redistribution until the end of the modelling period.
Moreover, the simulations considering lateral soil redistribution processes revealed a decrease in vertical C fluxes in depositional sites compared to the simulations without soil redistribution (Fig. 5b). Such differences became more pronounced over time as increasingly more C was stored in colluvial soils. It is important to note that deep C burial (> 1 m soil depth) did successively become more important for the vertical C fluxes over time (Fig. 5b), whereas the increase in C mineralisation in the upper 1 m of depositional sites (first-order kinetics) was reduced by deep burial. This is especially important in the case of prolonged severe deposition as more and more C-rich former topsoil is moving to depths below 1 m.
The simulated lateral C export due to water erosion (Fig. 5c; exptot) in the test region was very small, especially since a new SOC equilibrium in arable land is reached. For approximately the first 200 years of the simulation, the C export steadily decreased as the SOC content of the topsoil being eroded substantially declined following land use conversion. For about the next 600 years, the modelled export steadily increased due to rising water erosion rates as we assumed an increase in the C factor for the period in the low-water-erosion pathway (Fig. 2b; R4) used to analyse the entire study area. At the beginning of the 19th and 20th centuries, respectively, the increase in ploughing depth led to a reduction in the topsoil SOC content and hence less C export via water erosion.
Based on the conservative assumption that all lateral C fluxes leaving arable land were lost to the atmosphere (Fig. 5d; vf−exp tot), soil redistribution resulted in a steadily increasing C sink of about 3 g C m−2 yr−1 at the end of the modelling period. This sink function is only slightly more pronounced if we assume that most C exported from arable land into neighbouring land uses or into kettle holes was stored and not mineralised, while only the proportion entering the stream network was lost to the atmosphere (Fig. 5d; vf−exp rest). Especially in the last 2 centuries of the simulation, deep C burial became more important for the entire soil-redistribution-induced C balance of the study area (Fig. 5d; deep C burial).
The sum of all C fluxes with and without lateral soil redistribution is also mirrored in the changes of the mean SOC stocks of the study area (Fig. 5e). Here, it is interesting to note that, for about the first 300 years after conversion to arable land, soil redistribution led to a faster decline in SOC stocks compared to the system without soil redistribution. After about 500 years, the reverse was simulated, leading to a mean difference between mean SOC stocks with and without redistribution of about 0.42 kg C m−2 (8.7 %).
3.2 Model evaluation
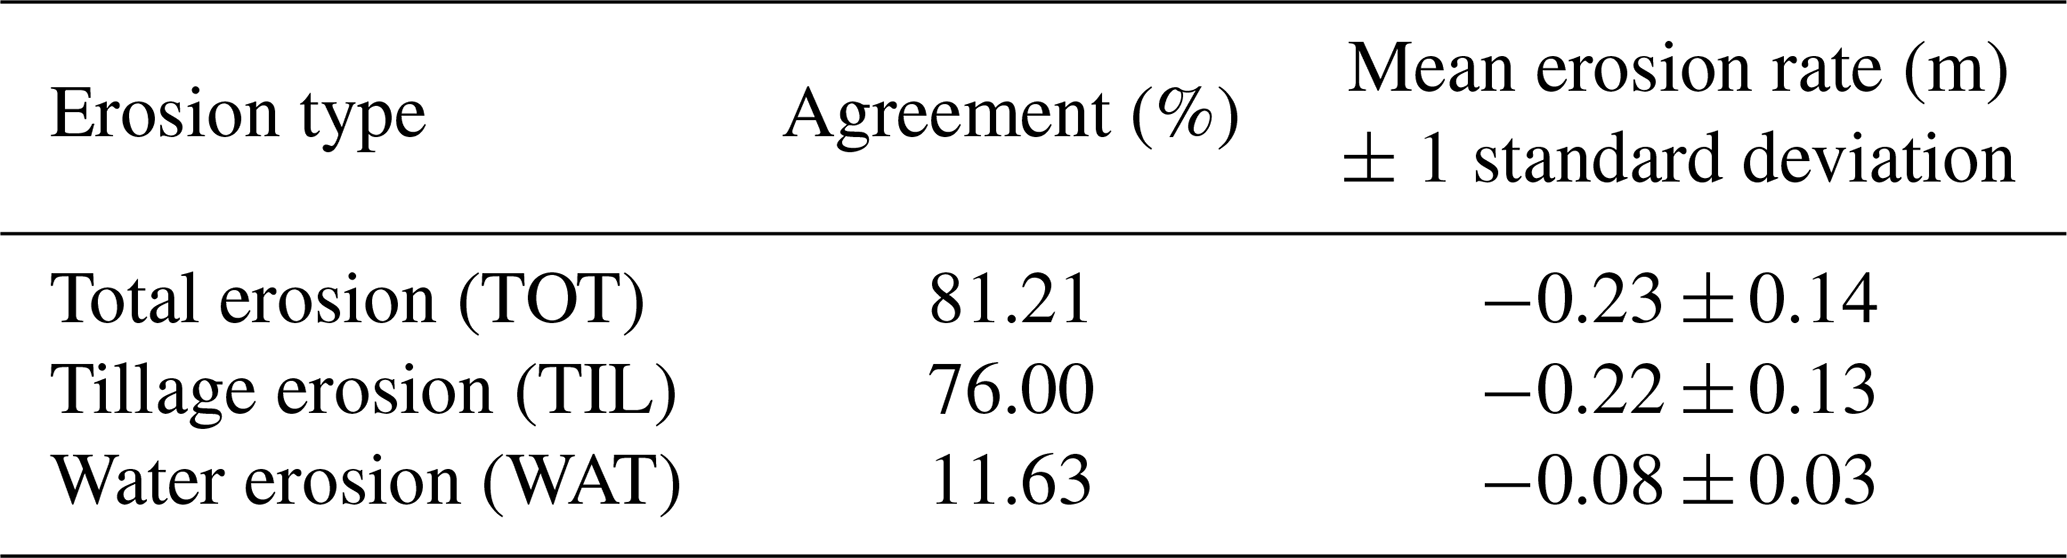
A comparison between modelled and remotely sensed soil redistribution patterns (Table 3) indicated that the most severely eroded sites were associated with tillage-induced (TIL) redistribution and total soil (TOT) redistribution. Overall, about 81 % of the areas classified as heavily eroded according to the remote sensing approach correspond to the modelled erosion class. On average, those areas show a modelled soil loss of −0.23 mm yr−1 (R4), most of which was caused by tillage erosion (Table 3).
Table 3Agreement between modelled WAT, TIL, and TOT erosion classes and remote-sensing-derived erosion classification. Note that a threshold of −0.05 m erosion per year was used to exclude areas with minimal erosion after modelling 1000 years of soil redistribution. The area classified from the remote sensing data represents about 21 % of the entire study area. Within the classified area, about 28 % is heavily eroded (about 4.2 × 10⁵ raster cells).
A comparison of modelled topsoil SOC stocks against observed topsoil SOC patterns based on the nine model realisations shows that the quality of the results is mostly determined by the differences in tillage erosion intensity (Fig. 6). The best results with respect to the used goodness-of-fit parameters can be reached for the medium- (R4–6) and high-tillage-erosion realisations (R7–9; Fig. 6). In contrast, WAT plays only a minor role in explaining the spatial distribution of SOC. It is important to note that, especially in the case of test site B, where topsoil SOC stocks are estimated with a remote sensing approach, the model substantially underestimates the SOC contents. Taking this into consideration while also trying to perform a somewhat conservative estimate of the extent of tillage erosion, we used realisation R4 (medium TIL, low WAT) for the model analysis of the entire study area. This realisation resulted in a Spearman's rank correlation coefficient of 0.83 and 0.82 for test sites A and B, respectively.
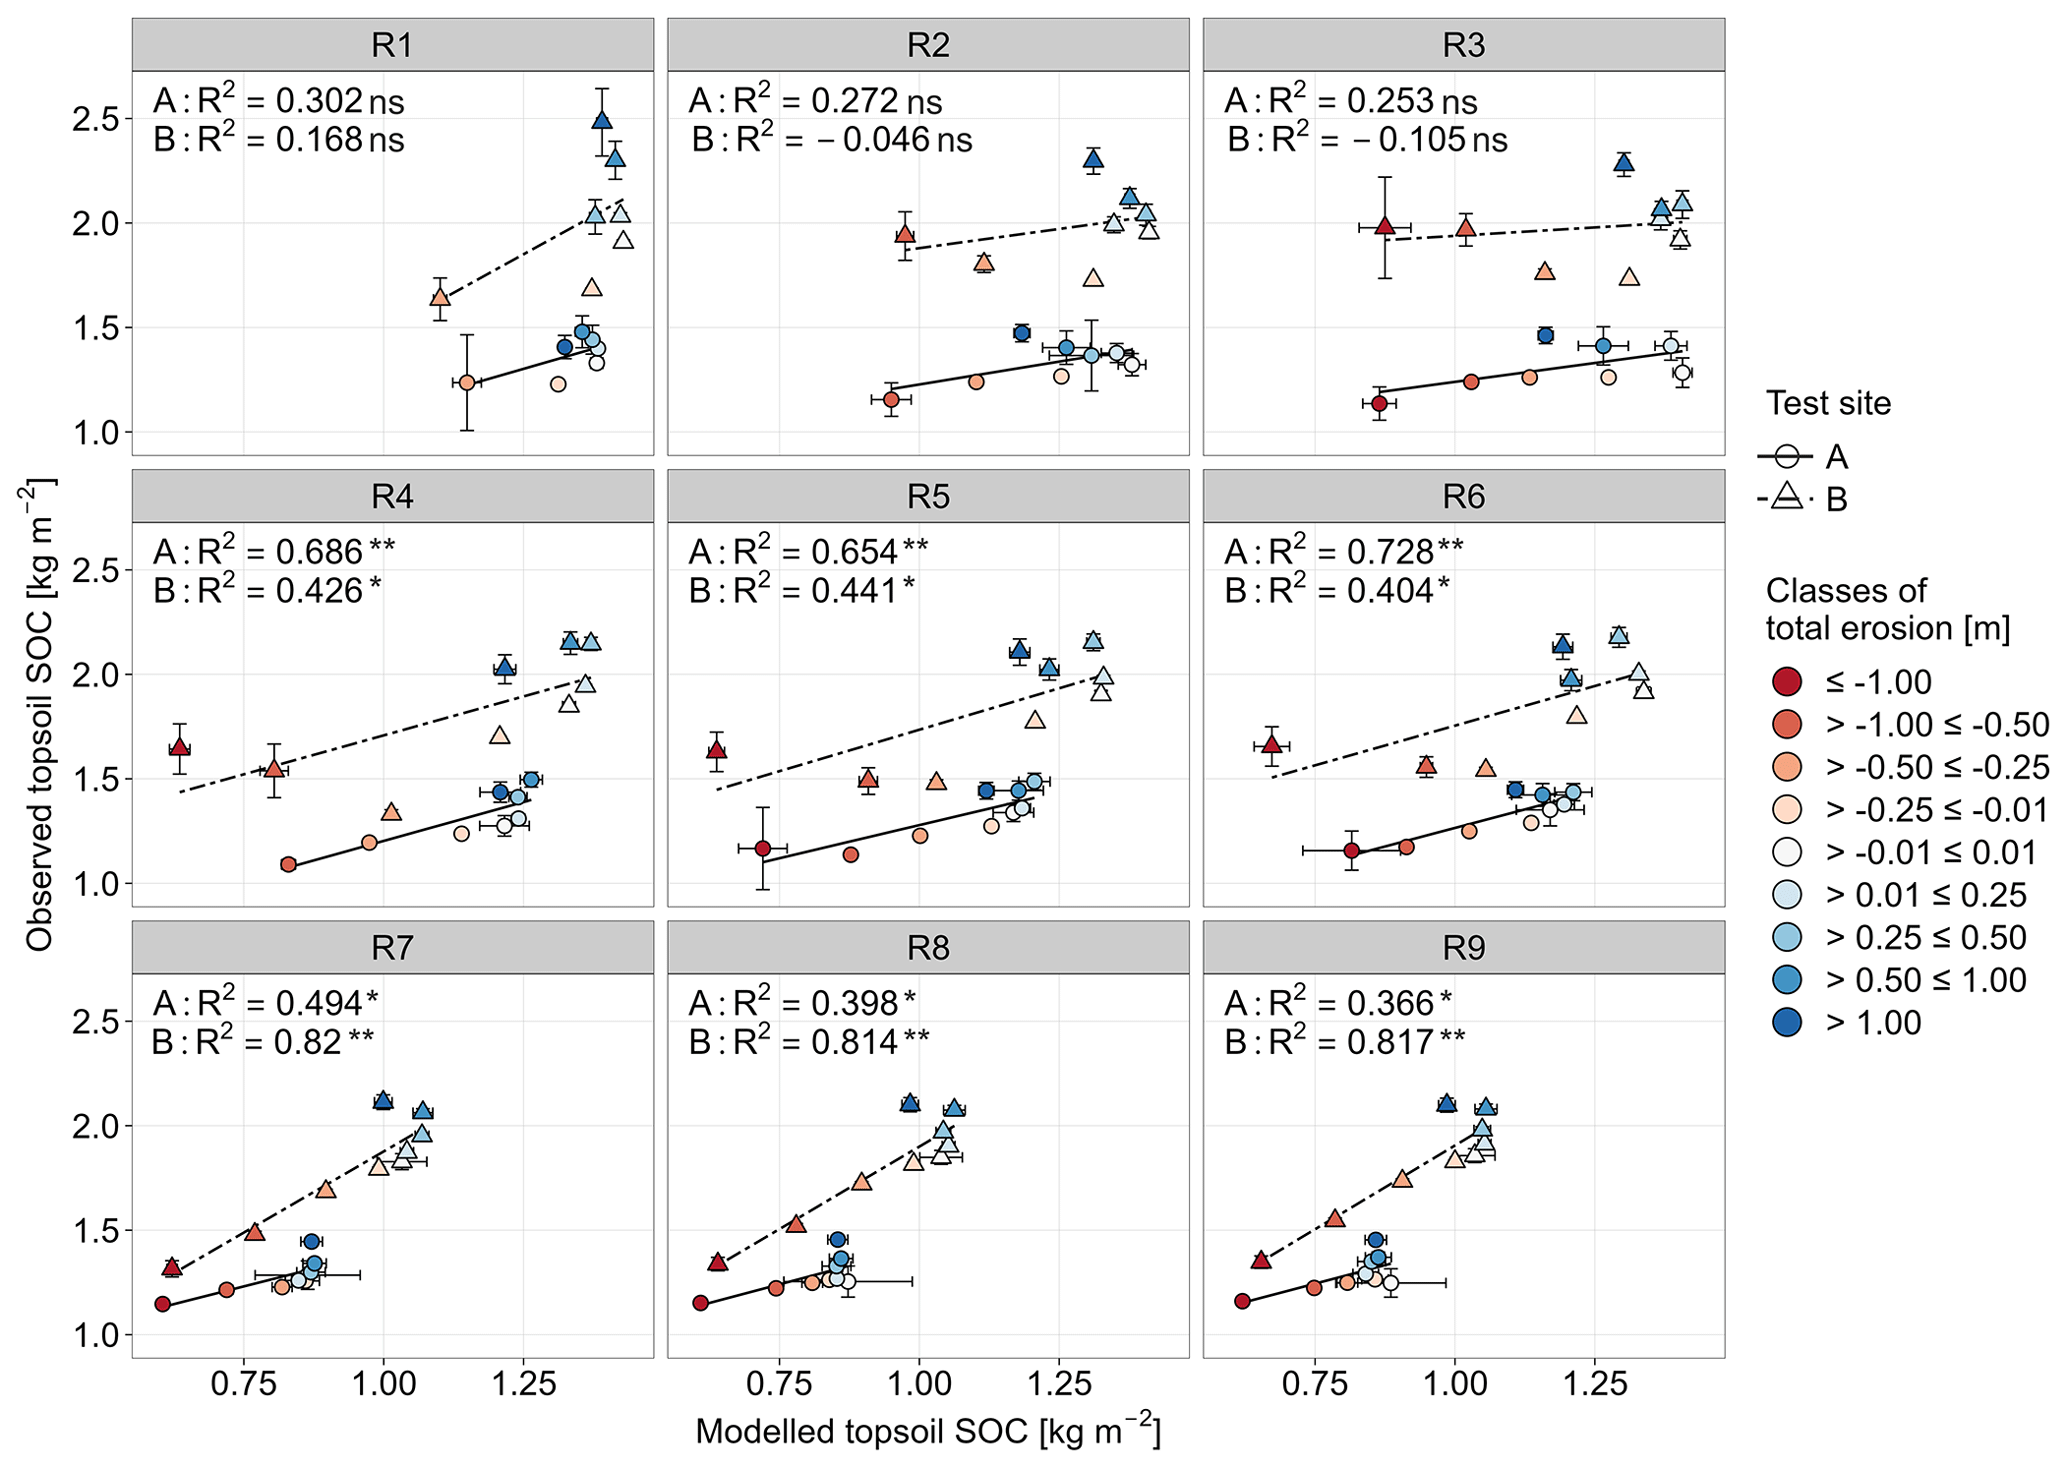
Figure 6Modelled versus observed topsoil (first 0.1 m) SOC stocks for the two test sites, A (circles) and B (triangles), and the nine realisations (in panels; Table 1). Data are grouped into classes of total soil redistribution ranging from extreme erosion (≤ −1 m, red) to high deposition (≥ 1 m, blue). Error bars indicate the 95 % confidence interval of the mean per class. Black lines show the regression of the classified data (solid for A, dashed for B) with the respective adjusted coefficient of determination (R2; ns= p value ≥ 0.05, * p value < 0.05, and ≥ 0.01, p value < 0.01).
4.1 Challenge of long-term soil redistribution and C turnover modelling
Understanding current agricultural soil–landscape relations requires a consideration of the long-term soil change as today's soil and SOC patterns cannot be explained by the short-term soil redistribution history. Our results demonstrated that long-term soil redistribution processes in agricultural landscapes are particularly important in the Quillow catchment. Although soil redistribution in the study area increased with the intensive agricultural mechanisation that has been taking place since the 1960s (Frielinghaus and Vahrson, 1998), this does not explain the observed erosion rates and patterns in the area (Wilken et al., 2020), especially at slope shoulders, where signs of tillage erosion are clearly visible in aerial photographs from the 1950s (Fig. 4, left). A comparison between our results with typical soil truncation and accumulation rates for the study area (Van der Meij et al., 2017) shows that it is necessary to consider the past millennium (i.e. since the beginning of agricultural management) to understand the landscape C dynamics.
However, any long-term and, in particular, landscape-scale modelling approaches are subject to considerable uncertainties. Here, we did not intend to mimic detailed observational data of lateral soil fluxes (which are, in any case, not available at a commensurate temporal resolution in relation to our model outputs) from individual sites of the 200 km2 study area with a high degree of accuracy and precision. On the contrary, our investigative model evaluation approach was focused on testing the model’s consistency in simulating long-term, landscape-scale spatial patterns of soil truncation and SOC stocks while partially representing the uncertainties associated with parameter estimation in such an ambitious modelling experiment. As such, a set of model realisations (Figs. 2, 6) that combined different soil redistribution assumptions was considered. The entire study area was ultimately analysed following the model realisation R4 (i.e. medium tillage and low water erosion), which could explain 69 % and 43 % (see R2 in Fig. 6) of the current spatial pattern of SOC stocks in test sites A and B (Fig. 1). This leads to an underestimation of the mean SOC stocks by 40 % and 20 % in the topsoil of test sites A (50 cm soil depth) and B (plough layer), respectively. Importantly, the model outputs displayed a high agreement (81 %) with independent data used for estimating areas of severe soil truncation.
Overall, these results are encouraging, considering that (i) we only calibrated C turnover parameters, while the tillage and water erosion components of the model were applied “blindly” to derive a set of plausible realisations for the whole study area; (ii) the model was parameterised to represent the average conditions in the entire study area, not accounting for the anyway unknown specific land use and management history of the individual test sites; and (iii) in the relatively rare cases in which soil erosion models have been tested against independent spatial data, results have generally shown a poor agreement with observational data (Batista et al., 2019). As such, our modelling outputs are consistent with independent lines of evidence of related phenomena and with our current understanding of long-term soil and SOC redistribution processes at the landscape scale. This corroborates the usefulness of the employed modelling approach for elucidating soil redistribution and C dynamics in the study area over the last 1000 years.
4.2 Long-term soil redistribution and C dynamics
This model-based analysis of the long-term, landscape-scale effects of soil redistribution following land conversion from forest to arable land upon C dynamics extends previous studies that mostly combine soil redistribution with SOC turnover over shorter time periods and smaller areas and that were based on soils that are already in C equilibrium due to long-term arable use (e.g. Dlugoß et al., 2012; Nadeu et al., 2015; Wilken et al., 2017b). Taking the conversion from forest to arable land into account clearly indicates that time since conversion is essential for the understanding of soil-redistribution-induced C fluxes. This was not included in previous long-term modelling studies of larger areas (e.g. Bouchoms et al., 2017; Wang et al., 2017) but only applied to an artificial topographic setting (2.25 ha; van der Meij et al., 2020). Our results demonstrate that there is no dynamic replacement at erosional sites as long as topsoil soils still lose C following conversion from SOC-rich forest to SOC-depleted arable soils. This is particularly important as dynamic replacement is assumed to be one of the key processes for a potential C sink function of soil erosion (Doetterl et al., 2016; Harden et al., 1999). Within our simulation, it took about 500 years until eroded soils in the study region started to act as a C sink (Fig. 5a). This period would be substantially shorter in smaller, more erosion-prone catchments where SOC-rich topsoil from former forested areas is lost faster (Dlugoß et al., 2012; Juřicová et al., 2023; Wilken et al., 2017b). This result underlines that it is essential to model entire landscapes instead of upscaling conclusions from small-scale studies.
Erosion-induced SOC loss and its partial deposition are most pronounced shortly after land conversion as the topsoil is still rich in SOC. Therefore, results from studies in regions where arable land was established centuries ago (e.g. Dlugoß et al., 2012; Juřicová et al., 2023; Nadeu et al., 2015) might not allow us to draw general conclusions for regions where land conversion happened recently. This corroborates the argument from Van Oost and Six (2023) that our understanding of coupled erosion and C turnover processes is strongly biased towards humid and/or temperate settings, where land conversion mostly occurred centuries ago, while little is known for regions with ongoing land conversion, often located in tropical regions (Song et al., 2018).
4.3 Tillage-induced soil redistribution and C dynamics
4.3.1 Tillage as the main driver of the erosion-induced C pump
Within our study area, tillage erosion was demonstrated to be a critically important process dominating the catchment's C balance and the C sink function induced by soil redistribution. Water erosion cannot be neglected due to extreme events that are responsible for crop losses, high sedimentation rates, and off-site damage (Frielinghaus et al., 1992; Frielinghaus and Schmidt, 1993). However, as illustrated by the historical aerial photograph in Fig. 4, tillage-induced soil redistribution in this area is dominating and not only important since the introduction of heavy machinery 70 years ago (Van der Meij et al., 2017; Wilken et al., 2020; Winnige et al., 2003). In addition, tillage is known to further increase the susceptibility of arable soils to water erosion (Lobb et al., 1995) due to its effect on soil microporosity and changes in surface roughness (Poesen and Govers, 1985). The impact of tillage outcompetes soil redistribution by water due to specific conditions in the study area. The farming structures in the post-socialistic study area (large field sizes) perform tillage on a high optimisation level. Within a typical 5-year crop rotation (rapeseed – winter wheat – maize – winter wheat – winter barley), inversion tillage is only applied once between two small-grain cereals, while chisel ploughing is applied in all other years. The rationale is that chisel ploughing can be applied faster and requires less mechanical force (i.e. kinetic energy) compared to inversion ploughing, which reduces the time, effort, and fuel consumption (Dumanski et al., 2006; Helsel, 2007). Furthermore, the hummocky topography of the young morainic study area shows a short summit–footslope distance that benefits tillage erosion, which does not increase with slope length, such as in the case of water erosion. This characteristic topography also leads to large depositional areas (41 % of the study area in comparison to 25 ± 7 % in a global estimate of Van Oost et al., 2007) that favours C burial and sequestration. In addition, there is a low hydrological and sedimentological connectivity to the river system in the study area. Only 5 × 10⁻⁴ t ha−1 of eroded soil is exported by water to the river system, while ca. 200 times more C (0.1 t ha−1) is buried in kettle holes. Even if this limited hydrological connectivity benefits the water-redistribution-induced C sink function, tillage erosion is still dominant as erosive rainfall appears only at a relatively low frequency in this region (Deumlich, 1999; Wilken et al., 2018).
4.3.2 Recent developments in tillage-induced soil redistribution
Tillage erosivity partly decreased due to the introduction of pesticides for weed control, which reduced the relevance of inversion tillage over the past decades (Lobb et al., 2007). Also, in our study area, non-inversion conservation tillage receives more attention and is already applied to 47 % of the cropland area (44 % conventional tillage and 0.06 % no-till; Statistisches Bundesamt (Destatis), 2017). Nevertheless, it needs to be mentioned that conservation tillage focuses on water erosion mitigation, while tillage erosion is not accounted for. A recent study demonstrated that soil tillage by chisel ploughing leads to substantially more tillage erosion than inversion implements (Öttl et al., 2022). Hence, tillage practices show high spatiotemporal variation, which is fused to a large sensitivity of tillage erosion predictions. The sensitivity is reflected in the erosion pathways, whereby the difference between the C balance of the low- and high-tillage-erosion pathways (C balance R8–R2) is higher than the difference in the C balance without and with consideration of deep C burial, respectively. Hence, the C balance and corresponding sequestration potential of agricultural soil systems is mainly driven by individual farmers’ decisions.
4.4 The way ahead for long-term and large-scale soil redistribution and C dynamics modelling
It is evident that long-term and large-scale simulations are needed to gain an understanding of C dynamics, not only for scientific purposes but also to find adapted management strategies to increase soil C sequestration. From our perspective, the implementation of the following three processes would substantially increase the simulation quality of coupled soil redistribution and C turnover models.
4.4.1 Keeping track of topographic change by soil redistribution
The model does not account for topographic change related to soil redistribution (i.e. DEM update). For shorter temporal scales (ca. 50–100 years; e.g. Dlugoß et al., 2012; Nadeu et al., 2015; Wilken et al., 2017b), the topographic change has a limited impact, but for a modelling period of 1000 years, neglecting DEM updates affects lateral and vertical C dynamics. In a tillage-erosion-dominated study area like the Quillow catchment, both erosion and deposition processes will be substantially overestimated at individual raster cells (erosion: slope shoulders; deposition: footslopes and field borders). This is due to a constant erosion and deposition pattern, which becomes more relevant towards the end of the simulation period. This means that severe erosion is simulated for a smaller spatial area than that in which it would take place in reality. As a result, at erosional sites, substantial dynamic replacement is calculated for a limited number of raster cells, and SOC is more likely to be buried below 1 m at severe depositional sites. The latter is especially critical if the modelled deposition is large enough that deposited C-rich topsoil reaches soil layers below 1 m, where it is assumed that SOC is stable in time (Rumpel and Kögel-Knabner, 2011). Hence, taking the topographic change corresponding to soil redistribution into account would be an important step forward to improve the quality of soil patterns.
4.4.2 Plant feedback on soil degradation
Coupling the impact of soil redistribution against plant growth would be a great step towards a better representation of C dynamics in disturbed landscapes. A cornerstone for a landscape to function as a C sink is dynamic replacement of eroded C by fresh biomass C due to the uplift of unsaturated reactive minerals (Doetterl et al., 2016; Harden et al., 1999). However, this calls for constantly high yields and corresponding C input at eroding landscape positions (Doetterl et al., 2016; Van Oost and Six, 2023). As severe long-term soil erosion typically causes declining yields (e.g. Bakker et al., 2004; Den Biggelaar et al., 2001; Herbrich et al., 2018), which was also demonstrated in the study area (Öttl et al., 2021), C input is overestimated at erosional areas. On the other hand, C input is underestimated at depositional areas due to more favourable growing conditions (Öttl et al., 2021; Papiernik et al., 2005; Heckrath et al., 2005), which attenuates overstating the C sink term (Öttl et al., 2021; Quinton et al., 2022).
4.4.3 SOC burial in deeper soil layers (< 1 m)
Long-term soil redistribution following land conversion from natural forest to arable land leads to deep burial of SOC (< 1 m; Hoffmann et al., 2013). In our modelling approach, the assumptions regarding the stability of SOC buried below 1 m are of tremendous importance in the range of soil-redistribution-induced C fluxes (Fig. 5d). Assuming that all SOC allocated below 1 m is stabilised, the overall soil-redistribution-induced current-day C sequestration potential would lead to an increase in SOC stocks of 0.66 ‰ yr−1. However, long-term modelling of SOC turnover in these deep layers is challenging due to the generally limited knowledge of SOC turnover in deep soils (Rumpel and Kögel-Knabner, 2011) and the fluctuating stagnic soil conditions partly associated with landscape positions where soil is deposited.
In this study, the long-term (1000 years) effect of soil redistribution upon C fluxes and SOC stocks was modelled in a study region of 200 km2 in northeastern Germany. Differently to earlier studies focussing on erosion-induced C fluxes, we included the change in SOC stocks following conversion from a natural forest to arable land and accounted for changes in agricultural practices and production over time.
The modelling results from a study area representing ground moraine landscapes as typically found in northern Europe, Asia, and North America indicate that soil redistribution in such regions is resulting in a slight C sink, increasing the landscape-scale SOC stocks by 0.66 ‰ yr−1 as compared to an area without erosion. This sink function mostly results from tillage-induced soil redistribution, while soil redistribution by water only plays a minor role, which is also quite typical for more continental climatic conditions. Modelling a representative segment of a larger landscape instead of focussing on a small (water-) erosion-prone area with steeper slopes indicates that the C sink function is less pronounced at this scale. The study also underlines the importance of addressing the soil-redistribution-induced C fluxes starting with forest-related SOC stocks before conversion to arable land because focussing only on the phase of arable soil use alone overestimates the erosion-induced sink function.
Table A1Literature review as basis for the temporal variation of the tillage transport coefficient (ktil) values shown in Fig. 2a, sorted by period. “Original reference” is the publication where the experiment is described, which does not necessarily include the calculated ktil value. “Reference ktil value” is the publication that refers to the original reference but includes the ktil value. Abbreviations: CP refers to chisel plough, MP refers to mouldboard plough, TE refers to tillage implements, D refers to downslope, UD refers to alternating up- and downslope, C refers to contour-parallel, EXP refers to experiment, and SIM refers to simulation.
The long-term precipitation reconstruction (1701–2011) for Europe presented by Pauling et al. (2005) was downloaded from the Climate Explorer (Royal Netherlands Meteorological Institute KNMI/World Meteorological Organization WMO): http://climexp.knmi.nl/select.cgi?Rapidpaulingprecip (last access: 10 April 2024). All other data that support the findings of this study are available from the corresponding author upon request.
The modelling approach was designed by LKÖ, PF, and FW. LKÖ reviewed relevant literature, developed the model, conducted the modelling, processed the data, and designed the figures and tables. Model development was supported by FW and AJ. Data analysis and interpretation were carried out by all the authors. The paper was drafted by LKÖ, FW, and PF, while all the authors contributed to the discussion and reviewed the final version of the paper.
At least one of the (co-)authors is a member of the editorial board of SOIL. The peer-review process was guided by an independent editor, and the authors also have no other competing interests to declare.
Publisher’s note: Copernicus Publications remains neutral with regard to jurisdictional claims made in the text, published maps, institutional affiliations, or any other geographical representation in this paper. While Copernicus Publications makes every effort to include appropriate place names, the final responsibility lies with the authors.
We also acknowledge the Landscape Pedology Working Group, Leibniz Centre for Agricultural Landscape Research ZALF e.V. (Müncheberg, Germany) for the support and data provision.
This research has been supported by the Deutsche Forschungsgemeinschaft (grant nos. FI-1216/12-1 and SO-302/12-1).
This paper was edited by Nikolaus J. Kuhn and reviewed by Marijn van der Meij and one anonymous referee.
Amelung, W., Bossio, D., de Vries, W., Kögel-Knabner, I., Lehmann, J., Amundson, R., Bol, R., Collins, C., Lal, R., Leifeld, J., Minasny, B., Pan, G., Paustian, K., Rumpel, C., Sanderman, J., van Groenigen, J. W., Mooney, S., van Wesemael, B., Wander, M., and Chabbi, A.: Towards a global-scale soil climate mitigation strategy, Nat. Commun., 11, 5427, https://doi.org/10.1038/s41467-020-18887-7, 2020. a
Anderson, G.: Genesis of hummocky moraine in the Bolmen area, southwestern Sweden, Boreas, 27, 55–67, 1998. a
Andrén, O. and Kätterer, T.: ICBM: The introductory carbon balance model for exploration of soil carbon balances, Ecol. Appl., 7, 1226–1236, 1997. a, b, c, d
Aufdenkampe, A. K., Mayorga, E., Raymond, P. A., Melack, J. M., Doney, S. C., Alin, S. R., Aalto, R. E., and Yoo, K.: Riverine coupling of biogeochemical cycles between land, oceans, and atmosphere, Front. Ecol. Environ., 9, 53–60, 2011. a, b
Baker, V. R.: Debates – Hypothesis testing in hydrology: Pursuing certainty versus pursuing uberty, Water Resour. Res., 53, 1770–1778, 2017. a
Bakker, M. M., Govers, G., and Rounsevell, M. D. A.: The crop productivity-erosion relationship: an analysis based on experimental work, Catena, 57, 55–76, 2004. a
Barneveld, R. J., Bruggeman, A., Sterk, G., and Turkelboom, F.: Comparison of two methods for quantification of tillage erosion rates in olive orchards of north-west Syria, Soil Till. Res., 103, 105–112, 2009. a, b, c, d, e, f
Batista, P. V. G., Davies, J. A. C., Silva, M. L. N., and Quinton, J. N.: On the evaluation of soil erosion models: Are we doing enough?, Earth-Sci. Rev., 197, 102898, https://doi.org/10.1016/j.earscirev.2019.102898, 2019. a
Battin, T. J., Luyssaert, S., Kaplan, L. A., Aufdenkampe, A. K., Richter, A., and Tranvik, L. J.: The boundless carbon cycle, Nat. Geosci., 2, 598–600, 2009. a, b
Bayerl, G.: Geschichte der Landnutzung in der Region Barnim-Uckermark, Materialien der Interdisziplinären Arbeitsgruppe Zukunftsorientierte Nutzung ländlicher Räume – LandInnovation, Nr. 12, Berlin-Brandenburgische Akademie der Wissenschaft, Berlin, 2006. a
Behre, K.-E.: Landschaftsgeschichte Norddeutschlands. Umwelt und Siedlung von der Steinzeit bis zur Gegenwart, Wachholtz Verlag, Neumünster, ISBN: 9783529024993, 2008. a, b, c, d, e, f, g
Bellamy, P. H., Loveland, P. J., Bradley, R. I., Lark, R. M., and Kirk, G. J.: Carbon losses from all soils across England and Wales 1978–2003, Nature, 437, 245–8, 2005. a
Bellassen, V., Angers, D. A., Kowalczewski, T., and Olesen, A.: Soil carbon is the blind spot of European national GHG inventories, Nat. Clim. Change, 12, 324–331, 2022. a
Berhe, A. A., Harden, J. W., Torn, M. S., and Harte, J.: Linking soil organic matter dynamics and erosion-induced terrestrial carbon sequestration at different landform positions, J. Geophys. Res.-Biogeo., 113, G04039, https://doi.org/10.1029/2008JG000751, 2008. a, b
Bork, H. R., Dalchow, C., Dotterweich, M., Schatz, T., and Schmidtchen, G.: Die Entwicklung der Landschaften Brandenburgs in den vergangenen Jahrtausenden, in: Geschichte der Landwirtschaft in Brandenburg, edited by: Klemm, V., Darkow, G. and Bork, H. R., Verlag Mezogazda, Budapest, Hungary, 237–258, ISBN: 3000035575, 1998. a
Bouchoms, S., Wang, Z., Vanacker, V., Doetterl, S., and Van Oost, K.: Modelling long-term soil organic carbon dynamics under the impact of land cover change and soil redistribution, Catena, 151, 63–73, 2017. a, b, c
Bundesministerium der Finanzen: Gesetz zur Schätzung des landwirtschaftlichen Kulturbodens (Bodenschätzungsgesetz – BodSchätzG), https://www.bundesfinanzministerium.de/Content/ (last access: 10 April 2024), 2007. a
Calitri, F., Sommer, M., van der Meij, W. M., Tikhomirov, D., Christl, M., and Egli, M.: 10Be and 14C data provide insight on soil mass redistribution along gentle slopes and reveal ancient human impact, J. Soil. Sediment., 21, 3770–3788, 2021. a
De Alba, S.: Modelling the effects of complex topography and patterns of tillage on soil translocation by tillage with mouldboard plough, J. Soil Water Conserv., 56, 335–345, 2001. a, b
Den Biggelaar, C., Lal, R., Wiebe, K., and Breneman, V.: The impact of soil erosion on crop yields in North America, in: Advances in agronomy, edited by: Sparks, D. L., Vol. 72, 1–52, Academic Press, Massachusetts, ISBN: 978-0120007721, 2001. a
Dercon, G., Govers, G., Poesen, J., Sánchez, H., Rombaut, K., Vandenbroeck, E., Loaiza, G., and Deckers, J.: Animal-powered tillage erosion assessment in the southern Andes region of Ecuador, Geomorphology, 87, 4–15, 2007. a, b, c, d
Desmet, P. J. J. and Govers, G.: A GIS procedure for automatically calculating the USLE LS factor on topographically complex landscape units, J. Soil Water Conserv., 51, 427–433, 1996. a
Deumlich, D.: Erosive Niederschlage und ihre Eintrittswahrscheinlichkeit im Nordosten Deutschlands, Erosive rainstorms and their probability in Northeast Germany, Meteorol. Z., 8, 155–161, 1999. a
Deumlich, D., Mioduszewski, W., and Kocmit, A.: Analysis of sediment and nutrient loads due to soil erosion in rivers in the Odra catchment, in: Agricultural effects on ground and surface waters: Research at the edge of science and society, Vol. 273, IAHS Publication, Wageningen, the Netherlands, ISBN: 1901502767, 2002. a
Deumlich, D., Schmidt, R., and Sommer, M.: A multiscale soil-landform relationship in the glacial-drift area based on digital terrain analysis and soil attributes, J. Plant Nutr. Soil Sc., 173, 843–851, 2010. a, b
DIN ISO: Bodenbeschaffenheit – Ermittlung der Erosionsgefährdung von Böden durch Wasser mit Hilfe der ABAG, 19708, 2017. a
Diodato, N., Borrelli, P., Fiener, P., Bellocchi, G., and Romano, N.: Discovering historical rainfall erosivity with a parsimonious approach: A case study in Western Germany, J. Hydrol., 544, 1–9, 2017. a
Dlugoß, V., Fiener, P., Van Oost, K., and Schneider, K.: Model based analysis of lateral and vertical soil carbon fluxes induced by soil redistribution processes in a small agricultural catchment, Earth Surf. Proc. Land., 37, 193–208, 2012. a, b, c, d, e, f, g, h, i, j
Doetterl, S., Six, J., Van Wesemael, B., and Van Oost, K.: Carbon cycling in eroding landscapes: geomorphic controls on soil organic C pool composition and C stabilization, Glob. Change Biol., 18, 2218–2232, 2012. a
Doetterl, S., Berhe, A. A., Nadeu, E., Wang, Z., Sommer, M., and Fiener, P.: Erosion, deposition and soil carbon: A review of process-level controls, experimental tools and models to address C cycling in dynamic landscapes, Earth-Sci. Rev., 154, 102–122, 2016. a, b, c, d, e, f
Donald, C. M. and Hamblin, J.: The biological yield and harvest index of cereals as agronomic and plant breeding criteria, in: Advances in Agronomy, edited by: Brady, N. C., Vol. 28, 361–405, Academic Press, ISBN: 9780120007288, 1976. a
Dumanski, J., Peiretti, R., Benites, J. R., McGarry, D., and Pieri, C.: The paradigm of conservation agriculture, Proceedings of World Association of Soil and Water Conservation, 58–64, 2006. a
Dupin, B., de Rouw, A., Phantahvong, K. B., and Valentin, C.: Assessment of tillage erosion rates on steep slopes in northern Laos, Soil Till. Res., 103, 119–126, 2009. a, b
DWD Climate Data Center (CDC): Historical hourly station observations of 2 m air temperature and humidity for Germany, version v006 [data set], https://opendata.dwd.de/climate_environment/CDC/observations_germany/climate/hourly/air_temperature/historical/ (last access: 10 April 2024), 2018. a, b
DWD Climate Data Center (CDC): Historical hourly station observations of precipitation for Germany, version v21.3 [data set], https://opendata.dwd.de/climate_environment/CDC/observations_germany/climate/hourly/precipitation/historical/ (last access: 10 April 2024), 2021. a
ESA: Sentinel-2 user handbook, Tech. Rep., https://sentinels.copernicus.eu/documents/247904/685211/Sentinel-2_User_Handbook (last access: 20 July 2022), 2015. a
ESRI: ArcMap Desktop version 10.7.1, Redlands, CA, Environmental Systems Research Institute, 2019. a
Federal Statistical Office: Statistical yearbook for the Federal Republic of Germany, ISBN: 978-3-8246-1074-7, 1990–2018. a
Fiener, P., Dlugoß, V., and Van Oost, K.: Erosion-induced carbon redistribution, burial and mineralisation. Is the episodic nature of erosion processes important?, Catena, 133, 282–292, 2015. a
Frielinghaus, M. and Schmidt, R.: On-site and off-site damages by erosion in landscapes of East Germany, in: Farm land erosion in temperate plains environment and hills, Proceedings of the international symposium on farm land erosion, edited by: Wicherek, S., Elsevier, Paris, France, ISBN: 0444814663, 1993. a
Frielinghaus, M. and Vahrson, W.-G.: Soil translocation by water erosion from agricultural cropland into wet depressions (morainic kettle holes), Soil Till. Res., 46, 23–30, 1998. a
Frielinghaus, M., Petelkau, H., and Schmidt, R.: Wassererosion im norddeutschen Jungmoränengebiet, Z. Kulturtech. Landent., 33, 22–33, 1992. a
Gerontidis, D. V. S., Kosmas, C., Detsis, B., Marathianou, M., Zafirious, T., and Tsara, M.: The effect of moldboard plow on tillage erosion along a hillslope, J. Soil Water Conserv., 56, 147–152, 2001. a, b, c, d, e, f
Gerwitz, A. and Page, E. R.: An empirical mathematical model to describe plant root systems, J. Appl. Ecol., 11, 773–781, 1974. a
Govers, G., Vandaele, K., Desmet, P., Poesen, J., and Bunte, K.: The role of tillage in soil redistribution on hillslopes, Eur. J. Soil Sci., 45, 469–478, 1994. a, b, c, d, e, f, g, h, i, j
Govers, G., Quine, T. A., Desmet, P. J. J., and Walling, D. E.: The relative contribution of soil tillage and overland flow erosion to soil redistribution on agricultural land, Earth Surf. Proc. Land., 21, 929–946, 1996. a, b, c, d
Harden, J. W., Sharpe, J. M., Parton, W. J., Ojima, D. S., Fries, T. L., Huntington, T. G., and Dabney, S. M.: Dynamic replacement and loss of soil carbon on eroding cropland, Global Biogeochem. Cy., 13, 885–901, 1999. a, b, c
Heckrath, G., Djurhuus, J., Quine, T. A., Van Oost, K., Govers, G., and Zhang, Y.: Tillage erosion and its effect on soil properties and crop yield in Denmark, J. Environ. Qual., 34, 312–324, 2005. a
Heckrath, G., Halekoh, U., Djurhuus, J., and Govers, G.: The effect of tillage direction on soil redistribution by mouldboard ploughing on complex slopes, Soil Till. Res., 88, 225–241, 2006. a, b, c, d, e, f, g
Heinrich, I., Balanzategui, D., Bens, O., Blasch, G., Blume, T., Böttcher, F., Borg, E., Brademann, B., Brauer, A., Conrad, C., Dietze, E., Dräger, N., Fiener, P., Gerke, H. H., Güntner, A., Heine, I., Helle, G., Herbrich, M., Harfenmeister, K., Heußner, K.-U., Hohmann, C., Itzerott, S., Jurasinski, G., Kaiser, K., Kappler, C., Koebsch, F., Liebner, S., Lischeid, G., Merz, B., Missling, K. D., Morgner, M., Pinkerneil, S., Plessen, B., Raab, T., Ruhtz, T., Sachs, T., Sommer, M., Spengler, D., Stender, V., Stüve, P., and Wilken, F.: Interdisciplinary geo-ecological research across time scales in the Northeast German lowland observatory (TERENO-NE), Vadose Zone J., 17, 1–25, https://doi.org/10.2136/vzj2018.06.0116, 2018. a
Helsel, Z. R.: Fuel requirements and energy savings tips for field operations, Tech. Rep., Rutgers Cooperative Extension, 2007. a
Herbrich, M., Gerke, H. H., and Sommer, M.: Root development of winter wheat in erosion-affected soils depending on the position in a hummocky ground moraine soil landscape, J. Plant Nutr. Soil Sc., 181, 147–157, 2018. a, b
Herrmann, K.: Pflügen, Säen, Ernten, Landarbeit und Landtechnik in der Geschichte, Deutsches Museum, Rowohlt, Hamburg, Germany, 269 pp., ISBN: 9783499177224, 1985. a, b, c, d, e
Hoffmann, T., Schlummer, M., Notebaert, B., Verstraeten, G., and Korup, O.: Carbon burial in soil sediments from Holocene agricultural erosion, Central Europe, Global Biogeochem. Cy., 27, 828–835, 2013. a
Intergovernmental Panel on Climate Change: Climate Change and Land: an IPCC Special Report on climate change, desertification, land degradation, sustainable land management, food security, and greenhouse gas fluxes in terrestrial ecosystems, Tech. Rep., https://www.ipcc.ch/site/assets/uploads/2019/11/SRCCL-Full-Report-Compiled-191128.pdf (last access: 10 April 2024), 2019. a
Juřicová, A., Öttl, L. K., Wilken, F., Chuman, T., Žížala, D., Minařík, R., and Fiener, P.: Tillage erosion as an underestimated driver of carbon dynamics, Soil Till. Res., submitted, 2023. a, b
Kätterer, T. and Andrén, O.: Long-term agricultural field experiments in Northern Europe: analysis of the influence of management on soil carbon stocks using the ICBM model, Agr. Ecosyst. Environ., 72, 165–179, 1999. a, b
Kätterer, T., Reichstein, M., Andrén, O., and Lomander, A.: Temperature dependence of organic matter decomposition: a critical review using literature data analyzed with different models, Biol. Fert. Soils, 27, 258–262, 1998. a, b
Kimaro, D. N., Deckers, J. A., Poesen, J., Kilasara, M., and Msanya, B. M.: Short and medium term assessment of tillage erosion in the Uluguru Mountains, Tanzania, Soil Till. Res., 81, 97–108, 2005. a, b, c
Kirkels, F. M. S. A., Cammeraat, L. H., and Kuhn, N. J.: The fate of soil organic carbon upon erosion, transport and deposition in agricultural landscapes. A review of different concepts, Geomorphology, 226, 94–105, 2014. a
Kosmas, C., Gerontidis, S., Marathianou, M., Detsis, B., Zafiriou, T., Muysen, W. N., Govers, G., Quine, T., and Van Oost, K.: The effects of tillage displaced soil on soil properties and wheat biomass, Soil Till. Res., 58, 31–44, 2001. a, b
Koszinski, S., Gerke, H. H., Hierold, W., and Sommer, M.: Geophysical-based modeling of a kettle hole catchment of the morainic soil landscape, Vadose Zone J., 12, 1–18, https://doi.org/10.2136/vzj2013.02.0044, 2013. a
Kuratorium für Technik und Bauwesen in der Landwirtschaft e. V. (KTBL): Faustzahlen für die Landwirtschaft, Darmstadt, Germany, ISBN: 3784321941, 1951, 1970, 1980, 1993, 2005. a
Lal, R.: Soil carbon sequestration to mitigate climate change, Geoderma, 123, 1–22, 2004. a
Lal, R.: Accelerated soil erosion as a source of atmospheric CO2, Soil Till. Res., 188, 35–40, 2019. a
Landesamt für Umwelt, Gesundheit und Verbraucherschutz Brandenburgund Landesvermessung und Geobasisinformation Brandenburg: Digital elevation model with a grid size of 1 m (DEM1) derived from laser scan data, 2012. a
Le Quéré, C., Andrew, R. M., Canadell, J. G., Sitch, S., Korsbakken, J. I., Peters, G. P., Manning, A. C., Boden, T. A., Tans, P. P., Houghton, R. A., Keeling, R. F., Alin, S., Andrews, O. D., Anthoni, P., Barbero, L., Bopp, L., Chevallier, F., Chini, L. P., Ciais, P., Currie, K., Delire, C., Doney, S. C., Friedlingstein, P., Gkritzalis, T., Harris, I., Hauck, J., Haverd, V., Hoppema, M., Klein Goldewijk, K., Jain, A. K., Kato, E., Körtzinger, A., Landschützer, P., Lefèvre, N., Lenton, A., Lienert, S., Lombardozzi, D., Melton, J. R., Metzl, N., Millero, F., Monteiro, P. M. S., Munro, D. R., Nabel, J. E. M. S., Nakaoka, S., O'Brien, K., Olsen, A., Omar, A. M., Ono, T., Pierrot, D., Poulter, B., Rödenbeck, C., Salisbury, J., Schuster, U., Schwinger, J., Séférian, R., Skjelvan, I., Stocker, B. D., Sutton, A. J., Takahashi, T., Tian, H., Tilbrook, B., van der Laan-Luijkx, I. T., van der Werf, G. R., Viovy, N., Walker, A. P., Wiltshire, A. J., and Zaehle, S.: Global Carbon Budget 2016, Earth Syst. Sci. Data, 8, 605–649, https://doi.org/10.5194/essd-8-605-2016, 2016. a
Li, Y., Zhang, Q. W., Reicosky, D. C., Lindstrom, M. J., Bai, L. Y., and Li, L.: Changes in soil organic carbon induced by tillage and water erosion on a steep cultivated hillslope in the Chinese Loess Plateau from 1898–1954 and 1954–1998, J. Geophys. Res., 112, G01021, https://doi.org/10.1029/2005JG000107, 2007. a
Lindstrom, M. J., Nelson, W. W., and Schumacher, T. E.: Quantifying tillage erosion rates due to moldboard plowing, Soil Till. Res., 24, 243–255, 1992. a, b
Lischeid, G., Balla, D., Dannowski, R., Dietrich, O., Kalettka, T., Merz, C., Schindler, U., and Steidl, J.: Forensic hydrology: what function tells about structure in complex settings, Environ. Earth Sci., 76, 1–15, 2017. a
Lobb, D. A., Kachanoski, R. G., and Miller, M. H.: Tillage translocation and tillage erosion on shoulder slope landscape positions measured using 137Cs as a tracer, Can. J. Soil Sci., 75, 211–218, 1995. a, b, c
Lobb, D. A., Kachanoski, R. G., and Miller, M. H.: Tillage translocation and tillage erosion in the complex upland landscapes of southwestern Ontario, Canada, Soil Till. Res., 51, 189–209, https://doi.org/10.1016/S0167-1987(99)00037-9, 1999. a, b, c
Lobb, D. A., Huffman, E., and Reicosky, D. C.: Importance of information on tillage practices in the modelling of environmental processes and in the use of environmental indicators, J. Environ. Manag., 82, 377–87, 2007. a
Lugato, E., Smith, P., Borrelli, P., Panagos, P., Ballabio, C., Orgiazzi, A., Fernandez-Ugalde, O., Montanarella, L., and Jones, A.: Soil erosion is unlikely to drive a future carbon sink in Europe, Sci. Adv., 4, eaau3523, https://doi.org/10.1126/sciadv.aau3523, 2018. a
Lüthgens, C., Böse, M., and Preusser, F.: Age of the Pomeranian ice-marginal position in northeastern Germany determined by Optically Stimulated Luminescence (OSL) dating of glaciofluvial sediments, Boreas, 40, 598–615, 2011. a
Marques da Silva, J. R. and Alexandre, C.: Soil carbonation processes as evidence of tillage-induced erosion, Soil Till. Res., 78, 217–224, 2004. a, b, c, d, e, f
Mech, S. J. and Free, G. R.: Movement of soil during tillage operations, Agr. Eng., 23, 379–382, 1942. a, b, c, d
Minasny, B., Malone, B. P., McBratney, A. B., Angers, D. A., Arrouays, D., Chambers, A., Chaplot, V., Chen, Z.-S., Cheng, K., Das, B. S., Field, D. J., Gimona, A., Hedley, C. B., Hong, S. Y., Mandal, B., Marchant, B. P., Martin, M., McConkey, B. G., Mulder, V. L., O'Rourke, S., Richer-de Forges, A. C., Odeh, I., Padarian, J., Paustian, K., Pan, G., Poggio, L., Savin, I., Stolbovoy, V., Stockmann, U., Sulaeman, Y., Tsui, C.-C., Vågen, T.-G., Van Wesemael, B., and Winowiecki, L.: Soil carbon 4 per mille, Geoderma, 292, 59–86, 2017. a
Montgomery, D. R.: Soil erosion and agricultural sustainability, P. Natl. Acad. Sci. USA, 104, 13268–13272, 2007. a
Montgomery, J. A., McCool, D. K., Busacca, A. J., and Frazier, B. E.: Quantifying tillage translocation and deposition rates due to moldboard plowing in the Palouse region of the Pacific Northwest, USA, Soil Till. Res., 51, 175–187, 1999. a, b
Nadeu, E., Gobin, A., Fiener, P., Van Wesemael, B., and Van Oost, K.: Modelling the impact of agricultural management on soil carbon stocks at the regional scale: the role of lateral fluxes, Glob. Change Biol., 21, 3181–92, 2015. a, b, c, d, e, f
Naipal, V., Ciais, P., Wang, Y., Lauerwald, R., Guenet, B., and Van Oost, K.: Global soil organic carbon removal by water erosion under climate change and land use change during AD 1850–2005, Biogeosciences, 15, 4459–4480, https://doi.org/10.5194/bg-15-4459-2018, 2018. a
Nash, J. E. and Sutcliffe, J. V.: River flow forecasting through conceptual models, Part I: A discussion of principles, J. Hydrol., 10, 282–290, 1970. a
Nyssen, J., Poesen, J., Haile, M., Moeyersons, J., and Deckers, J.: Tillage erosion on slopes with soil conservation structures in the Ethiopian highlands, Soil Till. Res., 57, 115–127, 2000. a, b, c, d
Öttl, L. K., Wilken, F., Auerswald, K., Sommer, M., Wehrhan, M., and Fiener, P.: Tillage erosion as an important driver of in‐field biomass patterns in an intensively used hummocky landscape, Land Degrad. Dev., 32, 3077–3091, 2021. a, b, c, d, e, f
Öttl, L. K., Wilken, F., Hupfer, A., Sommer, M., and Fiener, P.: Non-inversion conservation tillage as an underestimated driver of tillage erosion, Sci. Rep., 12, 20704, https://doi.org/10.1038/s41598-022-24749-7, 2022. a
Papiernik, S. K., Lindstrom, M. J., Schumacher, J. A., Farenhorst, A., Stephens, K. D., Schumacher, T. E., and Lobb, D. A.: Variation in soil properties and crop yield across an eroded prairie landscape, J. Soil Water Conserv., 60, 388–395, 2005. a
Pauling, A., Luterbacher, J., Casty, C., and Wanner, H.: Five hundred years of gridded high-resolution precipitation reconstructions over Europe and the connection to large-scale circulation, Clim. Dynam., 26, 387–405, 2005. a, b
Pianosi, F., Beven, K., Freer, J., Hall, J. W., Rougier, J., Stephenson, D. B., and Wagener, T.: Sensitivity analysis of environmental models: A systematic review with practical workflow, Environ. Model. Softw., 79, 214–232, 2016. a
Poesen, J. and Govers, G.: A field-scale study on surface sealing and compaction on loam and sandy loam soils, Part II. Impact of soil surface sealing and compaction on water erosion processes, in: Assessment of soil surface sealing and crusting, edited by: Callebaut, F., Gabriels, D., and De Broodt, M., 183–193, Proceedings of the Symposium held in Ghent, Belgium, 1985. a
Poesen, J., Van Wesemael, B., Govers, G., Martinez-Fernandez, J., Desmet, P., Vandaele, K., Quine, T., and Degraer, G.: Patterns of rock fragment cover generated by tillage erosion, Geomorphology, 18, 183–197, 1997. a
Quine, T. A. and Zhang, Y.: Re-defining tillage erosion: quantifying intensity–direction relationships for complex terrain, 2. Revised mouldboard erosion model, Soil Use Manag., 20, 124–132, 2004. a, b, c
Quine, T. A., Desmet, P. J. J., Govers, G., Vandaele, K., and Walling, D. E.: A comparison of the roles of tillage and water erosion in landform development and sediment export on agricultural land near Leuven, Belgium, Variability in Stream Erosion and Sediment Transport, 224, 77–86, 1994. a, b
Quine, T. A., Govers, G., Poesen, J., Walling, D., Van Wesemael, B., and Martinez-Fernandez, J.: Fine-earth translocation by tillage in stony soils in the Guadalentin, south-east Spain: an investigation using caesium-134, Soil Till. Res., 51, 279–301, 1999a. a, b
Quine, T. A., Walling, D. E., Chakela, Q. K., Mandiringana, O. T., and Zhang, X.: Rates and patterns of tillage and water erosion on terraces and contour strips: evidence from caesium-137 measurements, Catena, 36, 115–142, 1999b. a, b, c, d, e, f
Quine, T. A., Walling, D. E., and Zhang, X.: Tillage erosion, water erosion and soil quality on cultivated terraces near Xifeng in the loess plateau, China, Land Degrad. Dev., 10, 251–274, 1999c. a, b
Quine, T. A., Basher, L. R., and Nicholas, A. P.: Tillage erosion intensity in the South Canterbury Downlands, New Zealand, Aust. J. Soil Res., 41, 789–807, 2003. a
Quinton, J. N., Öttl, L. K., and Fiener, P.: Tillage exacerbates the vulnerability of cereal crops to drought, Nature Food, 3, 472–479, 2022. a
Renard, K. G., Foster, G. R., Weesies, G. A., McCool, D. K., and Yoder, D. C.: Predictig soil erosion by water: A guide to conservation planning with the Revised Universal Soil Loss Equation (RUSLE), Agriculture Handbook 703, United States Department of Agriculture, Agricultural Research Service, 1997. a
Revel, J. C. and Guiresse, M.: Erosion due to cultivation of calcareous clay soils on the hillsides of south west France. I. Effect of former farming practices, Soil Till. Res., 35, 147–155, 1995. a
Ritchie, H. and Roser, M.: Crop yields, https://ourworldindata.org/crop-yields (last access: 17 November 2021), 2013. a
Rosenbloom, N. A., Doney, S. C., and Schimel, D. S.: Geomorphic evolution of soil texture and organic matter in eroding landscapes, Global Biogeochem. Cy., 15, 365–381, 2001. a
Rumpel, C. and Kögel-Knabner, I.: Deep soil organic matter – a key but poorly understood component of terrestrial C cycle, Plant Soil, 338, 143–158, 2011. a, b, c
Rust, I.: Aktualisierung der Bodenschätzung unter Berücksichtigung klimatischer Bedingungen, Ph.D. Georg-August-Universität Göttingen, 281 pp., 2006. a
Rymshaw, E., Walter, M. F., and Van Wambeke, A.: Processes of soil movement on steep cultivated hill slopes in the Venezuelan Andes, Soil Till. Res., 44, 265–272, 1997. a
Rösener, W.: Arbeitsgerät, Bodennutzung und agrarwirtschaftlicher Fortschritt, in: Bauern im Mittelalter, edited by: Rösener, W., 118–133, C. H. Beck'sche Verlagsbuchhandlung, Munich, ISBN: 3406304486, 1985. a
Sanderman, J., Hengl, T., and Fiske, G. J.: Soil carbon debt of 12,000 years of human land use, P. Natl. Acad. Sci. USA, 114, 9575–9580, 2017. a
Schwertmann, U., Vogl, W., and Kainz, M.: Bodenerosion durch Wasser. Vorhersage des Bodenabtrags und Bewertung von Gegenmaßnahmen, Ulmer Verlag, Stuttgart, Germany, ISBN: 3800130815, 1987. a
Sommer, M., Gerke, H. H., and Deumlich, D.: Modelling soil landscape genesis. A “time split” approach for hummocky agricultural landscapes, Geoderma, 145, 480–493, 2008. a, b
Sommer, M., Hoffmann, M., Gerke, H. H., and Meier, K.: Multiyear soil, plant, weather and treatment data from an erosion-affected soil landscape in the Uckermark region, ZALF [data set], https://doi.org/10.4228/ZALF.DK.64, 2020. a, b
Song, X. P., Hansen, M. C., Stehman, S. V., Potapov, P. V., Tyukavina, A., Vermote, E. F., and Townshend, J. R.: Global land change from 1982 to 2016, Nature, 560, 639–643, 2018. a
Staatliche Zentralverwaltung für Statistik: Statistisches Jahrbuch der Deutschen Demokratischen Republik, ISSN: 03234258, 1956–1990. a
Stallard, R. F.: Terrestrial sedimentation and the carbon cycle: Coupling weathering and erosion to carbon burial, Global Biogeochem. Cy., 12, 231–257, 1998. a, b
Statistisches Bundesamt (Destatis): Land- und Forstwirtschaft, Fischerei, Bodenbearbeitung, Erosionsschutz, Fruchtwechsel/Agrarstrukturerhebung, 2016, 2017. a
Su, Z. A. and Zhang, J. H.: Effects of Tillage Erosion on Soil Redistribution in a Purple Soil with Steep Sloping Terraces, 2010 International Conference on Management and Service Science, Wuhan, China, 2010, 1–4, https://doi.org/10.1109/ICMSS.2010.5577125, 2010. a, b
Thapa, B. B., Cassel, D. K., and Garrity, D. P.: Assessment of tillage erosion rates on steepland Oxisols in the humid tropics using granite rocks, Soil Till. Res., 51, 233–243, 1999a. a
Thapa, B. B., Cassel, D. K., and Garrity, D. P.: Ridge tillage and contour natural grass barrier strips reduce tillage erosion, Soil Till. Res., 51, 341–356, 1999b. a, b
Tiessen, K. H. D., Mehuys, G. R., Lobb, D. A., and Rees, H. W.: Tillage erosion within potato production systems in Atlantic Canada: I. Measurement of tillage translocation by implements used in seedbed preparation, Soil Till. Res., 95, 308–319, 2007. a, b, c, d
Tiessen, K. H. D., Sancho, F. M., Lobb, D. A., and Mehuys, G. R.: Assessment of tillage translocation and erosion by the disk plow on steepland Andisols in Costa Rica, J. Soil Water Conserv., 65, 316–328, 2010. a, b, c, d, e, f
Tsara, M., Gerontidis, S., Marathianou, M., and Kosmas, C.: The long-term effect of tillage on soil displacement of hilly areas used for growing wheat in Greece, Soil Use Manag., 17, 113–120, 2001. a, b
Tum, M. and Günther, K. P.: Validating modelled NPP using statistical yield data, Biomass Bioenerg., 35, 4665–4674, 2011. a
Turkelboom, F., Poesen, J., Ohler, I., and Ongprasert, S.: Reassessment of tillage erosion rates by manual tillage on steep slopes in northern Thailand, Soil Till. Res., 51, 245–259, 1999. a, b, c, d, e, f, g, h, i, j, k
United Nations Framework Convention on Climate Change: Kyoto Protocol to the United Nations Framework Convention on Climate Change, Tech. Rep., https://unfccc.int/resource/docs/convkp/kpeng.pdf (last access: 10 April 2024), 1998. a
Van der Meij, W. M., Temme, A. J. A. M., Wallinga, J., Hierold, W., and Sommer, M.: Topography reconstruction of eroding landscapes. A case study from a hummocky ground moraine (CarboZALF-D), Geomorphology, 295, 758–772, 2017. a, b, c
Van der Meij, W. M., Reimann, T., Vornehm, V. K., Temme, A. J. A. M., Wallinga, J., Beek, R., and Sommer, M.: Reconstructing rates and patterns of colluvial soil redistribution in agrarian (hummocky) landscapes, Earth Surf. Proc. Land., 44, 2408–2422, https://doi.org/10.1002/esp.4671, 2019. a, b, c
van der Meij, W. M., Temme, A. J. A. M., Wallinga, J., and Sommer, M.: Modeling soil and landscape evolution – the effect of rainfall and land-use change on soil and landscape patterns, SOIL, 6, 337–358, https://doi.org/10.5194/soil-6-337-2020, 2020. a
Van Muysen, W. and Govers, G.: Soil displacement and tillage erosion during secondary tillage operations: the case of rotary harrow and seeding equipment, Soil Till. Res., 65, 185–191, 2002. a, b, c, d, e, f
Van Muysen, W., Govers, G., Bergkamp, G., Roxo, M., and Poesen, J.: Measurement and modelling of the effects of initial soil conditions and slope gradient on soil translocation by tillage, Soil Till. Res., 51, 303–316, 1999. a, b
Van Muysen, W., Govers, G., Van Oost, K., and Van Rompaey, A.: The effect of tillage depth, tillage speed, and soil condition on chisel tillage erosivity, J. Soil Water Conserv., 55, 355–364, 2000. a, b, c, d, e, f, g, h
Van Muysen, W., Van Oost, K., and Govers, G.: Soil translocation resulting from multiple passes of tillage under normal field operating conditions, Soil Till. Res., 87, 218–230, 2006. a, b, c, d, e
Van Oost, K. and Six, J.: Reconciling the paradox of soil organic carbon erosion by water, Biogeosciences, 20, 635–646, https://doi.org/10.5194/bg-20-635-2023, 2023. a, b, c, d, e
Van Oost, K., Govers, G., and Desmet, P.: Evaluating the effects of changes in landscape structure on soil erosion by water and tillage, Landscape Ecology, 15, 577–589, 2000. a, b, c
Van Oost, K., Govers, G., and Van Muysen, W.: A process-based conversion model for caesium-137 derived erosion rates on agricultural land: an integrated spatial approach, Earth Surf. Proc. Land., 28, 187–207, 2003. a, b
Van Oost, K., Govers, G., Quine, T. A., Heckrath, G., Olesen, J. E., De Gryze, S., and Merckx, R.: Landscape-scale modeling of carbon cycling under the impact of soil redistribution: The role of tillage erosion, Global Biogeochem. Cy., 19, GB4014, https://doi.org/10.1029/2005GB002471, 2005. a, b, c, d, e, f, g, h, i
Van Oost, K., Govers, G., De Alba, S., and Quine, T. A.: Tillage erosion: A review of controlling factors and implications for soil quality, Prog. Phys. Geogr., 30, 443–466, 2006. a, b, c, d, e, f, g, h, i, j, k, l, m, n, o, p, q, r, s, t, u, v, w, x, y, z, aa, ab, ac, ad, ae, af, ag, ah, ai, aj, ak
Van Oost, K., Quine, T. A., Govers, G., De Gryze, S., Six, J., Harden, J. W., Ritchie, J. C., McCarty, G. W., Heckrath, G., Kosmas, C., Giraldez, J. V., Marques da Silva, J. R., and Merckx, R.: The impact of agricultural soil erosion on the global carbon cycle, Science, 318, 626–629, 2007. a, b, c, d
Verch, G.: Longterm effects of different mineral and organic fertilizer and soil cultivation on the yield in a crop rotation (Northeast Germany), https://doi.org/10.4228/ZALF.DK.63, 2020. a
Volkert, W.: Dreifelderwirtschaft, in: Adel bis Zunft. Ein Lexikon des Mittelalters, edited by: Volkert, W., C. H. Beck'sche Verlagsbuchhandlung, Munich,p. 49, ISBN: 3406354998, 1991. a
Wang, Y., Zhang, Z., Zhang, J., Liang, X., Liu, X., and Zeng, Y.: Effect of surface rills on soil redistribution by tillage erosion on a steep hillslope, Geomorphology, 380, 107637, https://doi.org/10.1016/j.geomorph.2021.107637, 2021. a, b
Wang, Z., Hoffmann, T., Six, J., Kaplan, J. O., Govers, G., Doetterl, S., and Van Oost, K.: Human-induced erosion has offset one-third of carbon emissions from land cover change, Nat. Clim. Change, 7, 345–349, 2017. a, b, c
Wehrhan, M. and Sommer, M.: A parsimonious approach to estimate soil organic carbon applying unmanned aerial system (UAS) multispectral imagery and the topographic position index in a heterogeneous soil landscape, Remote Sens., 13, 3557, https://doi.org/10.3390/rs13183557, 2021. a, b
Wilken, F., Fiener, P., and Van Oost, K.: Modelling a century of soil redistribution processes and carbon delivery from small watersheds using a multi-class sediment transport model, Earth Surf. Dynam., 5, 113–124, https://doi.org/10.5194/esurf-5-113-2017, 2017a. a, b
Wilken, F., Sommer, M., Van Oost, K., Bens, O., and Fiener, P.: Process-oriented modelling to identify main drivers of erosion-induced carbon fluxes, SOIL, 3, 83–94, https://doi.org/10.5194/soil-3-83-2017, 2017b. a, b, c, d
Wilken, F., Baur, M., Sommer, M., Deumlich, D., Bens, O., and Fiener, P.: Uncertainties in rainfall kinetic energy-intensity relations for soil erosion modelling, Catena, 171, 234–244, 2018. a
Wilken, F., Ketterer, M., Koszinski, S., Sommer, M., and Fiener, P.: Understanding the role of water and tillage erosion from 239+240Pu tracer measurements using inverse modelling, SOIL, 6, 549–564, https://doi.org/10.5194/soil-6-549-2020, 2020. a, b, c, d, e, f, g, h
Winnige, B., Frielinghaus, M., and Li, Y.: Bedeutung der Bearbeitungserosion im Jungmoränengebiet, Mitteilungen der Deutschen Bodenkundlichen Gesellschaft, 101, 93–94, 2003. a
Zhang, J., Lobb, D. A., Li, Y., and Liu, G. C.: Assessment of tillage translocation and tillage erosion by hoeing on the steep land in hilly areas of Sichuan, China, Soil Till. Res., 75, 99–107, 2004a. a, b
Zhang, J. H., Frielinghaus, M., Tian, G., and Lobb, D. A.: Ridge and contour tillage effects on soil erosion from steep hillslopes in the Sichuan Basin, China, J. Soil Water Conserv., 59, 277–284, 2004b. a, b, c
Zhang, J. H., Su, Z. A., and Nie, X. J.: An investigation of soil translocation and erosion by conservation hoeing tillage on steep lands using a magnetic tracer, Soil Till. Res., 105, 177–183, 2009. a, b