the Creative Commons Attribution 4.0 License.
the Creative Commons Attribution 4.0 License.
 | 29 Apr 2025
The clay mineralogy rather than the clay content determines radiocaesium adsorption in soils on a global scale
Margot Vanheukelom
Nina Haenen
Talal Almahayni
Lieve Sweeck
Nancy Weyns
May Van Hees
Erik Smolders
The transfer of radiocaesium (137Cs) from soil to crops is the main long-term radiation risk after nuclear accidents. The prevailing concept is that 137Cs sorption in soil – and, hence, its bioavailability – is controlled by soil clay content (0–2 µm). This study tested this assumption using 24 soils collected worldwide. The radiocaesium interception potential (RIP), i.e., 137Cs adsorption, was measured for the bulk soils and for their clay and silt fractions. The RIP varied by a factor of 438 among soils and was unrelated to the clay content (p > 0.05). The RIP in the clay fractions was lowest for young volcanic soils with allophane and mica and for highly weathered tropical soils with kaolinite. In contrast, RIP values about 2 orders of magnitude higher were found in intermediate-weathered temperate soils dominated by illite. Soil RIP was, hence, related to soil illite content (R2= 0.50; p < 0.001). A significant fraction of soil RIP originated from clay minerals embedded in the silt fraction. The sum of RIP in clay and silt fractions overestimated the soil RIP by, on average, a factor of 2, indicating that the isolation of clay opens selective 137Cs sorption sites inaccessible in intact soils. Soil mineralogy, not just clay content, governs soil RIP. In terms of validity, existing 137Cs bioavailability models require recalibration for use on a global scale.
- Article
(10602 KB) - Full-text XML
- BibTeX
- EndNote


Global interest in nuclear energy requires environmental-impact analyses that rely on models predicting the transfer of radiocaesium from soil to plants. There are concerns about radiocaesium (137Cs) due to the long half-life (30 years) and biochemical similarity to potassium (K), a major plant nutrient, which allows it to transfer from soil into the food chain. Following nuclear incidents, such as Chornobyl and Fukushima, models were developed to predict 137Cs soil-to-plant transfer in affected regions (Absalom et al., 1999, 2001; Tarsitano et al., 2011; Uematsu et al., 2016). These models account for 137Cs adsorption in soil and the effects of competing ions, mainly K, that control its absorption and translocation to the edible fraction of the crop. Radiocaesium, in trace concentrations, is selectively adsorbed into wedge-shaped edges of micaceous clay minerals in soils formed by weathering (Fanning et al., 1989; Sawhney, 1972), called frayed-edge sites (FESs). The radiocaesium interception potential (RIP), reflecting selectivity for 137Cs+ and the capacity of adsorption sites, can be easily quantified by laboratory tests (Cremers et al., 1988; Wauters et al., 1996b). The RIP in soil depends on both the content of FES-bearing clay minerals and the number of FESs within these minerals, which varies with clay mineral type and weathering stage (Maes et al., 1999a, b). Thus, the bioavailability of 137Cs in soils is influenced by soil mineralogy, which depends on the parent material and the weathering stage.
However, the above-mentioned soil-to-plant transfer models typically assume a uniform mineral composition, which does not accurately reflect the diversity in soil mineralogy on a global scale (Vandebroek et al., 2012). These models assume that the RIP in the soil is related to the clay content and that the RIP in the soil is derived by multiplying soil clay content, i.e., 0–2 µm fraction, with the RIP of the clay fraction in soil (RIPclay). In so doing, the models implicitly assume that (1) clay minerals with FESs, commonly found in the clay fraction, are absent in other soil texture fractions, such as silt or sand, and (2) variations in the mineral composition of the clay fraction itself do not significantly affect the overall RIP of the soil. Despite these simplifications, these models have shown a high predictive power, even across soils from contrasting locations, weathering stages, and soil mineralogy (Vanheukelom et al., 2024). However, a proper fit of the 137Cs bioavailability data does not imply that the model assumptions are valid because compensating mechanisms, e.g., incorrect estimates of available K, occur, as recently discussed (Vanheukelom et al., 2024). In a recent study where different clay minerals were mixed with sand, it was shown that the RIP and 137Cs transfers to grass varied by over 2 orders of magnitude with equal clay contents (Vanheukelom et al., 2023). A follow-up study with natural soil samples collected globally showed that the soil RIP divided by its clay content (RIP clay) varied by 3 orders of magnitude (Vanheukelom et al., 2024). The lowest RIP clay ratios were found in soils dominated by young clays, such as allophane and mica (740 mmol kg−1 clay), and in soils with highly weathered clays, such as kaolinite (320 mmol kg−1 clay). The largest ratios were found in the soils of temperate regions in which illite dominates (26 000 mmol kg−1 clay). In that study, the RIP and soil mineralogy were determined based only on the bulk soils, but the mineralogy and RIP of the clay and silt fractions were not determined.
This study aims to verify or falsify the main premise of radiocaesium soil-to-plant transfer models, i.e., that soil RIP is primarily controlled by its clay content and that the RIP of the clay fraction is fairly constant. Specifically, we measured RIPs in soils and in their corresponding isolated-texture fractions (0–2 and 2–50 µm), and we measured mineralogy by X-ray diffraction (XRD) in both fractions. We selected the soils of two weathering sequences from Kenya (N=8) and the Philippines (N=6) and the soils of various parent materials and weathering stages sampled around the world (N=10). The 0–2 and 2–50 µm fractions were isolated using ultrasonic disaggregation and Na+ resin without removing any cementing soil constituents such as organic matter or iron minerals, reflecting their condition in the intact soil.
2.1 Soil collection
Soil sequences sampled in Kenya (N=8) and the Philippines (N=6) represented soils at various weathering stages. In addition, soils were sampled at multiple locations worldwide (N=10), representing soils from various parent materials. The geology of the parent materials was derived from a global map (https://onegeology.org/, last access: 6 August 2024). Soils from Japan were derived from volcanic rocks from non-alkali pyroclastic flows (Miyakonojo) and from sedimentary rocks of the Late Pleistocene–Holocene (Ogata, Yoshiki). Soils from the Philippines were derived from felsic volcanic rocks of the Quaternary period. Soil from Spain was derived from alluvial deposits of the Holocene epoch (Isla Mayor). Soils from Austria and the United States were derived from Cenozoic sedimentary rocks (Gross Enzersdorf, Sidney), and in Italy, this deposit was turbidite (Aliminusa). Soils from Kenya were derived from Cenozoic volcanic rocks (Mount Elgon) and from Neoproterozoic metamorphic rocks (Endebess, Kitale), including andesite and dacite. Soil from China was derived from Paleozoic felsic plutonic rocks (Changchun). Soil from Madagascar was derived from Neoarchean plutonic and metamorphic rocks (Behenjy). The intact soil samples, noted as bulk soils, were characterized in a previous 137Cs pot experiment with grass (Vanheukelom et al., 2024), except for two soils from Kenya (Mount Elgon 3 and Kitale 3), which were characterized following the same procedures.
2.2 Clay and silt isolation from soil
The texture fractions were isolated from soils by means of mechanical disaggregation and dispersion using a sodium cation resin (Na+ resin) (Rouiller et al., 1972). This method was preferred over the widely used standardized pipet method with the removal of organic matter or other cementing materials (ISO, 1998) as it is assumed to be a less biased method and appropriate for andic (Delvaux et al., 1989) and ferralitic (Bartoli et al., 1991) soils. Air-dried bulk soils were milled and sieved (2 mm). Air-dried bulk soil weights were corrected for moisture (60 °C). Deionized water (solid : liquid of 1 g soil : 20 mL water) was added to the soils and shaken end-over-end (16 h). Sand fractions were separated by wet sieving (50 µm; certified DIN ISO 3310-1; VWR®) and were repeatedly ultrasonically treated (15 min at 90 J min−1; Misonix Sonicator® XL2020) until the sand grains were clear. The < 50 µm fractions were flocculated by adding drops of saturated CaCl2 so that the excess water could be removed by siphoning. The Na+ resin (> 500 µm; Amberlite® IR-120 (H); Supelco®) was added to < 50 µm fractions (1 g soil : 10 mL resin), which were shaken end-over-end (16 h). The resin was removed by wet sieving (500 µm superimposing 50 µm) and washed with deionized water until the filtrate was clear. The < 50 µm fractions in deionized water (500 mL) in graduated cylinders were placed in a water bath (20.0 ± 0.5 °C). The < 50 µm was plunged, and the 0–2 µm fraction (clay fraction hereafter) in the suspension was siphoned off 20 cm below the surface using an upward-pointed tube connected to a pump after 15 h 28 min 18 s. Plunging and siphoning were repeated (three to five times) until the suspension was clear. The remaining 2–50 µm fraction (silt fraction hereafter) was recovered. All fractions were dried in the oven (60 °C; 48 h). Fractions were cooled to room temperature in a desiccator and weighted analytically (accuracy of 0.0001 g; OHAUS Adventurer™ AR2140). The particle size distributions of the Na+ resin method and the pipet method were compared using reference soils from proficiency tests (Table A1 in the Appendix). The clay contents for three of the four soils matched very well for both methods, but for one soil (from a temperate region), the resin method identified twice as much clay as the pipet method.
2.3 X-ray diffraction (XRD)
The mineralogy of clay and silt fractions was analyzed by XRD. The mineralogy of bulk soils was quantified, and the soil weathering index was calculated, which was previously reported (Vanheukelom et al., 2024; Table B1 in this study). The clay and silt fractions were prepared as oriented slides to enhance the basal reflections (Moore and Reynolds, 1997) in air-dried Ca form and solvated-ethylene-glycol form. The fractions in deionized water (5 mL) were ultrasonically disaggregated (1 min at 420 J min−1; Sonics Vibra-Cell™ VCX-130) and put into dialysis membrane bags (6–8 kDa; Spectra/Por®). These were immersed in 1 mol L−1 CaCl2 solution (250 mL; 16 h). Excess electrolytes were removed by replacing the outer solution with deionized water and shaking until the conductivity of the outer solution matched that of the deionized water. The fractions were recovered from the dialysis bags and dried in the oven (60 °C; 16 h). Subsamples of clay and silt fractions were taken to make smear slides on glass plates for XRD measurement. Dried fractions were deposited on a glass plate (10 mg cm−2), and two drops of deionized water were added to form a paste that was smeared until a uniform, thick film with a smooth surface was obtained. The Ca-saturated smear slides were air-dried and measured by XRD. The smear slides were placed in a desiccator filled with ethylene glycol and then put in the oven (60 °C; 16 h). The smear slides solvated with ethylene glycol were measured by XRD. The XRD device (Bruker D8 Advance), in reflection geometry with Cu–Kα radiation with an Ni–Kβ filter, had a 435 mm goniometer radius; a rotating sample holder (15 rpm); a divergence slit (0.25°); fixed anti-scatter slits (5.69 mm); soller slits (2.5°); a detector slit (11.55 mm); and a multi-strip detector (Bruker LYNXEYE) scanning at 40 kV and 30 mA, ranging over 2–47 °2θ, with 0.015 °2θ step sizes and 0.5 s counting time. Mineralogies of clay fractions were quantified, and silt fractions were identified with Sybilla software (© Chevron ETC) that used the multi-specimen method by fitting the model on the XRD record in air-dried Ca form and in an ethylene-glycol-solvated state (Zeelmaekers et al., 2011). A constant function removed the background; patterns were shifted to match kaolinite mineral peaks; and the step size was increased (0.05° 2θ) to facilitate calculations, which was acceptable given the wide clay peaks. The results of quantified phases were accepted if the model fit in the ethylene glycol state matched the model in the air-dried state, and the average of the quantified phases in two states was taken (Tables 2 and C1).
2.4 Radiocaesium interception potential (RIP)
The RIP of clay and silt fractions was analyzed by exchanging 137Cs with K cations at selective adsorption sites and blocking non-selective sites with Ca cations (Wauters et al., 1996a). The RIPs of bulk soils were previously reported (Vanheukelom et al., 2024; Table B2 in this study). Subsamples of clay and silt fractions (0.2–0.4 g) were put into dialysis membrane bags (6–8 kDa; Spectra/Por®). A solution of 0.5 mmol K L−1 and 100 mmol Ca L−1 was added to membrane bags (10 mL) and into pots (150 mL). Membrane bags were immersed in the pots and shaken end-over-end (24 h). The outer K–Ca solution (150 mL) was renewed and shaken (24 h). Next, the outer solution was renewed with carrier-free 200 kBq 137Cs mL−1 with the K–Ca solution and was shaken (24 h). The 137Cs concentration in the initial and final outer solution was measured with a gamma counter (PerkinElmer 1480 WIZARD 3”). The RIP was calculated by multiplying the measured 137Cs solid–liquid distribution coefficient by 0.5 mmol K L−1 in the solution.
2.5 Statistical analyses
JMP® Pro software (version 17.0.0, SAS Institute Inc., Cary, NC, 1989–2024) was used. Pearson correlation coefficients were calculated with a pairwise method based on the means (n=1 or n=3) or the log-transformed means if skewness was closer to 0 after transformation (Table D1). Linear regression was used (p < 0.05) to obtain relations describing the RIP, with selected explanatory variables.
3.1 Properties of bulk soil and fractions
The grouping of the 24 soil samples by weathering stages showed that the youngest soils had the highest carbon contents (5.2 g 100 g−1) and that the most weathered soils had a higher clay content (43 g 100 g−1), while soils in the intermediate stage of weathering had the highest pH (5.9) and cation exchange capacity (CEC) (23 cmolc kg−1; Table 1).
Table 1Properties of bulk soils as weathering index (WI) increased (detailed in Tables B1 and B2). The number of soils per group (N) and the minimum (min), maximum (max), and geometric mean (GM in bold) for each group are given.
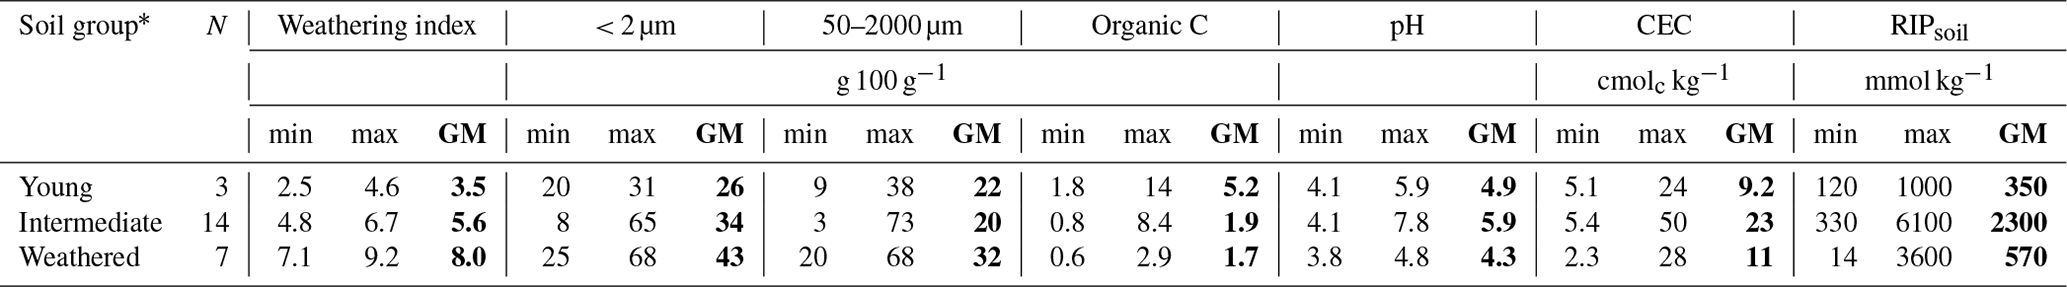
* Soils are grouped as young (WI = 2.5–4.7), intermediate (WI = 4.7–7.0), or weathered (WI = 7.0–9.2) based on X-ray diffraction mineralogy measured based on bulk soil.
3.2 Mineralogy of the soil fractions
Not all mineral phases could be quantified (Figs. C3 to C26), and so the mineralogy of the fractions was only indicative. The Sybilla software library only included mineral phases of illite, expanded vermiculite or smectite, kaolinite, and chlorite phyllosilicates, as well as interstratified combinations of these. Other phases, such as allophane, mica, and feldspars, could not be quantified, and so mineralogies of the clay fractions were proportions of a limited selection of the aforementioned phyllosilicates (Tables 2 and C1). The identification of illite was based on the 10 Å peak, which overlaps with the peaks of mica, such as muscovite and biotite, and so no distinction could be made between them. However, illite is expected in the clay fraction, and mica is expected in the silt fraction, and so the 10 Å peak in the clay fraction is probably mainly illite.
It was assumed that the soil sequences were derived from the same parent material, i.e., with similar mineral compositions, and so similar mineral phases were identified within the sequence. The sequence of soils from Kenya had enrichment of kaolinite and illite in the clay fraction with increasing weathering (Fig. C1). The youngest soil at the highest sampling point on the mountain (Mount Elgon 1) did not have clear peaks of phyllosilicates that could be distinguished from the background noise in the XRD pattern (Fig. C4). However, the right-tailed broad peak around 4.4–4.5 Å of hkl reflections indicated the presence of disordered 1:1 phyllosilicates, such as halloysite or poorly crystallized, fine-sized kaolinite. Wider humps around 3.52 and 2.50 Å confirmed the presence of allophane, previously determined by oxalic acid extraction (3 g allophane 100 g−1 bulk soil; Vanheukelom et al., 2024). In more weathered soils on the mountain slope (Fig. C18), the kaolinite peak was clear around 7.20–7.50 Å. This broad peak indicated a mixed-layer mineral phase with kaolinite. A small peak around 10.1 Å indicated illite mineral phases. In a moist valley soil (Endebess; Fig. C20), a broad peak at 15.3 Å, which shifted to 16.3 Å after ethylene glycol treatment, indicated expanding phyllosilicates, which was to be expected in a Vertisol (Table B2). In the most weathered upland soils (Kitale 2 and 3; Figs. C23 and C24), the kaolinite and illite peaks were largest (Fig. C1).
The sequence of soils from the Philippines showed enrichment of kaolinite in the clay fractions with increasing weathering (Fig. C2). In the youngest soil (Pagsanjan 1; Fig. C5), a peak at 14.8 Å shifted to 16.6 Å following treatment with ethylene glycol, indicating the presence of expanded phyllosilicates. In one soil (Pagsanjan 5; Fig. C22), a small peak at 11.3 Å suggested the presence of illite mixed with expanded phyllosilicates, but it was barely detectable in the XRD pattern after ethylene glycol treatment. The most weathered soil of the sequence (Cavinti; Fig. C26) showed the largest kaolinite peaks at 7.28 and 3.59 Å.
The variability in mineralogy between young and highly weathered soils was even more pronounced in the other soils that differed in terms of parent material and weathering stage. The youngest soil from Miyakonojo (Japan), derived from volcanic ash, contained allophane characterized by wide humps around 3.50 and 2.50 Å in the clay fraction (Fig. C3) and also showed what was previously confirmed by oxalic acid extraction (11 g allophane 100 g−1 bulk soil; Vanheukelom et al., 2024). However, otherwise, no clear peaks of phyllosilicates could be identified in the volcanic soil. Soils in the intermediate stage of weathering, such as in Rots (France; Fig. C12) and Isla Mayor (Spain; Fig. C15), mainly had peaks of illite at 10, 5, and 3.33 Å. In the same group of soils at the intermediate-weathering stage, expanded phyllosilicates with shifting peaks after ethylene glycol treatment were very clear in Ogata (Japan), with the 15.3 Å peak shifting to 16.7 Å (Fig. C10), and in Changchun (China), with the 14.3 Å peak shifting to 17.5 Å (Fig. C13). These soils at an intermediate stage of weathering also contained, to a lesser extent, kaolinite, with peaks at 7.1–7.2 Å. In some soils, such as in Yoshiki, Japan, mica was identified in the silt fraction, with peaks around 10, 5, and 2.55 Å (Fig. C27). The weathered soil from Behenjy (Madagascar) had peaks of kaolinite at 7.16, 4.37, and 3.57 Å (Fig. C25).
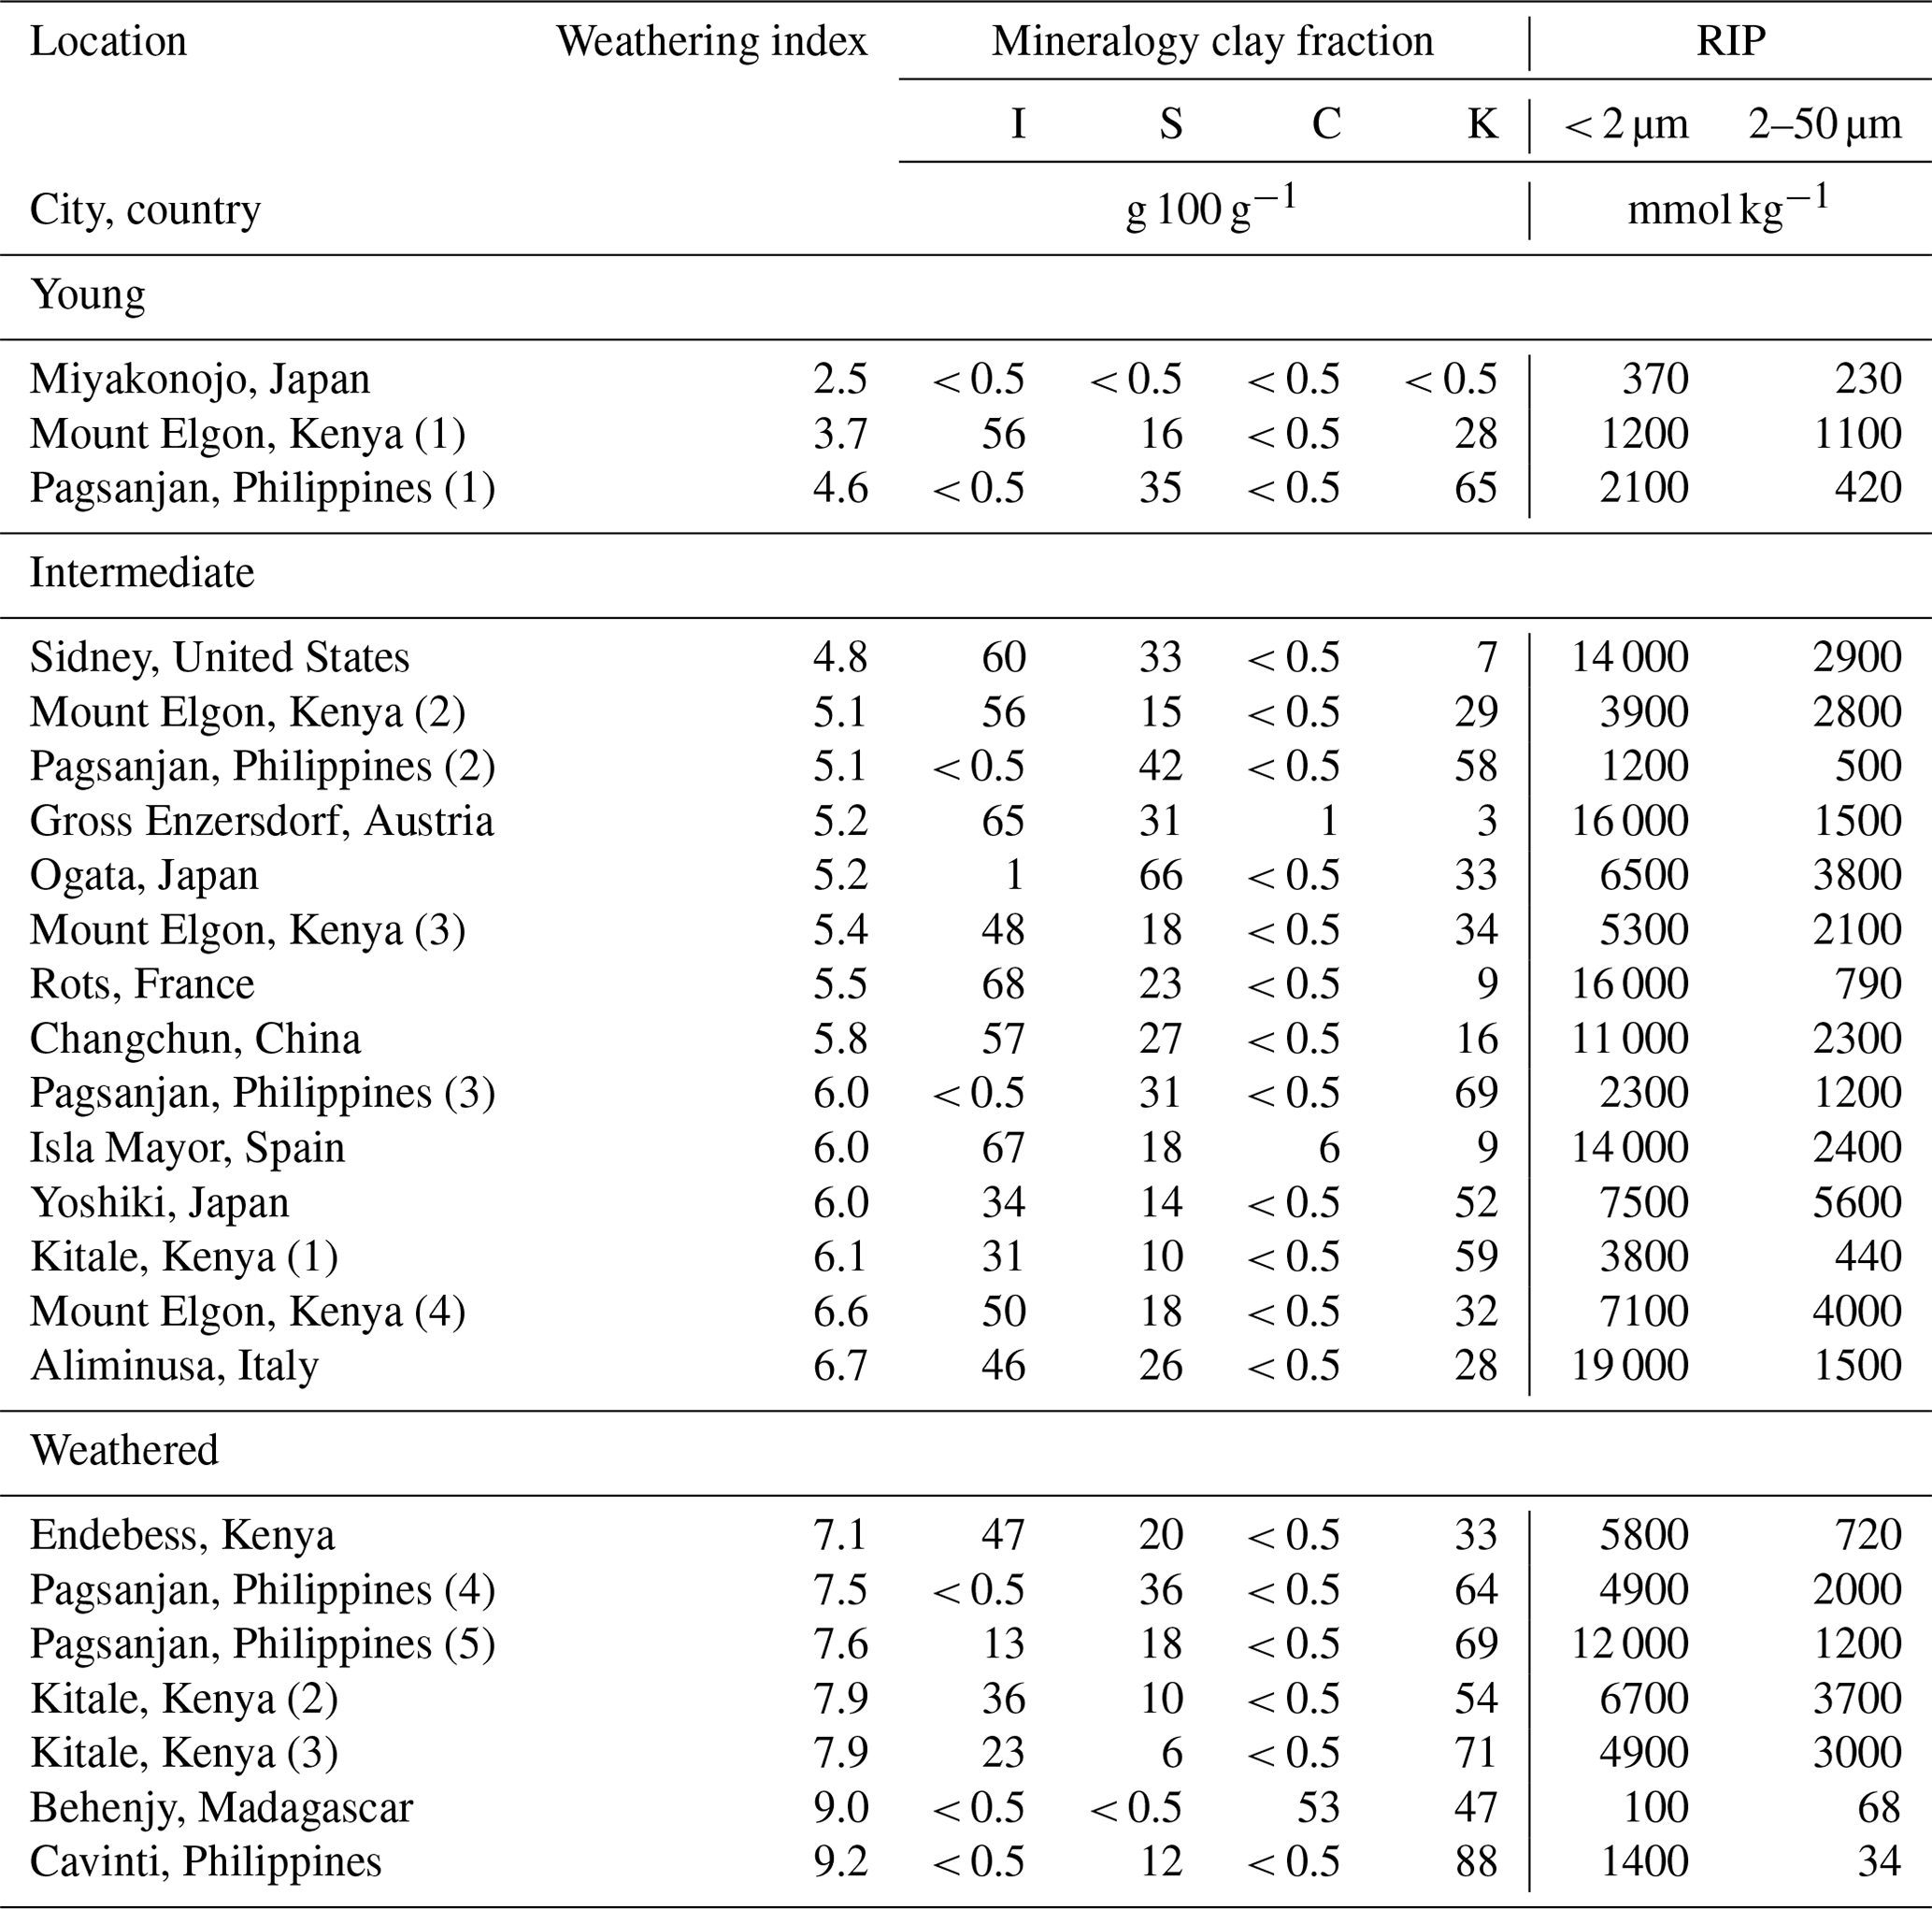
Table 2Mineralogy of the clay fraction and RIPs of the clay and silt fractions of soils grouped by increasing weathering index (detailed in Table C1). I denotes illite, S denotes expanded phyllosilicate, C denotes chlorite, and K denotes kaolinite. Note that the mineral phases quantified are limited to illite, vermiculite, smectite, kaolinite, chlorite, and their mixed layers; other phases (e.g., allophane, mica, feldspars) were not included in the analysis.
3.3 137Cs adsorption in bulk soil and fractions
The RIP of bulk soils was lowest in the youngest (350 mmol kg−1) and most weathered soils (570 mmol kg−1; Table 1). The soil RIP was not correlated with the texture, organic C, or CEC (Table D1) but was positively correlated with pH (r=0.66; p < 0.001), possibly because pH acts as a proxy for other factors influencing the RIP as pH has no direct effect on 137Cs sorption in soils (Wauters et al., 1994). A lower pH often characterizes highly weathered soils with fewer FES-bearing clay minerals. Notably, the RIP measured in bulk soils was not explained by the clay content (p > 0.05) (Fig. 1).
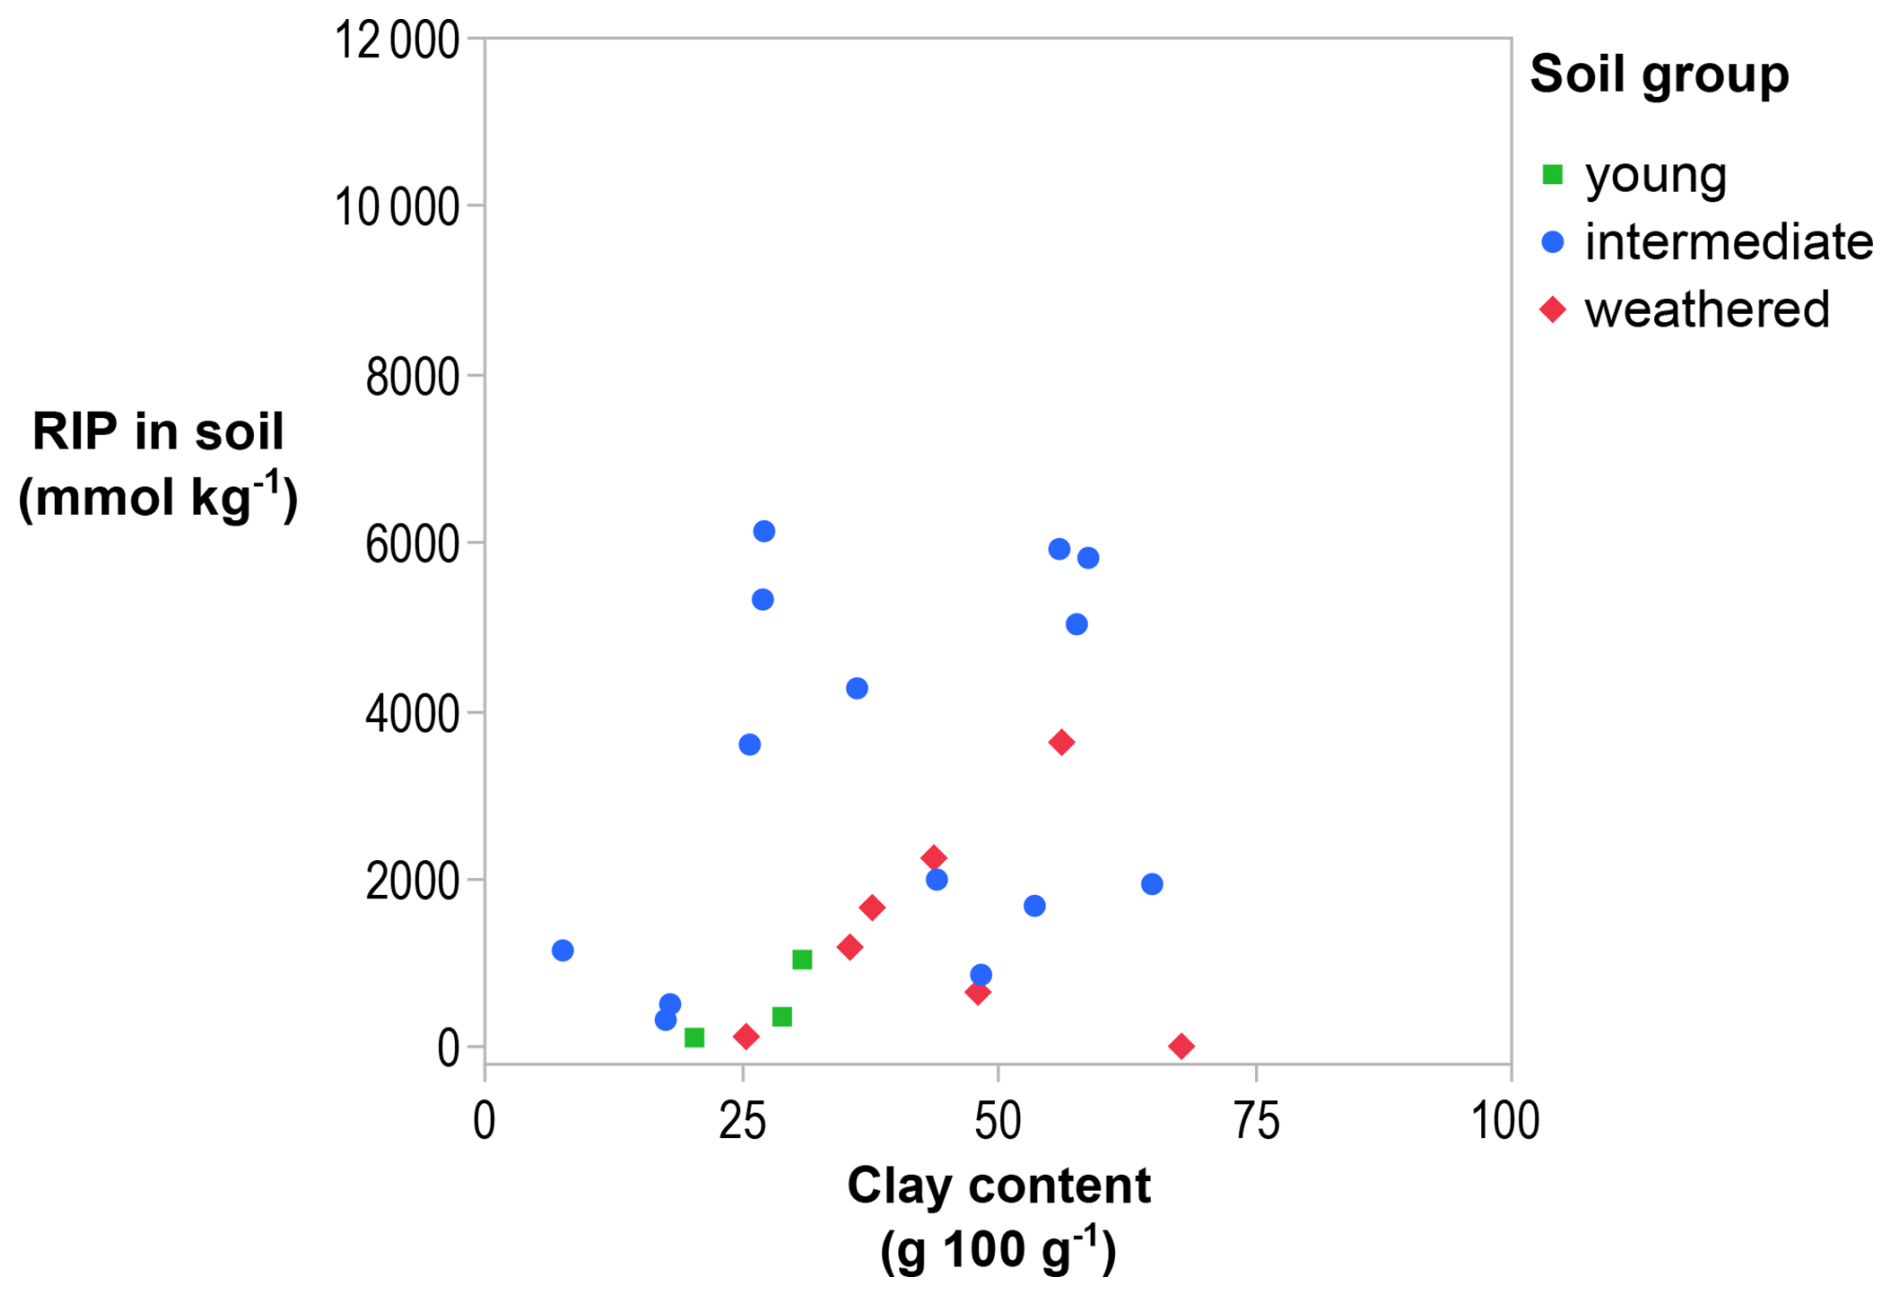
Figure 1The RIP in bulk soil is not linearly related to the clay content of the soil (p > 0.05).
The RIP was larger in the clay fraction than in the silt fraction for all soils (Table 2). The RIP in the clay fraction varied with soil weathering stages (Fig. 2). The youngest soils had an RIP corresponding to that measured in mica (300 mmol kg−1 in 10–20 µm fraction; Eguchi et al., 2015). Intermediate-weathered soils had a highly variable RIP, and soils dominated by illite had an RIP similar to that measured in illite (11 800 mmol kg−1 in < 2 µm fraction; Nakao et al., 2008). Weathered soils had a low RIP when illite was absent, corresponding to the RIP measured in kaolinite (6 mmol kg−1 in < 2 µm fraction; Nakao et al., 2008).
The RIP in the clay fraction can be explained by its mineralogy, and, overall, the RIP in the clay fraction was positively correlated with its illite content (R2=0.43; p < 0.001; Fig. 3). Young soils had a low RIP (< 3000 mmol kg−1) in the clay fraction with low illite content (< 0.5 g 100 g−1), except for a soil from Mount Elgon (Kenya 1; illite > 50 g 100 g−1), but the illite content was likely to be overestimated by XRD quantification by not taking into account other mineral phases, such as quartz, hematite, and allophane. Although only a small number of young soils were included in this study (N=3), their low RIP is consistent with expectations for soils at this stage of weathering. Intermediate-weathered soils, dominated by illite (> 30 g 100 g−1), had the highest RIP (up to 19 000 mmol kg−1). Except for Mount Elgon (Kenya 2), which, despite its high illite content (> 50 g 100 g−1), had a low RIP for the reasons explained above. Other intermediate-weathered soils, dominated by expanded phyllosilicates (i.e., high-charge smectite and regular smectite > 30 g 100 g−1), had a lower RIP (< 10 000 mmol kg−1). More weathered soils, dominated by kaolinite (up to 88 g 100 g−1), had low RIPs (< 10 000 mmol kg−1). However, a weathered soil from the Philippines sequence (Pagsanjan 5) had an RIP that was higher by more than a factor of 5 (12 000 mmol kg−1) compared to other soils from that sequence (geometric mean (GM) = 2100 mmol kg−1; N=5). The lowest RIP (100 mmol kg−1) in the clay fraction was measured in a highly weathered soil from Behenjy (Madagascar) in which illite or expanded phyllosilicates were not detectable (< 0.5 g 100 g−1).
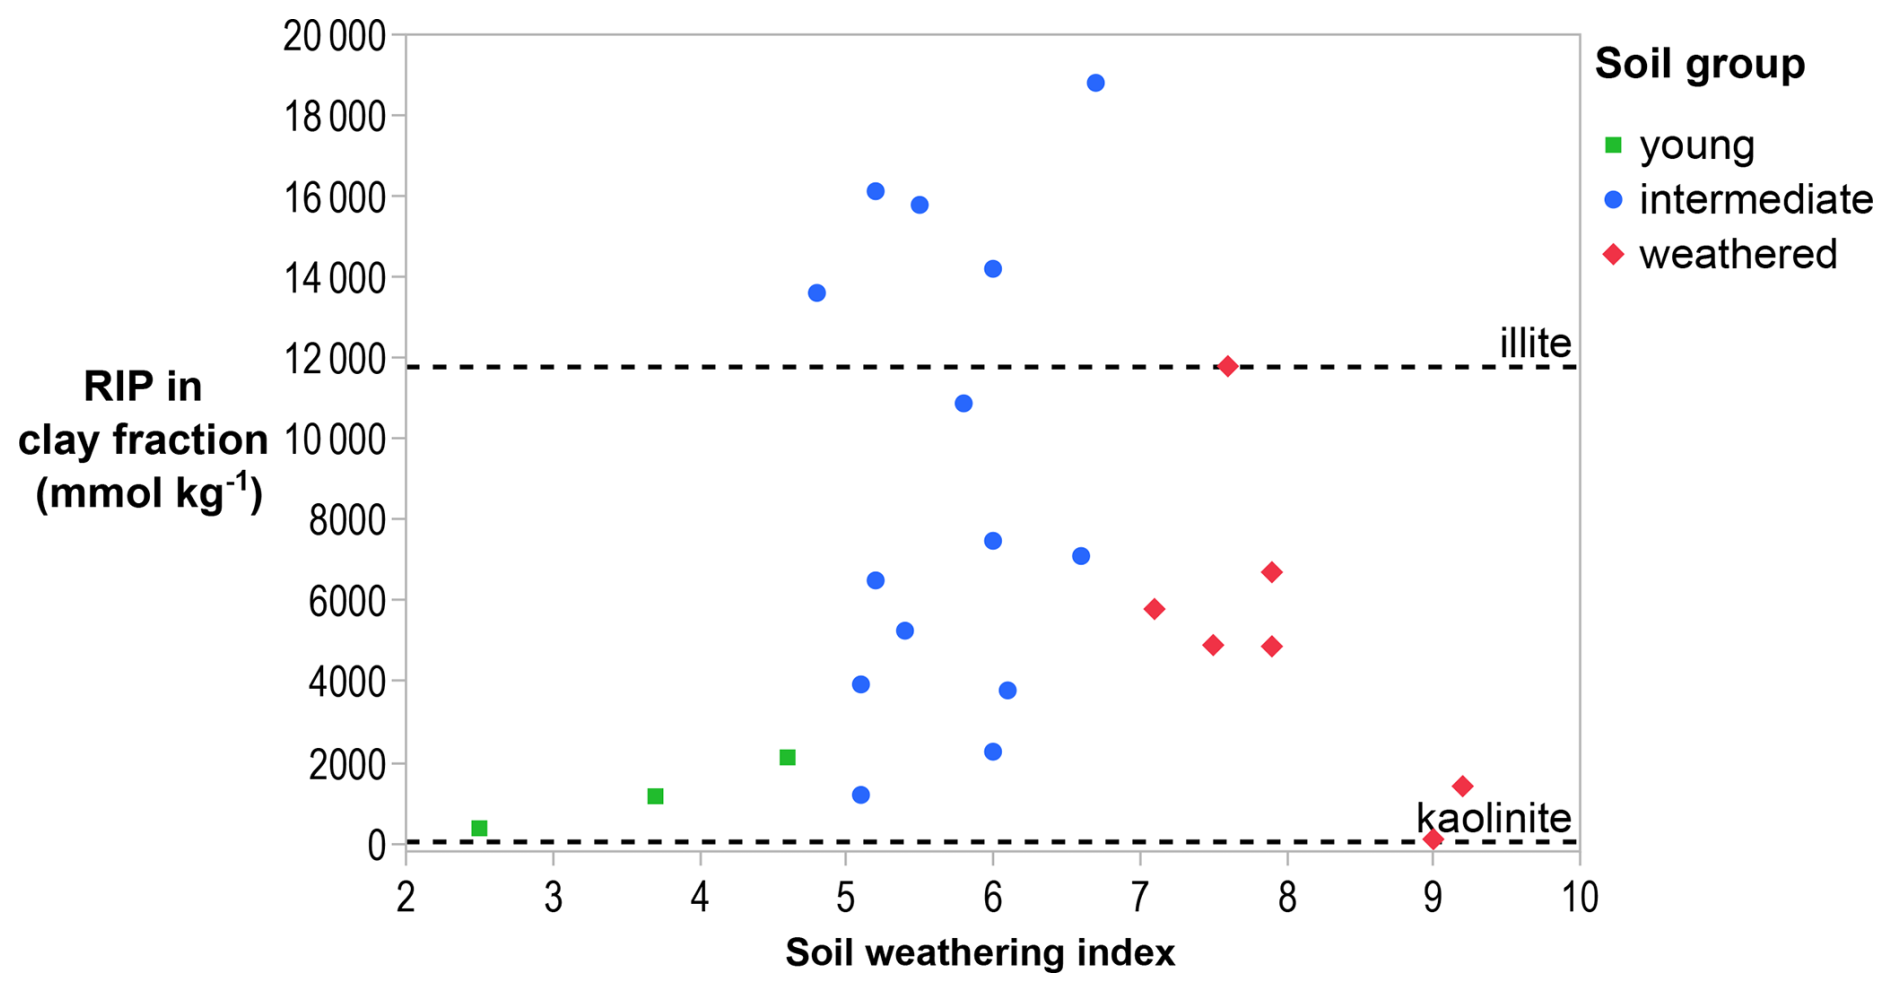
Figure 2RIPs in the clay fractions of soils as a function of soil weathering. The dashed lines are the RIP of illite (11 800 mmol kg−1 in < 2 µm fraction; Nakao et al., 2008) and kaolinite (6 mmol kg−1 in < 2 µm fraction; Nakao et al., 2008). The data suggest an upward trend between young and intermediate weathering, followed by a decrease in highly weathered soils.
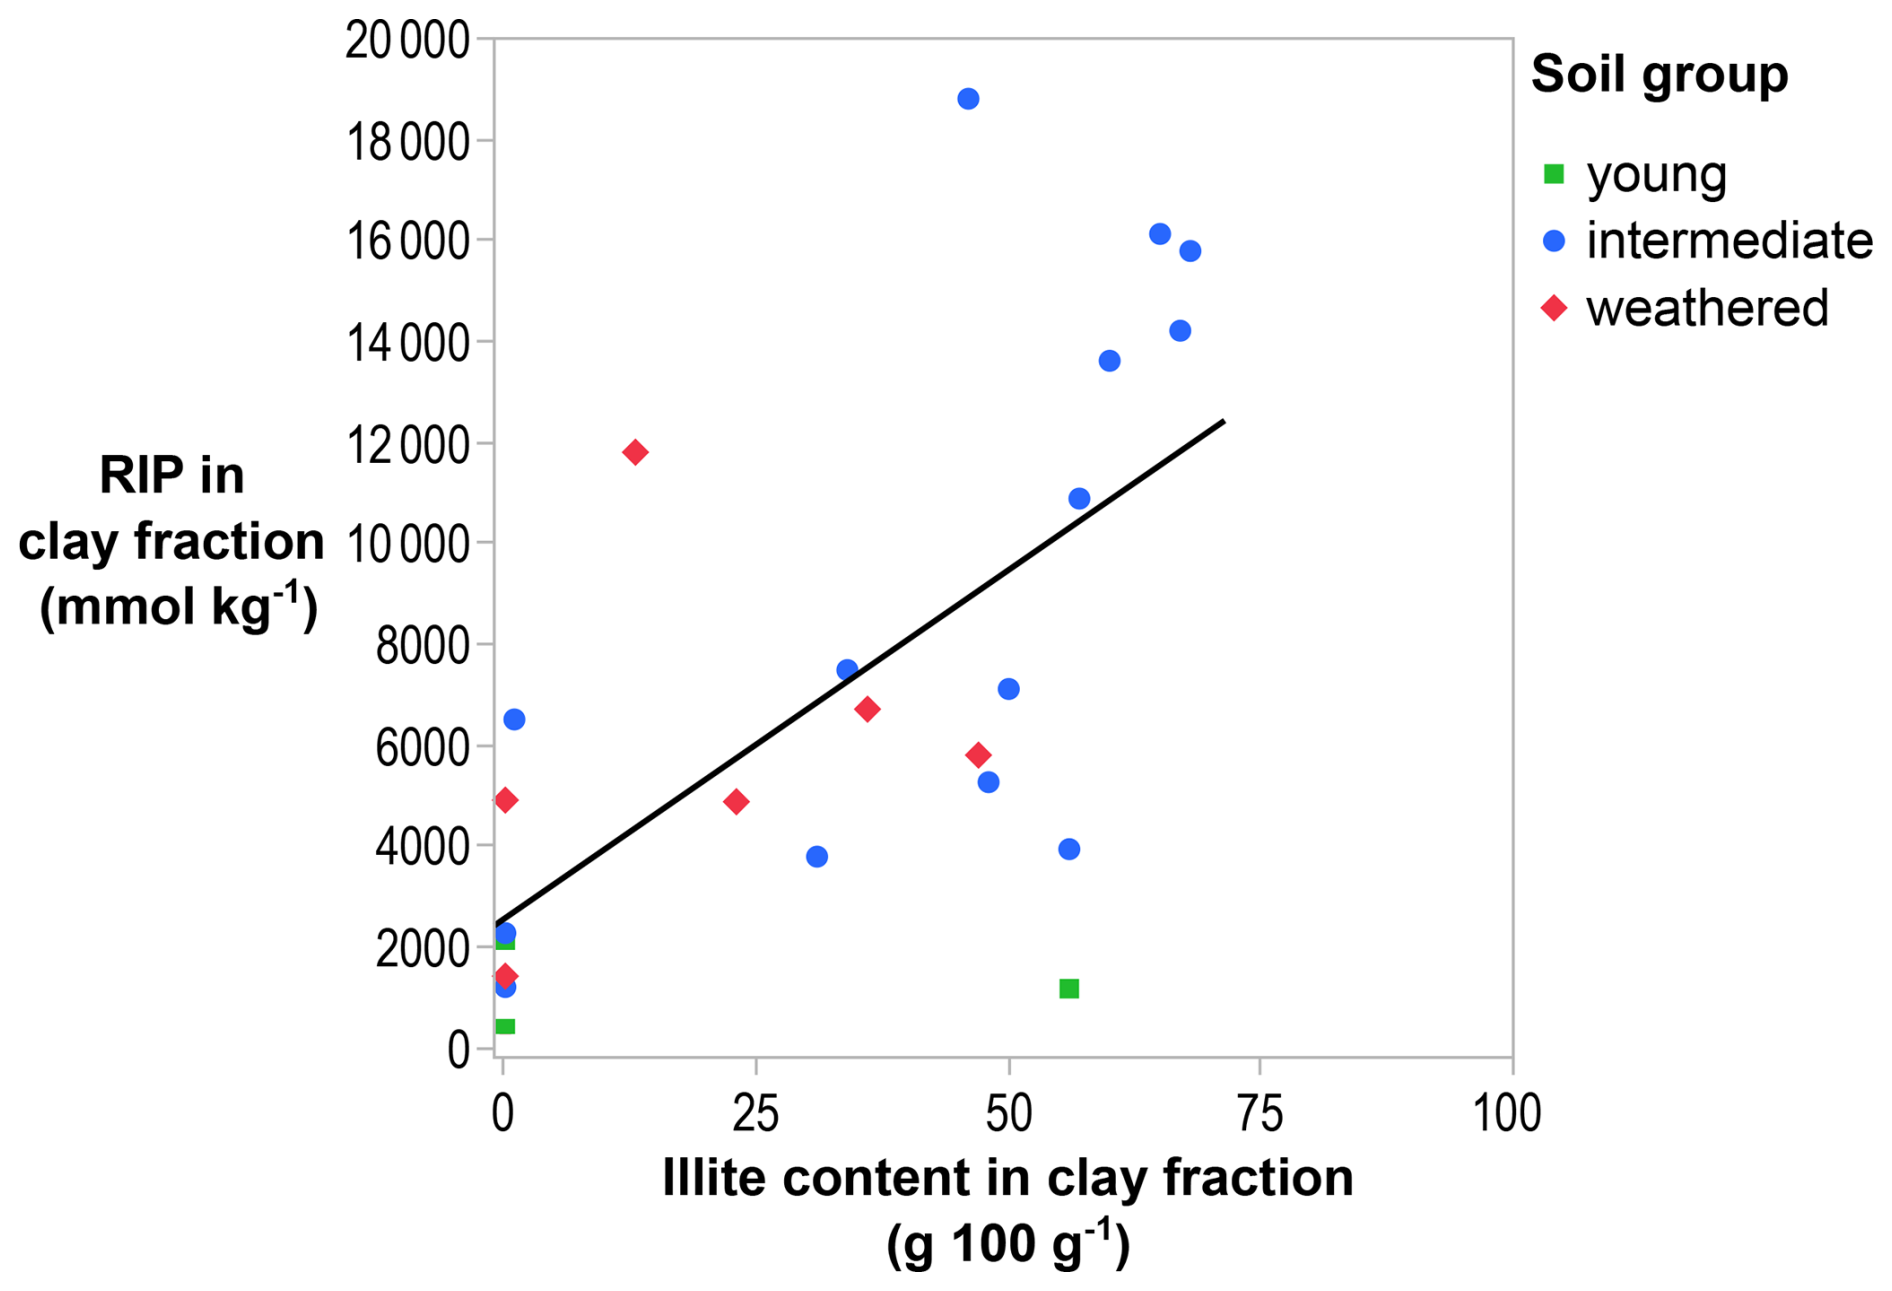
Figure 3The RIP in the clay fraction increases with increasing illite content of the clay fraction (R2=0.43; p < 0.001). The solid line is the regression line.
As stated before, the bulk soil RIP is unrelated to the clay content in the soil (Fig. 1), and the clay fraction RIP is related to the illite content in the clay fraction (Fig. 3). Altogether, the bulk soil RIP is significantly related to the illite content in soil, i.e., the fraction of illite in the clay fraction multiplied with the clay content (R2=0.50; p < 0.001; see the “Graphical abstract” of this paper). In the clay fraction of a weathered soil (Pagsanjan 5), the RIP (12 000 mmol kg−1) was unexpectedly high and could not be explained by the illite content (13 g 100 g−1; Fig. 3). A mixed-layered illite with expanded phyllosilicates was identified (Fig. C22), unlike in other soils from the sequence. This outlier should be verified by remeasuring the RIP, which was based on a single isolated clay sample, and by performing advanced mineralogical analyses to confirm the identity of the mineral phase at 11.3 Å. Note that the illite content in some soils may be overestimated as not all mineral phases in the clay fraction could be fully quantified, and the 10 Å peak used for identification may include other micas, such as muscovite, which have a lower RIP.
For three soils, however, over 50 % and up to 67 % of the soil RIP was found in the silt fraction. The XRD detected weathered mica and other phyllosilicates in that texture fraction, but these were not quantitatively converted to illite content because non-phyllosilicates, e.g., quartz and feldspars, would have led to inaccurate results (Fig. C27). The fraction of theoretical RIPs located in the silt fractions rises with the silt content, i.e., mass fraction of 2–50 µm soil particles (R2=0.18; p < 0.05; Fig. 4).
The RIP in the bulk soil can be calculated from the RIP measured in the clay and the silt fractions multiplied by their corresponding mass fractions. These theoretical, i.e., calculated, values correlate well with RIPs independently measured in the bulk soil (R2=0.69; p < 0.001; Fig. 5). However, the measured RIP in the bulk soil was overestimated by this theoretical RIP by a factor of 2.0 on average and of up to 9.1 for the soil from Pagsanjan containing mixed-layered illite (Philippines 5; Fig. C22), suggesting that, in general, soil fractionation opens FESs that are not accessible in the bulk soil (see Discussion). The fraction of the theoretical RIP found in the clay fraction was logically high, averaging 76 %.
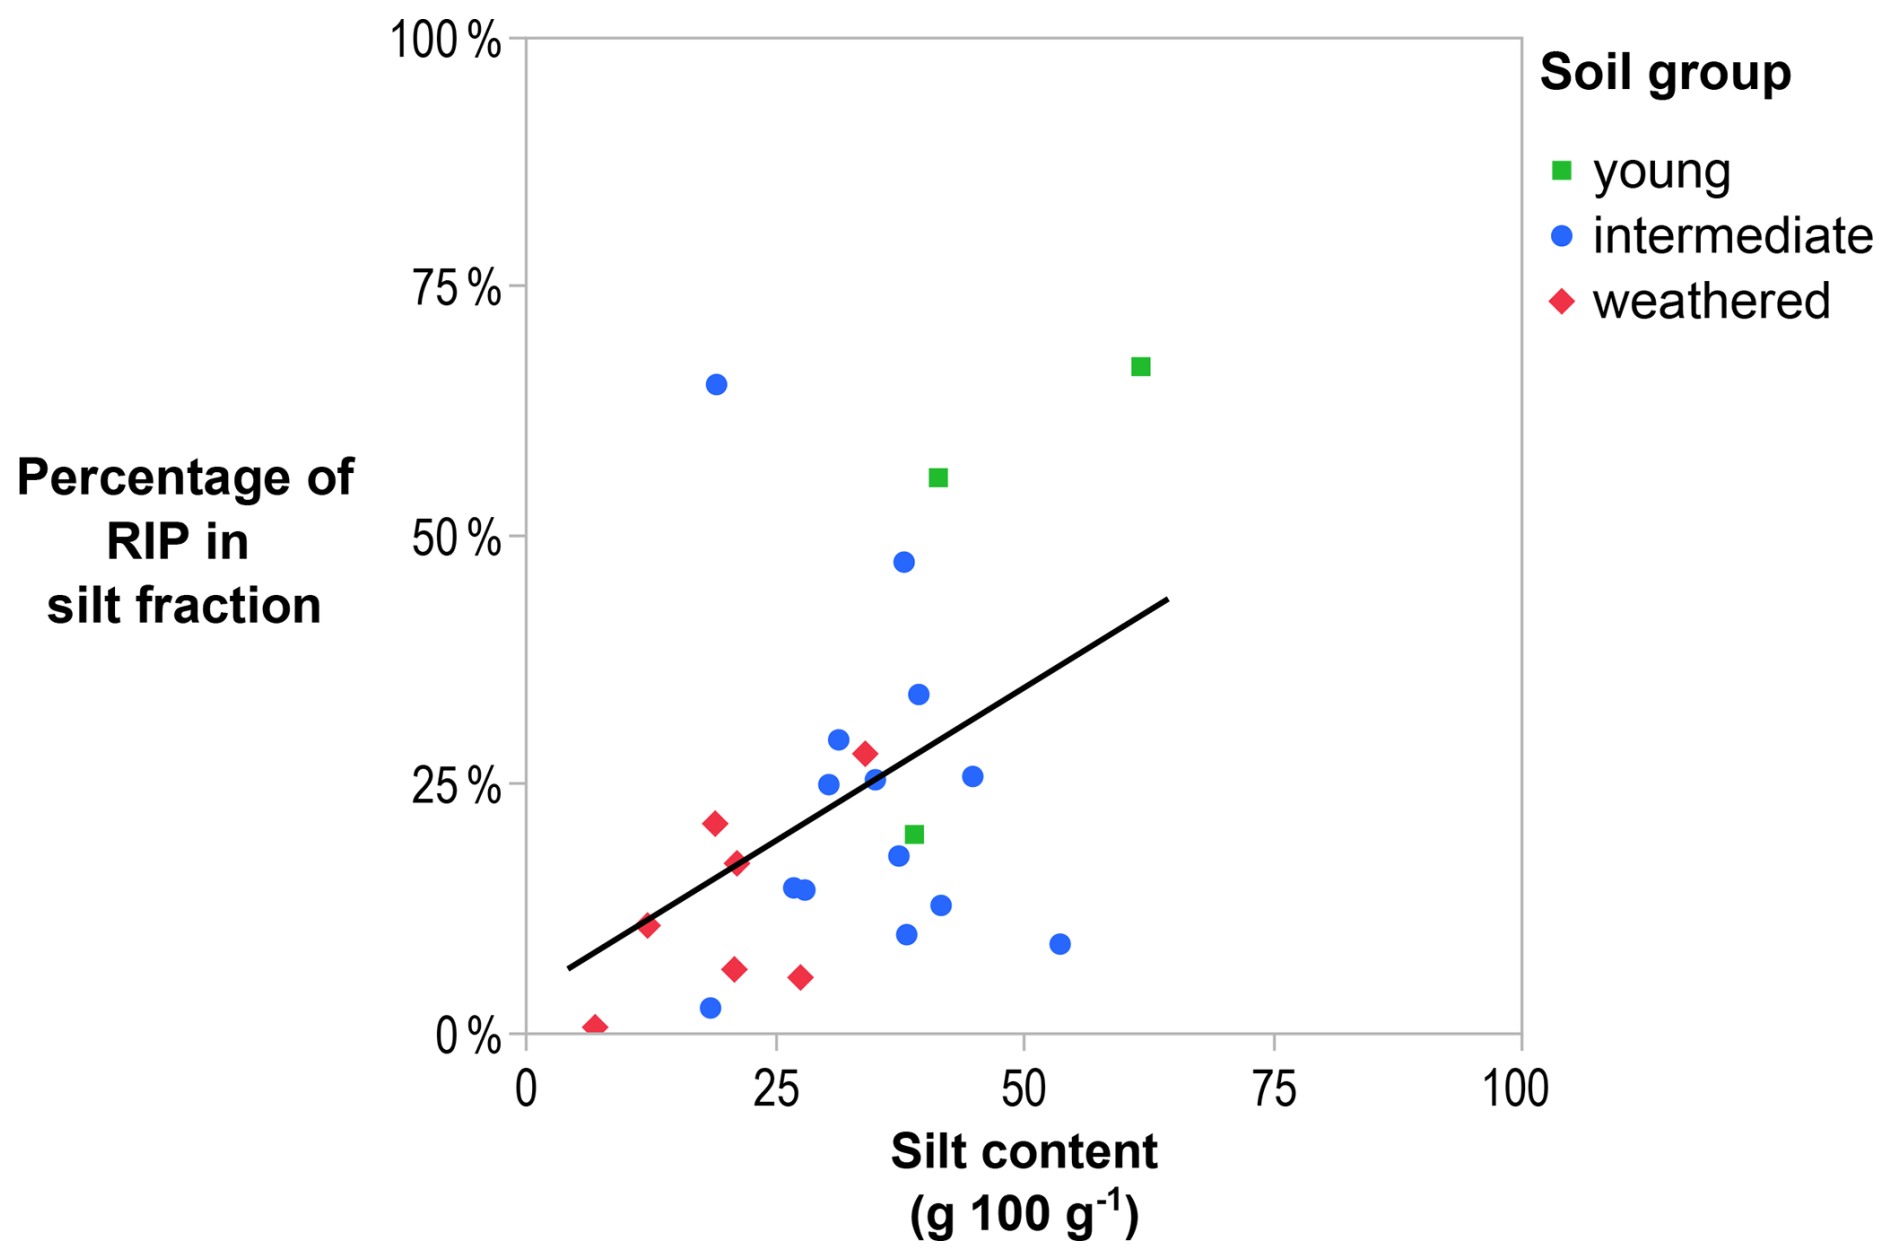
Figure 4The percentage of soil RIP present in the silt fraction increases with the increasing silt content of the soil (R2=0.18; p < 0.05). The solid line is the regression line.
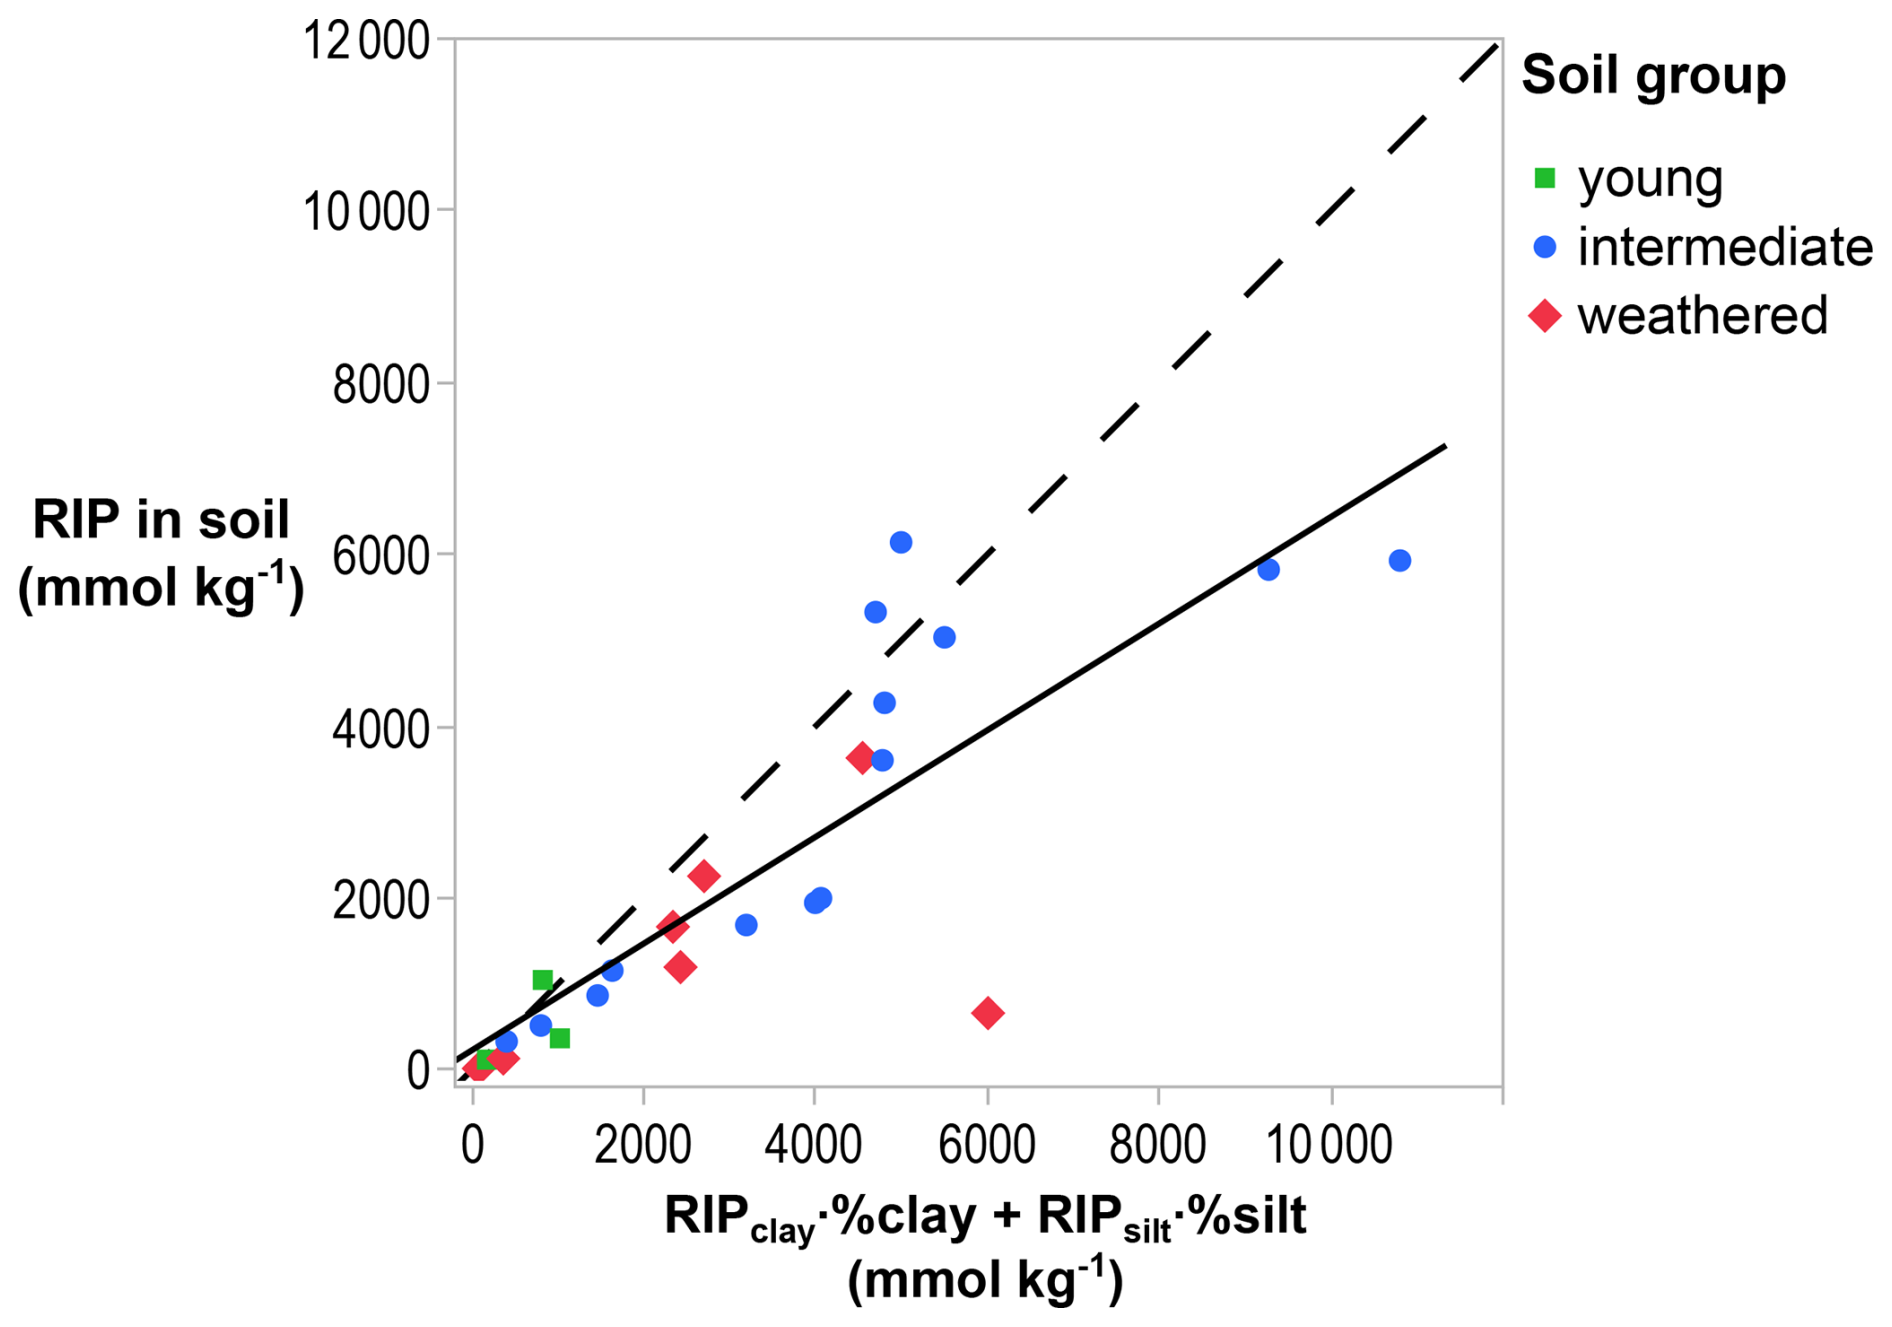
Figure 5Comparison of RIPs measured in bulk soils with the theoretical RIP calculated from the RIP in the clay and silt fractions multiplied with their corresponding mass fractions in soil (R2=0.69; p < 0.001). The solid line is the regression line, and the dashed line is the 1:1 line, illustrating, on average, a lower RIP based in the bulk soil than in the size fractions from that soil.
The Absalom model (Absalom et al., 2001; Tarsitano et al., 2011), which predicts radiocaesium bioavailability and is used for impact assessments (Brown et al., 2020), relies on the assumption that 137Cs sorption in soils is controlled by their clay content (0–2 µm). This implies that 137Cs sorbs mainly to minerals in the clay fraction and that the mineralogy has relatively small effects. This assumption may be acceptable in regions with similar mineralogy, but on a global scale, this premise is incorrect, as shown unequivocally in this study. First of all, the clay content does not control the RIP in bulk soil (Fig. 1), and, secondly, the mineralogy of that fraction has large effects on the RIP (Fig. 3).
This study confirms that 137Cs sorption in the soil is influenced by the mineralogy, which is determined by the parent material and the weathering stage (Vanheukelom et al., 2024). Soils with intermediate weathering, where illite dominates, show the highest RIP (> 10 000 mmol kg−1) in the clay fraction due to selective adsorption sites characteristic of illite. In contrast, the lowest RIP (< 500 mmol kg−1) is observed in the clay fraction of young soils (Fig. 2; Table 2). This is because selective adsorption sites in mica are not yet formed or because mica is absent from the clay fraction. Highly weathered soils also show low RIP values because phyllosilicates with selective adsorption sites have disappeared.
Soils dominated by illite show the highest RIP in the clay fraction as illite mainly contributes to the RIP (Fig. 3). Compared to illite, other phyllosilicates, such as expanded phyllosilicates and kaolinite, contribute minimally to the RIP. Intermediate-weathered soils in this study derived from loess or sedimentary deposits, such as soils from Europe (e.g., Gross Enzersdorf), North America (e.g., Sidney), and Asia (e.g., Changchun), are dominated by illite. However, intermediate-weathered soils derived from parent materials such as mafic rocks or volcanic ash (e.g., Miyakonojo) may not contain illite at all, even at a more advanced stage of weathering, highlighting the role of the parent material in the soil mineralogy.
Several processes can explain the accumulation of illite in the clay fraction at the intermediate-weathering stage. Coarser illite particles in the sand or silt fraction can be reduced by weathering to finer particles in the clay fraction. Illite can also accumulate from other locations, such as through erosion from illite-rich bedrock or through the deposition of illite-rich aeolian dust from deserts or other regions containing fine illite particles (Nakao et al., 2021). Other processes such as neoformation of illite under typical soil conditions are unlikely because the high temperature and pressure conditions required for illite crystallization (Mackenzie et al., 1987; Marsh et al., 2024) are absent in surface environments. Also, the selective concentration of illite by dissolution of other phyllosilicates is unlikely because these processes usually result in the formation of other stable phyllosilicates, such as kaolinite or smectite, rather than illite (e.g., Fig. C2).
On average, 24 % of the RIP in soils is found in the silt fraction. However, the contribution of the silt fraction to the total RIP increases as the silt content of the soil increases, suggesting that the silt fraction plays a notable role in 137Cs retention in soils with higher silt content. The XRD patterns in this study show that phyllosilicates are mainly present in the clay fraction. However, weathered mica and kaolinite peaks are also observed in the silt fraction, bringing into question the reliability of the clay cut-off for phyllosilicates. A previous study on Japanese soils found that RIP in the clay fraction, multiplied by the clay content (RIPclay %clay), underestimated the RIP in the bulk soil samples (RIPsoil) by a factor of 2 (up to a factor of 5) (Uematsu et al., 2015). This discrepancy was most notable in soils with lower clay content, such as Cambisols and Gleysols, and was attributed to 137Cs-sorbing minerals in larger soil fractions. Alternatively, not all clay particles were recovered from the soils given that a subsample was taken from the clay fraction with a pipet (20 mL subsample of 500 mL clay+silt suspension). Another study on Japanese soils, in which the clay fraction was isolated by siphoning (the entire suspension), found that RIPclay %clay did not match RIPsoil (Nakao et al., 2015). For soils where RIPclay %clay underestimated RIPsoil, it was suggested that mica in larger fractions, derived from aeolian deposits from Chinese deserts, is a major contributor to the RIP. Conversely, for soils where the RIPclay %clay overestimated RIPsoil, it was suggested that selective adsorption sites in the isolated clay fraction were made accessible or reactive, which would not be exposed in the bulk soil due to interactions with organic matter.
This study examined the clay and silt fractions to quantify mineralogy and 137Cs adsorption. The Na+ resin may have attracted K from the clay mineral interlayers, causing more FES to form. In addition, we mechanically broke up soil aggregates to release phyllosilicate particles and did not chemically remove organic matter or other soil cementing materials to represent soil conditions. The sum of the 137Cs adsorption in both fractions overestimates RIPsoil by a factor of 2, likely related to the creation and opening up of FESs not accessible in bulk soils, even when relying on the more gentle resin method for soil fractionation. This non-additivity of reactions in both fractions shows the limitation of soil fractionation in studying the soil chemical reactions in the bulk soils. In parallel, non-additive behavior has also been observed for other trace elements, such as copper and cadmium, adsorbing to soil components, such as metal oxides and organic matter, due to interactions between oxides and organic matter in relation to the metal cation adsorption (Christl and Kretzschmar, 2001; Vermeer et al., 1999).
In the long term, the accessibility of radiocaesium to selective adsorption sites in soil aggregates and its migration into deeper mineral structures may contribute to the effect of aging, with the radiocaesium solid–liquid distribution (and RIP) in soil increasing over time. This suggests, but does not prove, that the theoretical RIP observed after soil fractionation may still be the correct one in the long term. Previous research concluded that adsorption increases in expanded phyllosilicates such as montmorillonite (Degryse et al., 2004; Maes et al., 1985) and biotite (Vanheukelom et al., 2023) and in soils containing these phyllosilicates (Roig et al., 2007; Uematsu, 2017) after inducing collapses of mineral open edges on which radiocaesium is selectively adsorbed (McKinley et al., 2004). In addition, radiocaesium would migrate into deeper mineral structures over time, as observed in illite (Fuller et al., 2015), common in European soils, and in weathered biotite (Mukai et al., 2016), common in Fukushima soils. Soil aggregates and soil structure may also contribute to the increasing adsorption of radiocaesium over time, highlighting the need to understand the fate of radiocaesium in soils under field conditions over longer time frames.
This study falsified the assumptions of the Absalom model and its variants in terms of predicting the adsorption of radiocaesium in soils; they are clearly not valid on a global scale. However, it was shown that these models could still predict the bioavailability of radiocaesium with reasonable accuracy, even in soils not initially included in the calibration of these models, e.g., in highly weathered soils, due to counteracting effects. This is because, on the one hand, they overestimate RIPs in weathered soils, but, on the other hand, they underestimate K availability in the same soils (Vanheukelom et al., 2024). Hence, despite incorrect assumptions, these models are still useful after recalibration using site-specific soil properties, when available, until new and better models are developed. These new models may be based on soil mineralogy, but it is already clear from soil maps that information on soil mineralogy is not available globally. Although soil classifications may seem to be a promising proxy for soil mineralogy, they have been shown to be a poor predictor of RIP in soils worldwide (as demonstrated by Vandebroek et al., 2012). We recommend exploring a combination of alternative proxies for soil mineralogy that incorporate factors such as parent material (e.g., geology) and weathering stage (e.g., influenced by climate and topography). Such proxies could provide a practical way to develop and integrate improved radiocaesium transfer models into global soil information systems.
This study reveals that, on a global scale, 137Cs sorption in soils is not controlled by the clay content (0–2 µm) but rather by the mineralogy, which is influenced by parent material and weathering stages. Among phyllosilicates, illite contributes most to the 137Cs sorption occurring mainly in the smallest (< 2 µm) soil fractions. However, this was not true for soils with weathered mica in the larger (2–50 µm) soil fractions. The 137Cs sorption in soil fractions overestimated that in bulk soil by a factor of 2, probably due to the breaking up of soil structures and aggregates, which artificially increases the accessibility of adsorption sites to radiocaesium in the short term. This calls for caution when extrapolating the fate of radiocaesium in isolated fractions from laboratory studies to structured soils under field conditions.
The method to isolate 0–2 and 2–50 µm fractions using Na+ resin (Rouiller et al., 1972) was validated by means of comparison to a standardized pipet method for particle size analysis (ISO, 1998) with reference soils. The internal reference soil from the Division of Soil and Water Management (KU Leuven, Belgium) was sampled in Leuven, Belgium ( N, E); was used as arable land (rotation wheat and peas); and was classified as Haplic Luvisol (IUSS Working Group WRB FAO, 2022). The soil was air-dried and milled to pass a 2 mm sieve. The interlaboratory reference soils from the Wageningen Evaluating Programmes for Analytical Laboratories (WEPAL) of the International Soil-analytical Exchange Programme included clayey soil from the Ivory Coast (reference no. 883), sandy soil from Droevendaal in the Netherlands (reference no. 997), and organic Ferralsol from Sumatra Barat in Indonesia (reference no. 998). The soils were oven-dried (40 °C), milled to pass a 0.5 mm sieve, and sampled using an automatic sample divider. Each reference sample had mean values and statistics of soil characteristics (2010 and 2012 reports).
Table A1Validation of the particle size analysis method following the ISO 11277 method and the Na+ resin procedure (used in this study to isolate the 0–2 µm and 2–50 µm fractions) by comparing results of reference soil samples. The number of measurements (N), mean values, and standard deviations are given.
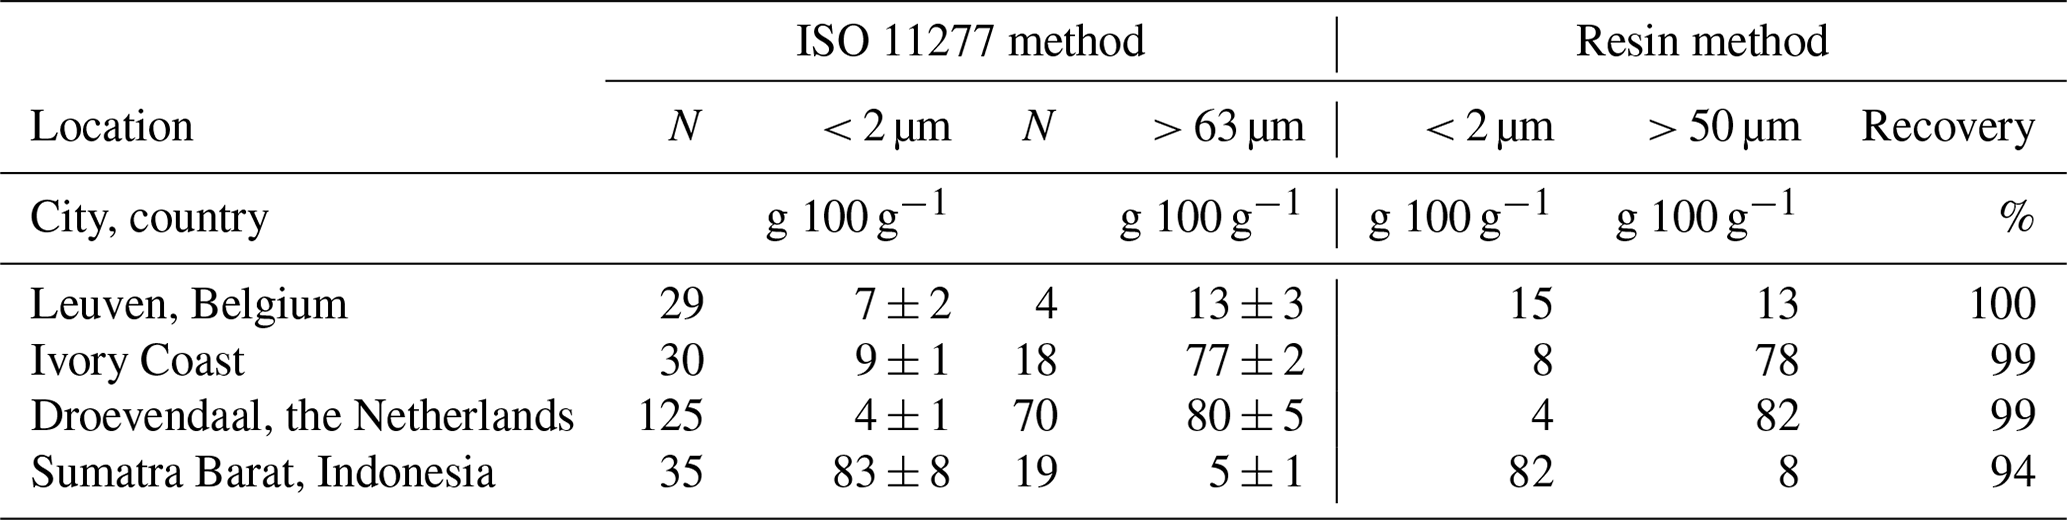
The particle distribution analyzed by the resin method included mechanical disaggregation of soil particles by sonication, dispersion by an Na+ resin, and isolation of the 0–2 µm fraction by siphoning. In contrast, the ISO 11277 method included chemical disaggregation of soil particles by removal of the organic matter and salts (optional removal of iron oxides and carbonates), dispersion by a hexametaphosphate, and sampling of the 0–2 µm fraction by means of pipet. In short, following the ISO 11277 method, 10–20 g of air-dried soil was milled to pass a 2 mm sieve. The soils were suspended in deionized water (250 mL) and treated with hydrogen peroxide (15 %) to remove organic matter, followed by removal of soluble salts with deionized water. Between each step, suspended soils were centrifuged (15 min; 2000 g), and clear supernatant was removed by decanting. The dispersing agent was made by dissolving 33 g of sodium hexametaphosphate (HMP) and 7 g of anhydrous sodium carbonate in 1 L of water. The sand fractions were separated by wet sieving (63 µm sieve). The remaining fractions were put in cylinders (500 mL) in a water bath (30 °C), in which they equilibrated overnight (16 h). The contents of the cylinders were agitated using a plunger at a speed of 30 times per minute for 2 min. According to Stoke's law, after 6 h 9 min 45 s, a sample (20 mL) was taken with a pipet 10 cm below the surface. All subsamples were oven-dried (105 °C; minimum 2 d), cooled to room temperature in a desiccator, and weighed analytically (accuracy of 0.0001 g; OHAUS Adventurer™ AR2140). Corrections were made for moisture (105 °C) and the weight of HMP salt to calculate the weight of each fraction. Most results fell within an acceptable range of variation (Table A1), indicating that the resin method was reliable for particle size distributions. A representative 0–2 µm fraction was successfully isolated in this study using this method.
Table B1Mineralogy of the bulk soils previously determined (Vanheukelom et al., 2024). Soils are ordered by increasing weathering index (WI) and grouped as young (WI = 2.5–4.7), intermediate (WI = 4.7–7.0), or weathered (WI = 7.0–9.2). Note that qtz denotes quartz, mica denotes mica minerals, Al-2:1 denotes aluminum 2:1 phyllosilicates, Fe-2:1 denotes iron 2:1 phyllosilicates, Fe- denotes iron chlorite phyllosilicates; Mg- denotes magnesium chlorite phyllosilicates, 1:1 denotes kaolin phyllosilicates, fsp denotes K-feldspars and plagioclase, cal/dol denotes calcite and dolomite, po denotes pyrrhotite, Ant denotes anatase FeOx denotes iron (oxy-)hydroxides, AlOx denotes aluminum (oxy-)hydroxides, amp/px denotes amphibole and pyroxene, and a denotes mineral phases that appear amorphous on XRD patterns.
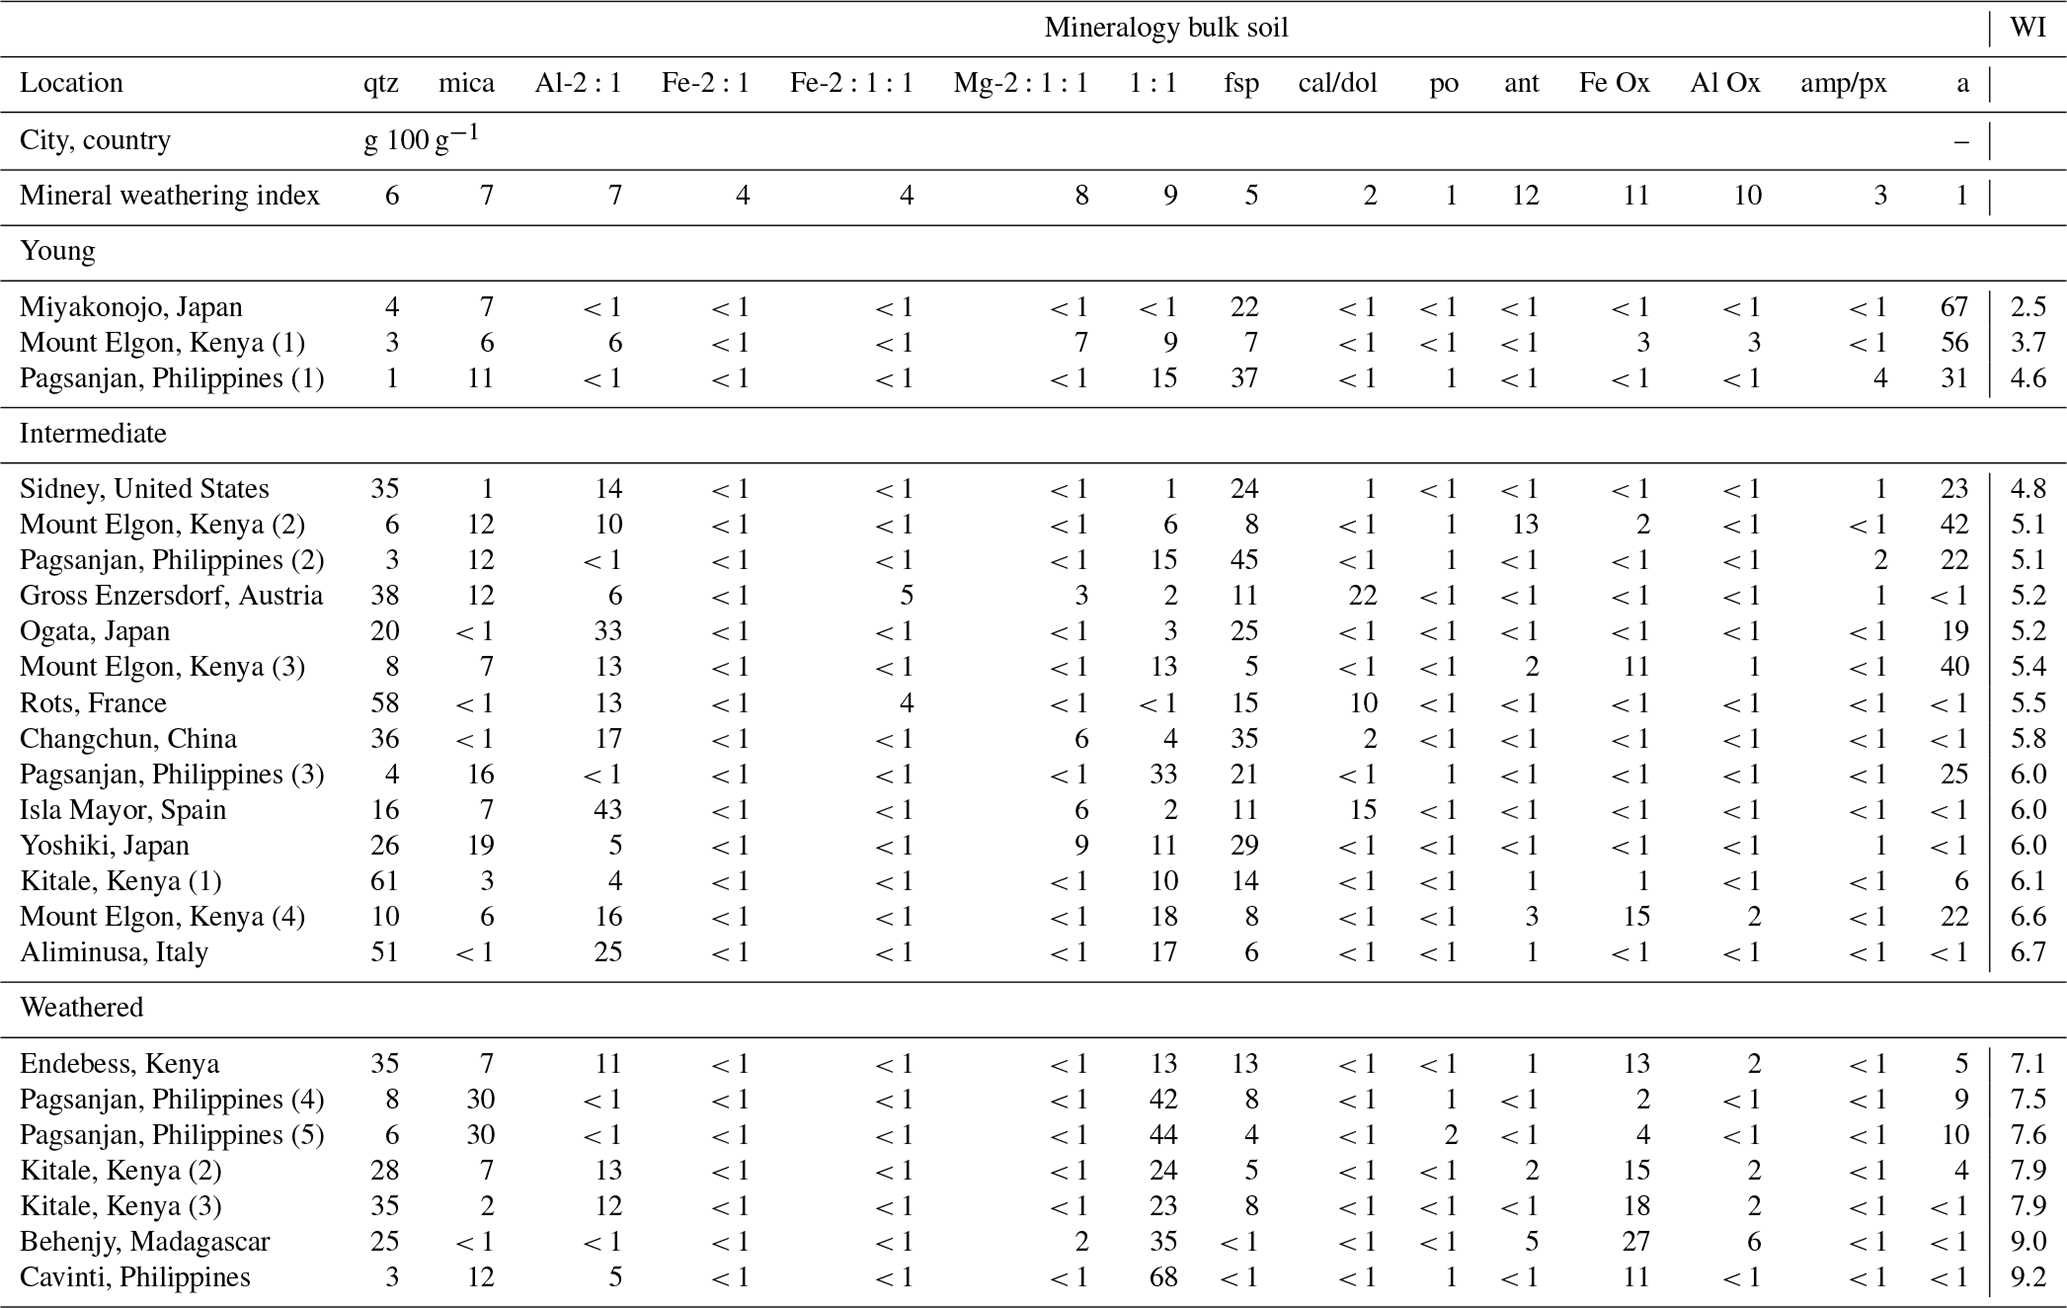
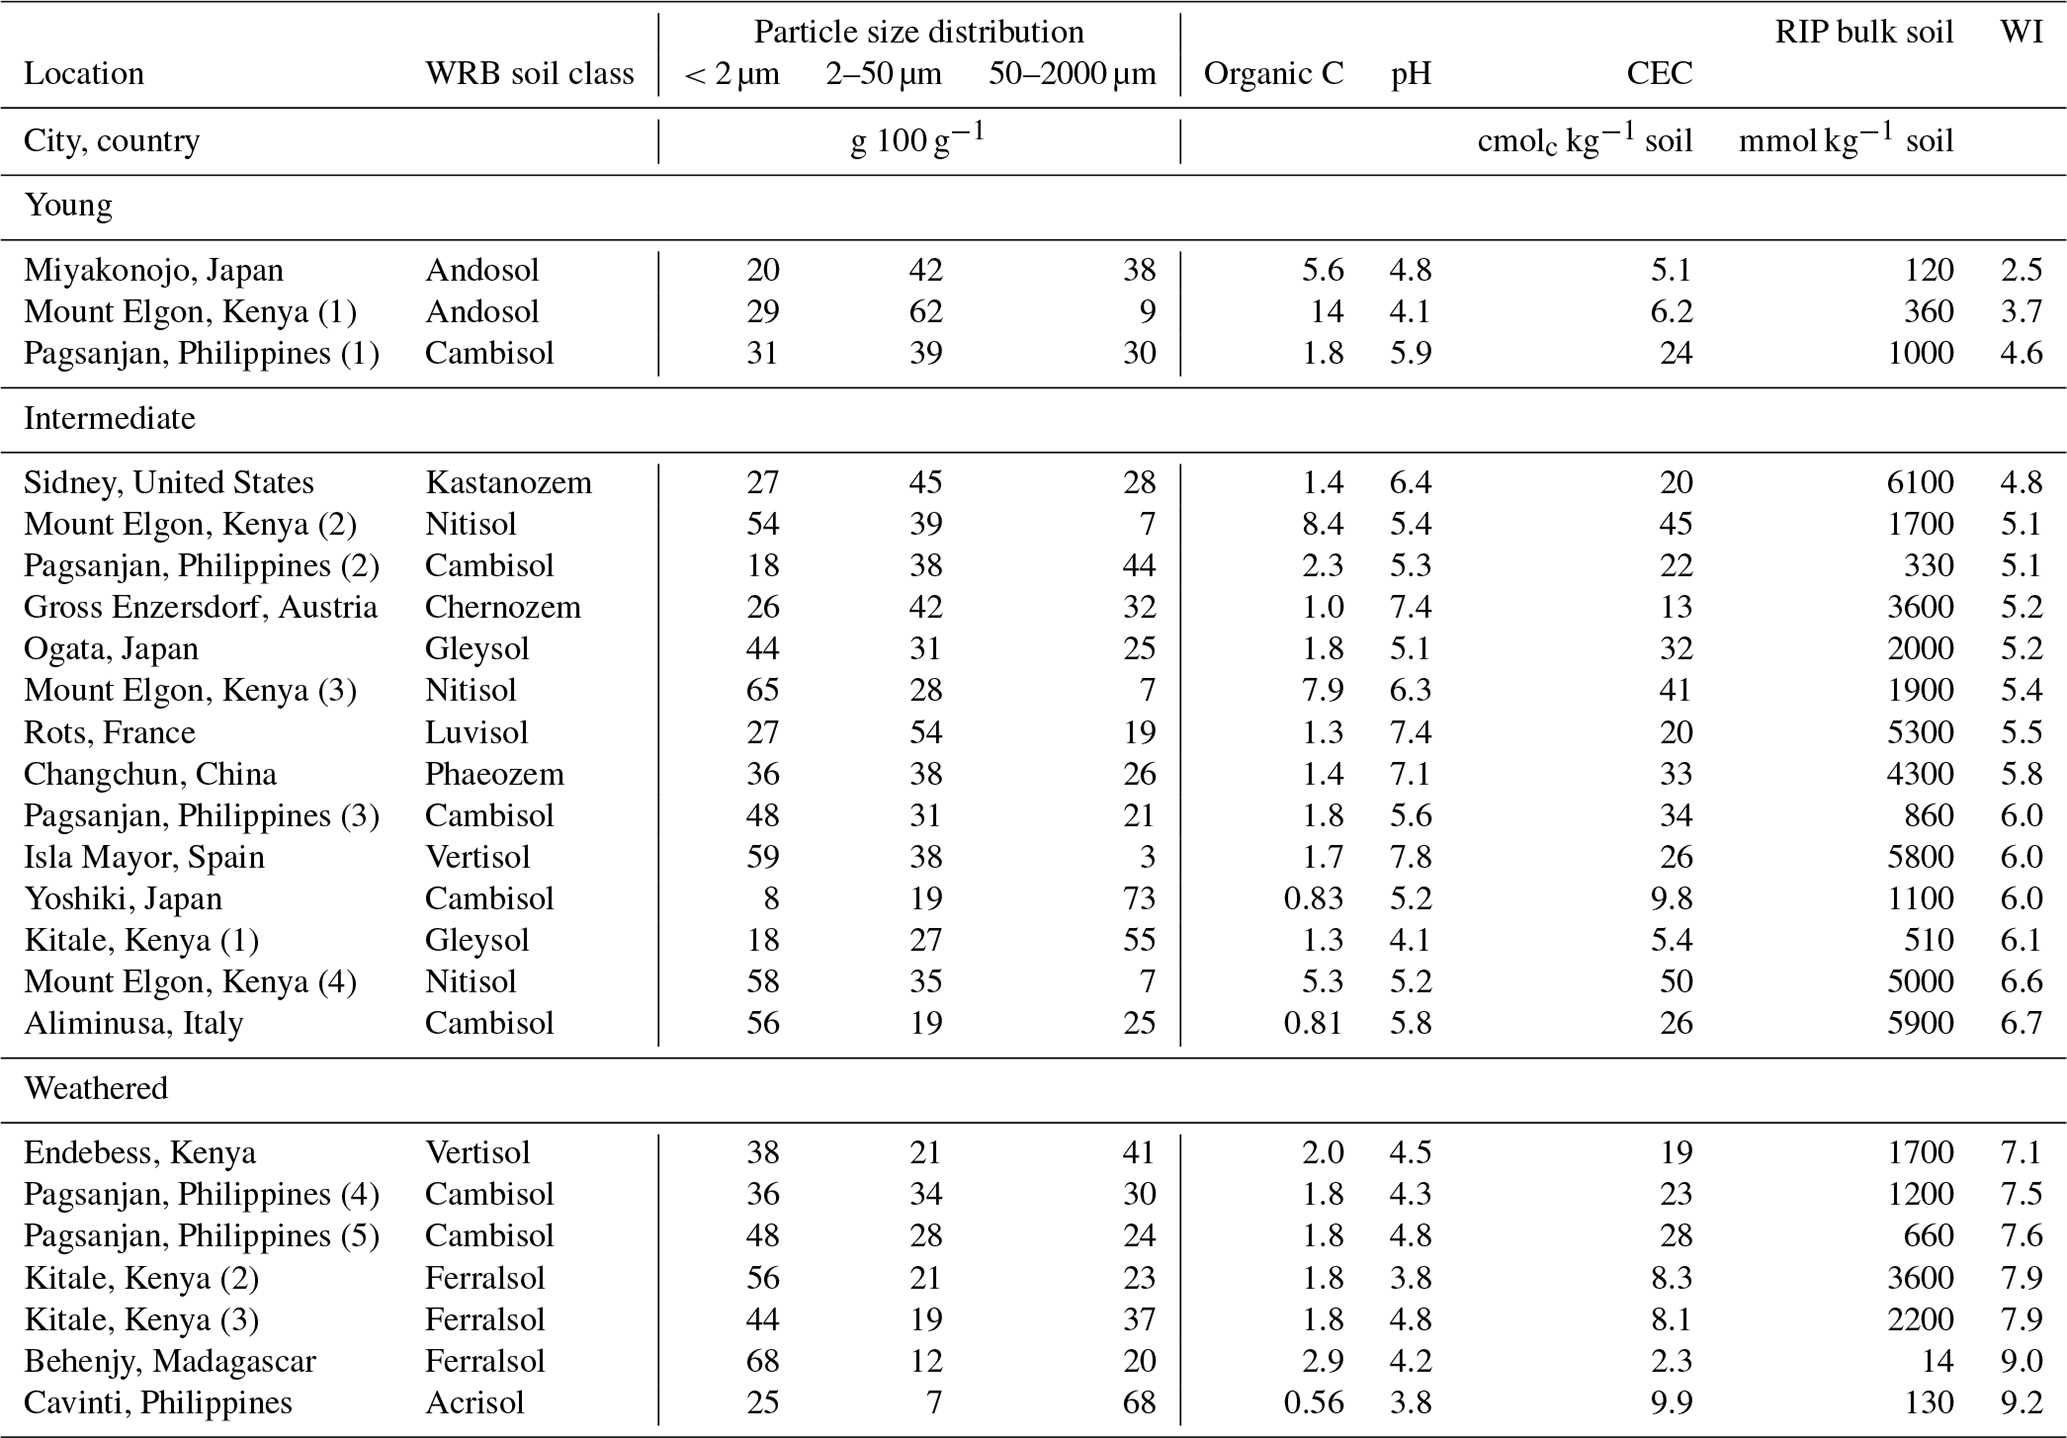
Table B2Properties of the bulk soil previously determined (Vanheukelom et al., 2024). Soils are ordered by increasing WI and grouped as young (WI = 2.5–4.7), intermediate (WI = 4.7–7.0), or weathered (WI = 7.0–9.2). More details on soil origin can be found elsewhere (Vanheukelom et al., 2024).
The identification of phyllosilicate mineral phases in X-ray diffraction (XRD) patterns of isolated 0–2 and 2–50 µm fractions from soils was performed following the procedure of Moore and Reynolds (1997). The patterns were shifted to position the quartz peak around 3.34 Å. A mineral phase was identified based on the peak position, corresponding to the largest peak in the XRD pattern. The smaller peaks were located to confirm its presence, and these peaks were subsequently discarded from consideration. This iterative process was continued by examining the remaining peaks to identify additional mineral phases, repeating the steps until all observable peaks were attributed to specific minerals. Mineral phases not included in the Sybilla software library were identified using tables from Brindley and Brown (1980). However, some difficulties were encountered due to high background noise and overlapping peaks of different mineral phases. These interferences made it challenging to identify specific minerals, leaving some peaks unassigned, such as in Fig. C3.
The quantification of phyllosilicate mineral phases in XRD patterns of isolated 0–2 µm fractions from soils was performed following the procedure of Zeelmaekers et al. (2011). Mineral phases were quantified using Sybilla software (© Chevron ETC) by fitting the model of operator-selected mineral models to the experimental XRD pattern in both air-dried Ca form and ethylene-glycol-solvated states. The background was removed using a linear function. The patterns were shifted to position the kaolinite peak around 7.15 Å, which was clear and unaffected by ethylene glycol. To facilitate model calculations, the step size was increased from 0.02 to 0.05 °2θ, which was acceptable given the wide peaks of the phyllosilicates. Parts of the experimental XRD pattern that could not be modeled, such as quartz peaks or background at low angles (2–5 °2θ), were excluded from the fitting process. In the software library, kaolinite and chlorite were available as discrete mineral phases, while illite and smectite were fitted as mixed-layered mineral phases. Mixed-layered mineral phases with expandable layers, such as illite–smectite (high charge), were fitted with two types of smectic layers: regular and high charge. The high-charge layers with smaller d spacings compared to regular smectite were used to model vermiculite-like expanding behavior. The proportions of the layers varied between 0 % and 100 %. For example, in Fig. C5, randomly interstratified kaolinite–smectite (high charge) with proportions of had a 50 % kaolinite layer, 30 % regular smectite, and 20 % high-charge smectite. In this study, regular and high-charge smectite contents were summed together as an expandable mineral phase. The quantified mineral phase results were accepted if the model fit for the ethylene glycol state agreed with the model for the air-dried state. The mineral phase contents were calculated as averages of the results of the two states.
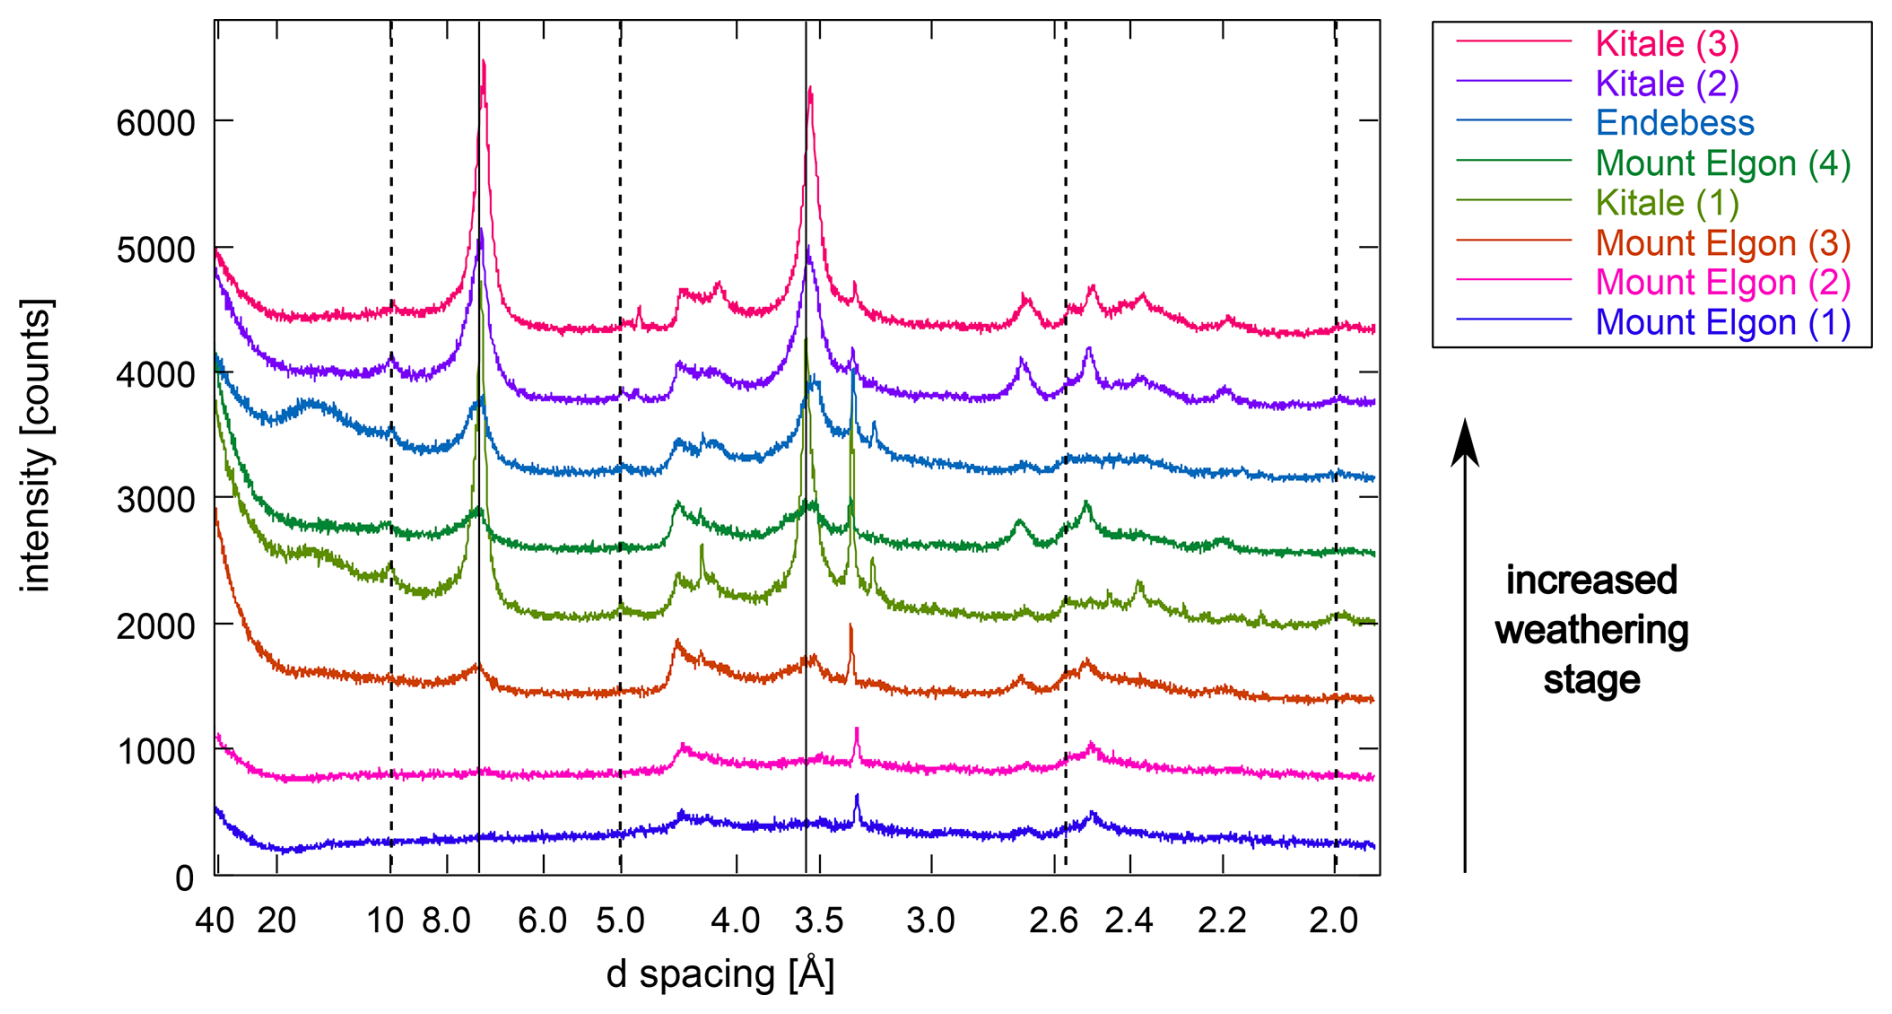
Figure C1Comparison of the oriented clay fractions in air-dried, Ca-saturated soils from Kenya. Full lines indicate peak positions of kaolinite at 7.17 and 3.58 Å, and dotted lines indicate peak positions of illitic mineral phases at 10, 5.0, 3.36, 2.56, and 2.00 Å.
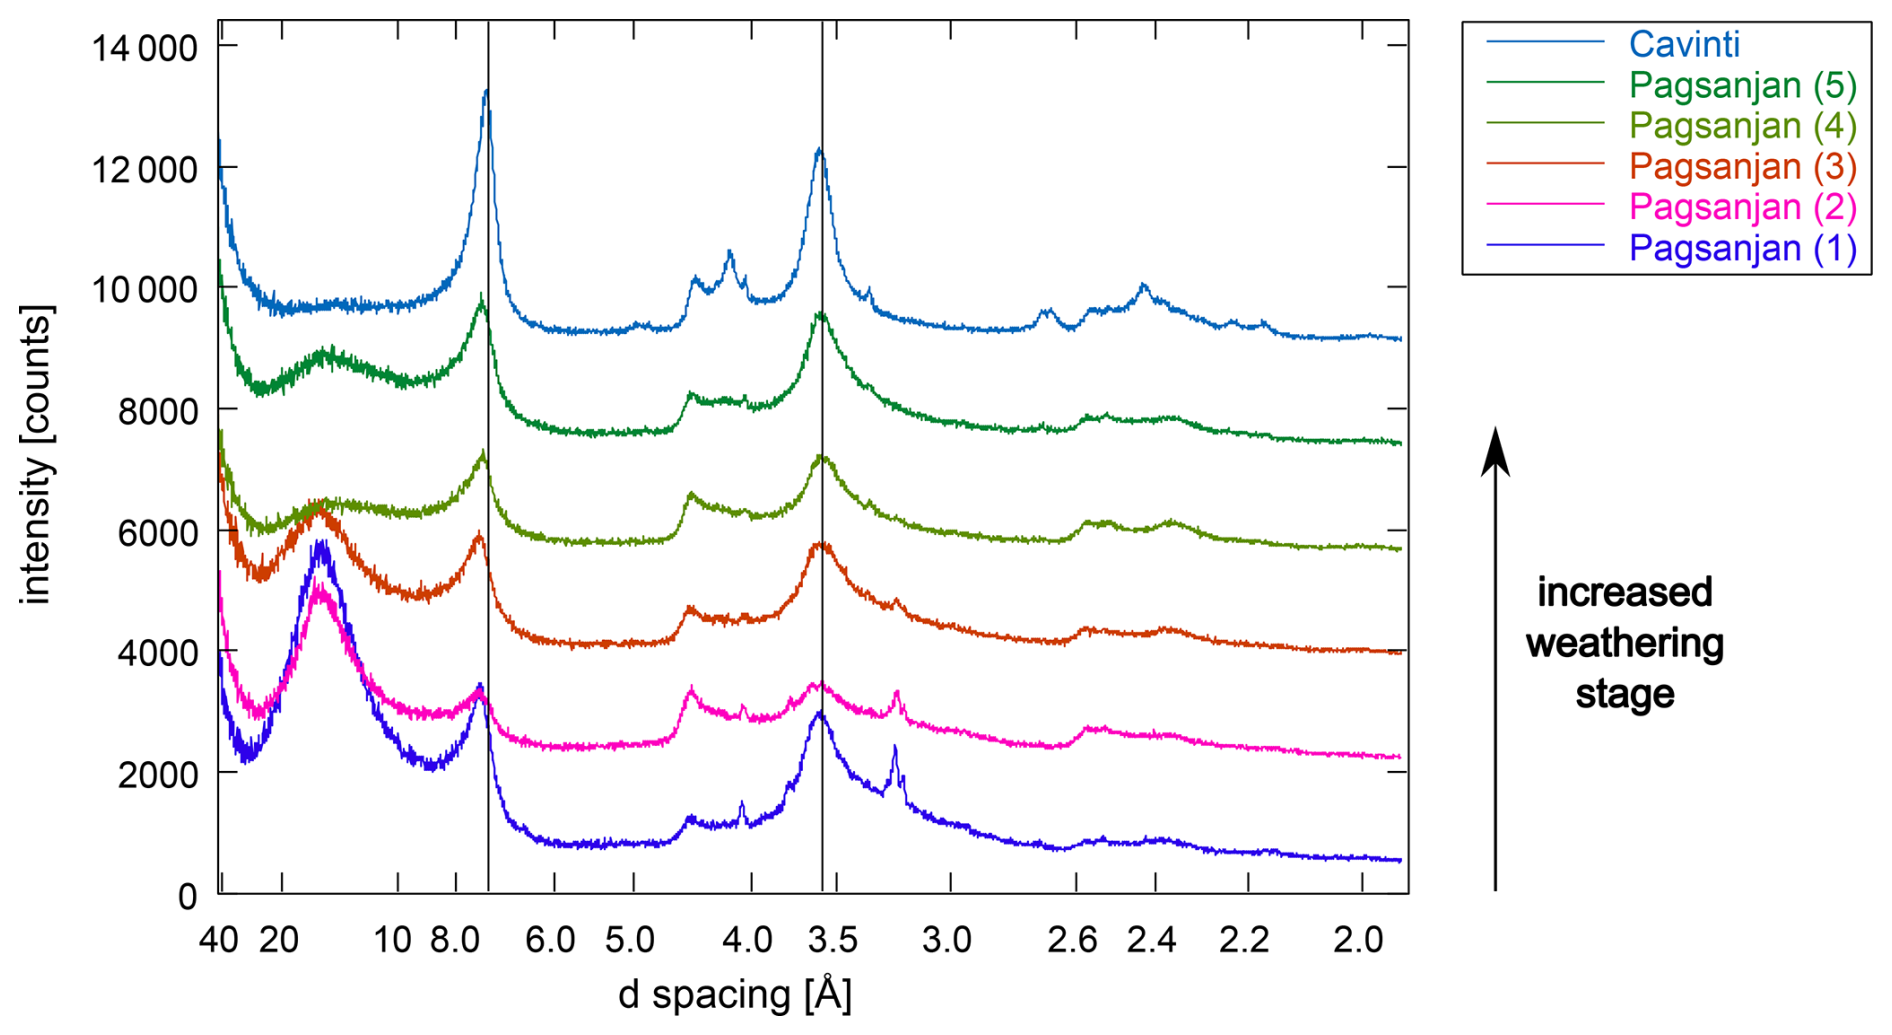
Figure C2Comparison of the oriented clay fractions in air-dried, Ca-saturated soils from the Philippines. The XRD patterns shown here were measured with variable slit but converted to fixed slit. Full lines indicate peak positions of kaolinite at 7.17 and 3.58 Å.
Calcite was observed in many soils (Figs. C6, C9, C10, C12, C13, C15, C19, and C25), except in the sequence soils. In the bulk soils, calcite was observed by XRD analysis (Table B1), which varied between < 1–22 g 100 g−1. In addition, inorganic carbon was previously measured in these soils, which varied between < 0.10 %–3.0 % inorganic carbon (Vanheukelom et al., 2024). However, this was not expected for the more weathered soil of Behenjy (Fig. C25), in which inorganic carbon was not measured. Moreover, the pH (4.2) was lower than pKa (9.0), and so calcite in the soil would probably have dissolved. It is assumed that the calcite in the soil is a precipitation product due to significant pH changes during the experimental procedure. The use of Na+ resin (> 500 µm; Amberlite® IR-120 (H); Supelco®) facilitated the exchange of H+ ions for Na+ ions, leading to a substantial increase in pH. When the soil was exposed to 1 mol L−1 CaCl2, the increased pH promoted the formation of carbonate ions (CO) from bicarbonate (HCO). The pH was 8.3 for Behenjy (Madagascar), measured at 0.2 g of the 0–2 µm fraction in 2 mL purified water (Hanna HI 2002-02). This high concentration of Ca2+ and CO ions resulted in the precipitation of CaCO3 as calcite. Thus, the calcite peaks observed in XRD are probably the result of these experimental conditions rather than the presence of calcite in the original soil sample. No calcite was observed in the soil sequences, probably because the soil buffered the pH more. In the soil from Kitale (Kenya 1), the pH of the 0–2 µm fraction was 7.6.
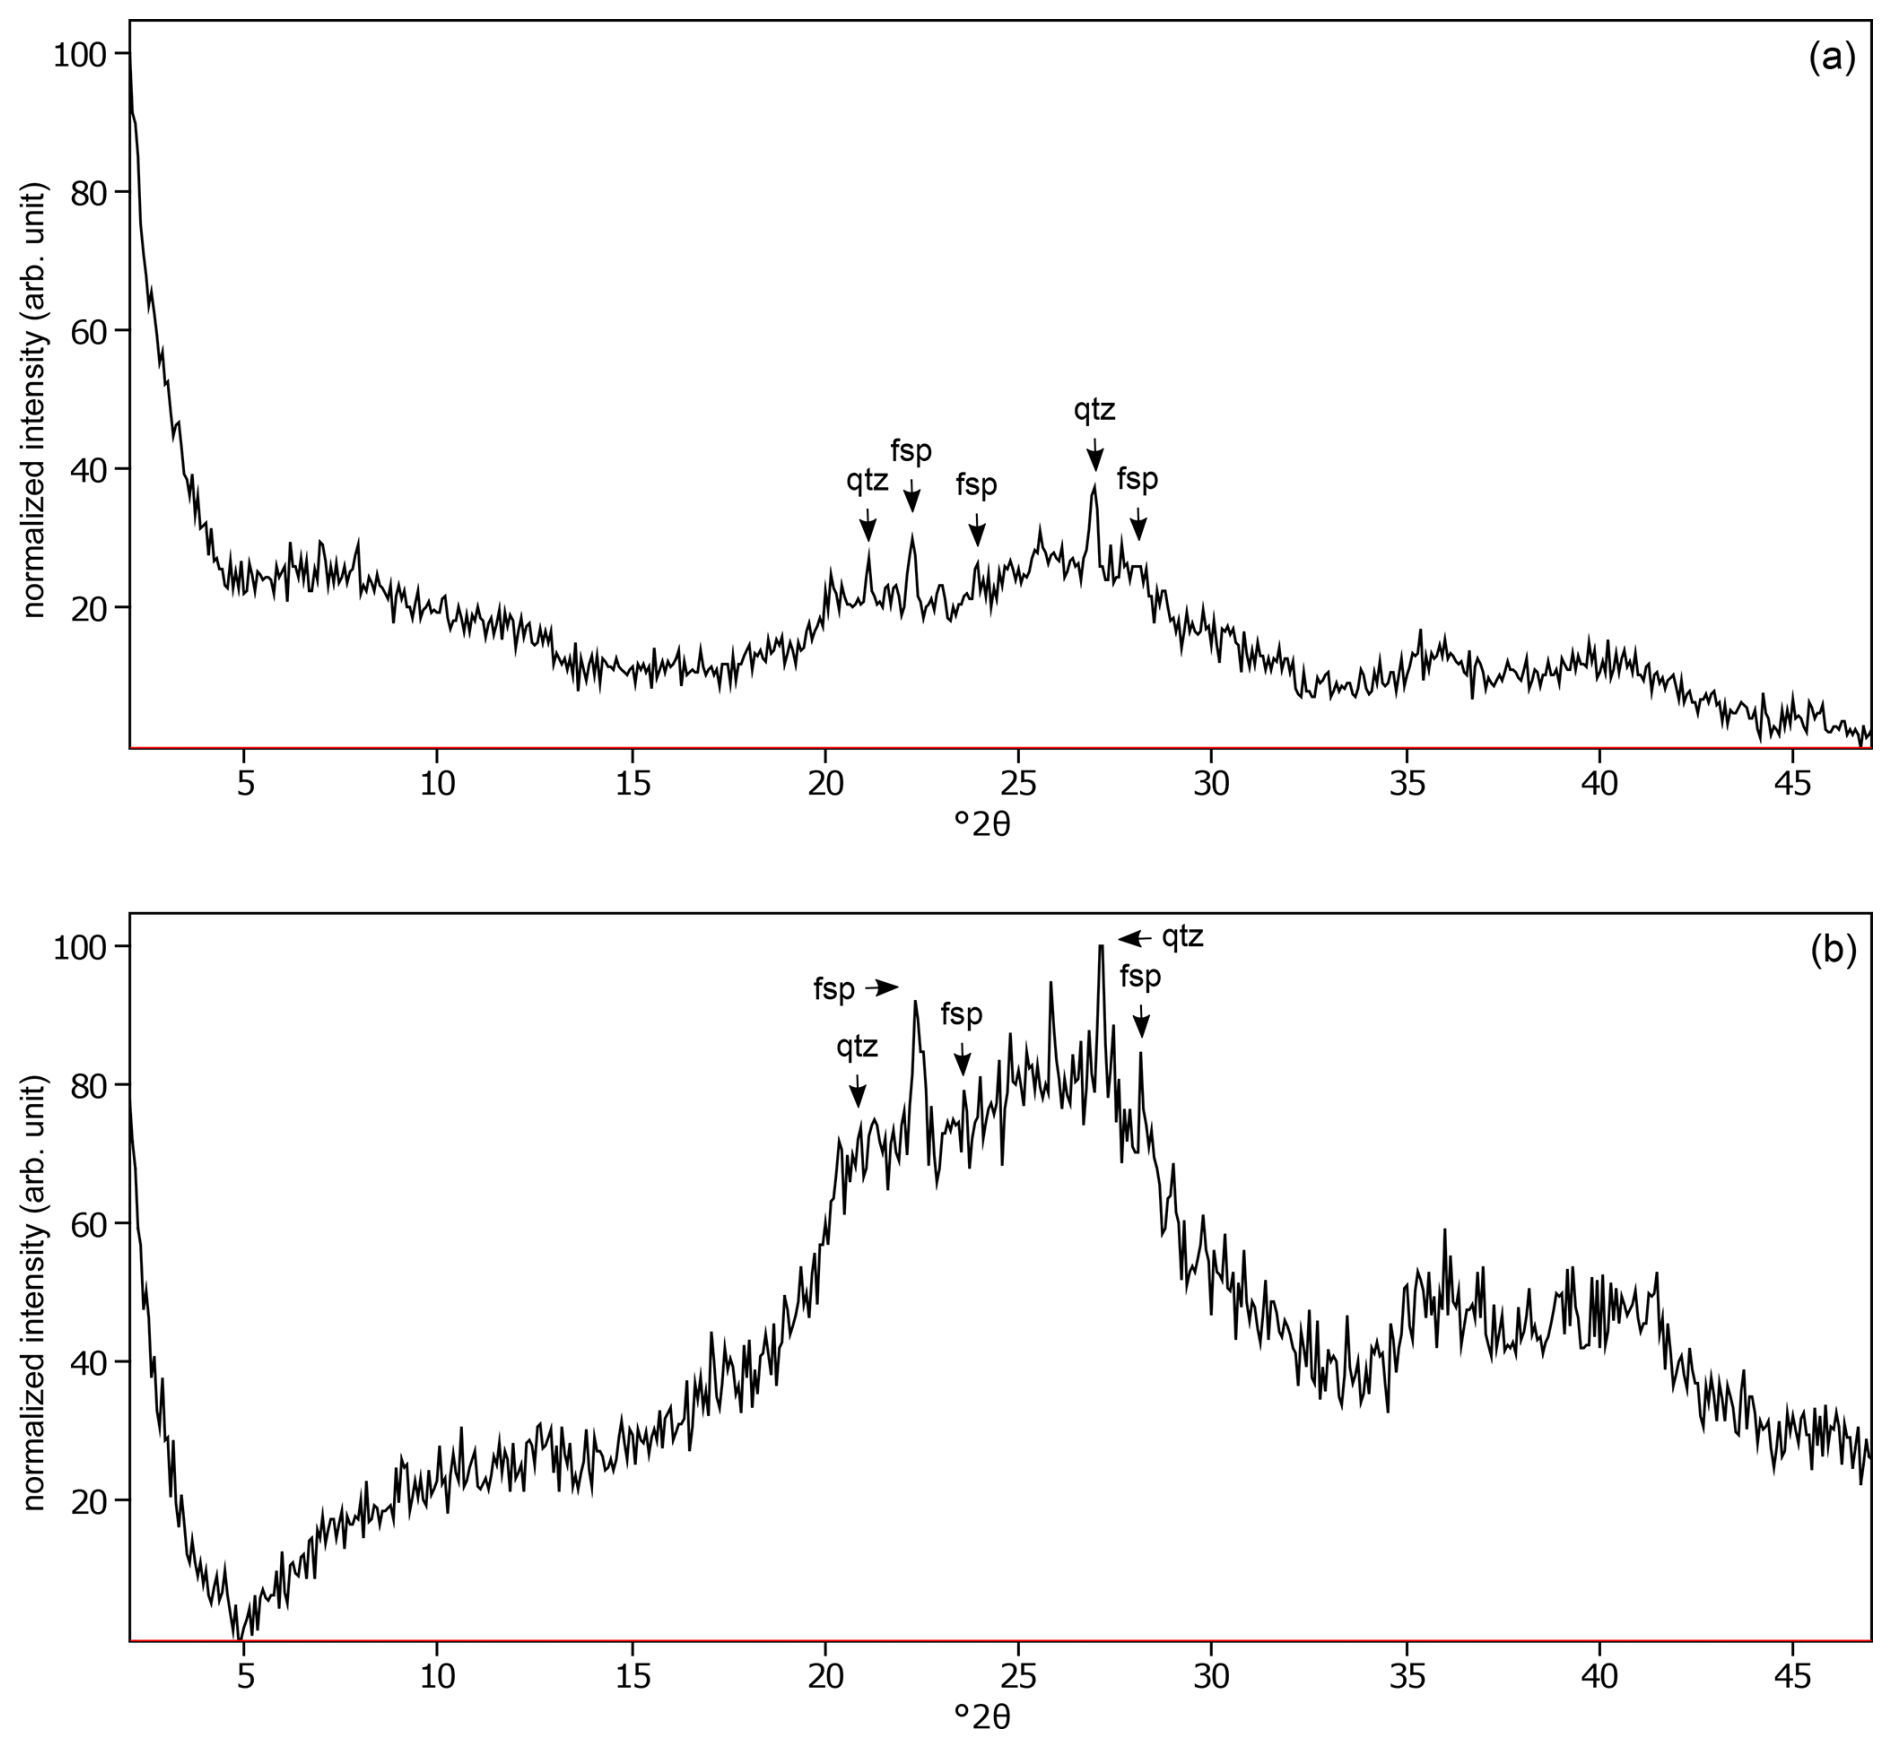
Figure C3The oriented clay fraction of soil from Miyakonojo (Japan). (a) Experimental XRD patterns in air-dried, Ca-saturated state (black); no pattern was modeled because no phyllosilicate could be identified. (b) Experimental XRD patterns in ethylene-glycol-solvated, Ca-saturated state (black); no pattern was modeled because no phyllosilicate could be identified. The arrows indicate quartz (qtz) and feldspar (fsp) peaks. Allophane shows broad peaks at 3.50 Å (25.45 °2θ) and 2.50 Å (35.90 °2θ).
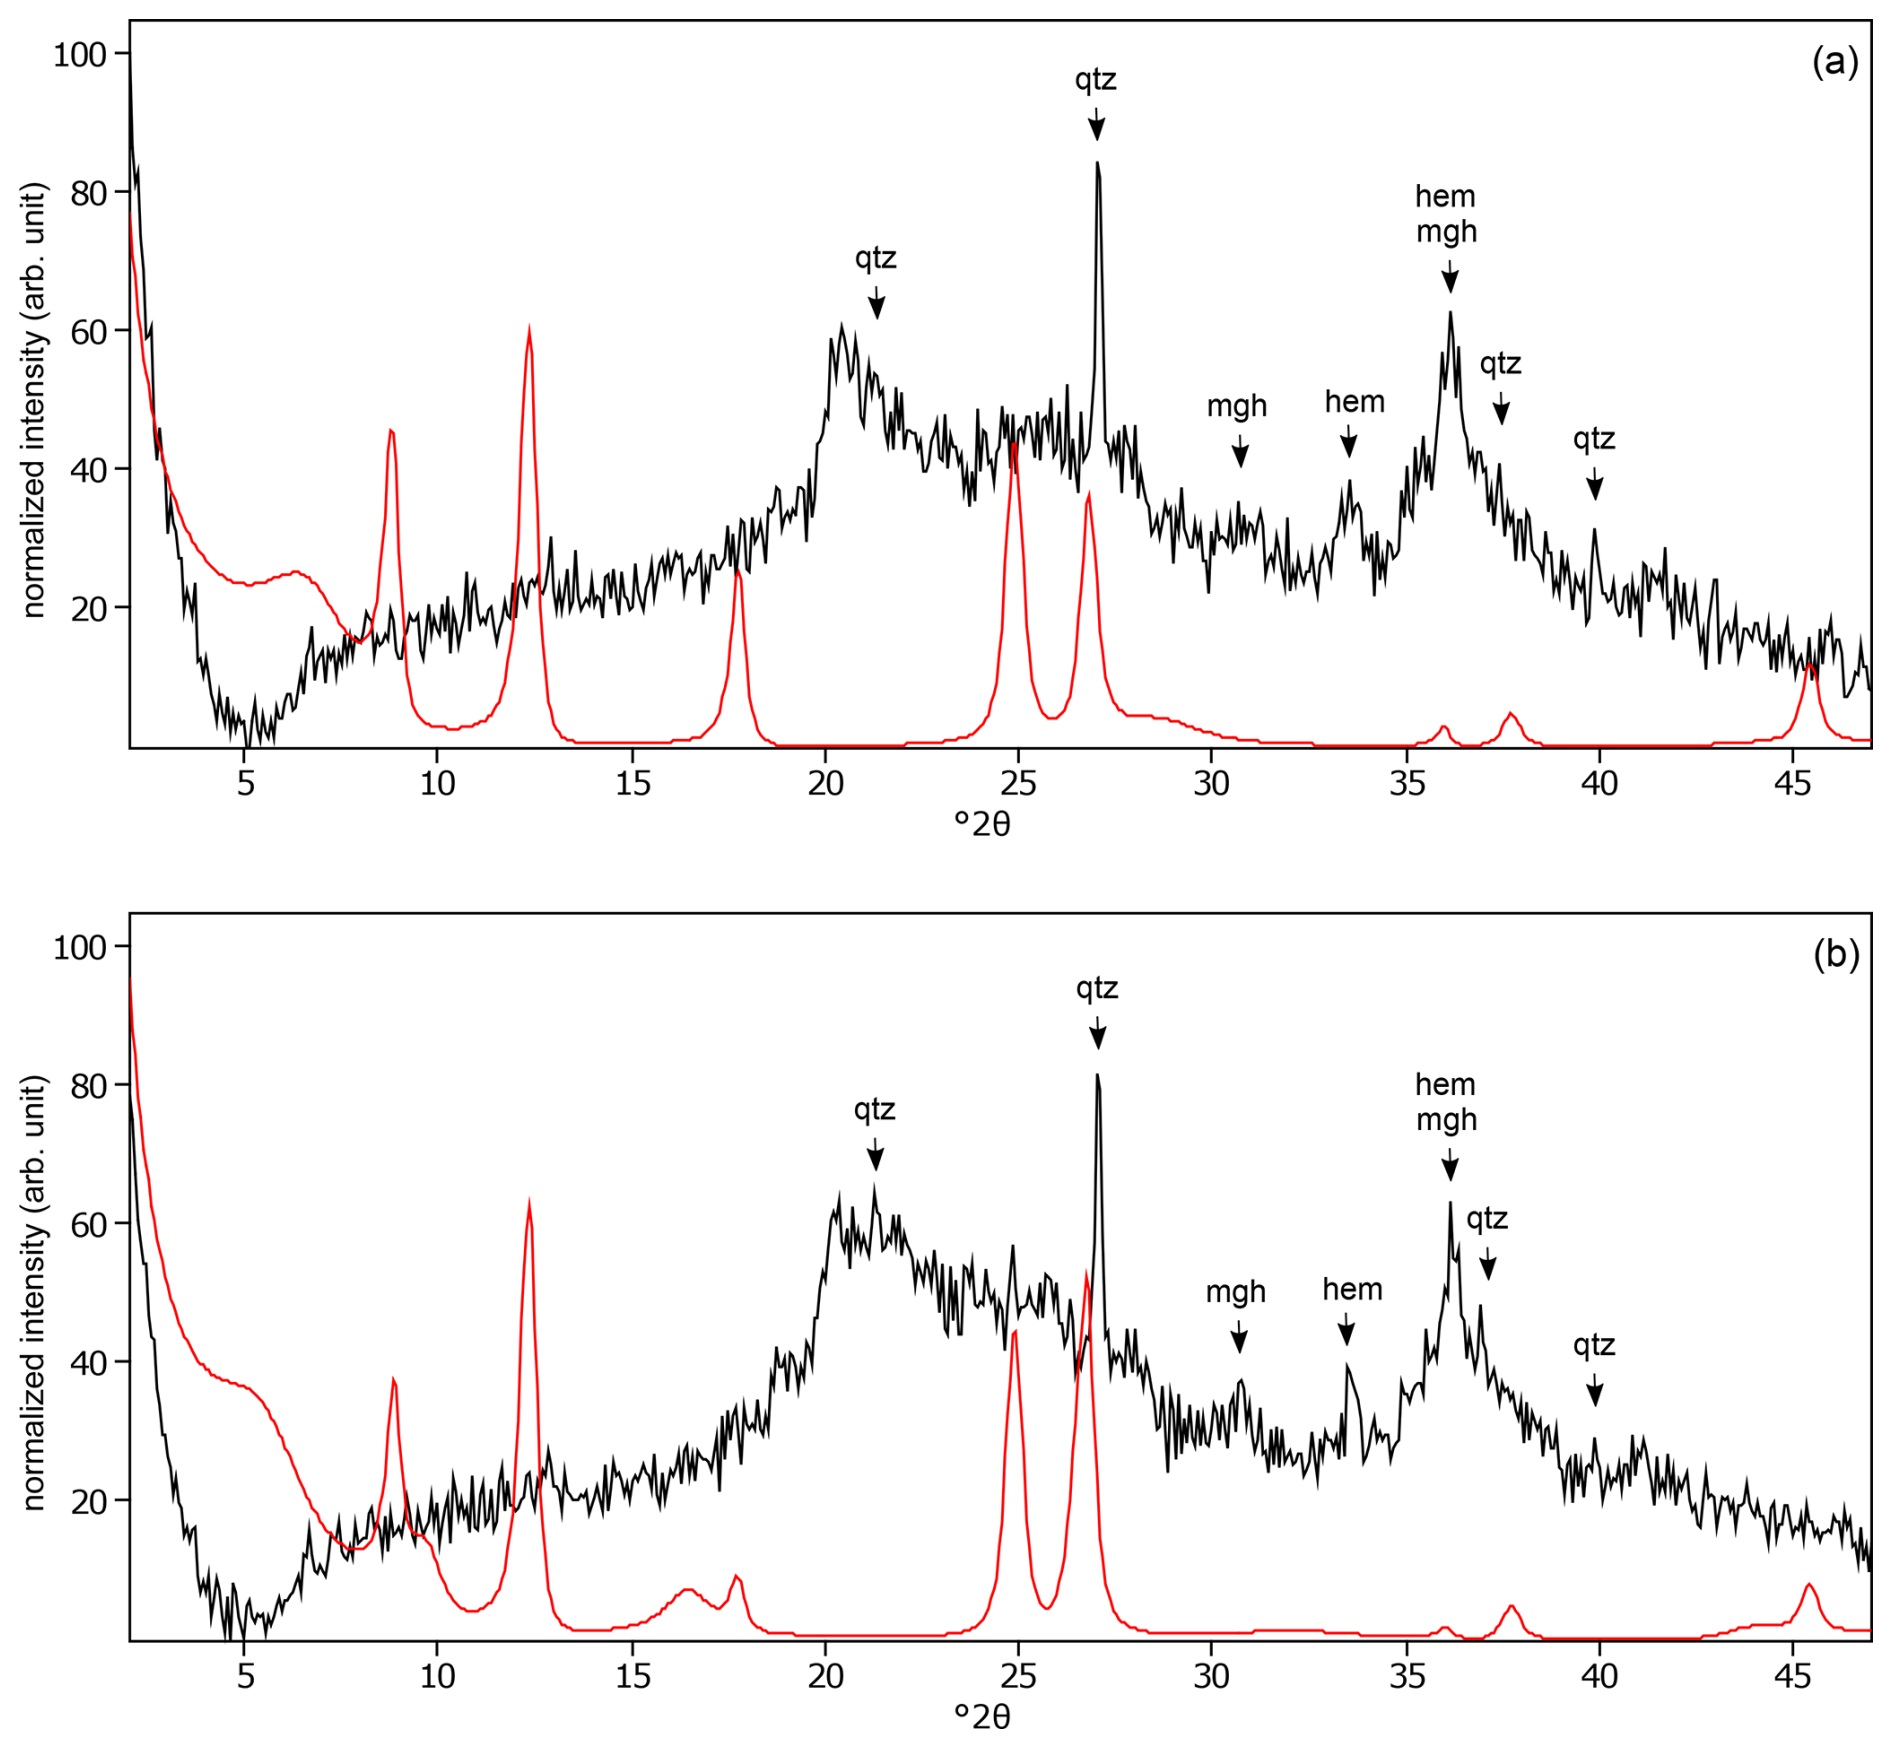
Figure C4The oriented clay fraction of soil from Mount Elgon (Kenya 1). (a) Experimental XRD patterns in air-dried, Ca-saturated state (black) and the modeled pattern (red) of 30 % kaolinite, 45 % randomly interstratified illite–smectite (97:3), and 25 % randomly interstratified illite–smectite (60:40). (b) Experimental XRD patterns in ethylene-glycol-solvated, Ca-saturated state (black) and the modeled pattern (red) of 27 % kaolinite, 24 % randomly interstratified illite–smectite (97:3), and 49 % randomly interstratified illite–smectite (60:40). The arrows indicate quartz (qtz), maghemite (mgh), and hematite (hem) peaks. Allophane shows broad peaks at 3.52 Å (25.29 °2θ) and 2.50 Å (35.85 °2θ).
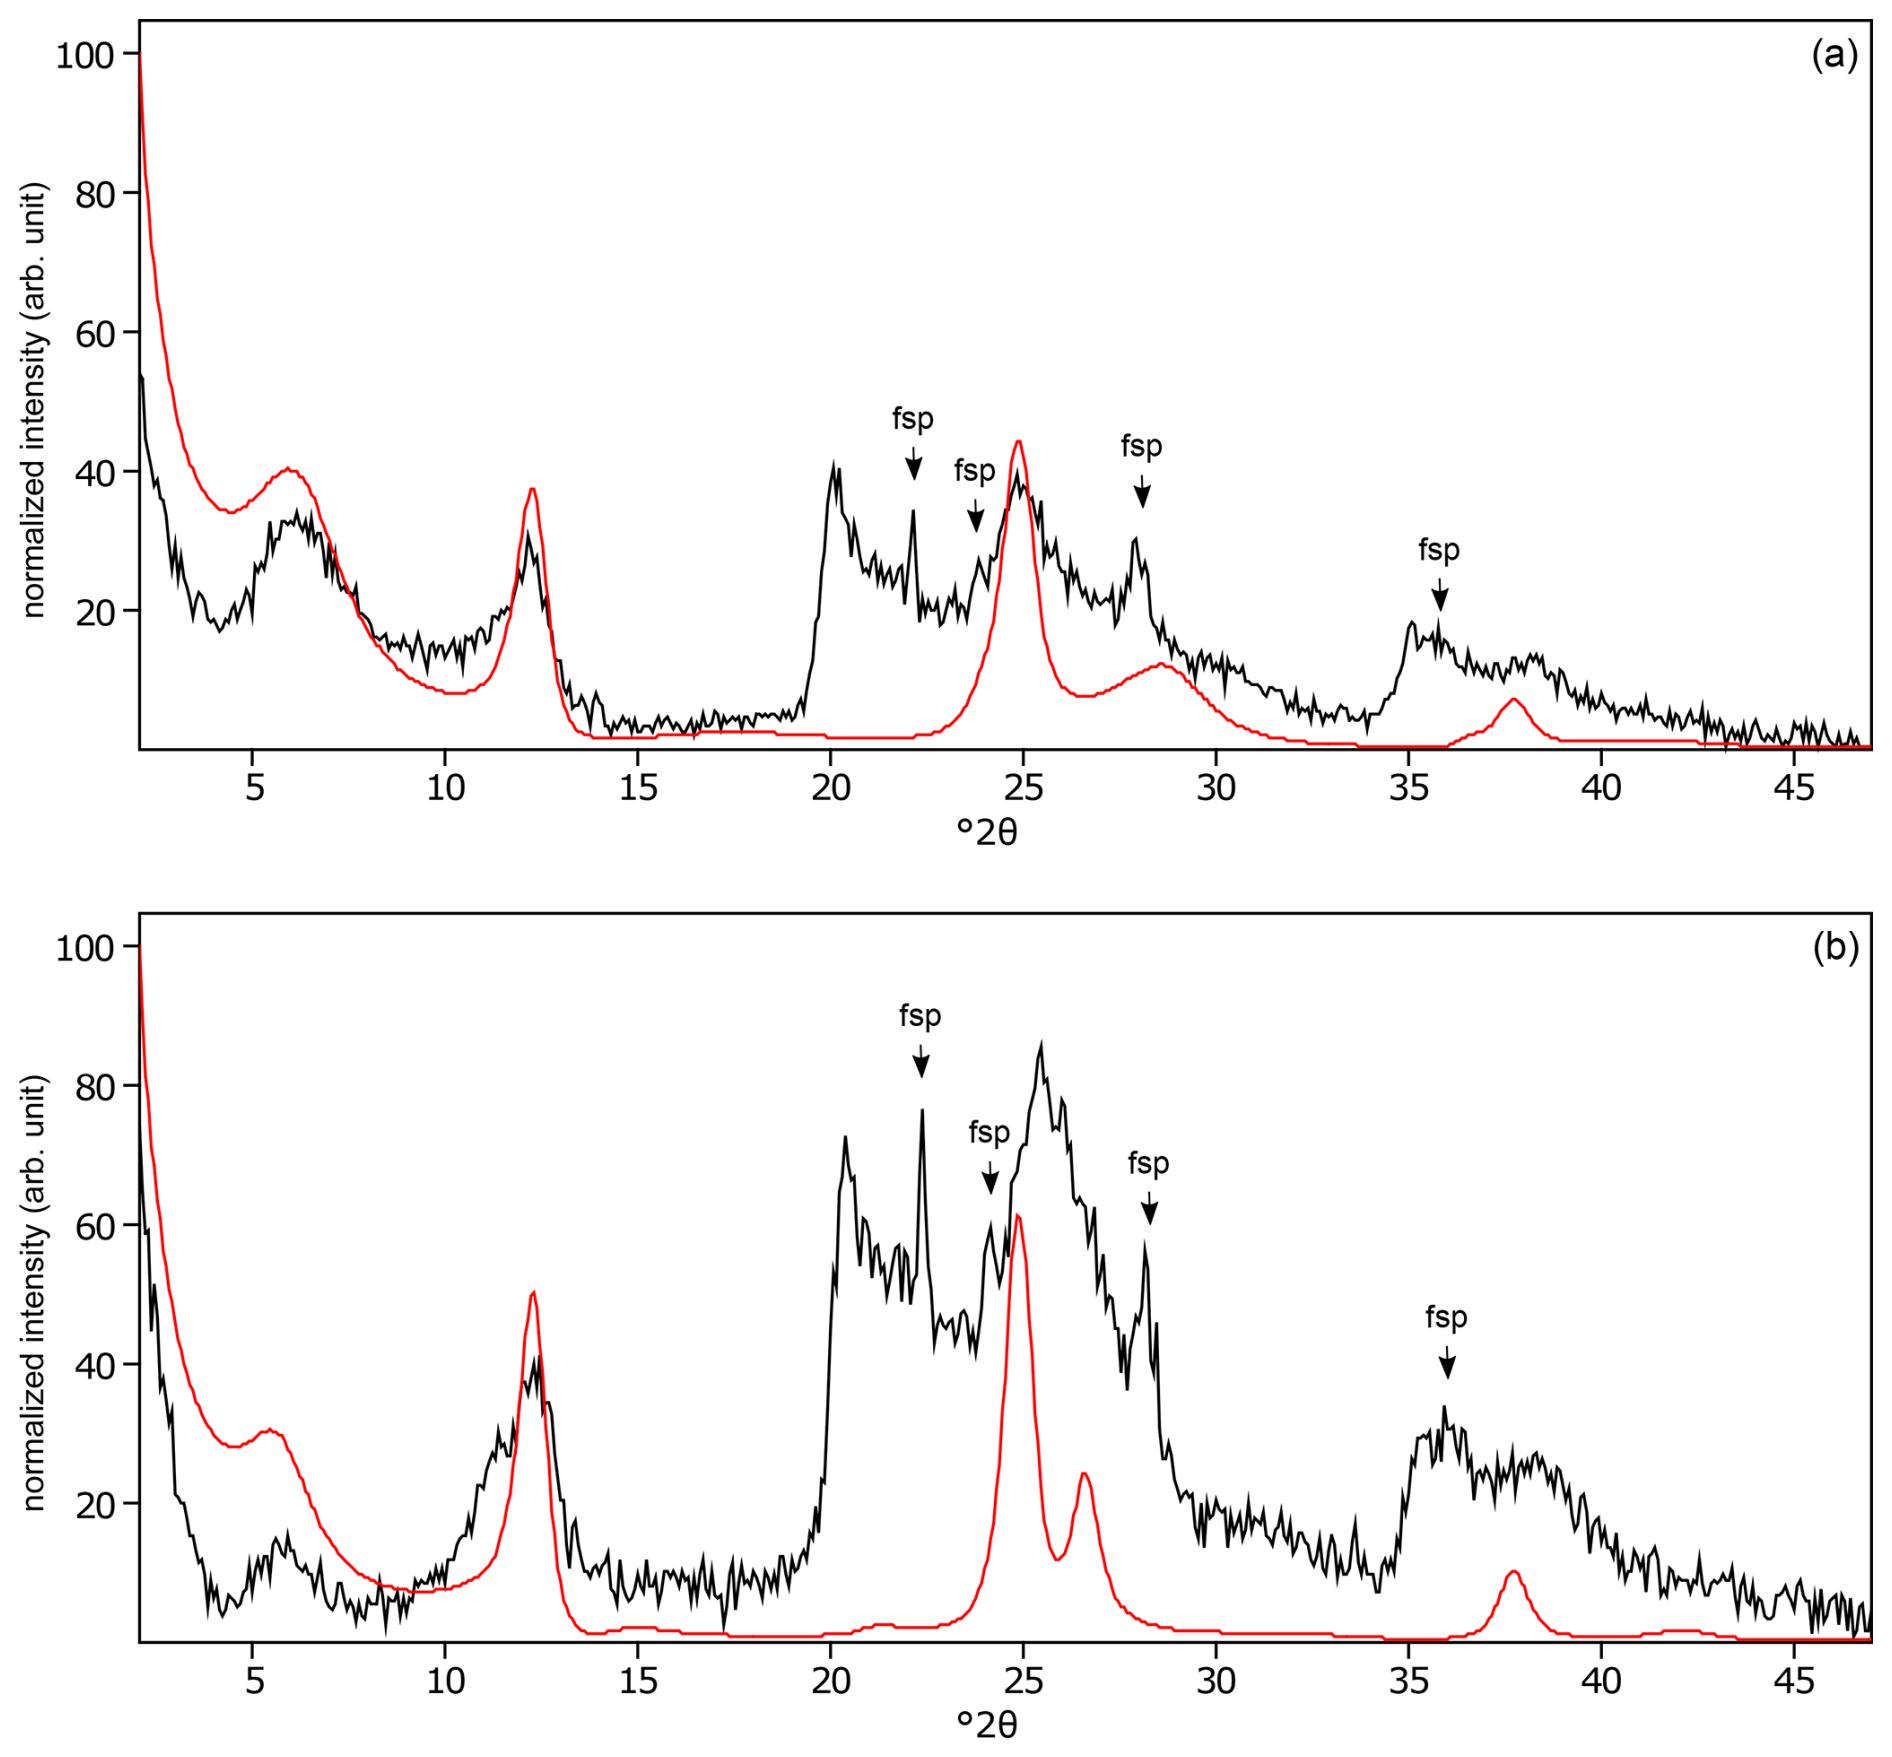
Figure C5The oriented clay fraction of soil from Pagsanjan (Philippines 1). (a) Experimental XRD patterns in air-dried, Ca-saturated state (black) and the modeled pattern (red) of 30 % kaolinite and 70 % randomly interstratified kaolinite–smectite (high charge) (). (b) Experimental XRD patterns in ethylene-glycol-solvated, Ca-saturated state (black) and the modeled pattern (red) of 30 % kaolinite and 70 % randomly interstratified kaolinite–smectite (high charge) (). The arrows indicate feldspar (fsp) peaks.
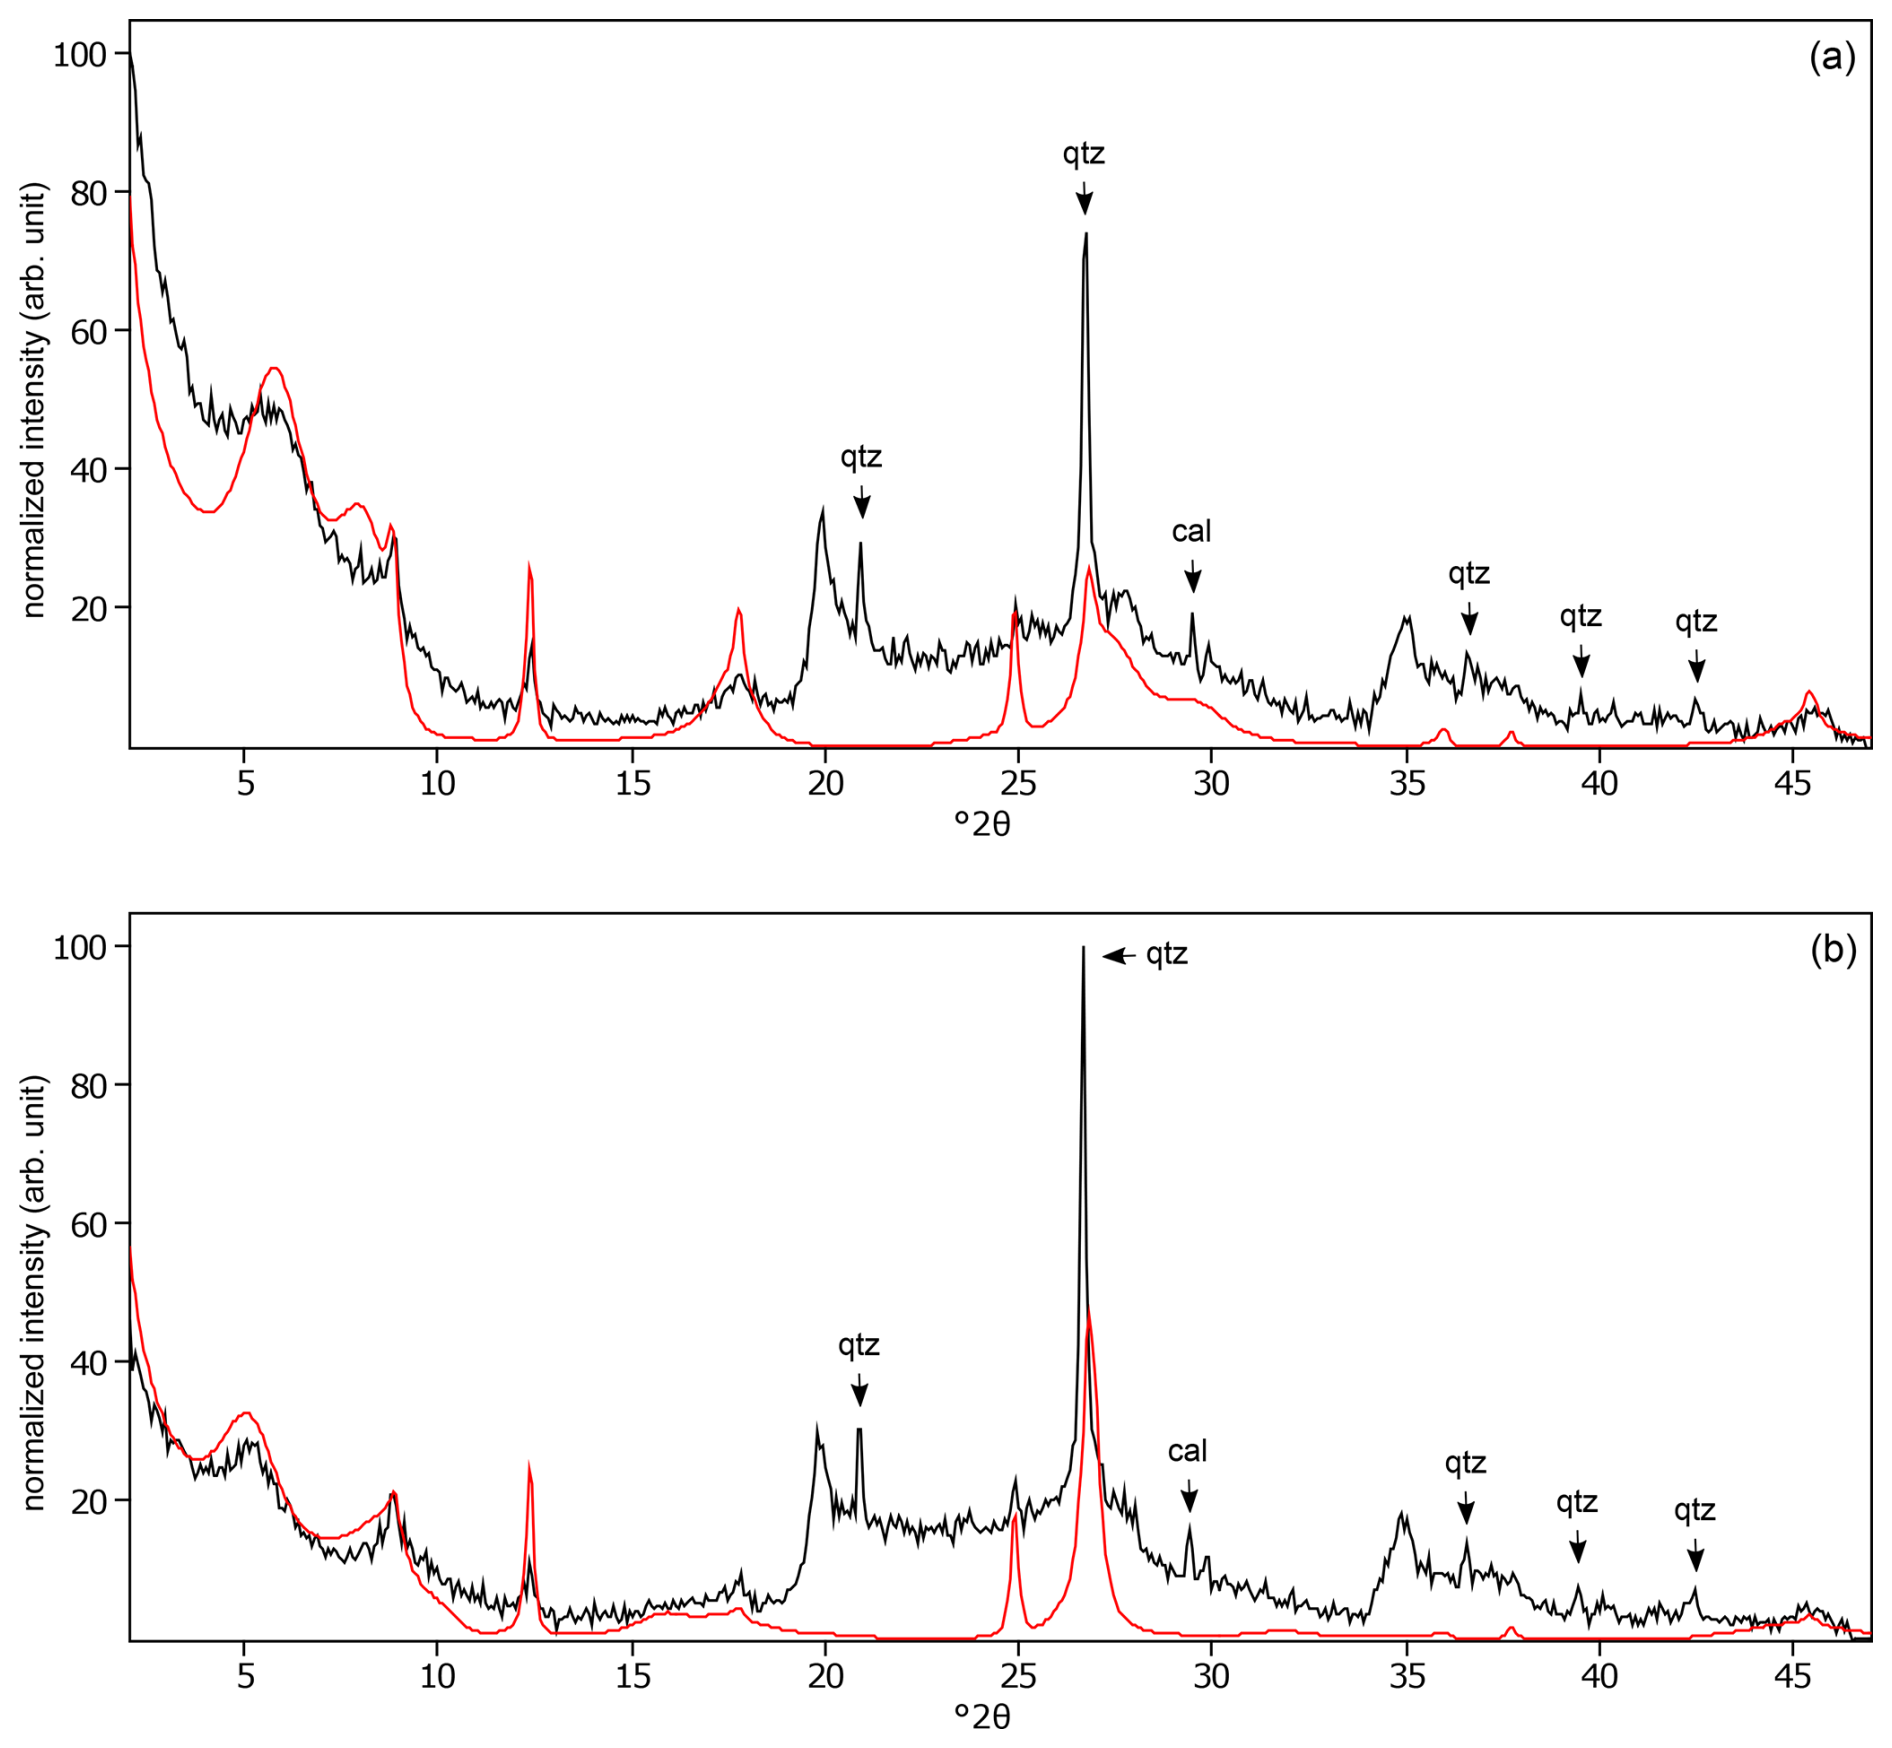
Figure C6The oriented clay fraction of soil from Sidney (United States). (a) experimental XRD patterns in air-dried, Ca-saturated state (black) and the modeled pattern (red) of 6 % kaolinite, 16 % randomly interstratified illite–smectite (97:3), 59 % randomly interstratified illite–smectite (high charge) (), and 19 % randomly interstratified illite–smectite (20:80). (b) Experimental XRD patterns in ethylene-glycol-solvated, Ca-saturated state (black) and the modeled pattern (red) of 8 % kaolinite, 6 % randomly interstratified illite–smectite (97:3), 66 % randomly interstratified illite–smectite (high charge) (), and 20 % randomly interstratified illite–smectite (20:80). The arrows indicate quartz (qtz) and calcite (cal) peaks.
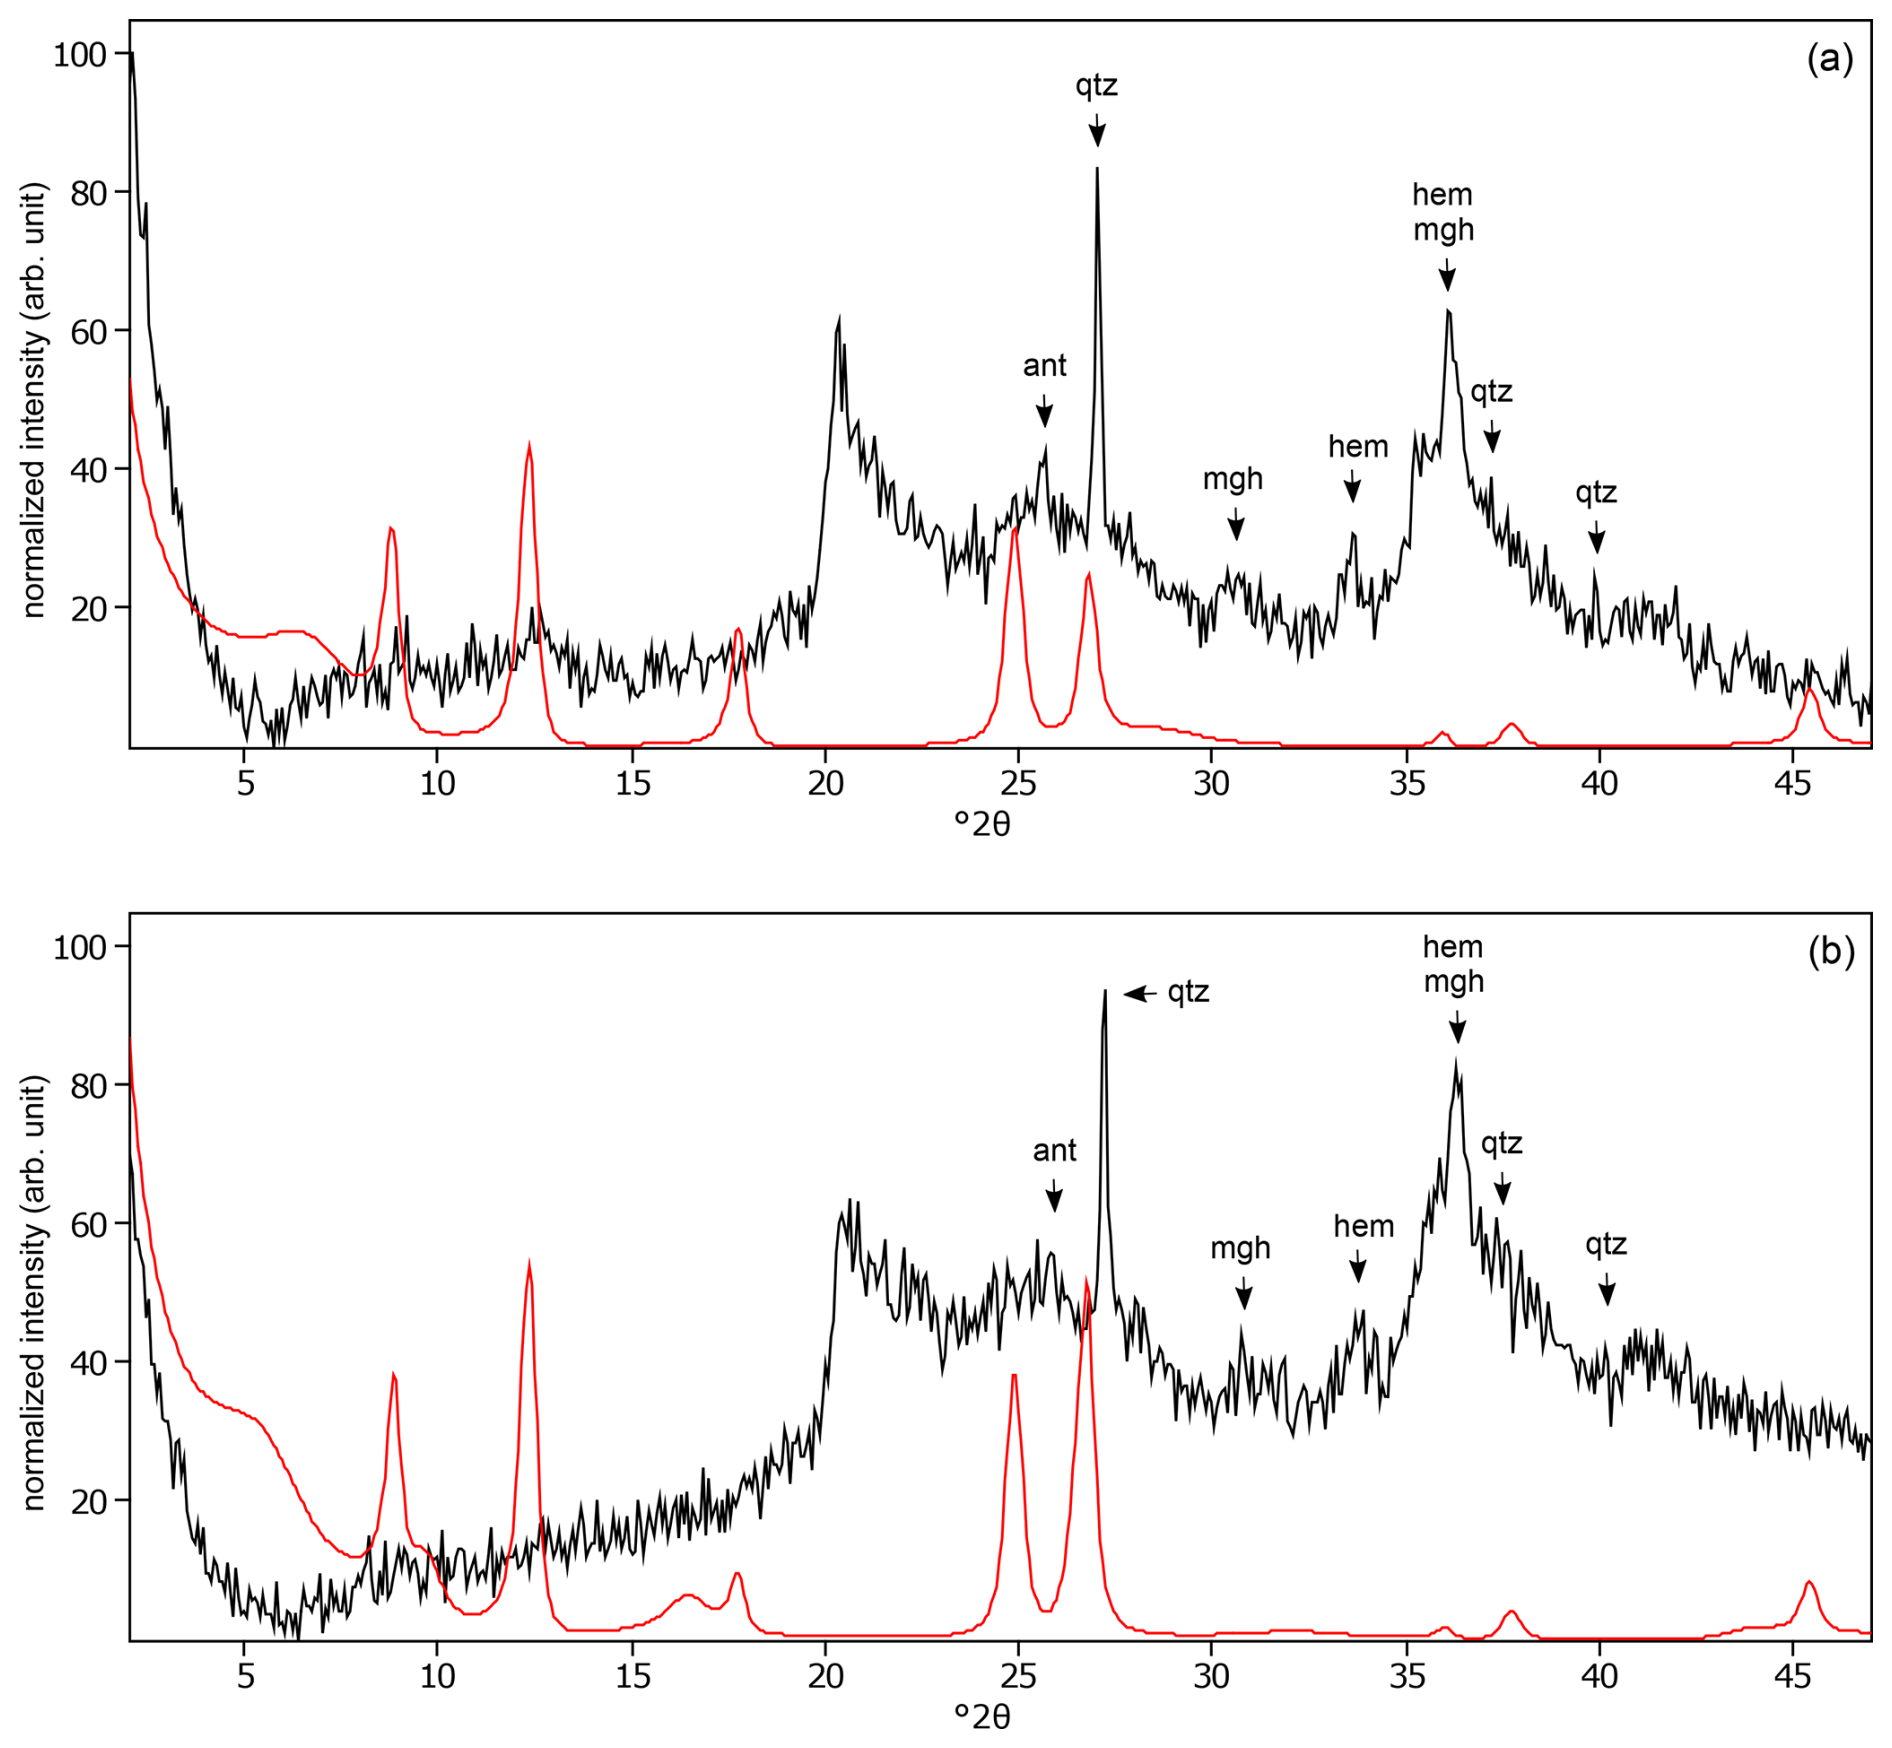
Figure C7The oriented clay fraction of soil from Mount Elgon (Kenya 2). (a) Experimental XRD patterns in air-dried, Ca-saturated state (black) and the modeled pattern (red) of 31 % kaolinite, 45 % randomly interstratified illite–smectite (97:3), and 24 % randomly interstratified illite–smectite (60:40). (b) Experimental XRD patterns in ethylene-glycol-solvated, Ca-saturated state (black) and the modeled pattern (red) of 26 % kaolinite, 28 % randomly interstratified illite–smectite (97:3), and 46 % randomly interstratified illite–smectite (60:40). The arrows indicate quartz (qtz), anatase (ant), maghemite (mgh), and hematite (hem) peaks.
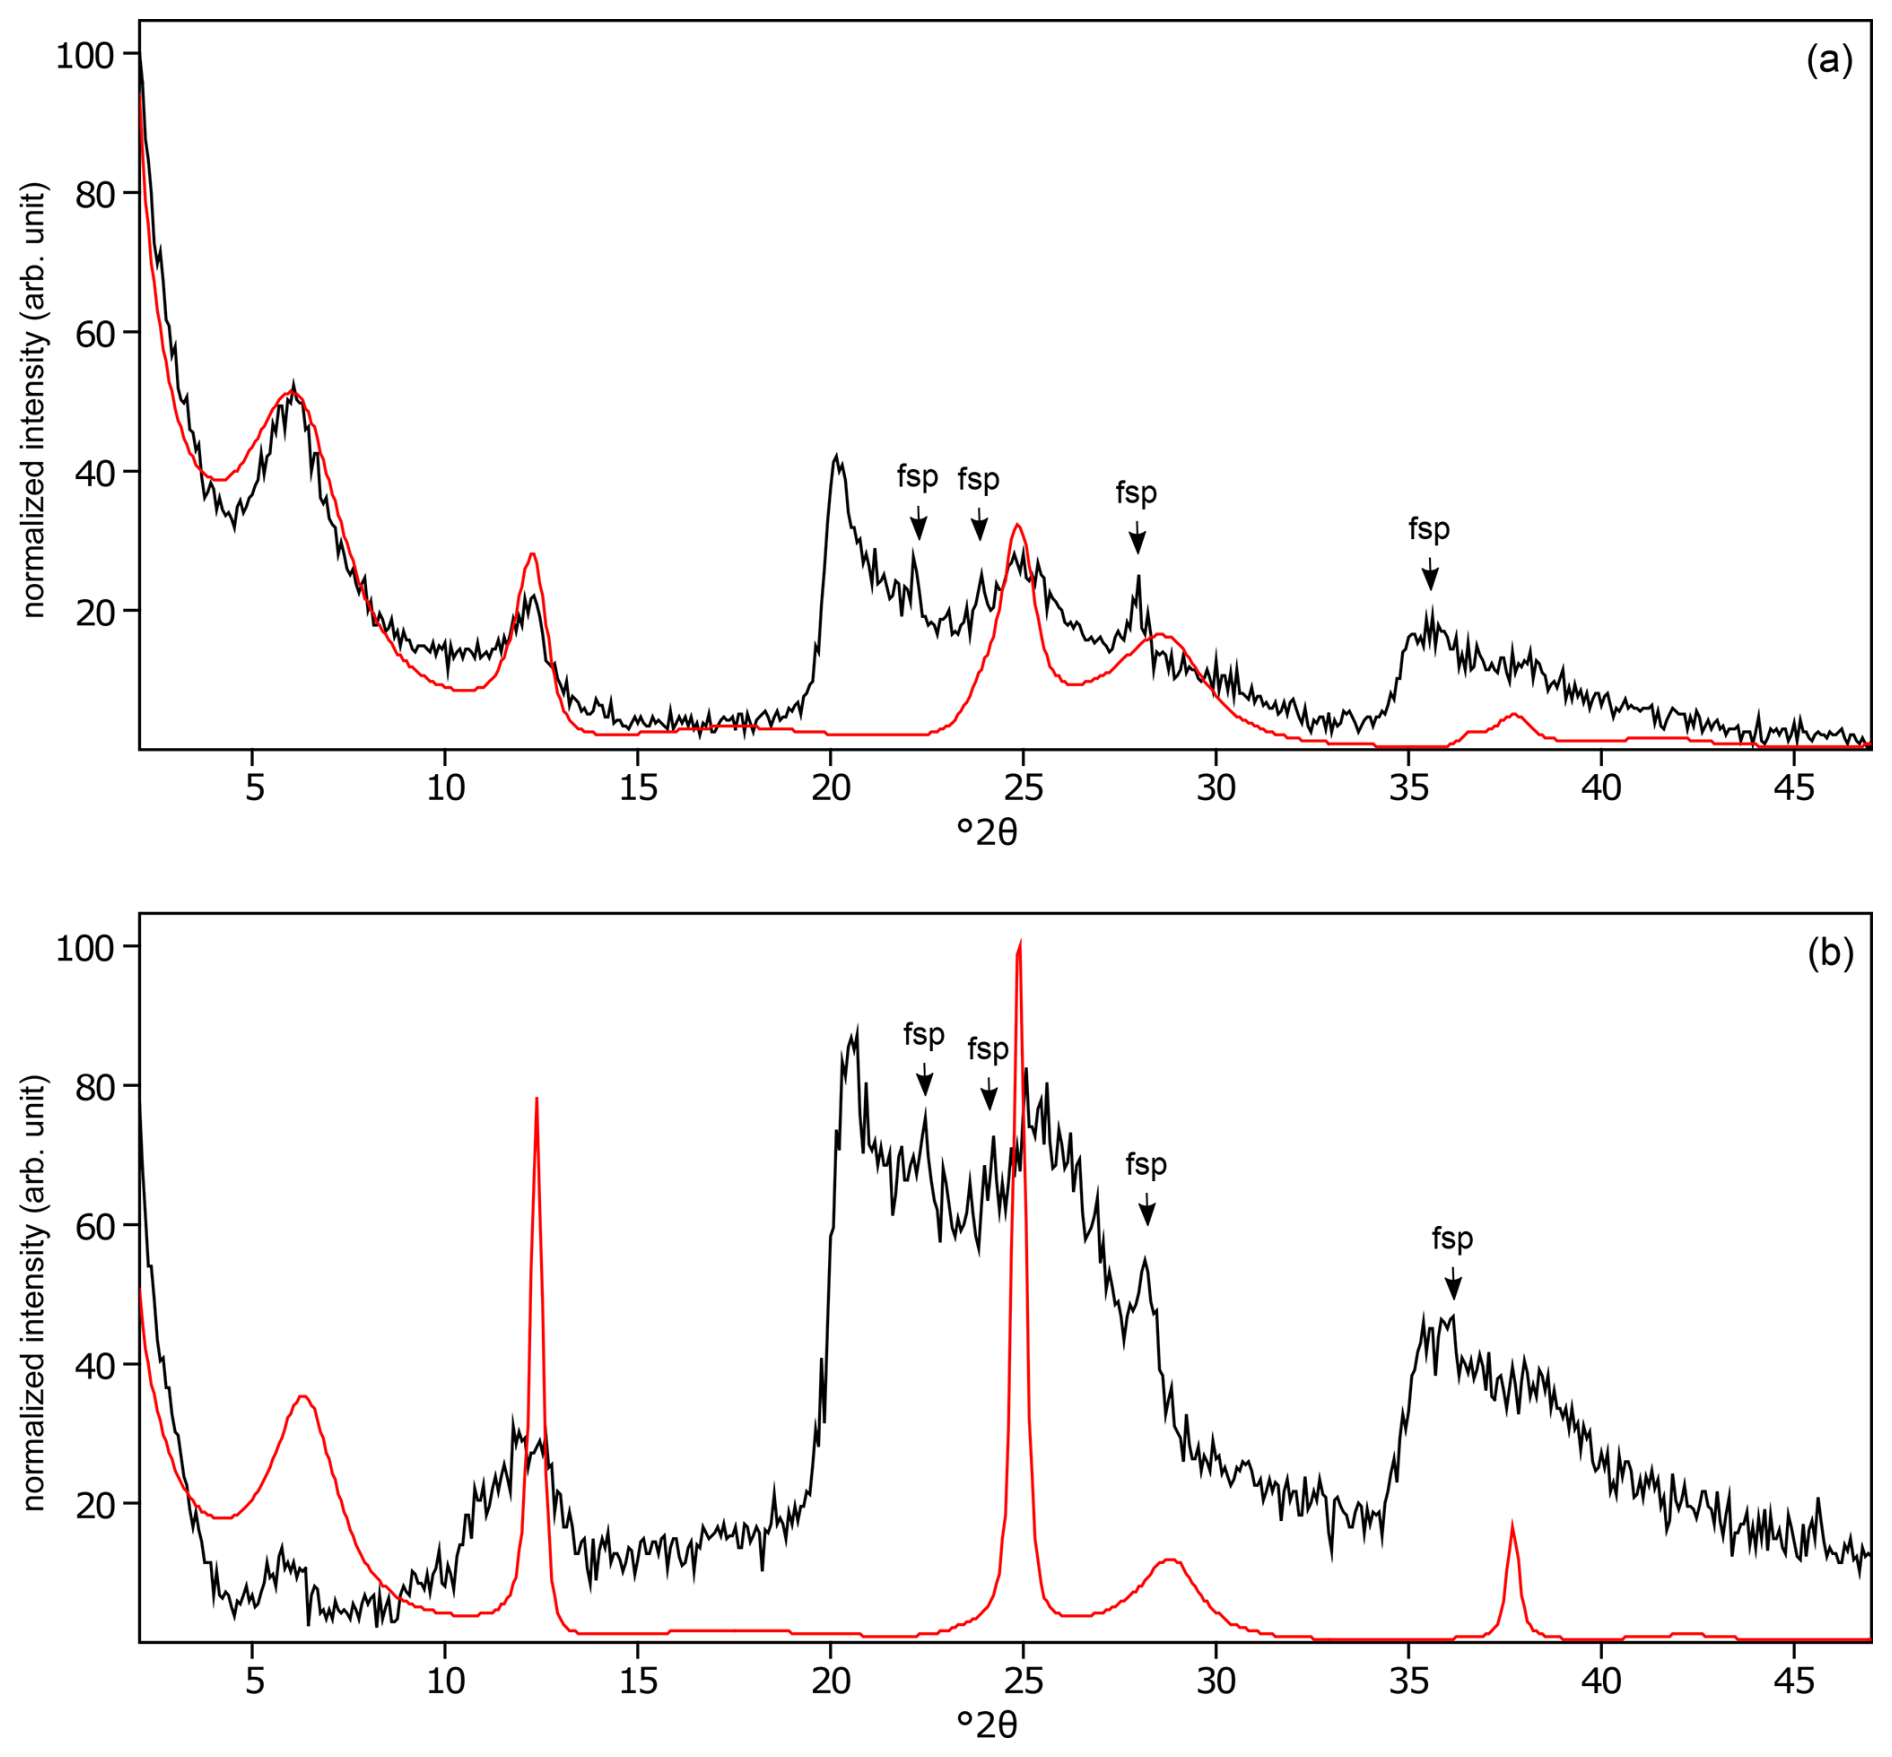
Figure C8The oriented clay fraction of soil from Pagsanjan (Philippines 2). (a) Experimental XRD patterns in air-dried, Ca-saturated state (black) and the modeled pattern (red) of 16 % kaolinite and 84 % randomly interstratified kaolinite–smectite (high charge) (). (b) Experimental XRD patterns in ethylene-glycol-solvated, Ca-saturated state (black) and the modeled pattern (red) of 16 % kaolinite and 84 % randomly interstratified kaolinite–smectite (high charge) (50:30:20). The arrows indicate feldspar (fsp) peaks.
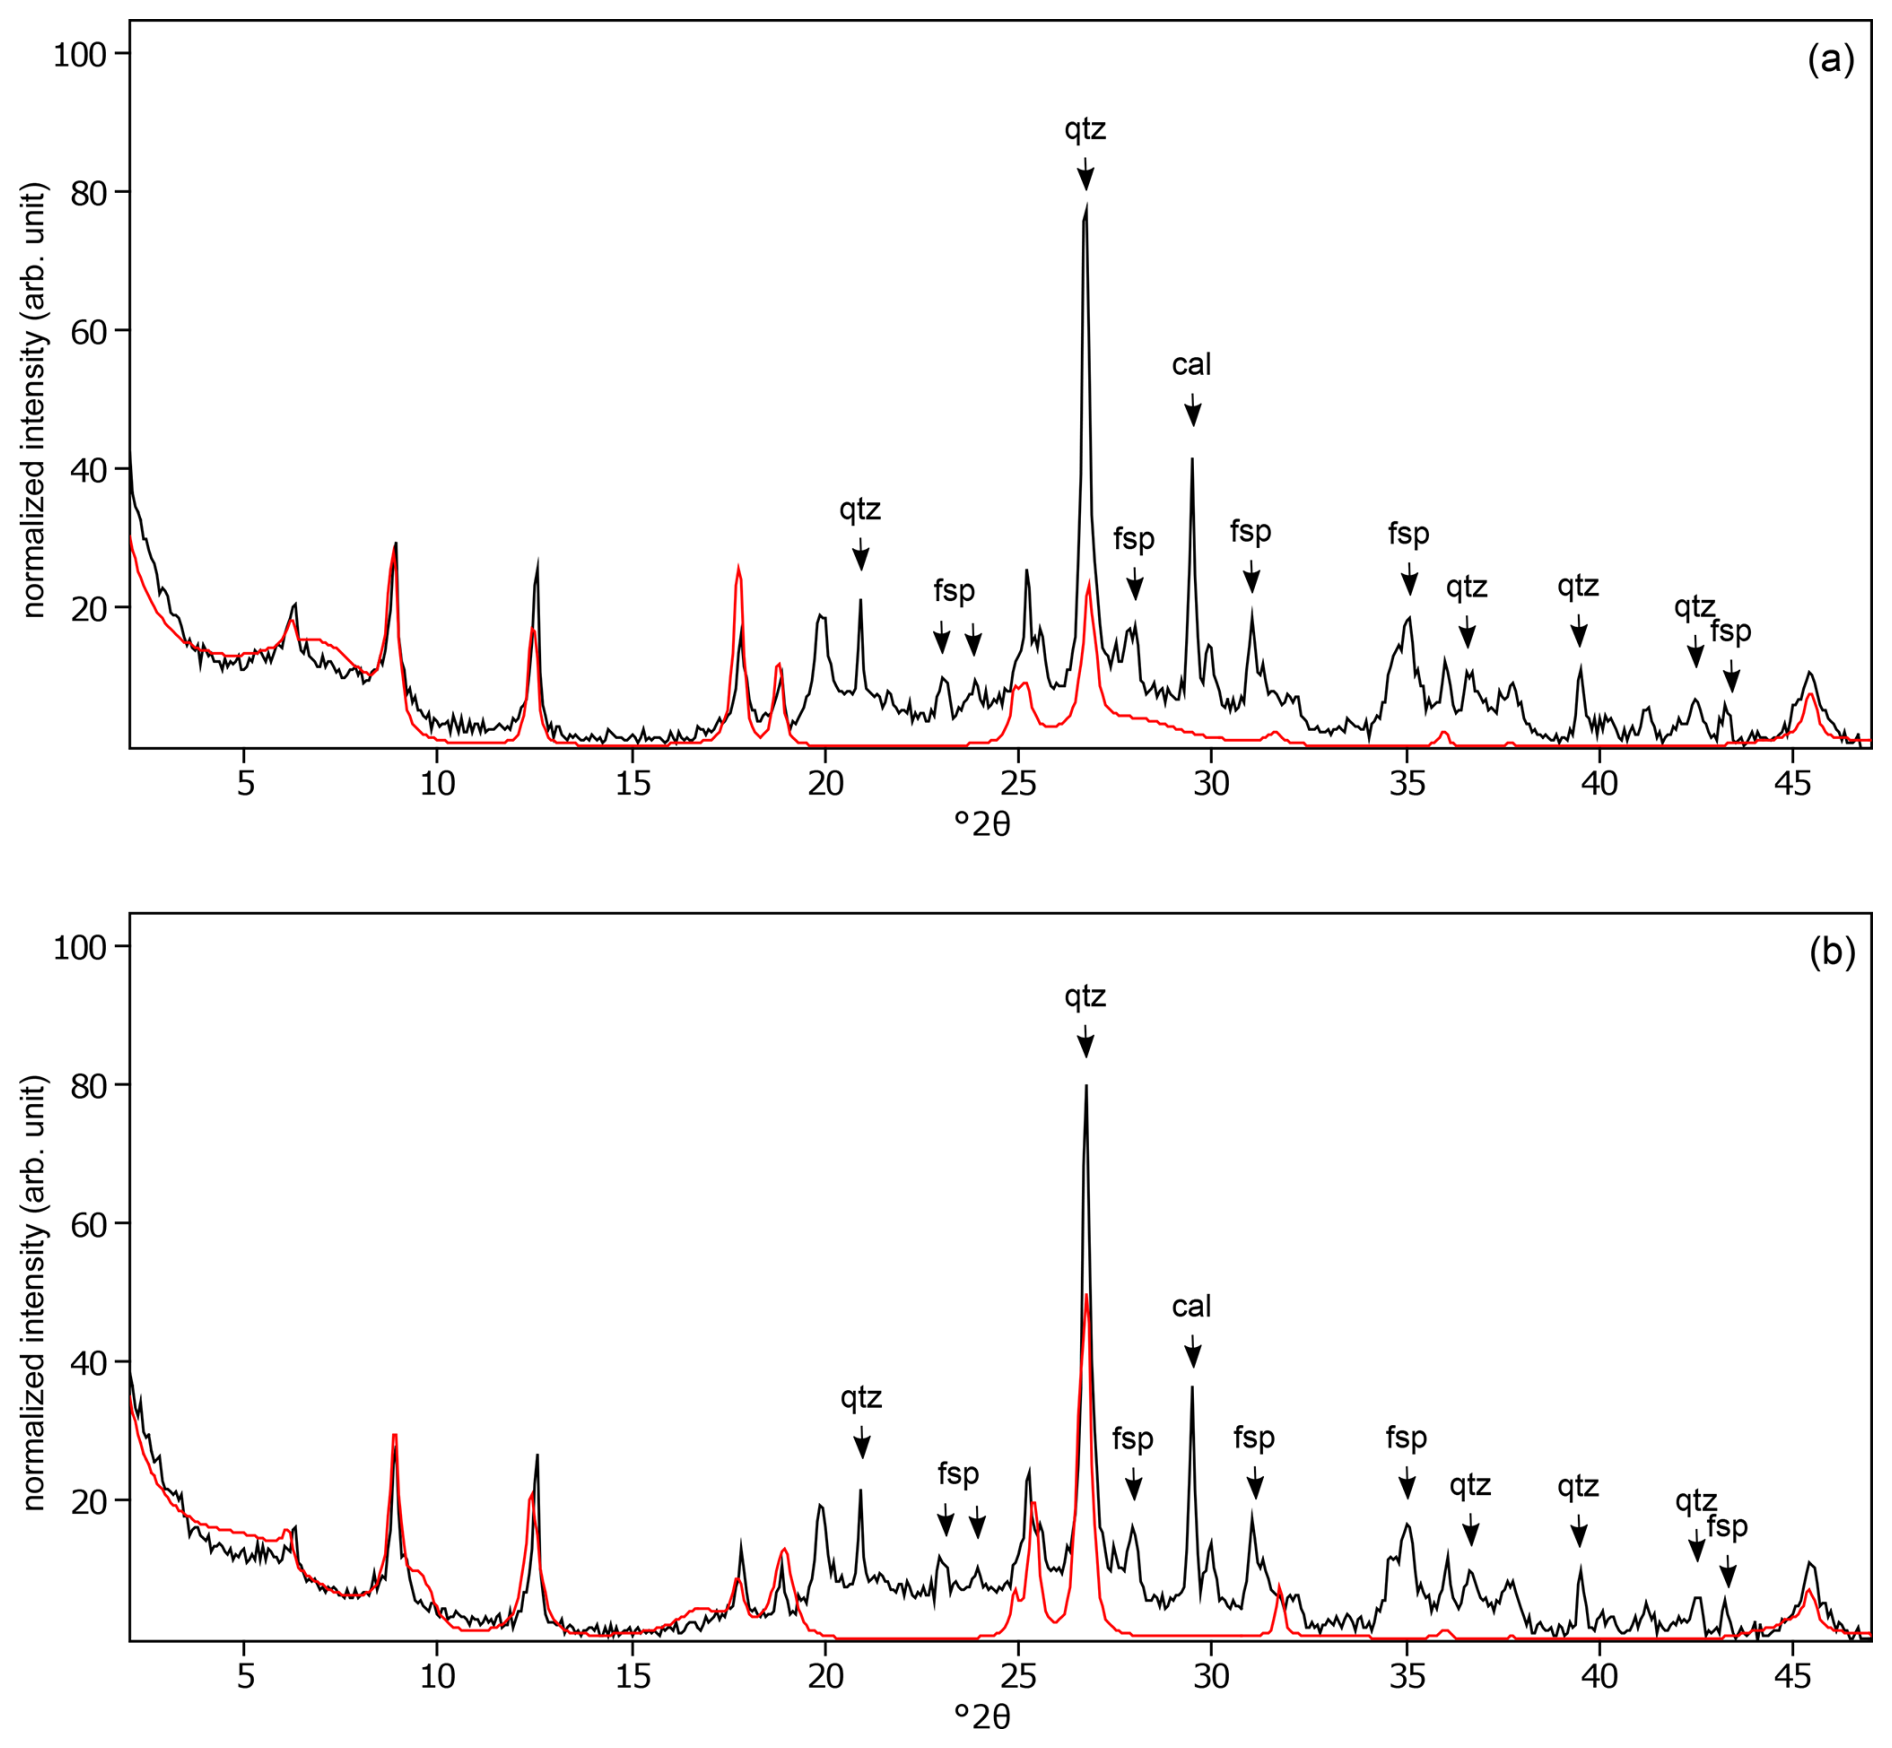
Figure C9The oriented clay fraction of soil from Gross Enzersdorf (Austria). (a) Experimental XRD patterns in air-dried, Ca-saturated state (black) and the modeled pattern (red) of 3 % kaolinite, 38 % randomly interstratified illite–smectite (97:3), 48 % randomly interstratified illite–smectite (68:32), and 11 % randomly interstratified chlorite–smectite (90:10). (b) Experimental XRD patterns in ethylene-glycol-solvated, Ca-saturated state (black) and the modeled pattern (red) 3 % kaolinite, 27 % randomly interstratified illite–smectite (97:3), 50 % randomly interstratified illite–smectite (68:32), and 20 % randomly interstratified chlorite–smectite (90:10). The arrows indicate quartz (qtz), feldspar (fsp), and calcite (cal) peaks.
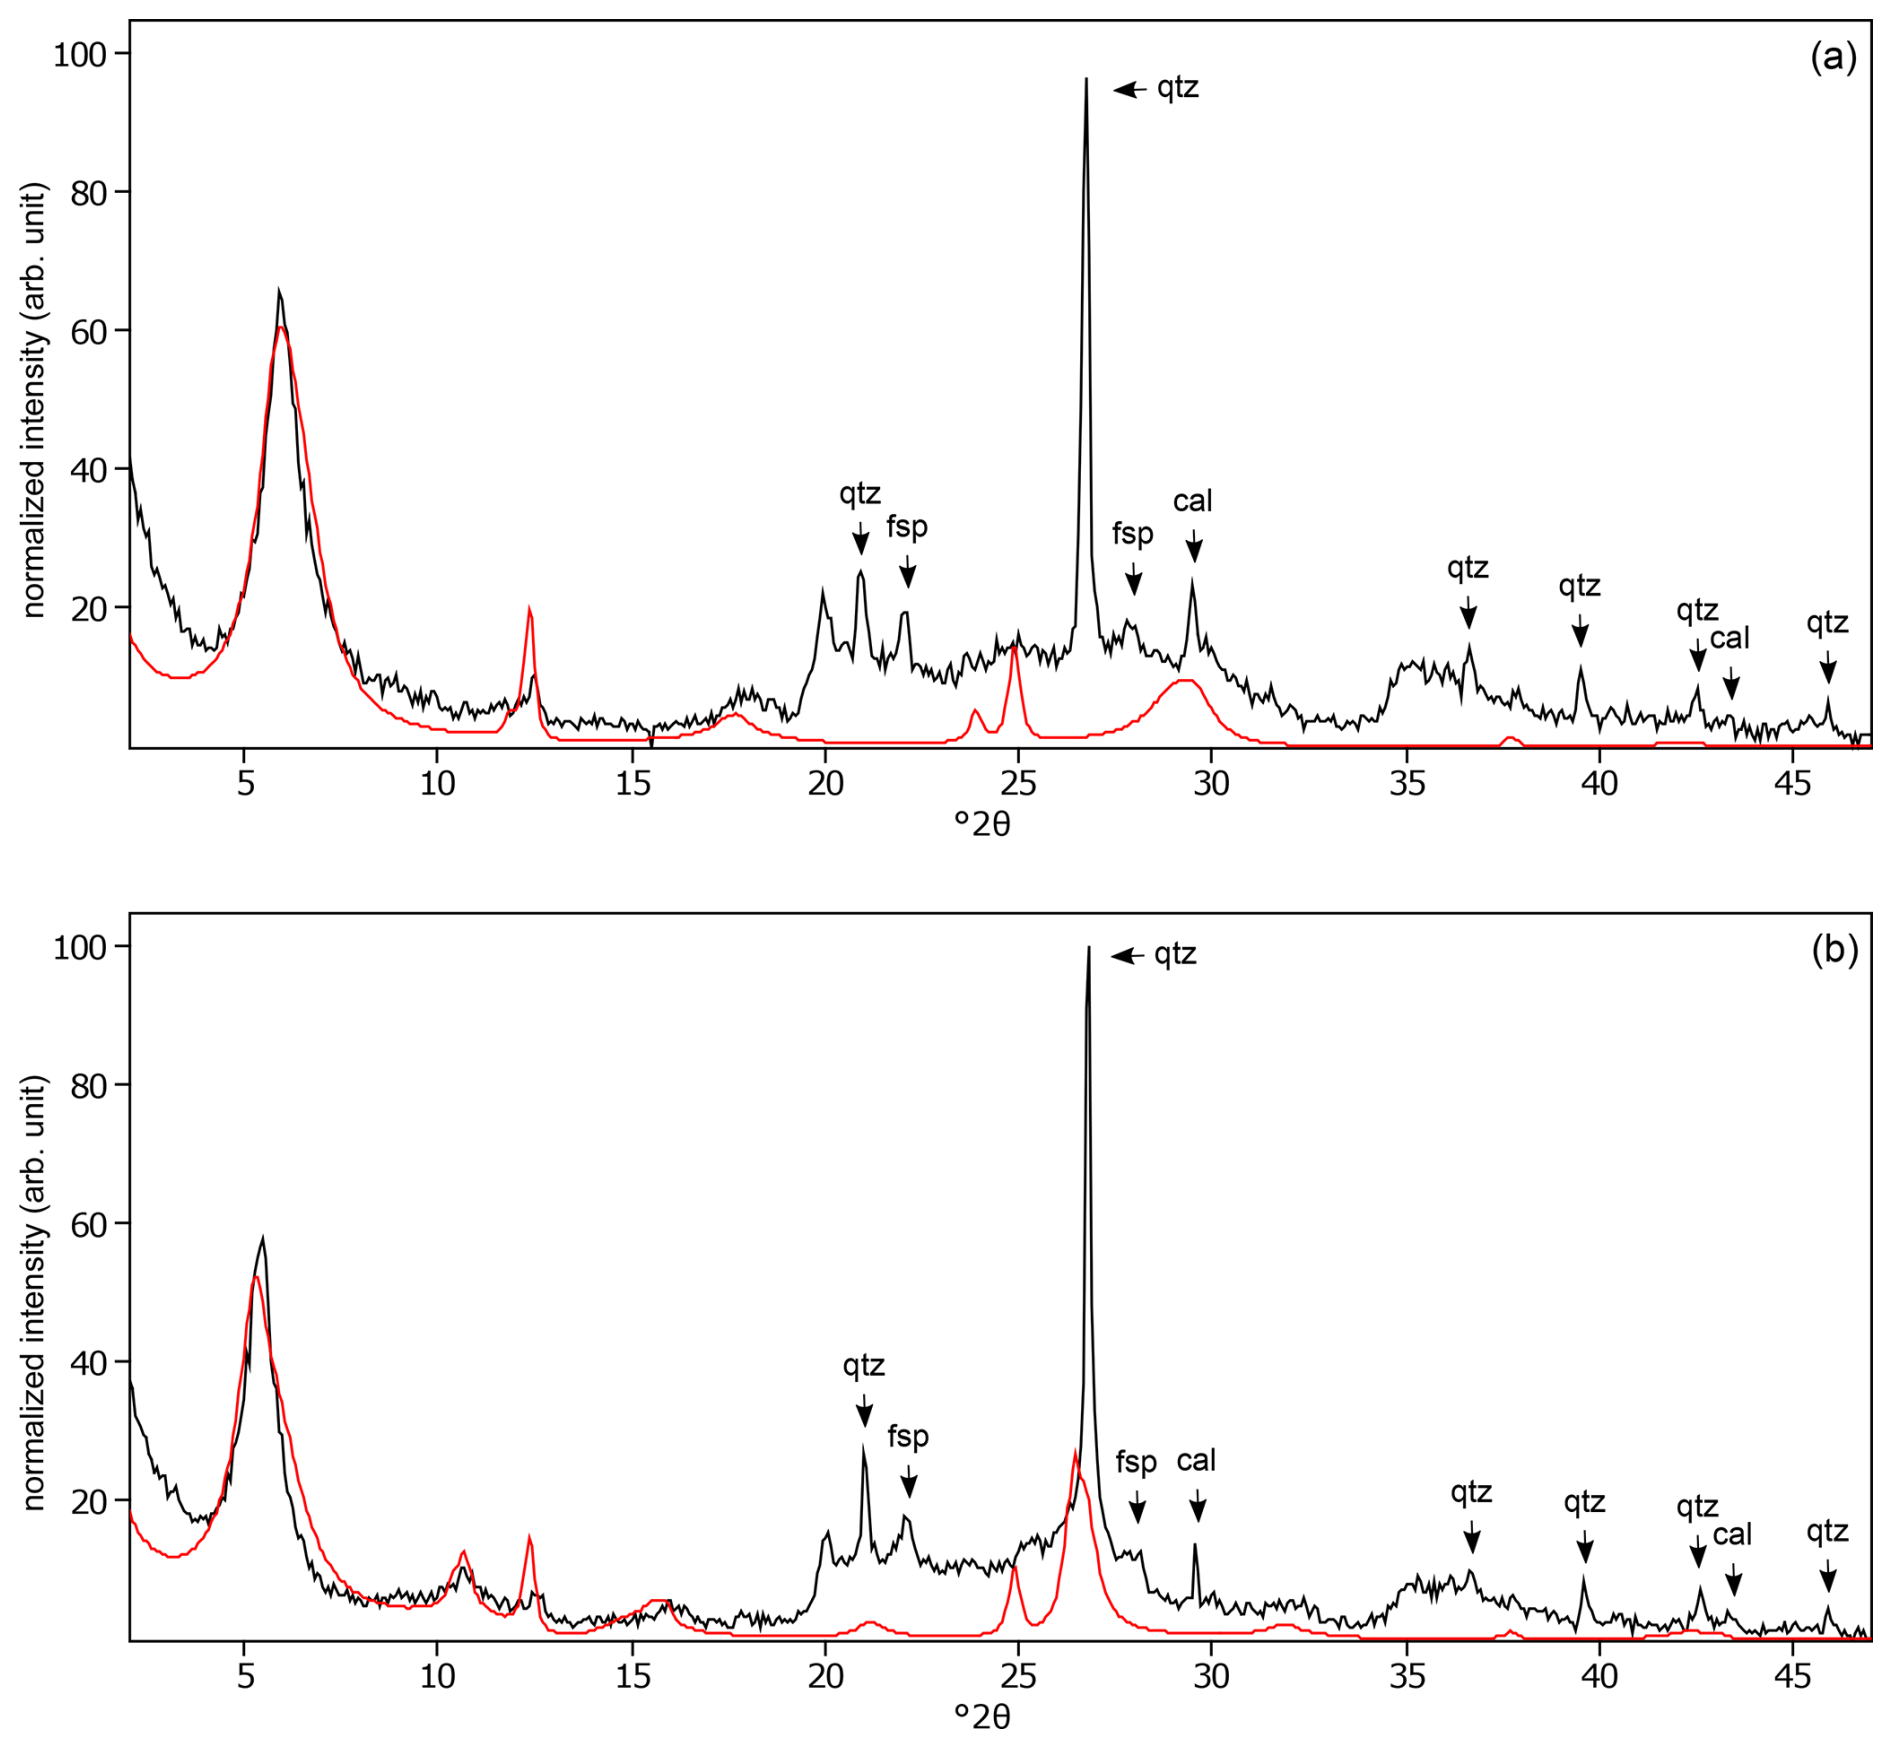
Figure C10The oriented clay fraction of soil from Ogata (Japan). (a) Experimental XRD patterns in air-dried, Ca-saturated state (black) and the modeled pattern (red) of 15 % kaolinite, 46 % randomly interstratified kaolinite–smectite (high charge) (), 39 % randomly interstratified kaolinite–smectite (regular) (25:75), and 1 % randomly interstratified illite–smectite (15:85). (b) Experimental XRD patterns in ethylene-glycol-solvated, Ca-saturated state (black) and the modeled pattern (red) of 8 % kaolinite, 65 % randomly interstratified kaolinite–smectite (high charge) (), 19 % randomly interstratified kaolinite–smectite (regular) (25:75), and 8 % randomly interstratified illite–smectite (15:85). The arrows indicate quartz (qtz), feldspar (fsp), and calcite (cal) peaks.
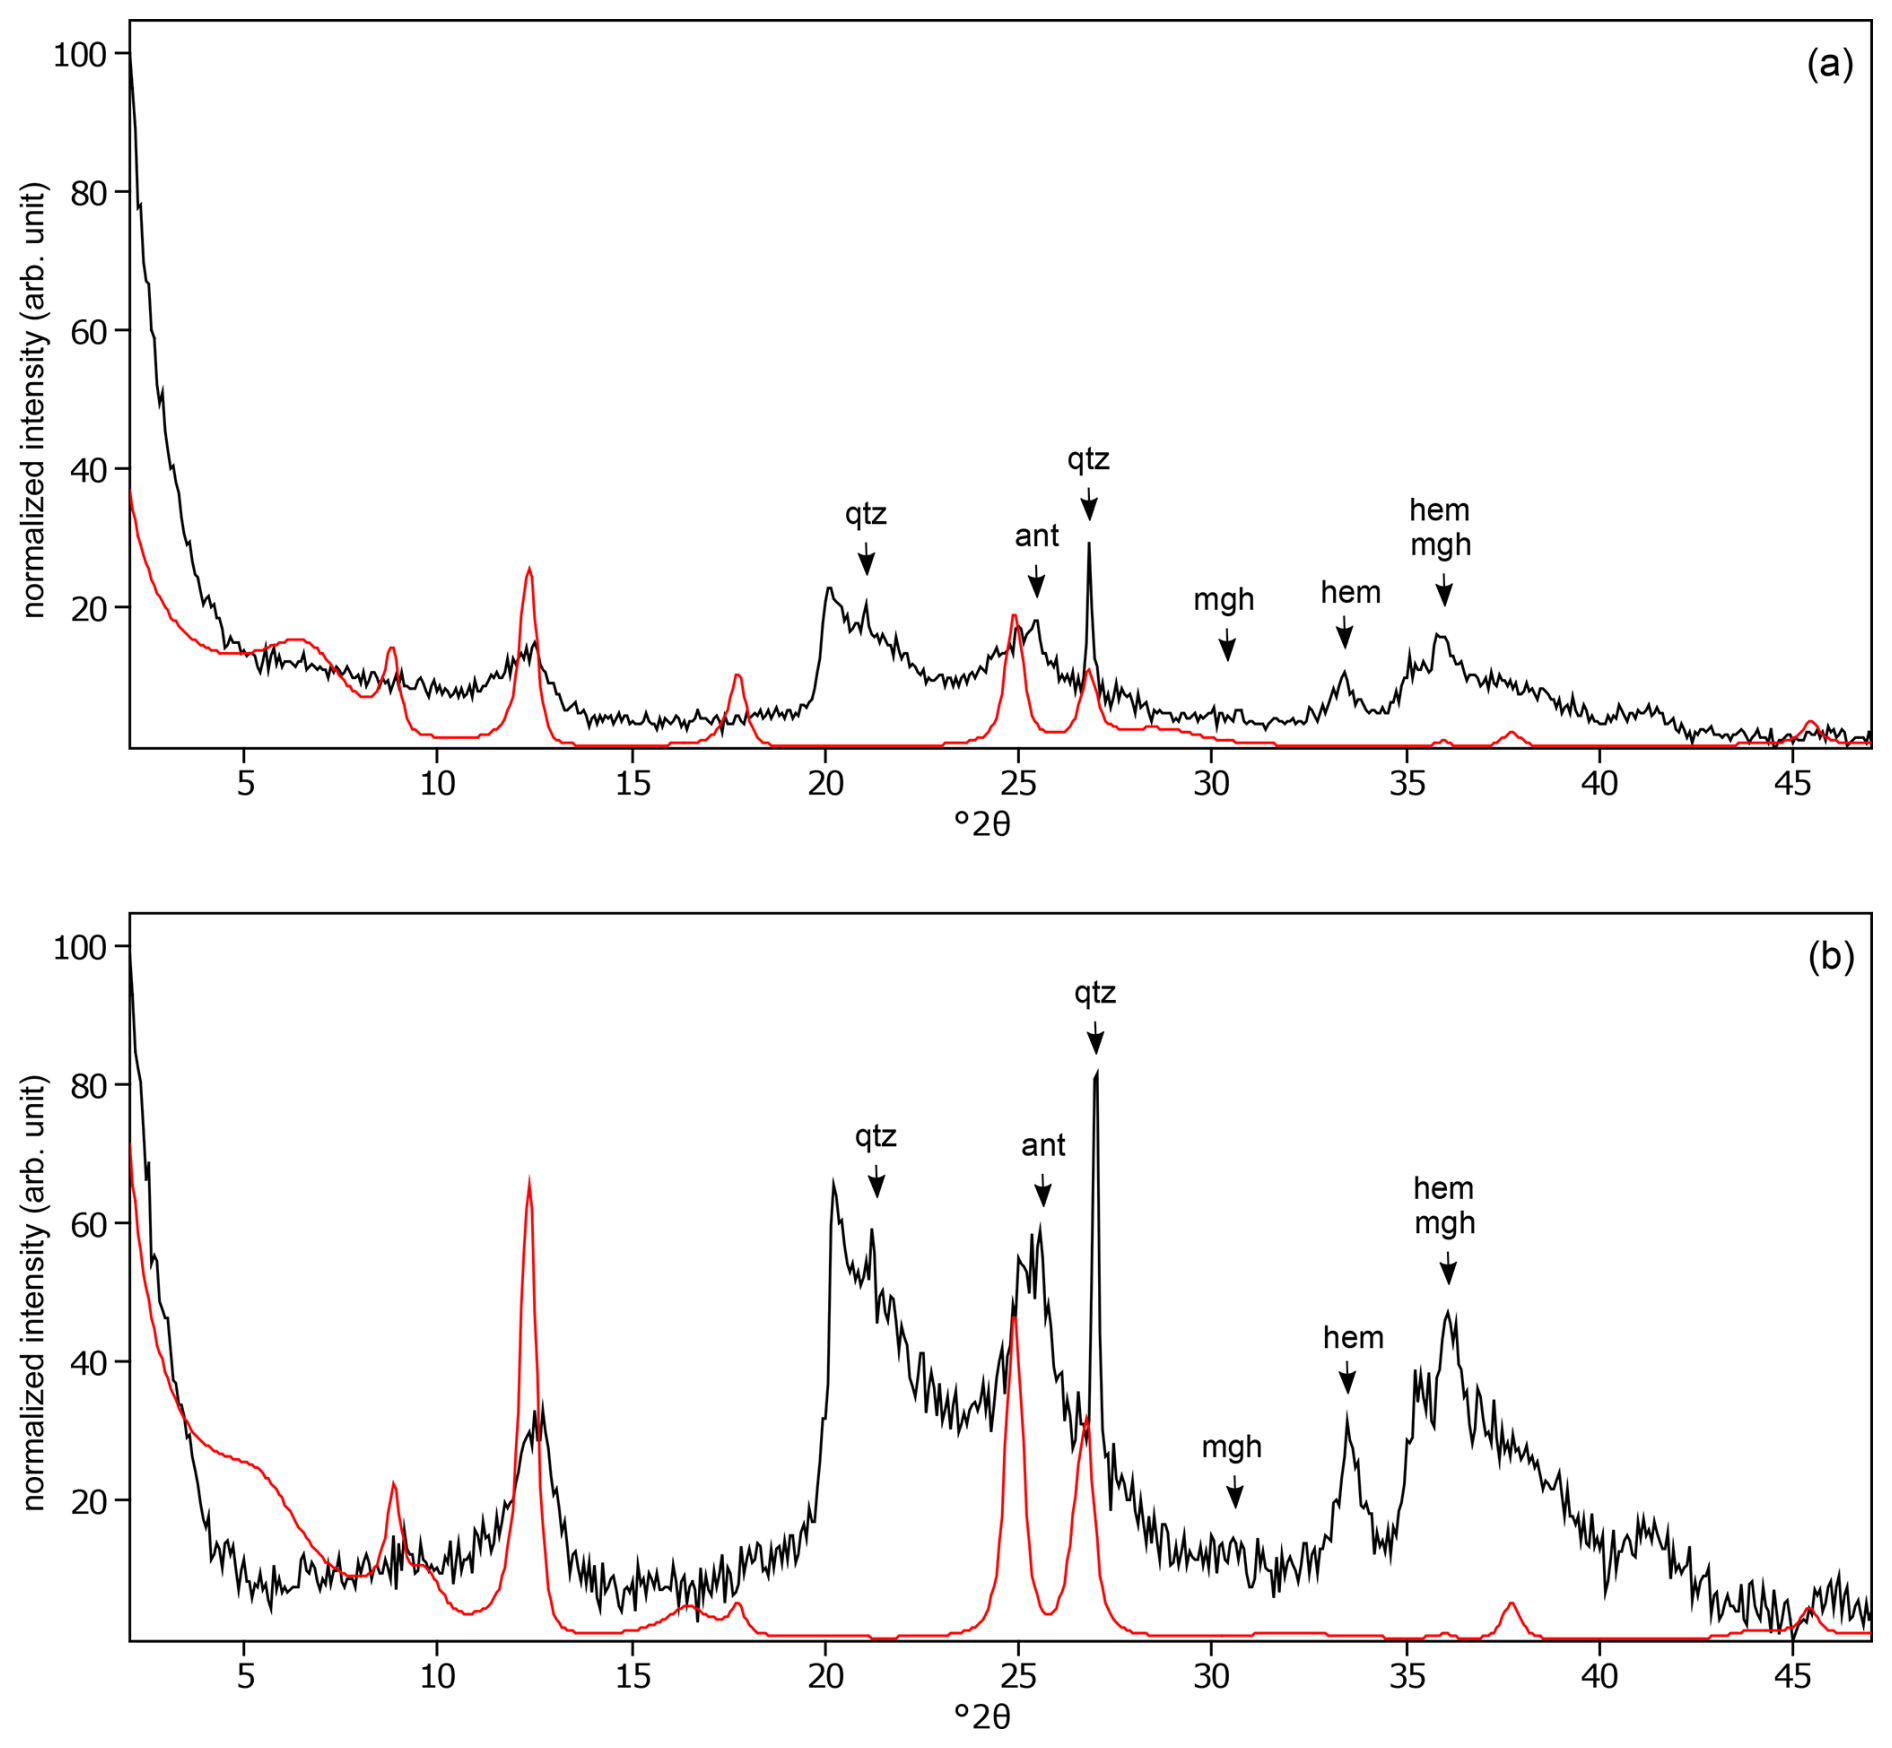
Figure C11The oriented clay fraction of soil from Mount Elgon (Kenya 3). (a) Experimental XRD patterns in air-dried, Ca-saturated state (black) and the modeled pattern (red) of 29 % kaolinite, 29 % randomly interstratified illite–smectite (97:3), and 42 % randomly interstratified illite–smectite (60:40). (b) Experimental XRD patterns in ethylene-glycol-solvated, Ca-saturated state (black) and the modeled pattern (red) of 39 % kaolinite, 17 % randomly interstratified illite–smectite (97:3) and 44 % randomly interstratified illite–smectite (60:40). The arrows indicate quartz (qtz), anatase (ant), maghemite (mgh), and hematite (hem) peaks.
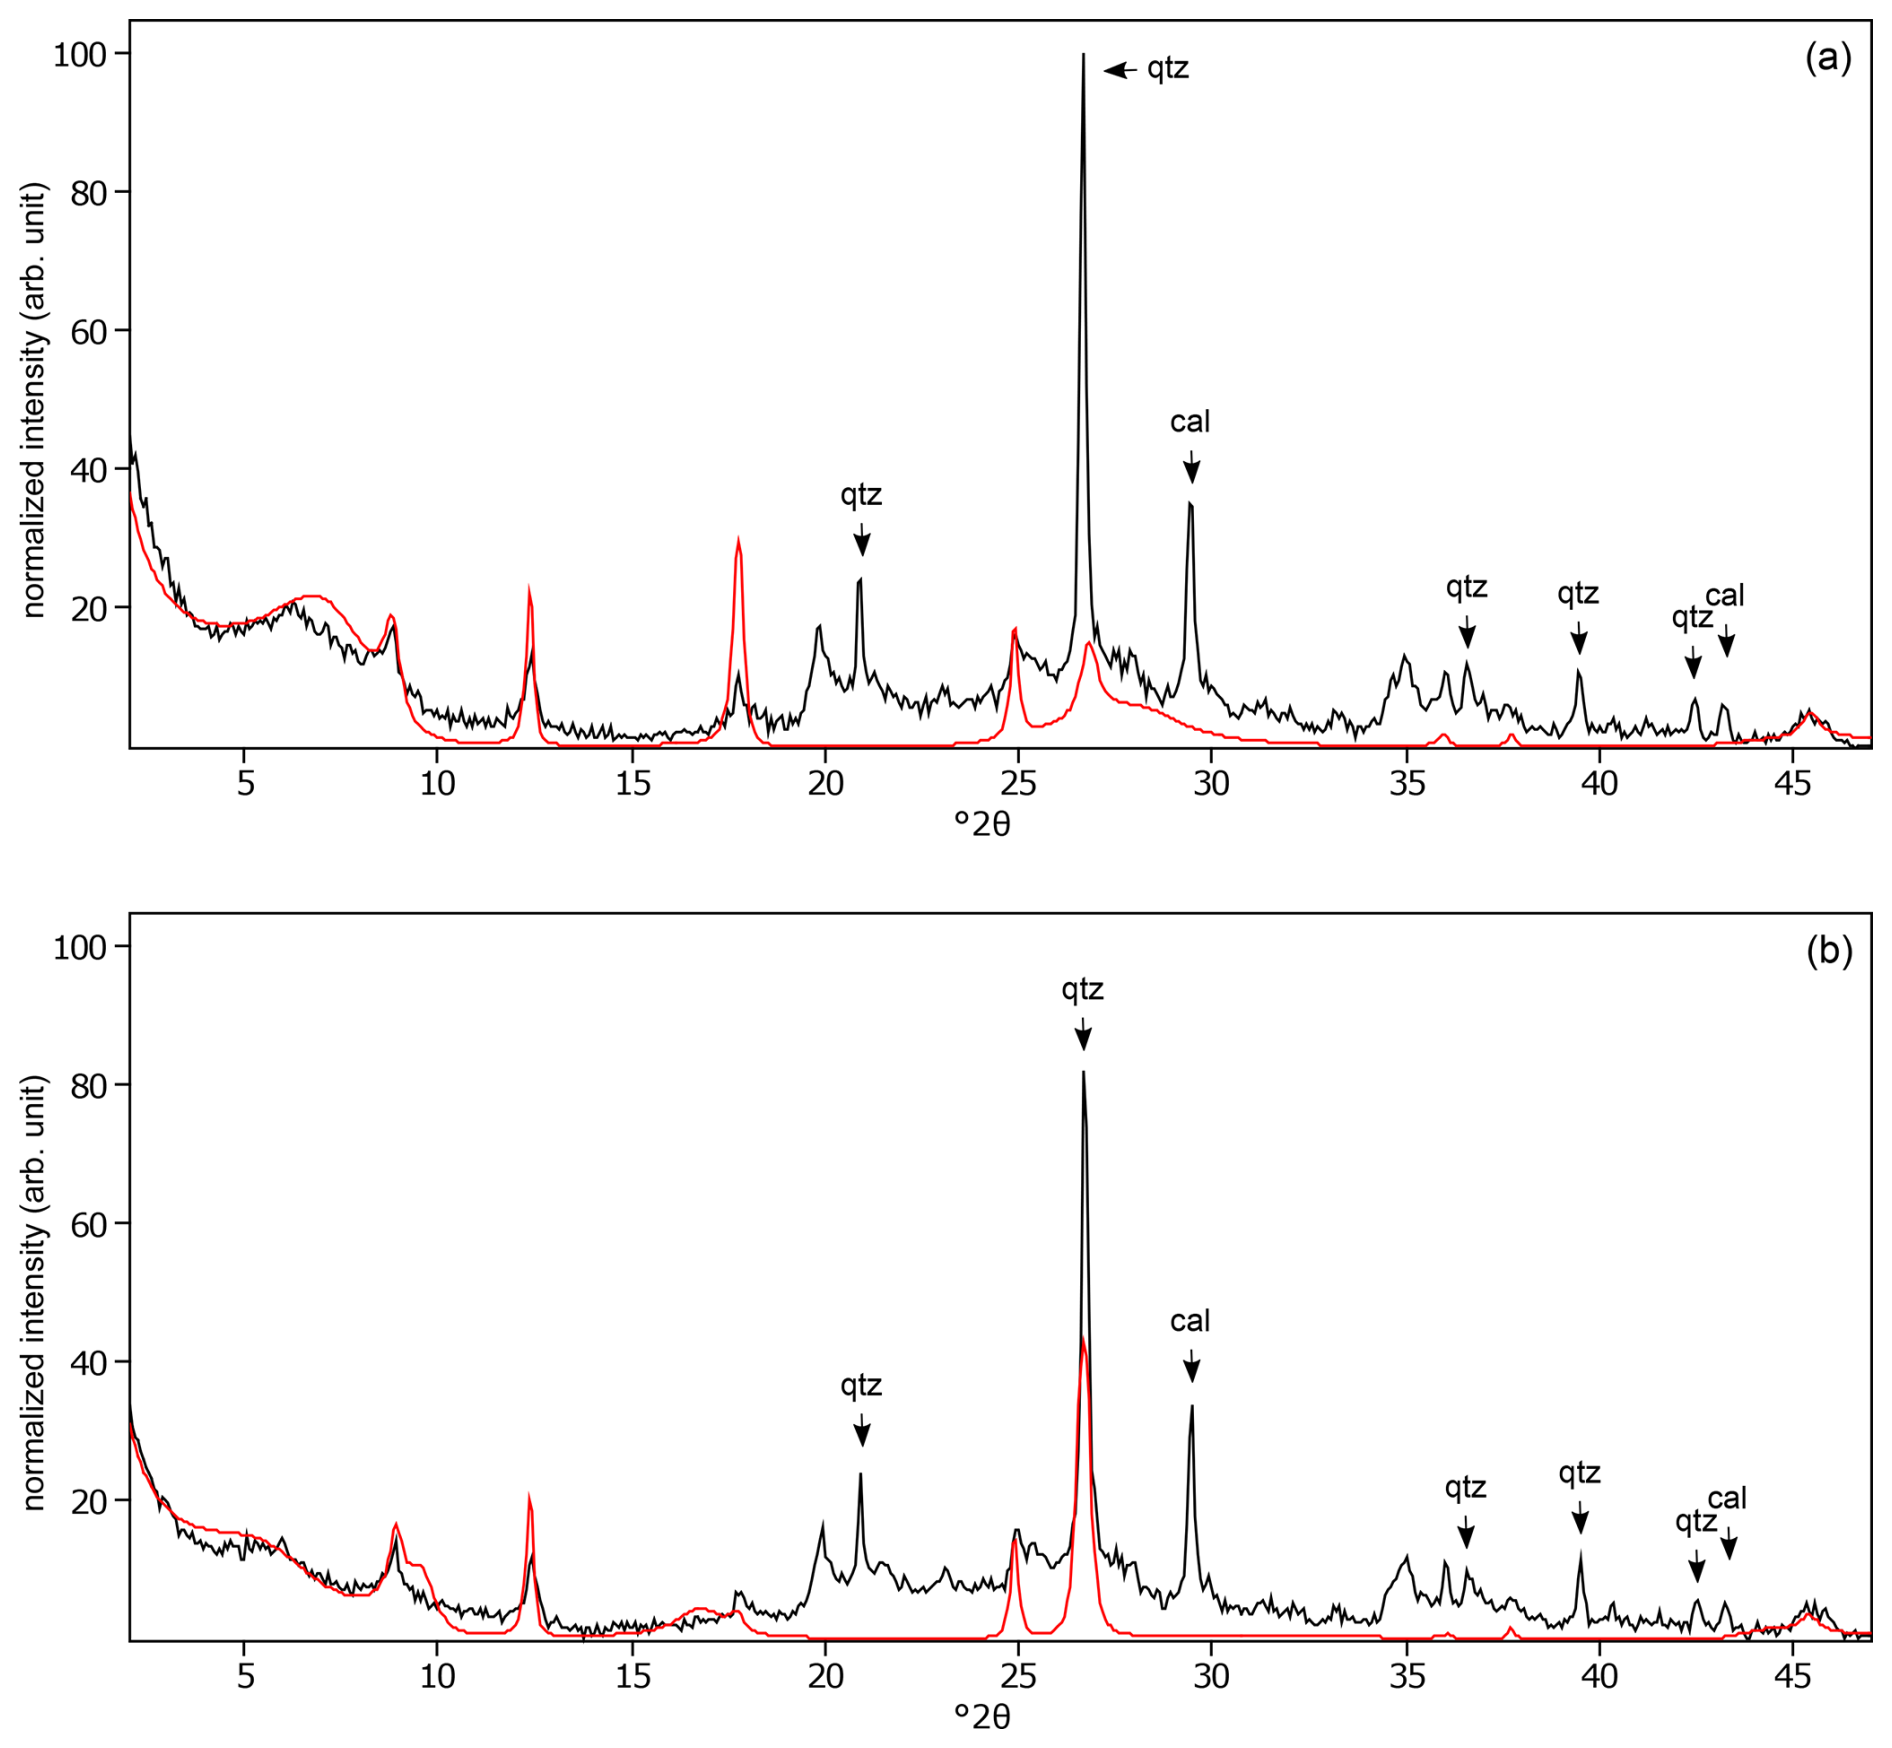
Figure C12The oriented clay fraction of soil from Rots (France). (a) Experimental XRD patterns in air-dried, Ca-saturated state (black) and the modeled pattern (red) of 9 % kaolinite, 26 % randomly interstratified illite–smectite (95:5), and 65 % randomly interstratified illite–smectite (68:32). (b) Experimental XRD patterns in ethylene-glycol-solvated, Ca-saturated state (black) and the modeled pattern (red) of 9 % kaolinite, 19 % randomly interstratified illite–smectite (95:5), and 72 % randomly interstratified illite–smectite (68:32). The arrows indicate quartz (qtz) and calcite (cal) peaks.
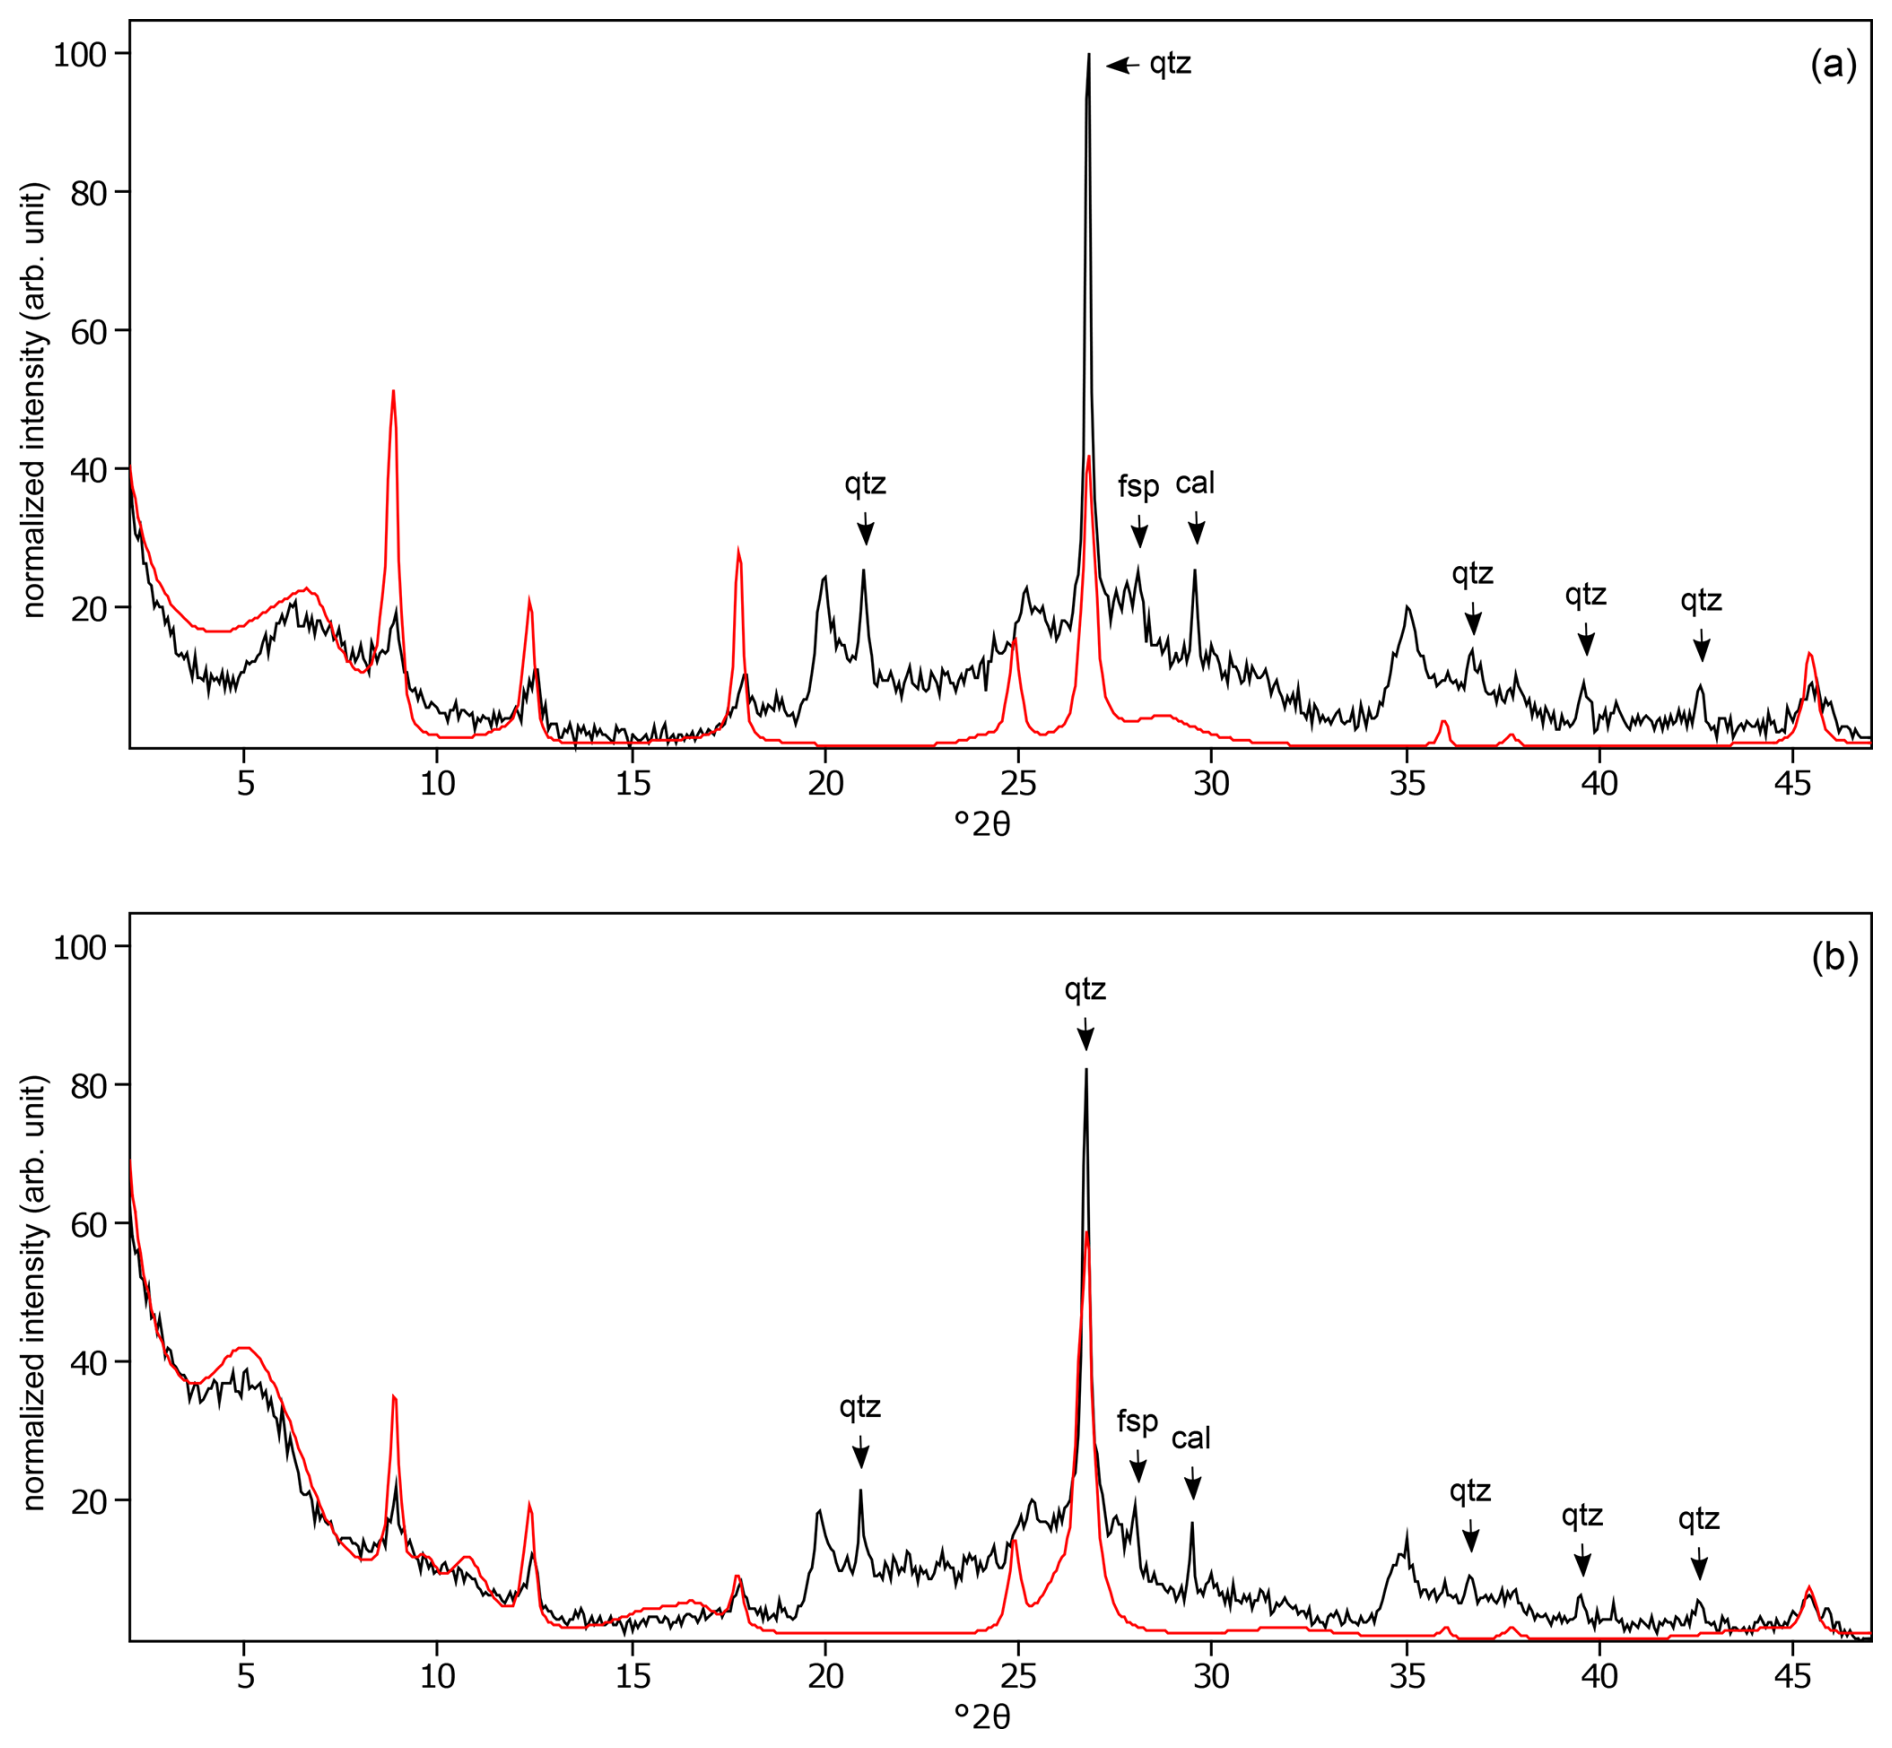
Figure C13The oriented clay fraction of soil from Changchun (China). (a) Experimental XRD patterns in air-dried, Ca-saturated state (black) and the modeled pattern (red) of 9 % kaolinite, 11 % randomly interstratified kaolinite–smectite (regular) (50:50), 11 % randomly interstratified illite–smectite (high charge) (), 60 % randomly interstratified illite–smectite (97:3), and 9 % randomly interstratified illite–smectite (63:37). (b) Experimental XRD patterns in ethylene-glycol-solvated, Ca-saturated state (black) and the modeled pattern (red) of 6 % kaolinite, 24 % randomly interstratified kaolinite–smectite (regular) (50:50), 17 % randomly interstratified illite–smectite (high charge) (), 22 % randomly interstratified illite–smectite (97:3), and 31 % randomly interstratified illite–smectite (63:37). The arrows indicate quartz (qtz), feldspar peak (fsp), and calcite (cal) peaks.
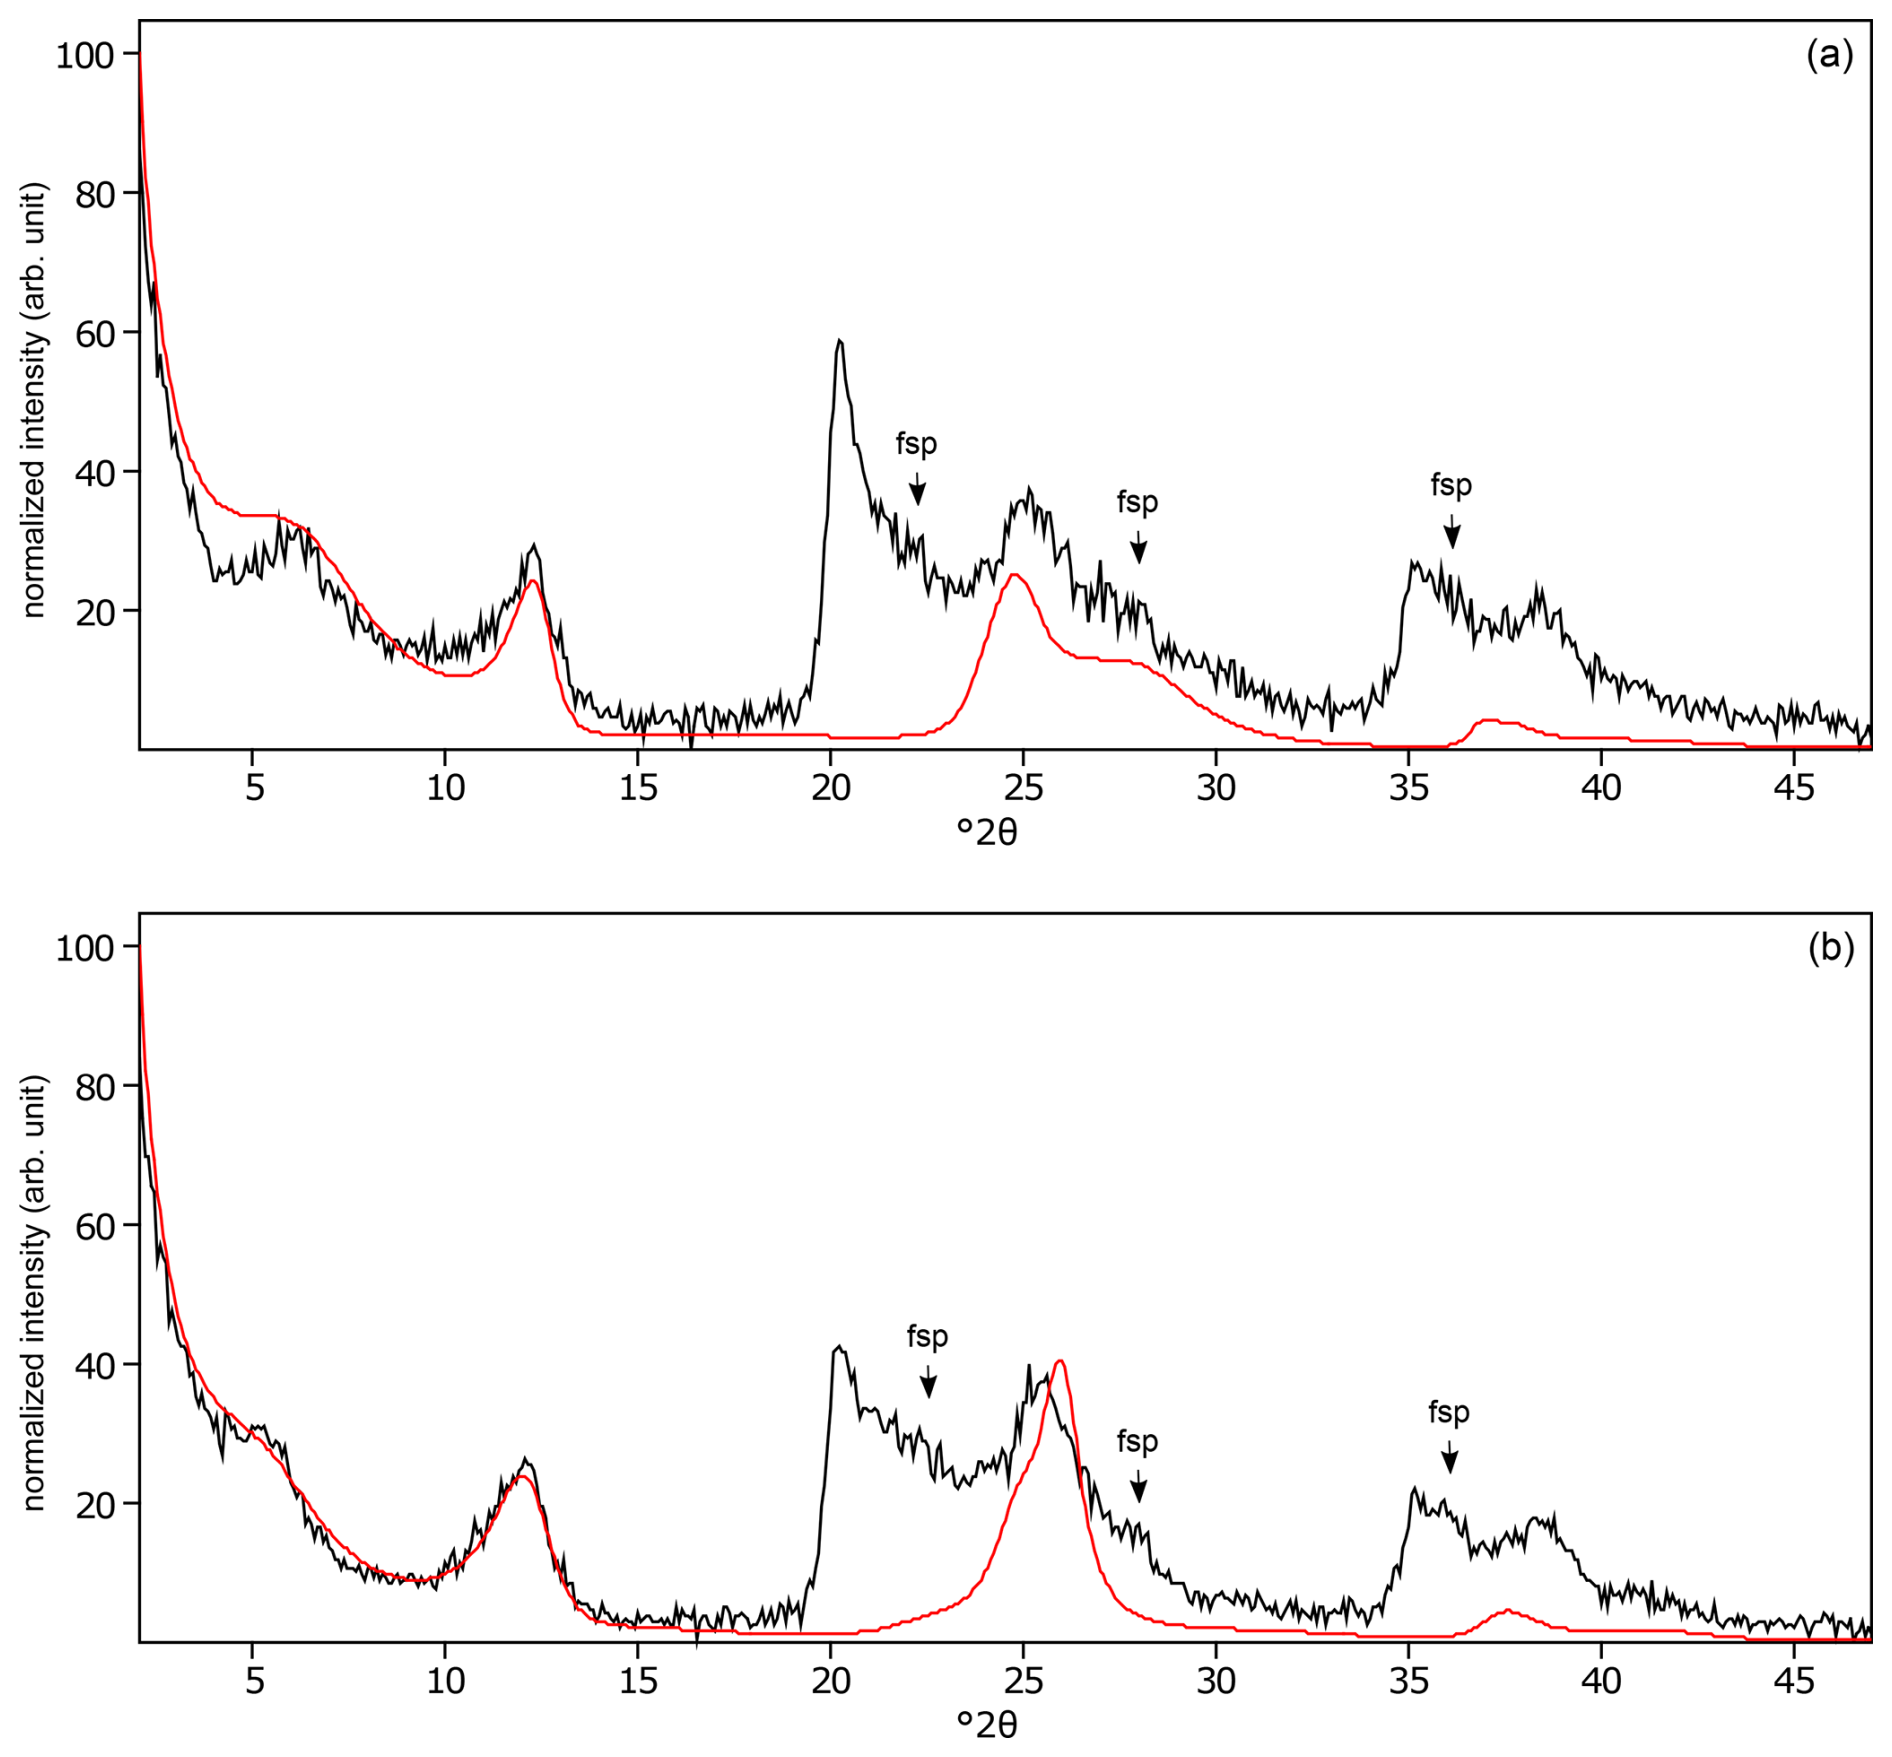
Figure C14The oriented clay fraction of soil from Pagsanjan (Philippines 3). (a) Experimental XRD patterns in air-dried, Ca-saturated state (black) and the modeled pattern (red) of 10 % kaolinite and 90 % randomly interstratified kaolinite–smectite (high charge) (). (b) Experimental XRD patterns in ethylene-glycol-solvated, Ca-saturated state (black) and the modeled pattern (red) of 10 % kaolinite and 90 % randomly interstratified kaolinite–smectite (high charge) (). The arrows indicate feldspar (fsp) peaks.
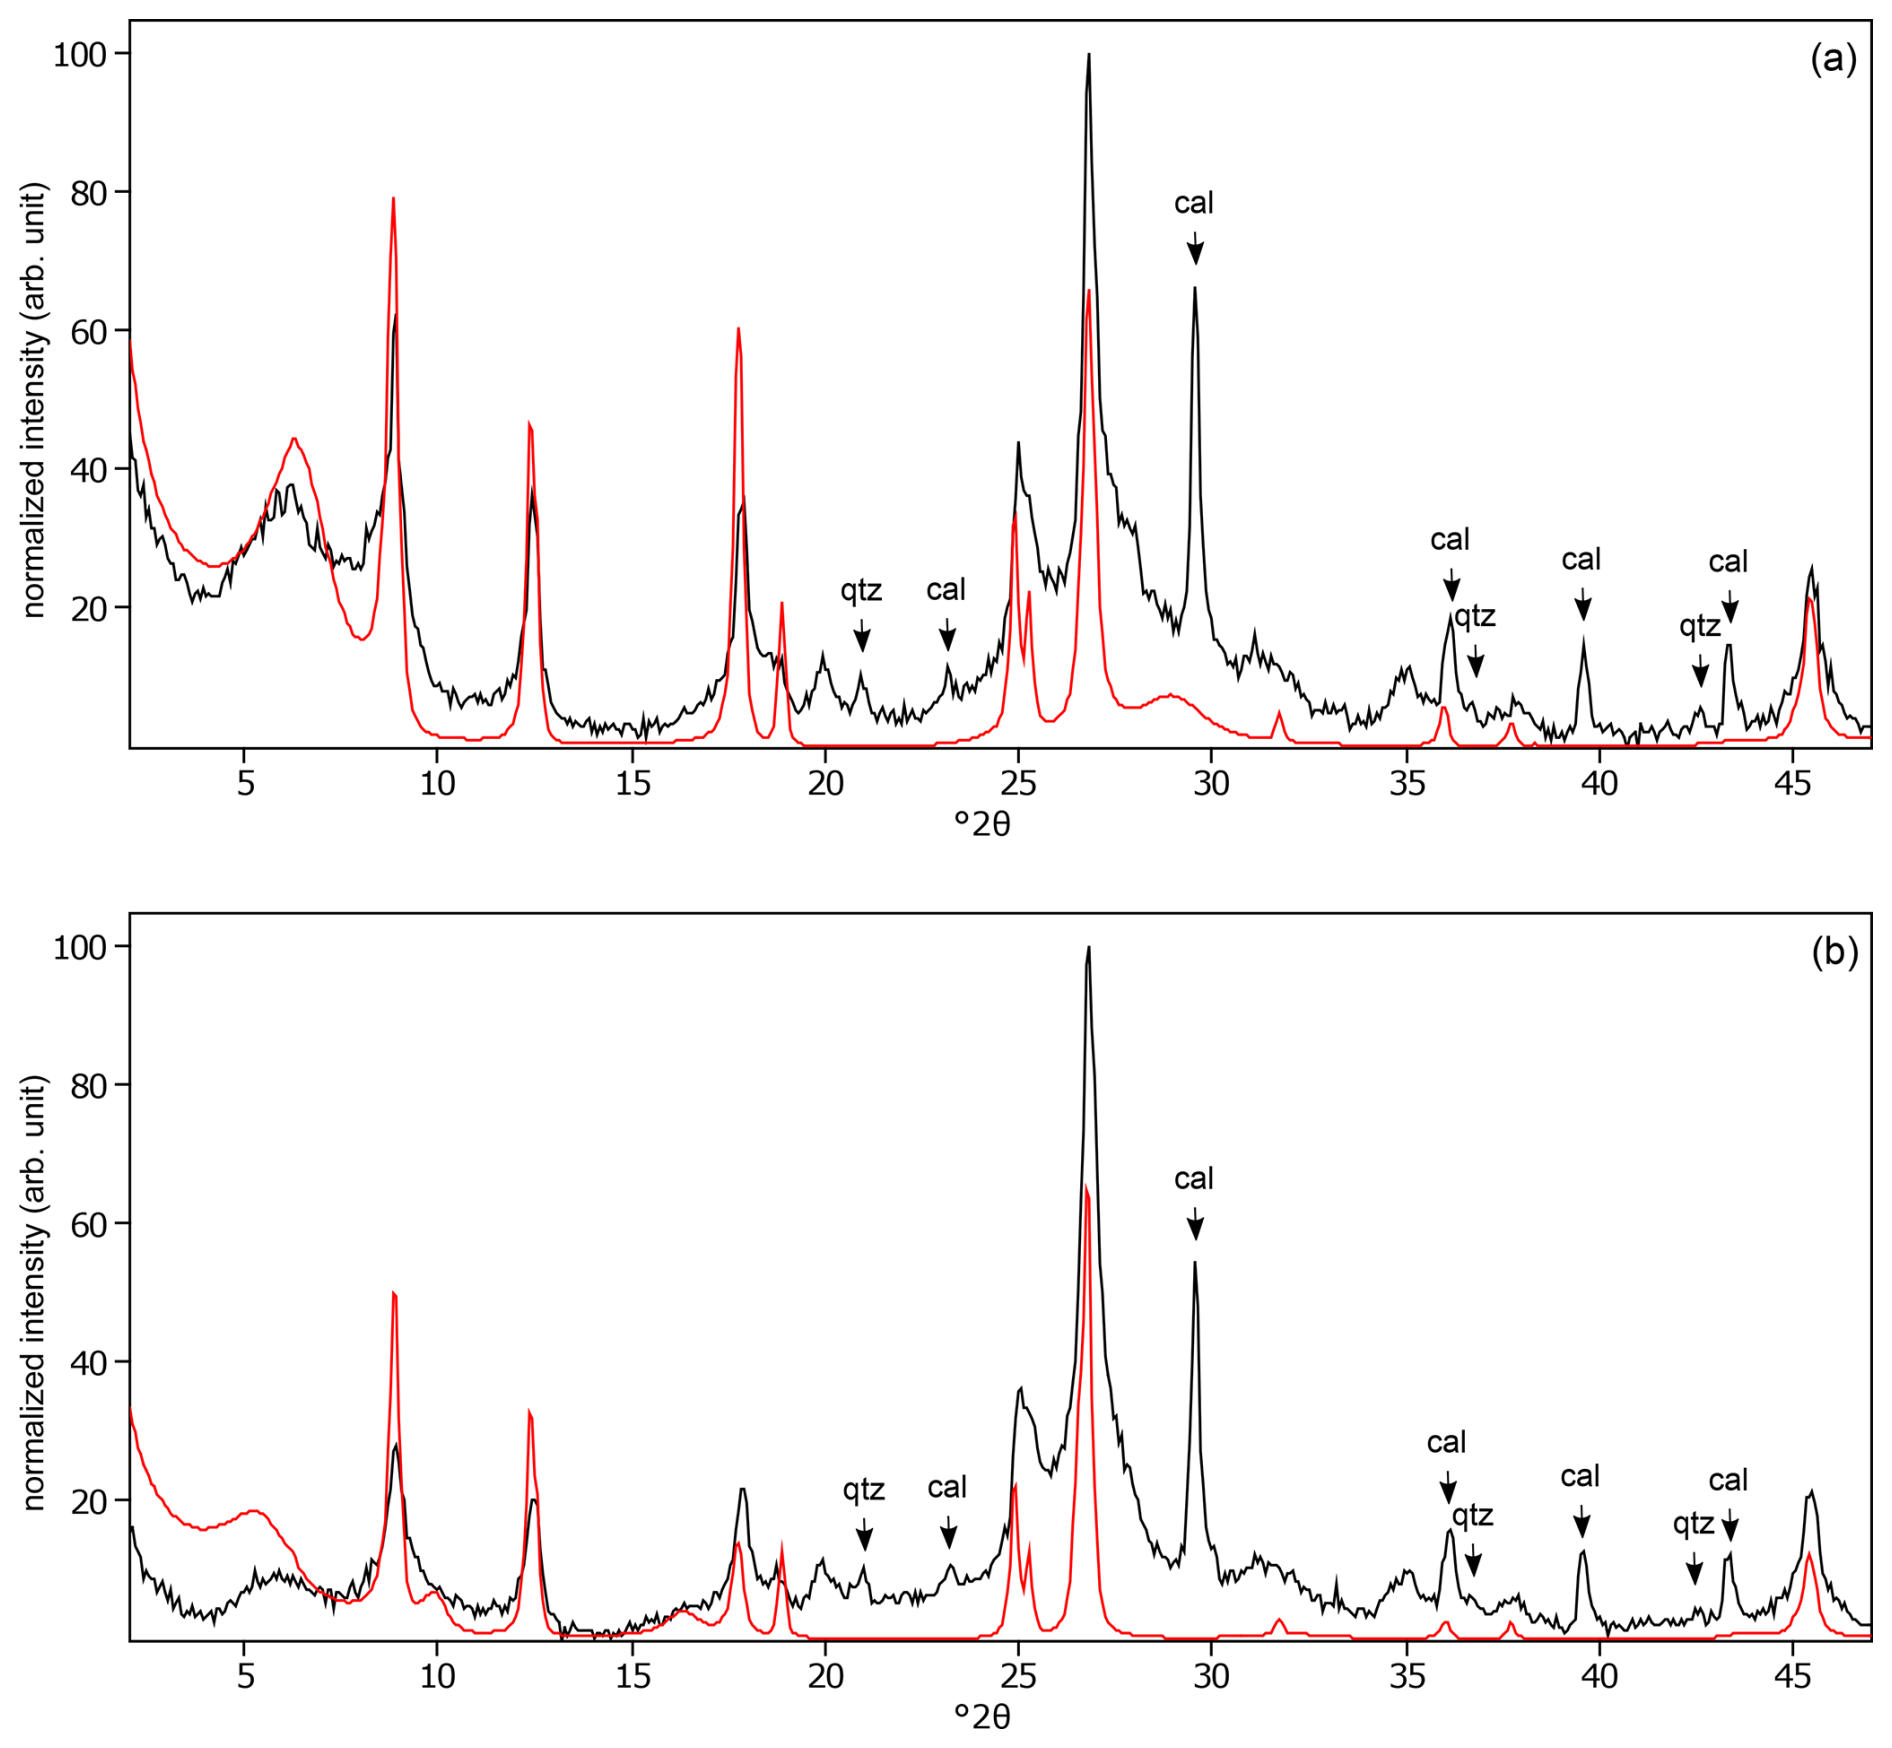
Figure C15The oriented clay fraction of soil from Isla Mayor (Spain). (a) Experimental XRD patterns in air-dried, Ca-saturated state (black) and the modeled pattern (red) of 9 % kaolinite, 54 % randomly interstratified illite–smectite (97:3), 31 % randomly interstratified illite–smectite (50:50), and 6 % chlorite. (b) Experimental XRD patterns in ethylene-glycol-solvated, Ca-saturated state (black) and the modeled pattern (red) of 10 % kaolinite, 51 % randomly interstratified illite–smectite (97:3), 33 % randomly interstratified illite–smectite (50:50), and 6 % chlorite. The arrows indicate quartz (qtz) and calcite (cal) peaks.
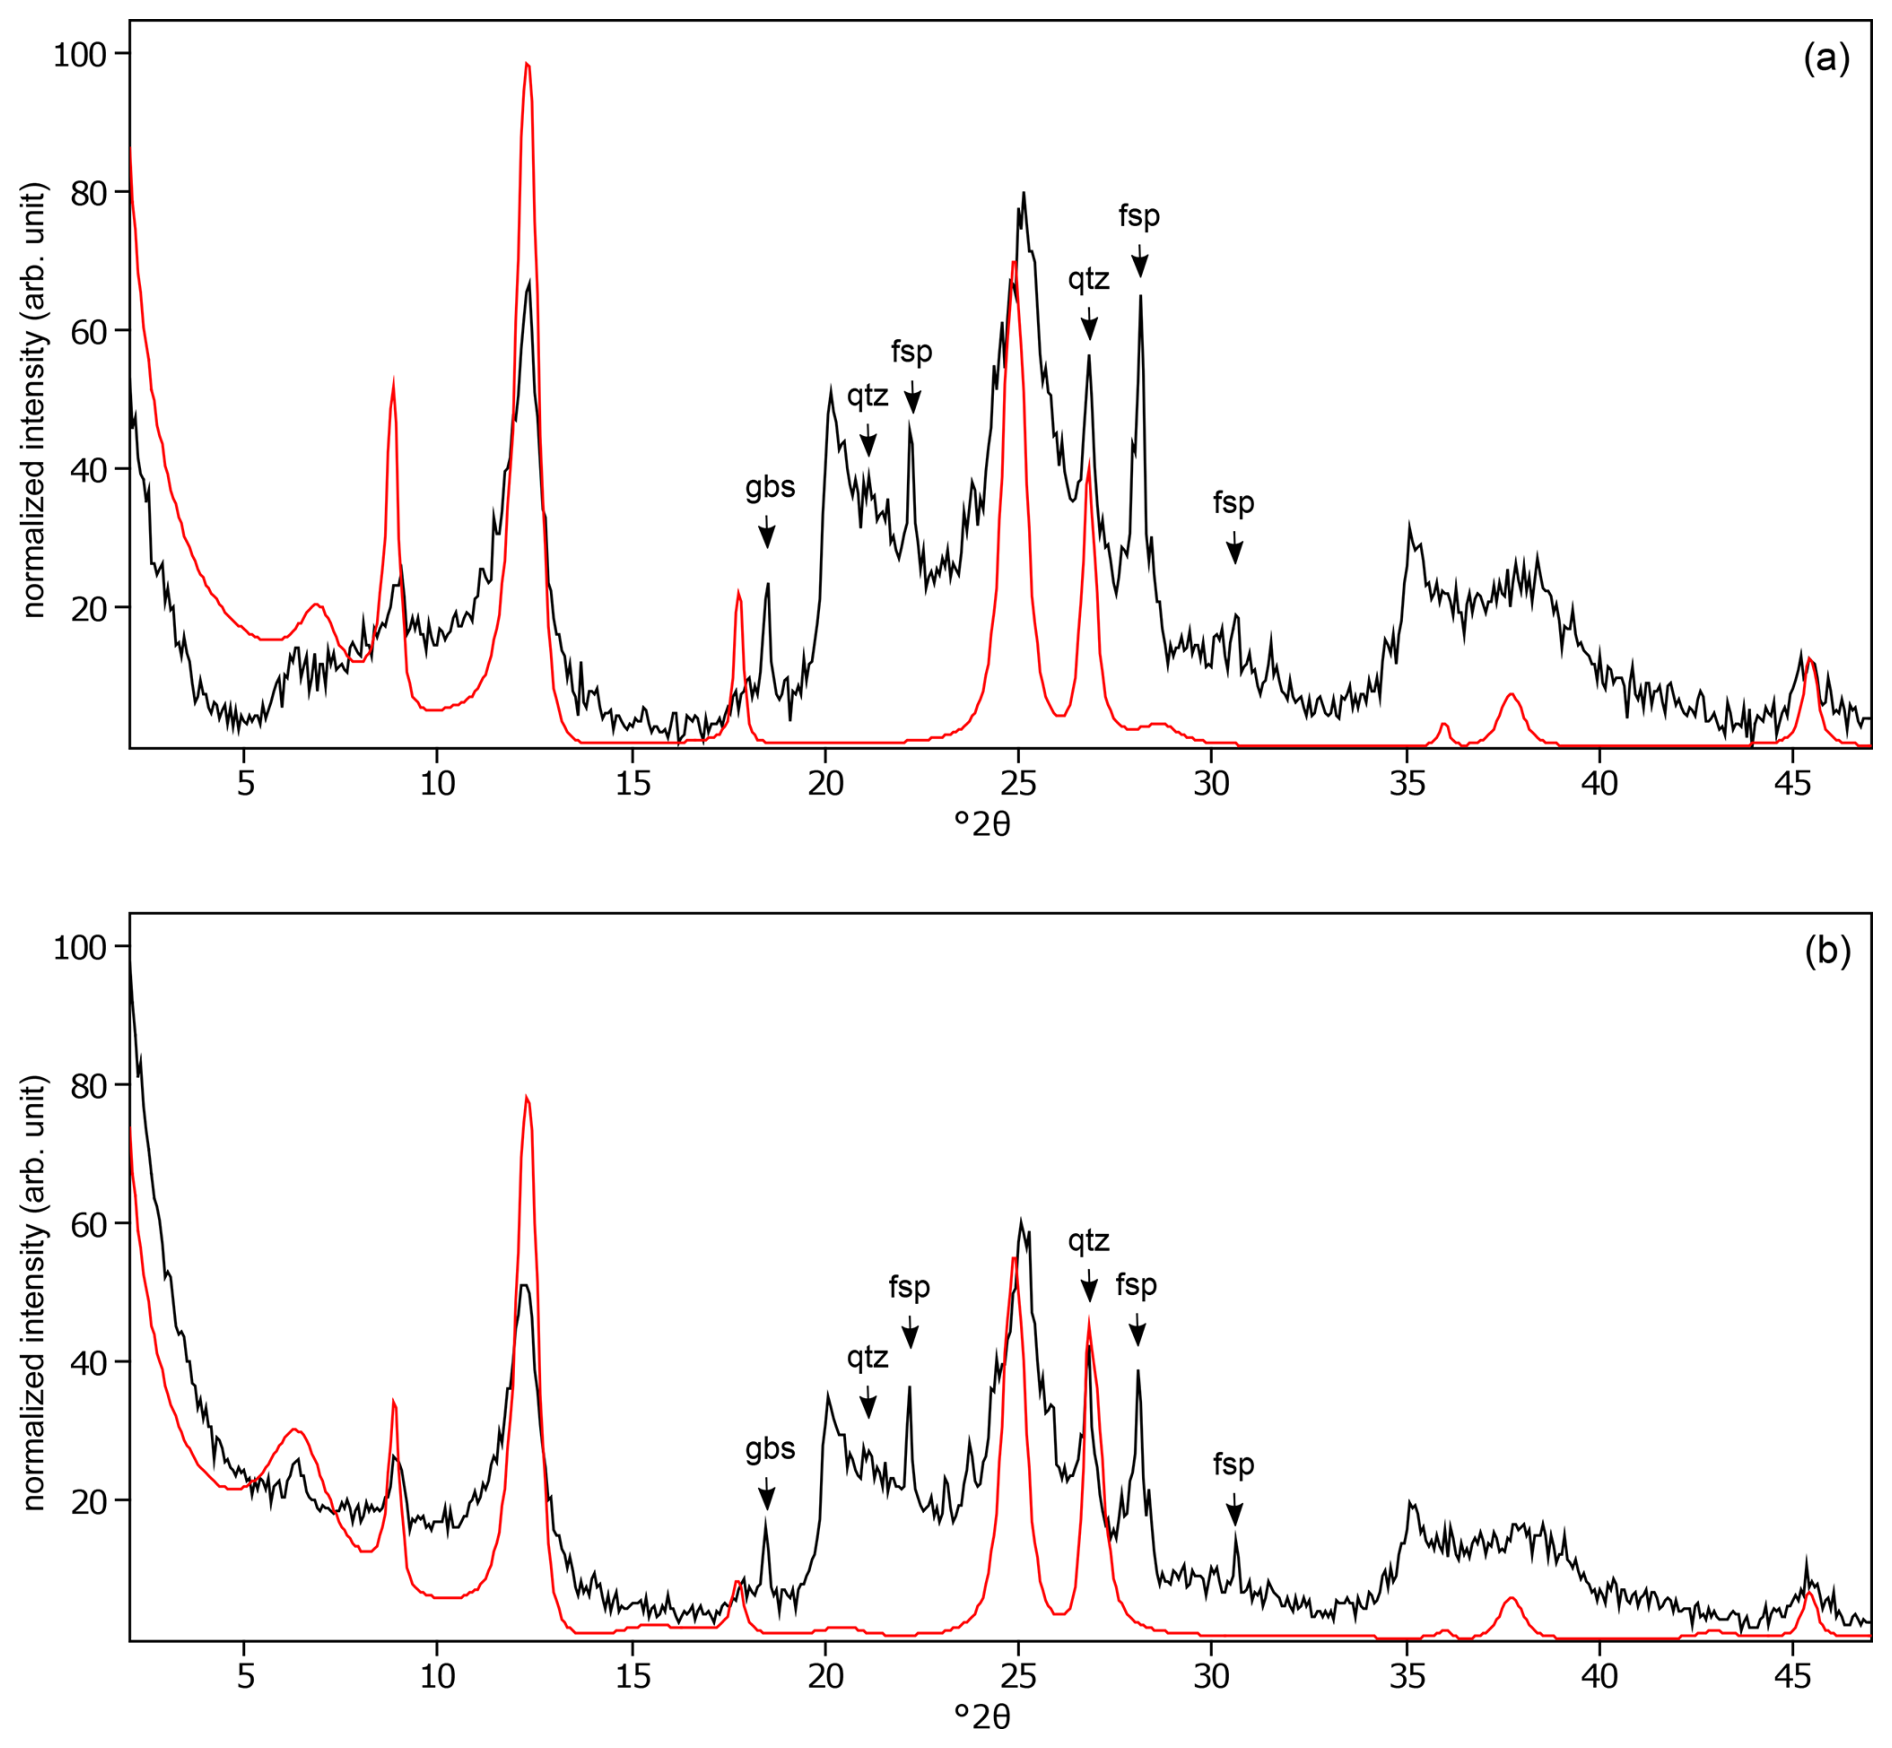
Figure C16The oriented clay fraction of soil from Yoshiki (Japan). (a) Experimental XRD patterns in air-dried, Ca-saturated state (black) and the modeled pattern (red) of 56 % kaolinite, 6 % randomly interstratified illite–smectite (high charge) (), and 38 % randomly interstratified illite–smectite (97:3). (b) Experimental XRD patterns in ethylene-glycol-solvated, Ca-saturated state (black) and the modeled pattern (red) of 48 % kaolinite, 31 % randomly interstratified illite–smectite (high charge) (), and 21 % randomly interstratified illite–smectite (97:3). The arrows indicate quartz (qtz), feldspar (fsp), and peak (gbs) peaks.
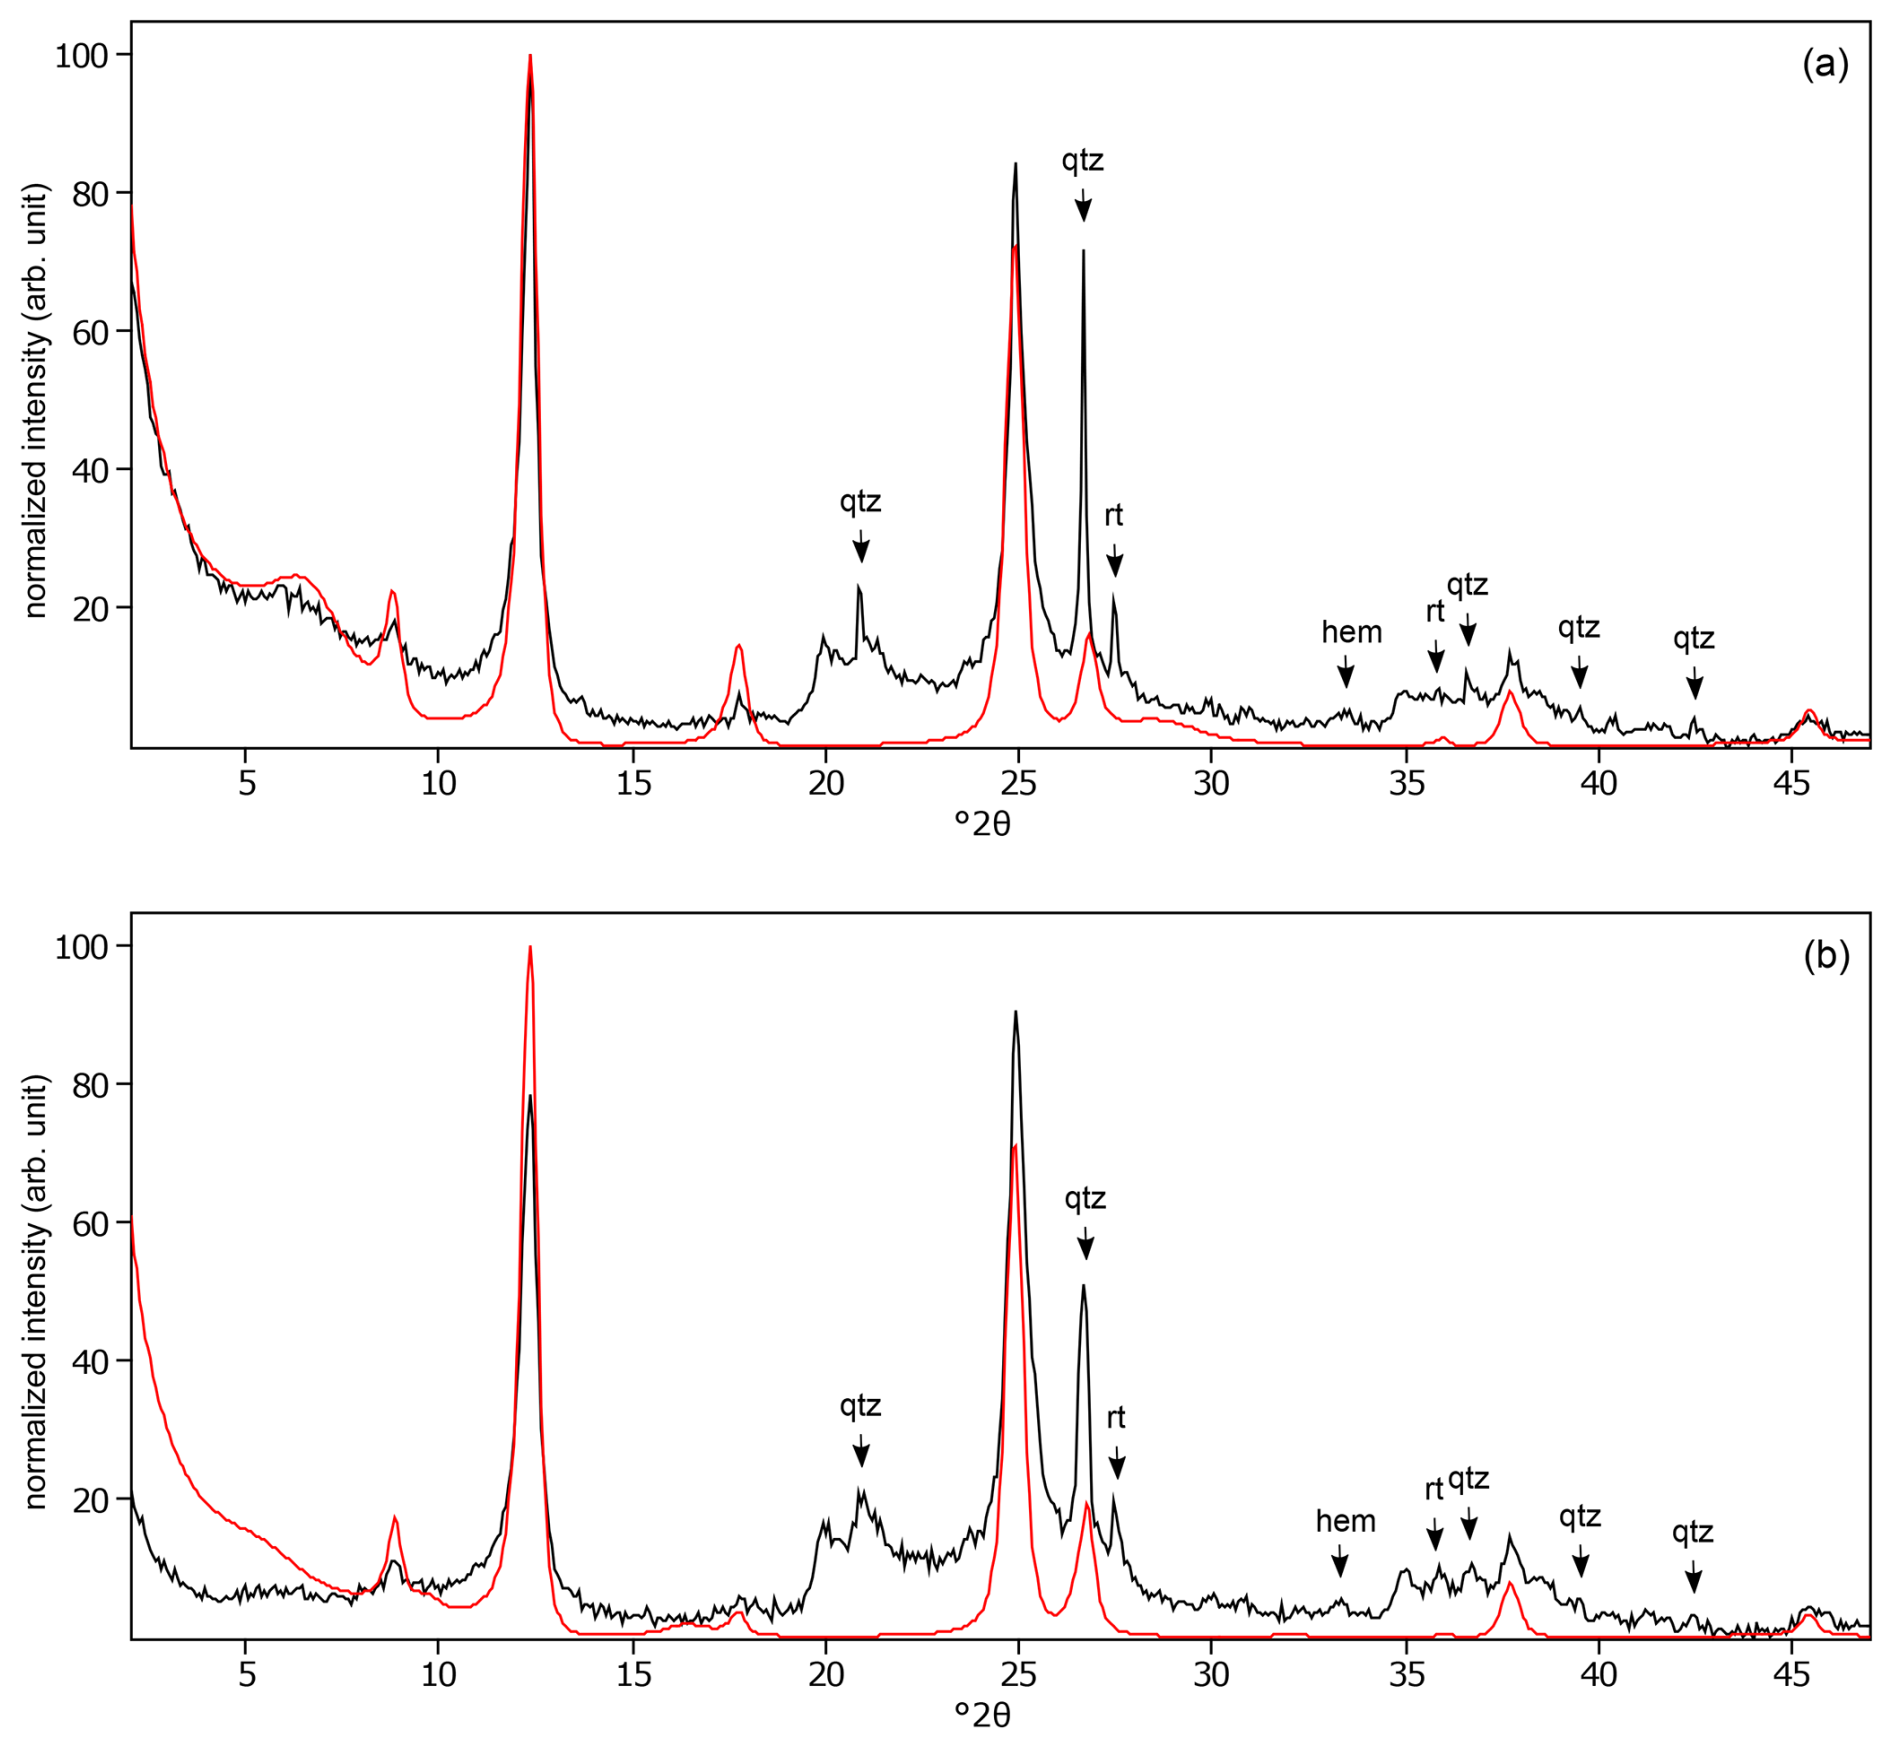
Figure C17The oriented clay fraction of soil from Kitale (Kenya 1). (a) Experimental XRD patterns in air-dried, Ca-saturated state (black) and the modeled pattern (red) of 53 % kaolinite, 19 % randomly interstratified illite–smectite (97:3), and 28 % randomly interstratified illite–smectite (60:40). (b) Experimental XRD patterns in ethylene-glycol-solvated, Ca-saturated state (black) and the modeled pattern (red) of 65 % kaolinite, 16 % randomly interstratified illite–smectite (97:3), and 19 % randomly interstratified illite–smectite (60:40). The arrows indicate quartz (qtz), rutile (rt), and hematite (hem) peaks.
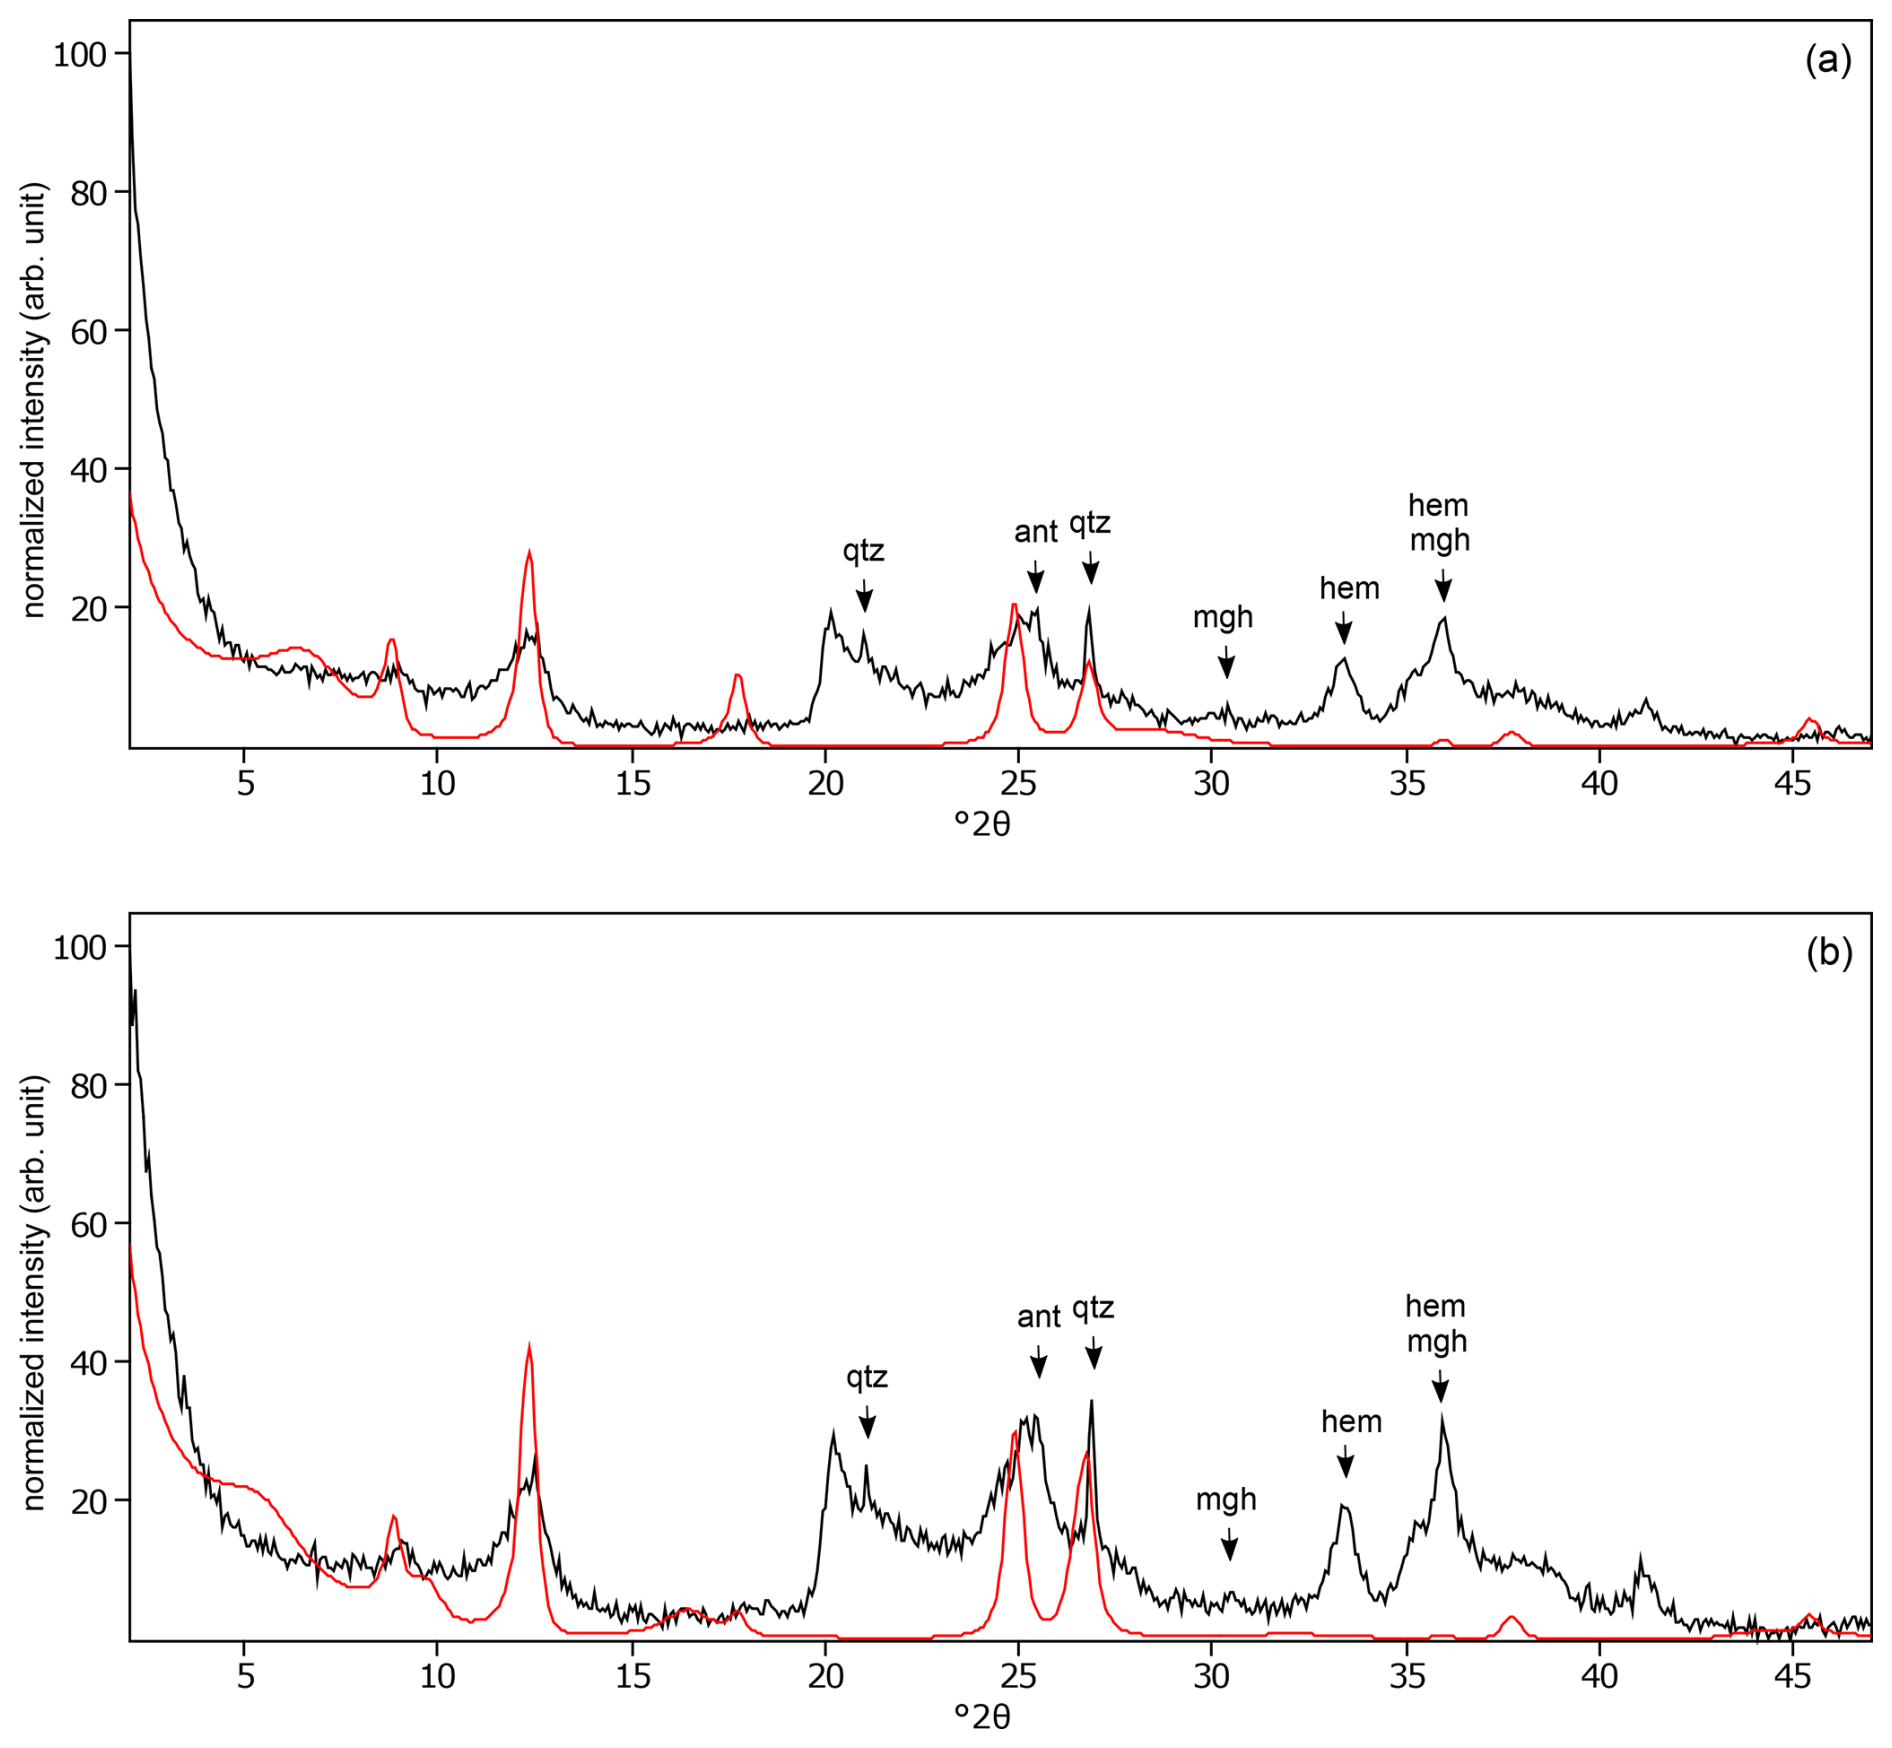
Figure C18The oriented clay fraction of soil from Mount Elgon (Kenya 4). (a) Experimental XRD patterns in air-dried, Ca-saturated state (black) and the modeled pattern (red) of 31 % kaolinite, 32 % randomly interstratified illite–smectite (97:3), and 37 % randomly interstratified illite–smectite (60:40). (b) Experimental XRD patterns in ethylene-glycol-solvated, Ca-saturated state (black) and the modeled pattern (red) of 32 % kaolinite, 17 % randomly interstratified illite–smectite (97:3), and 51 % randomly interstratified illite–smectite (60:40). The arrows indicate quartz (qtz), anatase (ant), maghemite (mgh), and hematite (hem) peaks.
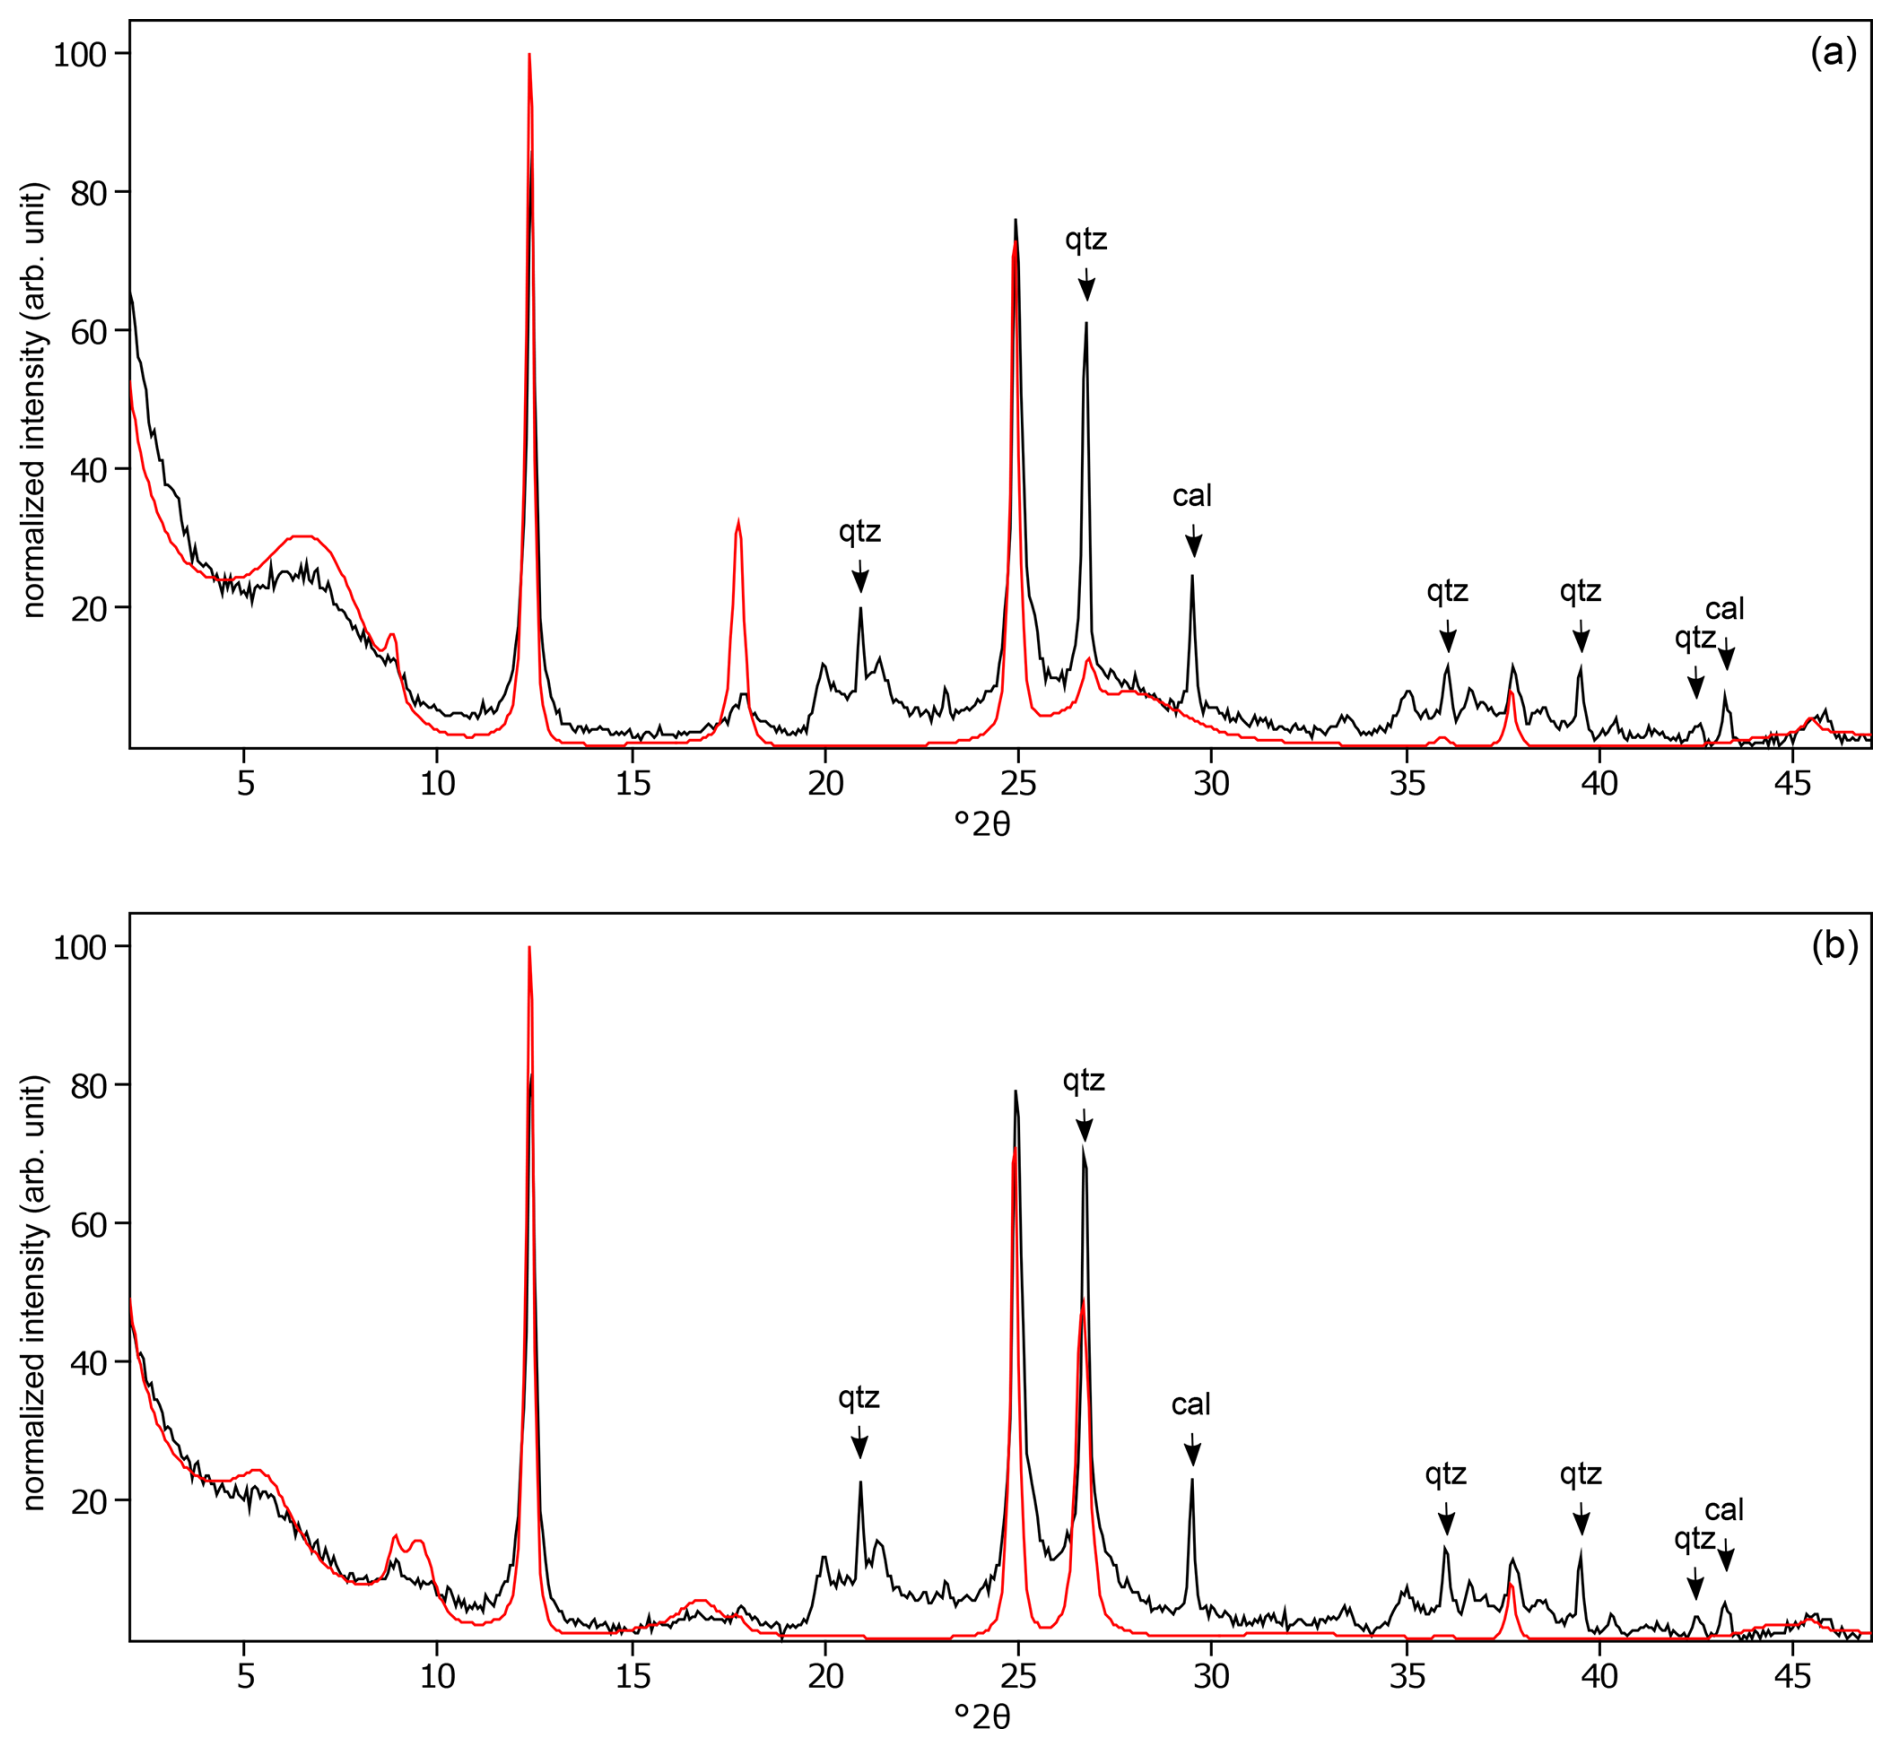
Figure C19The oriented clay fraction of soil from Aliminusa (Italy). (a) Experimental XRD patterns in air-dried, Ca-saturated state (black) and the modeled pattern (red) of 28 % kaolinite, 8 % randomly interstratified illite–smectite (97:3), 61 % randomly interstratified illite–smectite (68:32), and 3 % smectite. (b) experimental XRD patterns in ethylene-glycol-solvated, Ca-saturated state (black) and the modeled pattern (red) of 28 % kaolinite, 5 % randomly interstratified illite–smectite (97:3), 55 % randomly interstratified illite–smectite (68:32), and 12 % smectite. The arrows indicate quartz (qtz) and calcite (cal) peaks.
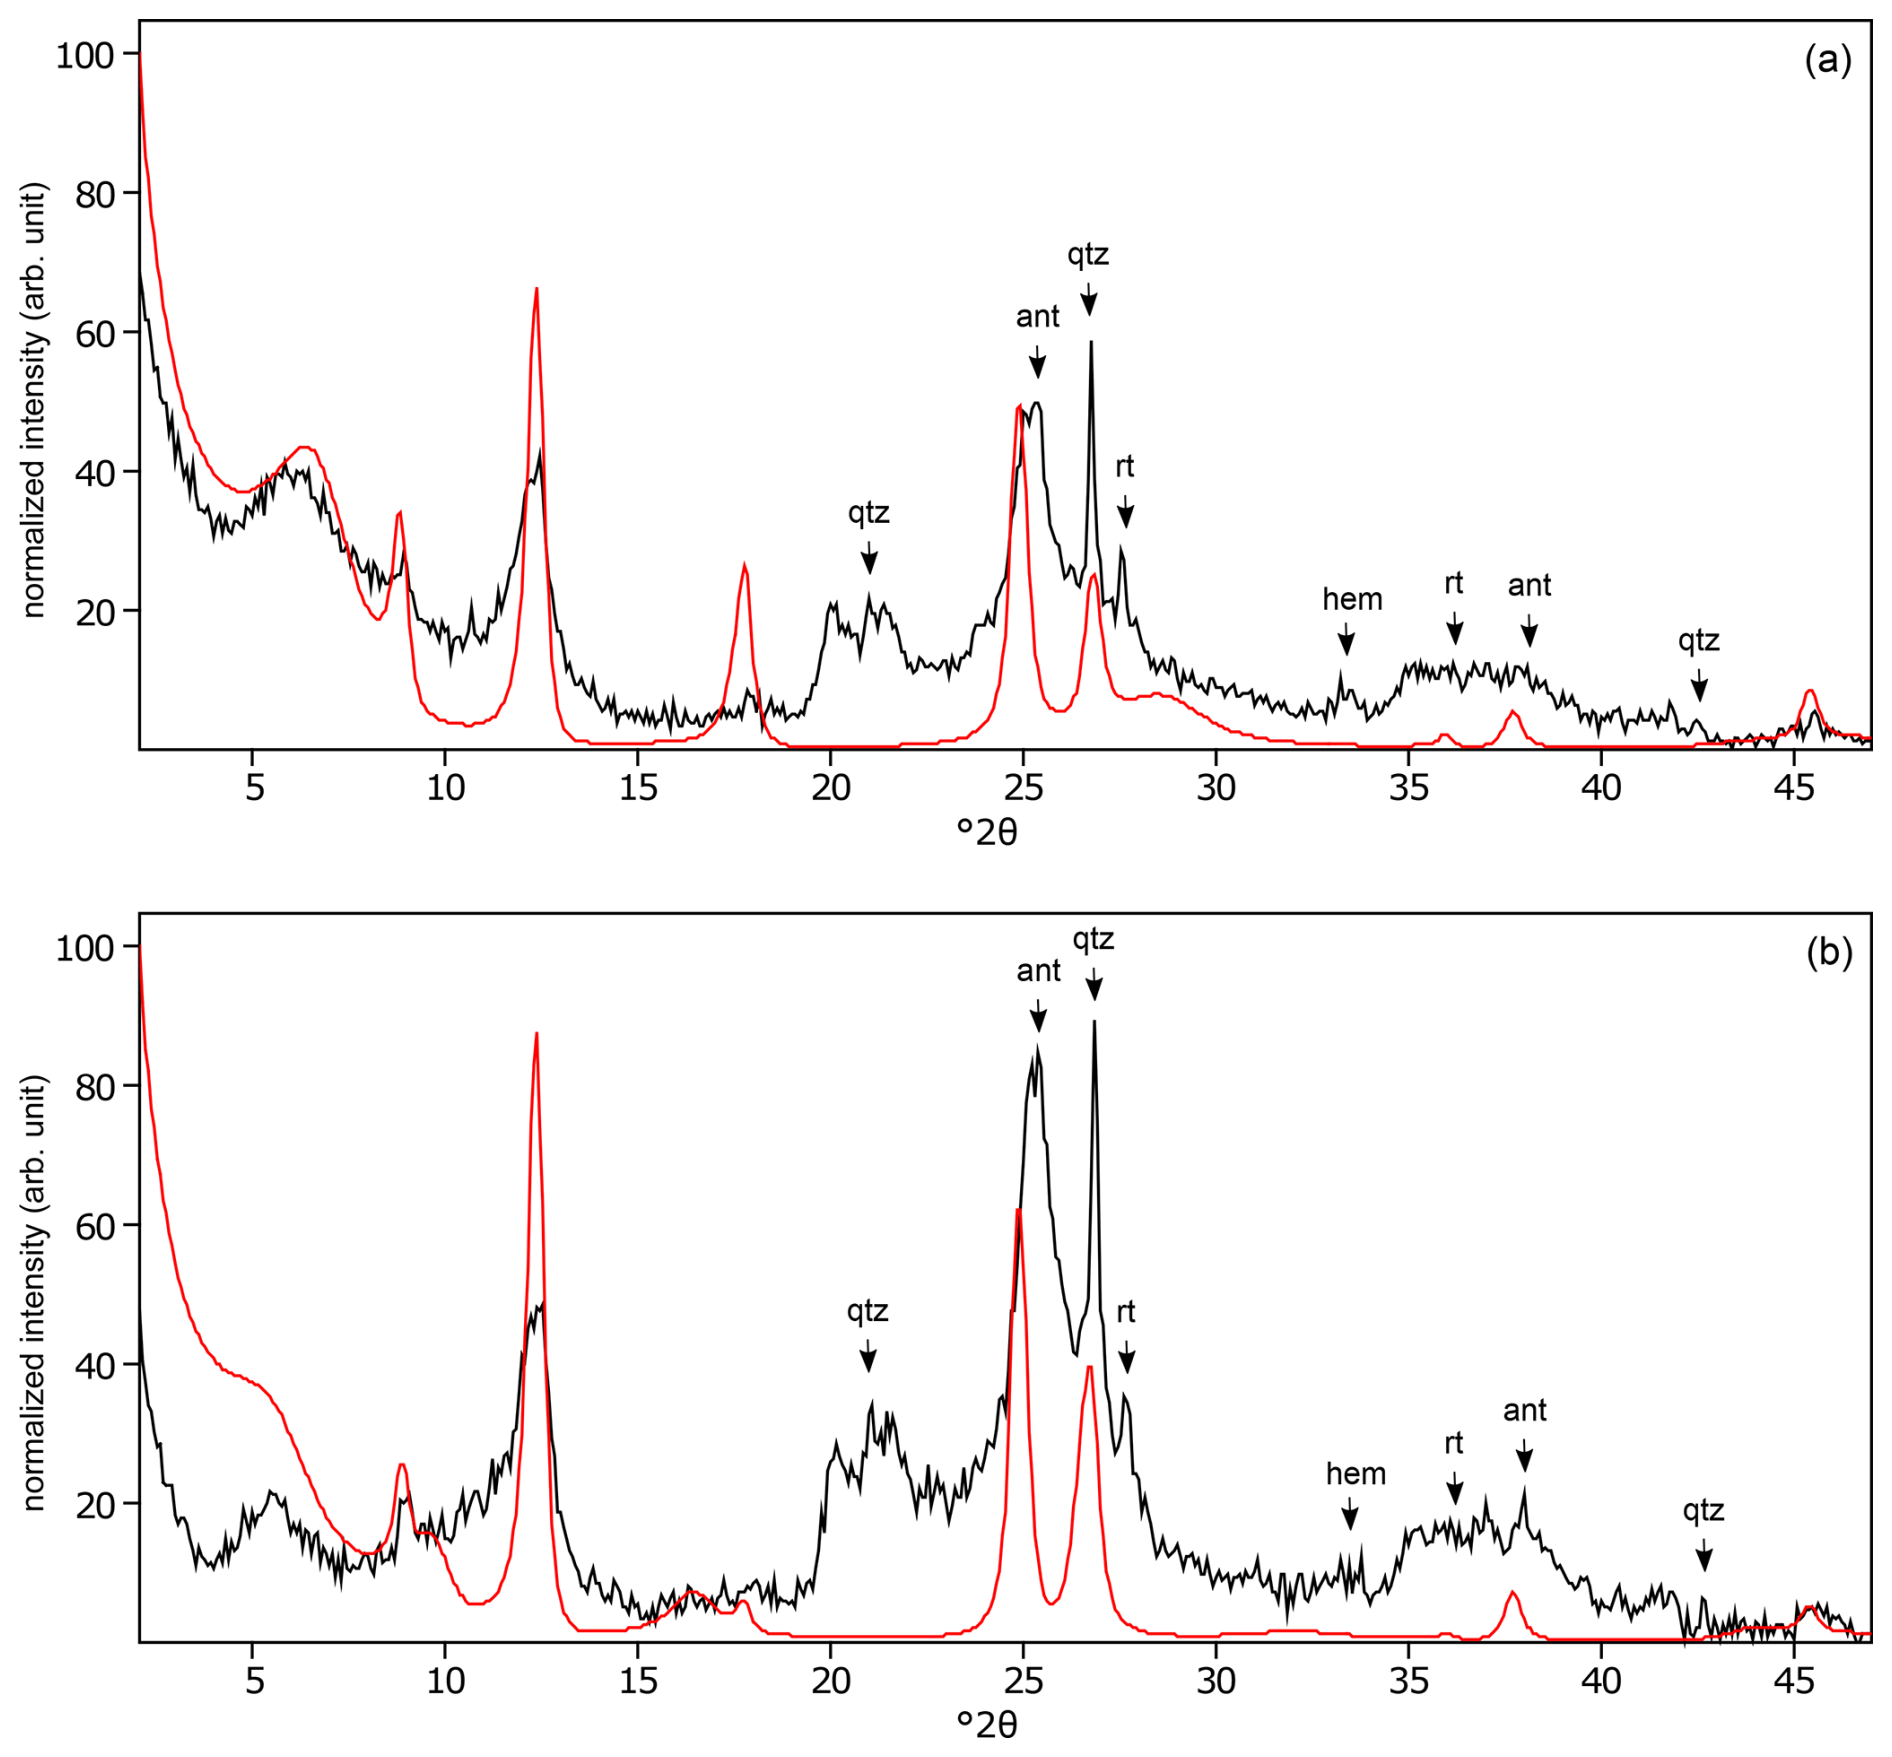
Figure C20The oriented clay fraction of soil from Endebess (Kenya). (a) Experimental XRD patterns in air-dried, Ca-saturated state (black) and the modeled pattern (red) of 29 % kaolinite, 25 % randomly interstratified illite–smectite (97:3), and 46 % randomly interstratified illite–smectite (60:40). (b) Experimental XRD patterns in ethylene-glycol-solvated, Ca-saturated state (black) and the modeled pattern (red) of 38 % kaolinite, 13 % randomly interstratified illite–smectite (97:3), and 49 % randomly interstratified illite–smectite (60:40). The arrows indicate quartz (qtz), anatase (ant), rutile (rt), and hematite (hem) peaks.
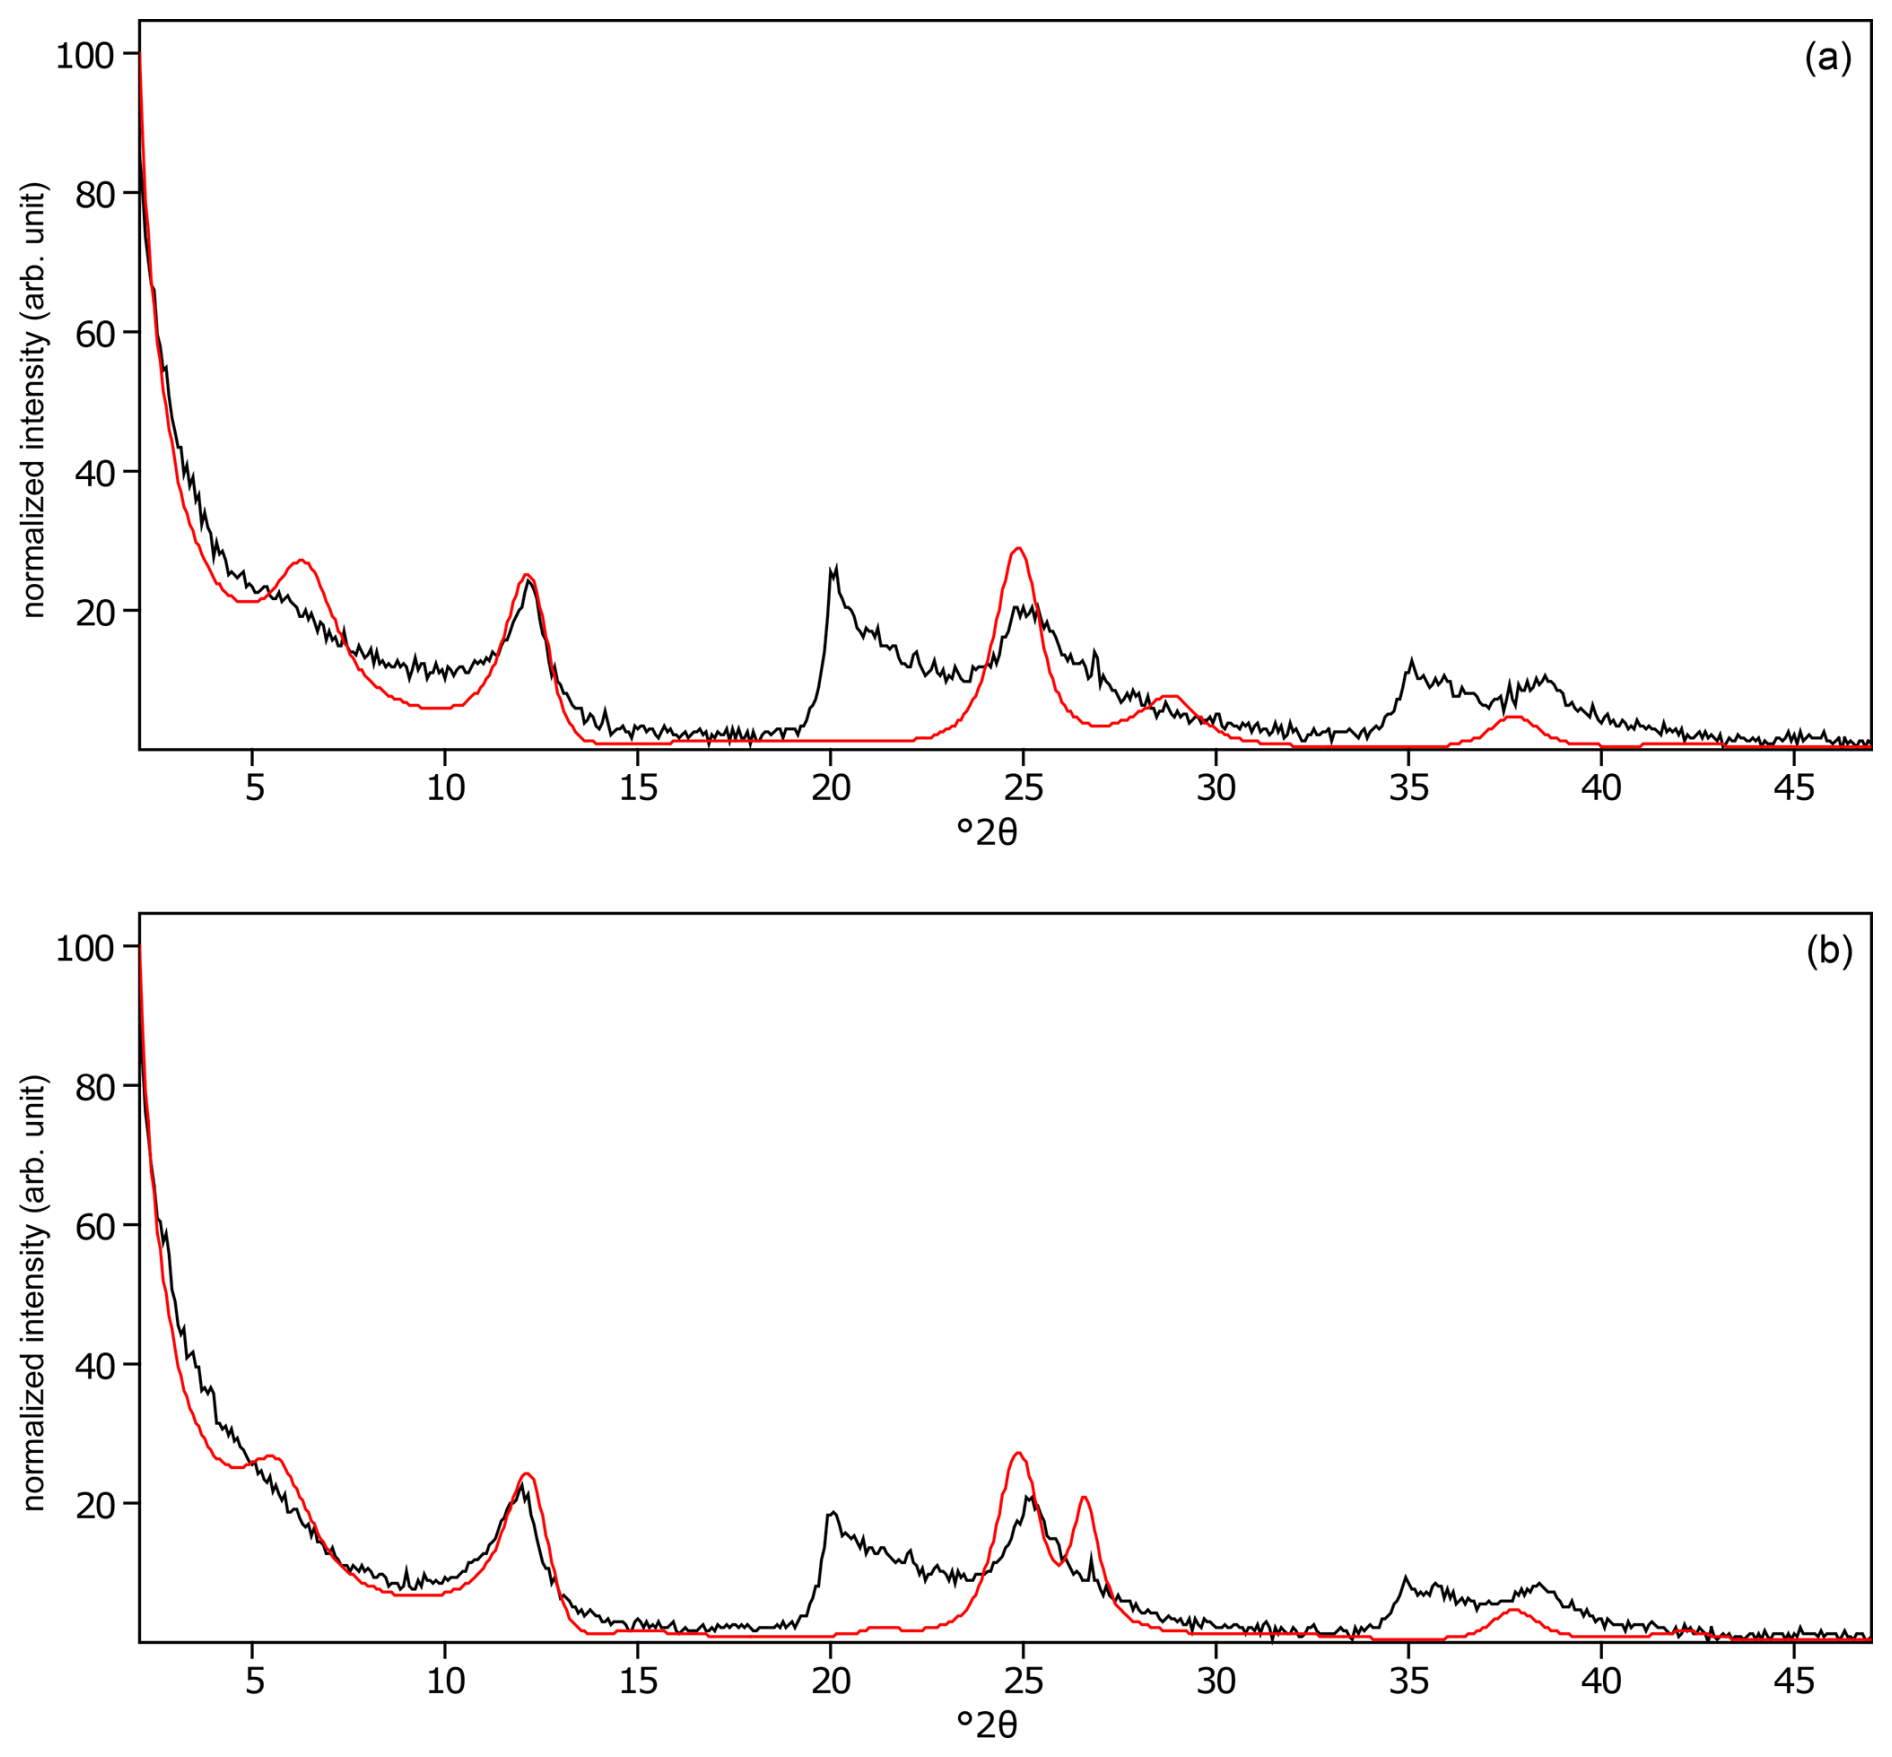
Figure C21The oriented clay fraction of soil from Pagsanjan (Philippines 4). (a) Experimental XRD patterns in air-dried, Ca-saturated state (black) and the modeled pattern (red) of 52 % kaolinite and 48 % randomly interstratified kaolinite–smectite (high charge) (). (b) Experimental XRD patterns in ethylene-glycol-solvated, Ca-saturated state (black) and the modeled pattern (red) of 41 % kaolinite and 59 % randomly interstratified kaolinite–smectite (high charge) ().
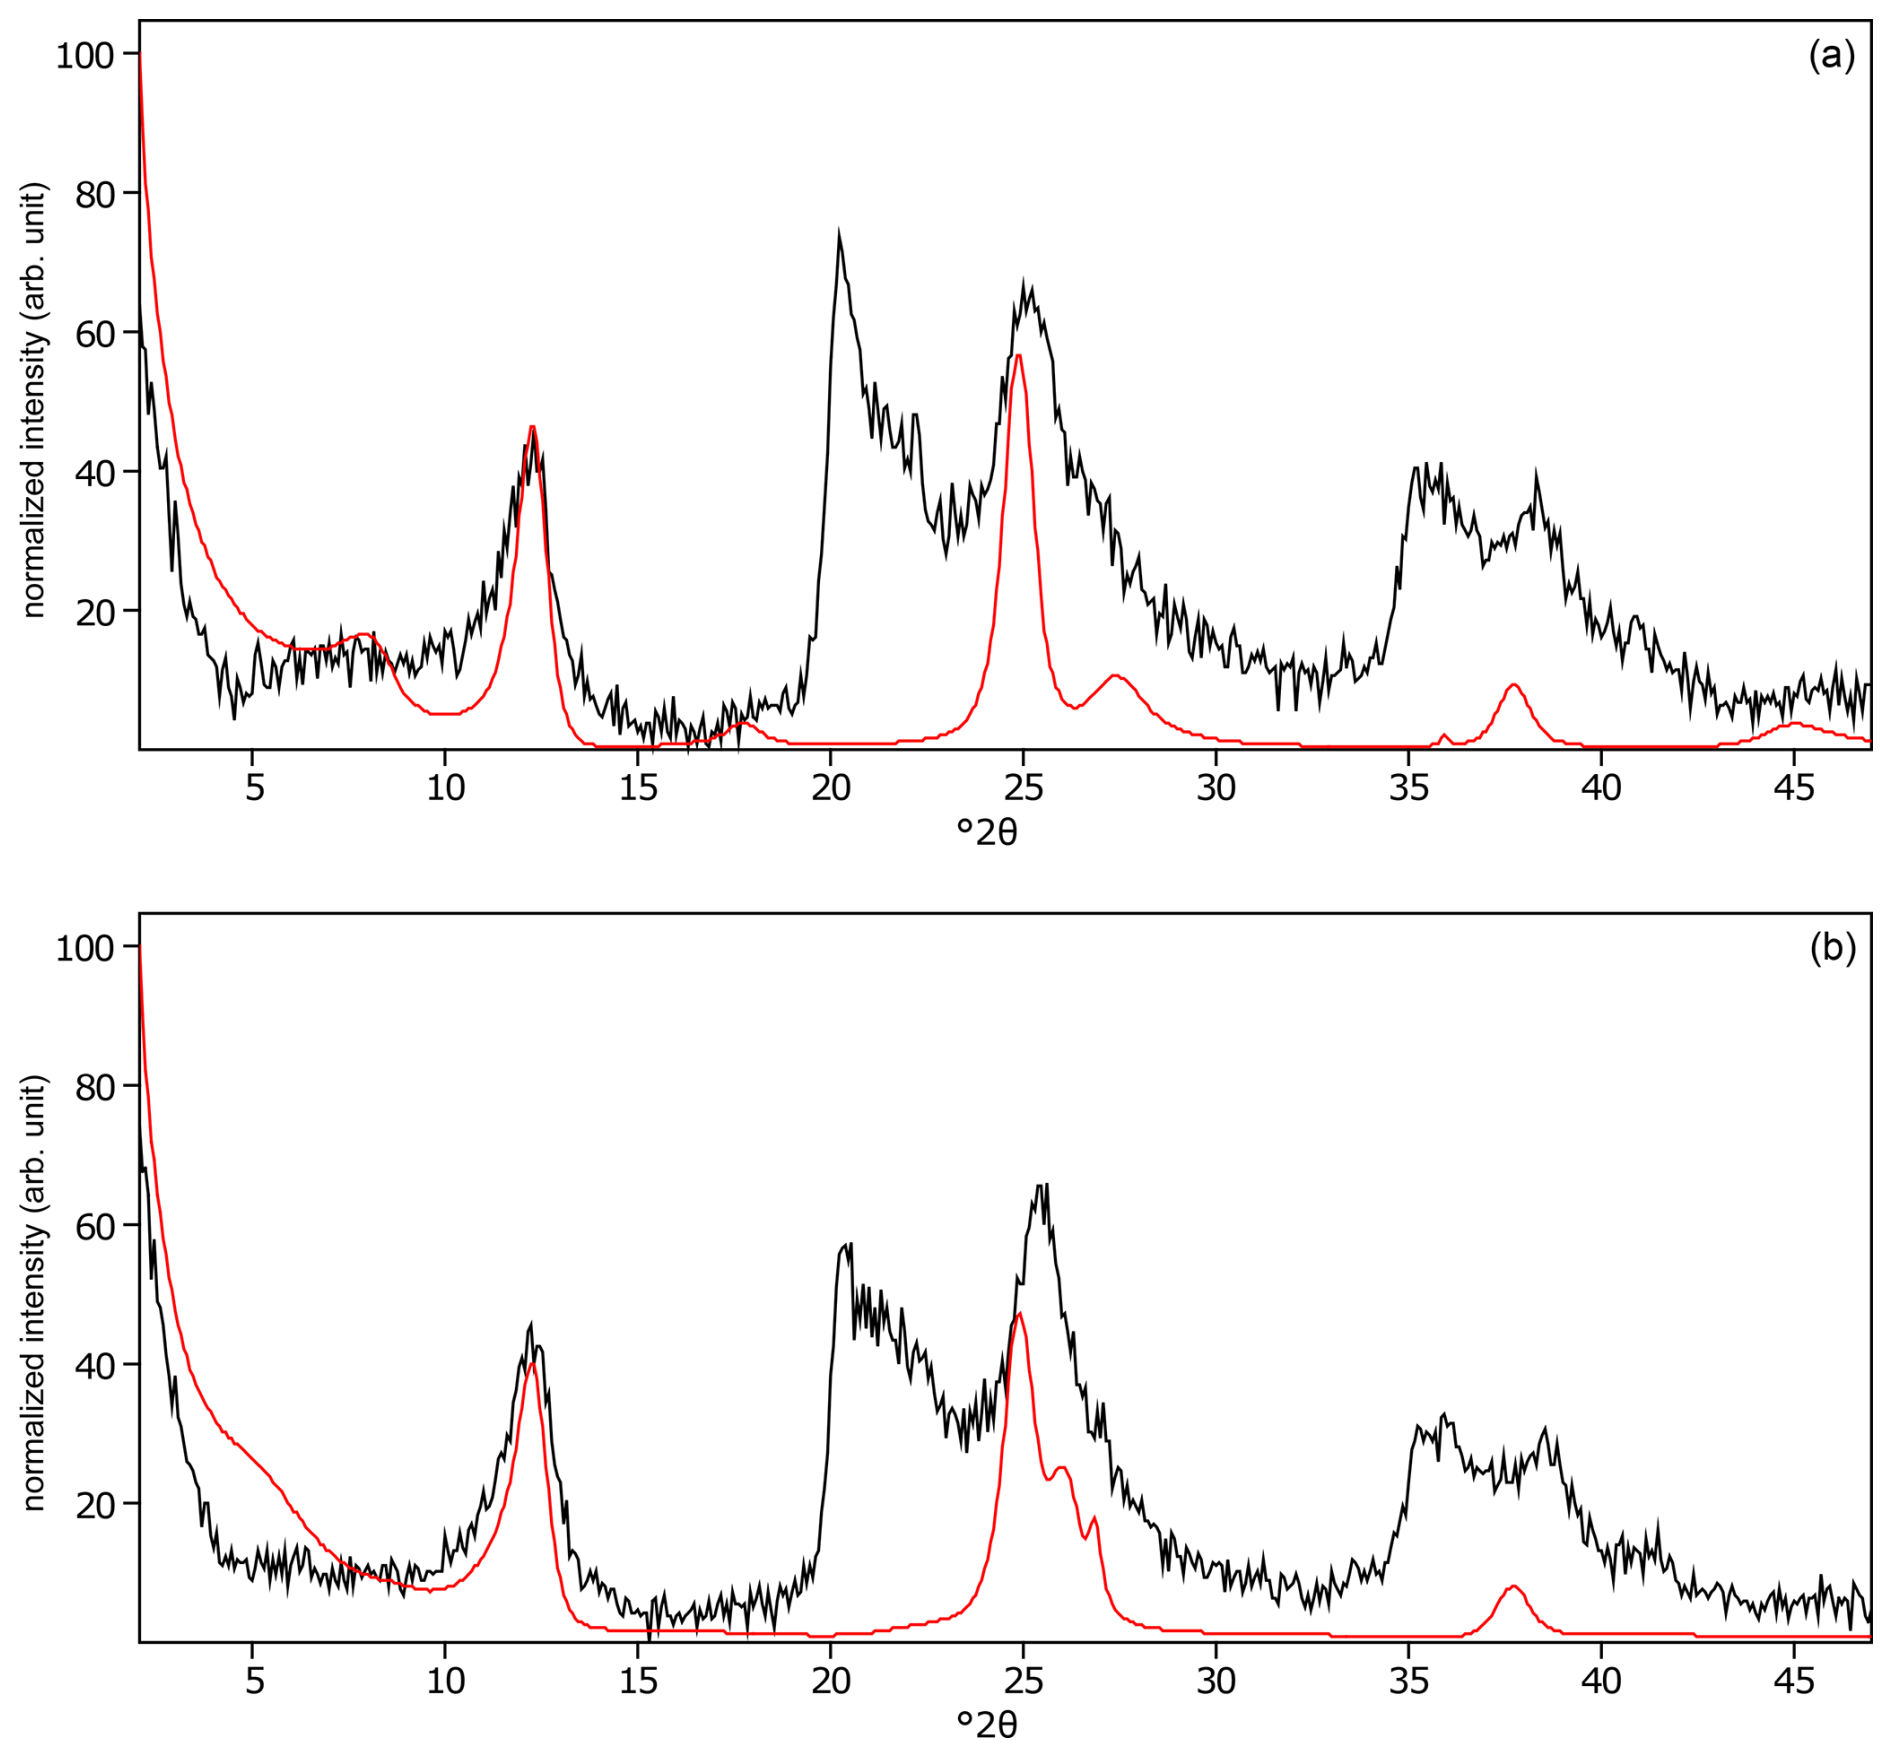
Figure C22The oriented clay fraction of soil from Pagsanjan (Philippines 5). (a) Experimental XRD patterns in air-dried, Ca-saturated state (black) and the modeled pattern (red) of 66 % kaolinite, 2 % randomly interstratified kaolinite–smectite (high charge) (), and 32 % randomly interstratified illite–smectite (high charge) (). (b) Experimental XRD patterns in ethylene-glycol-solvated, Ca-saturated state (black) and the modeled pattern (red) of 36 % kaolinite, 58 % randomly interstratified kaolinite–smectite (high charge) (), and 6 % randomly interstratified illite–smectite (high charge) ().
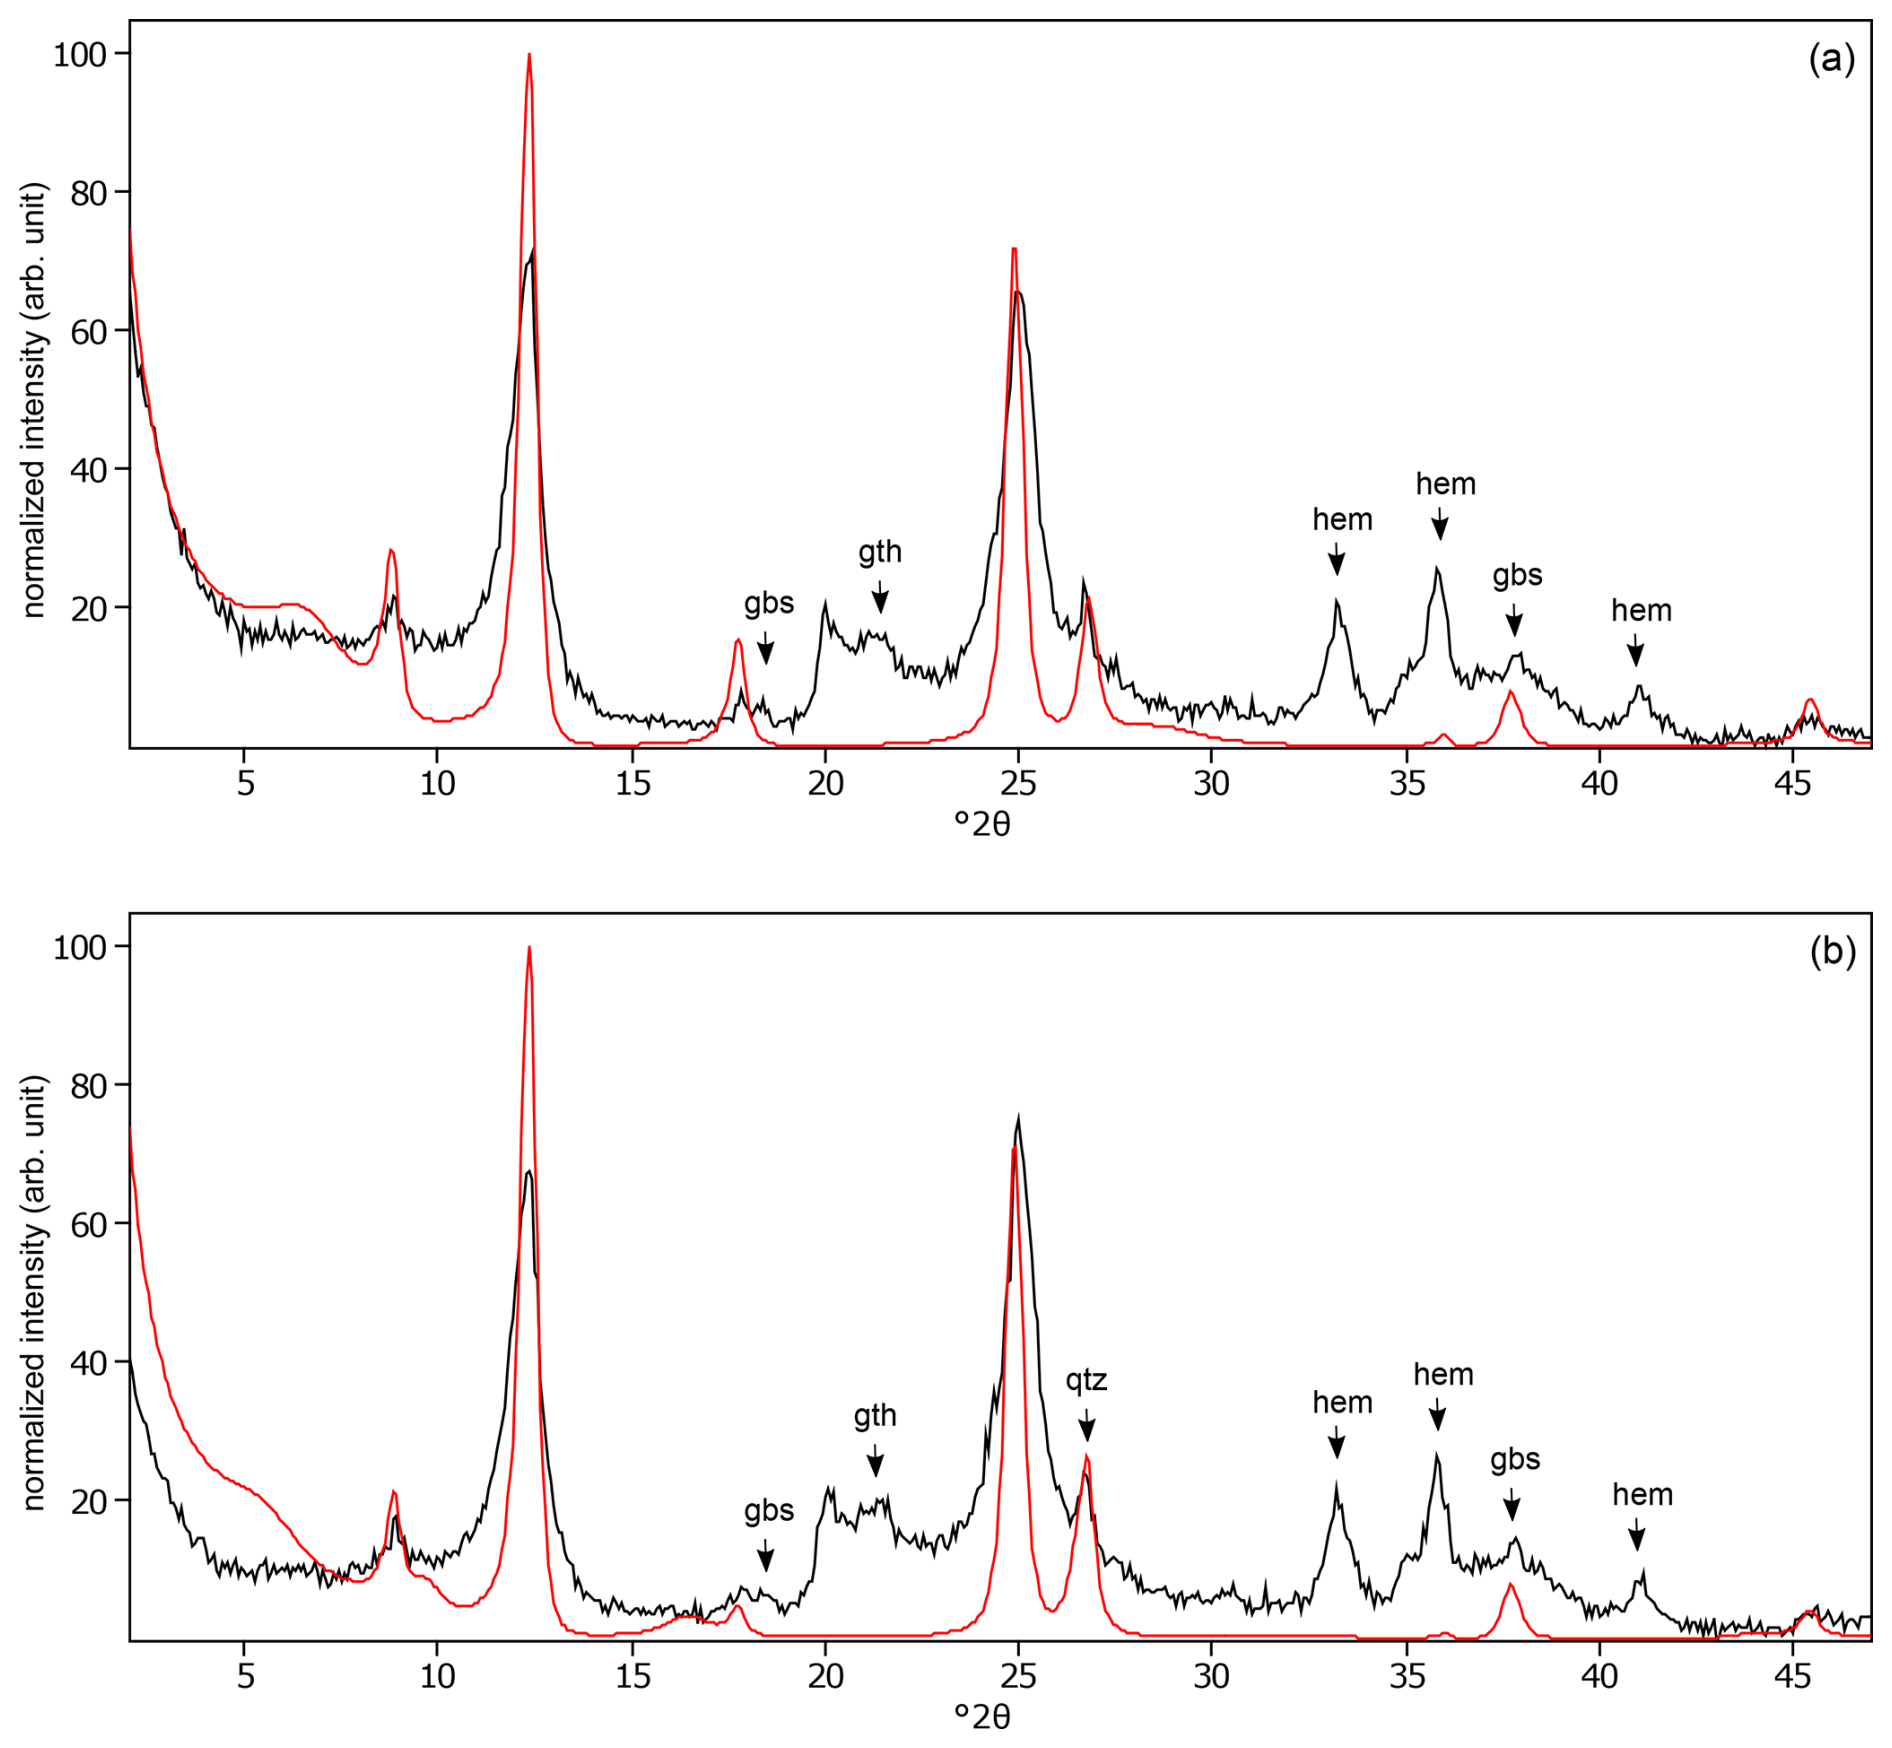
Figure C23The oriented clay fraction of soil from Kitale (Kenya 2). (a) Experimental XRD patterns in air-dried, Ca-saturated state (black) and the modeled pattern (red) of 53 % kaolinite, 27 % randomly interstratified illite–smectite (97:3), and 20 % randomly interstratified illite–smectite (60:40. (b) Experimental XRD patterns in ethylene-glycol-solvated, Ca-saturated state (black) and the modeled pattern (red) of 55 % kaolinite, 16 % randomly interstratified illite–smectite (97:3), and 29 % randomly interstratified illite–smectite (60:40). The arrows indicate gibbsite (gbs), goethite (gth), and hematite (hem) peaks.
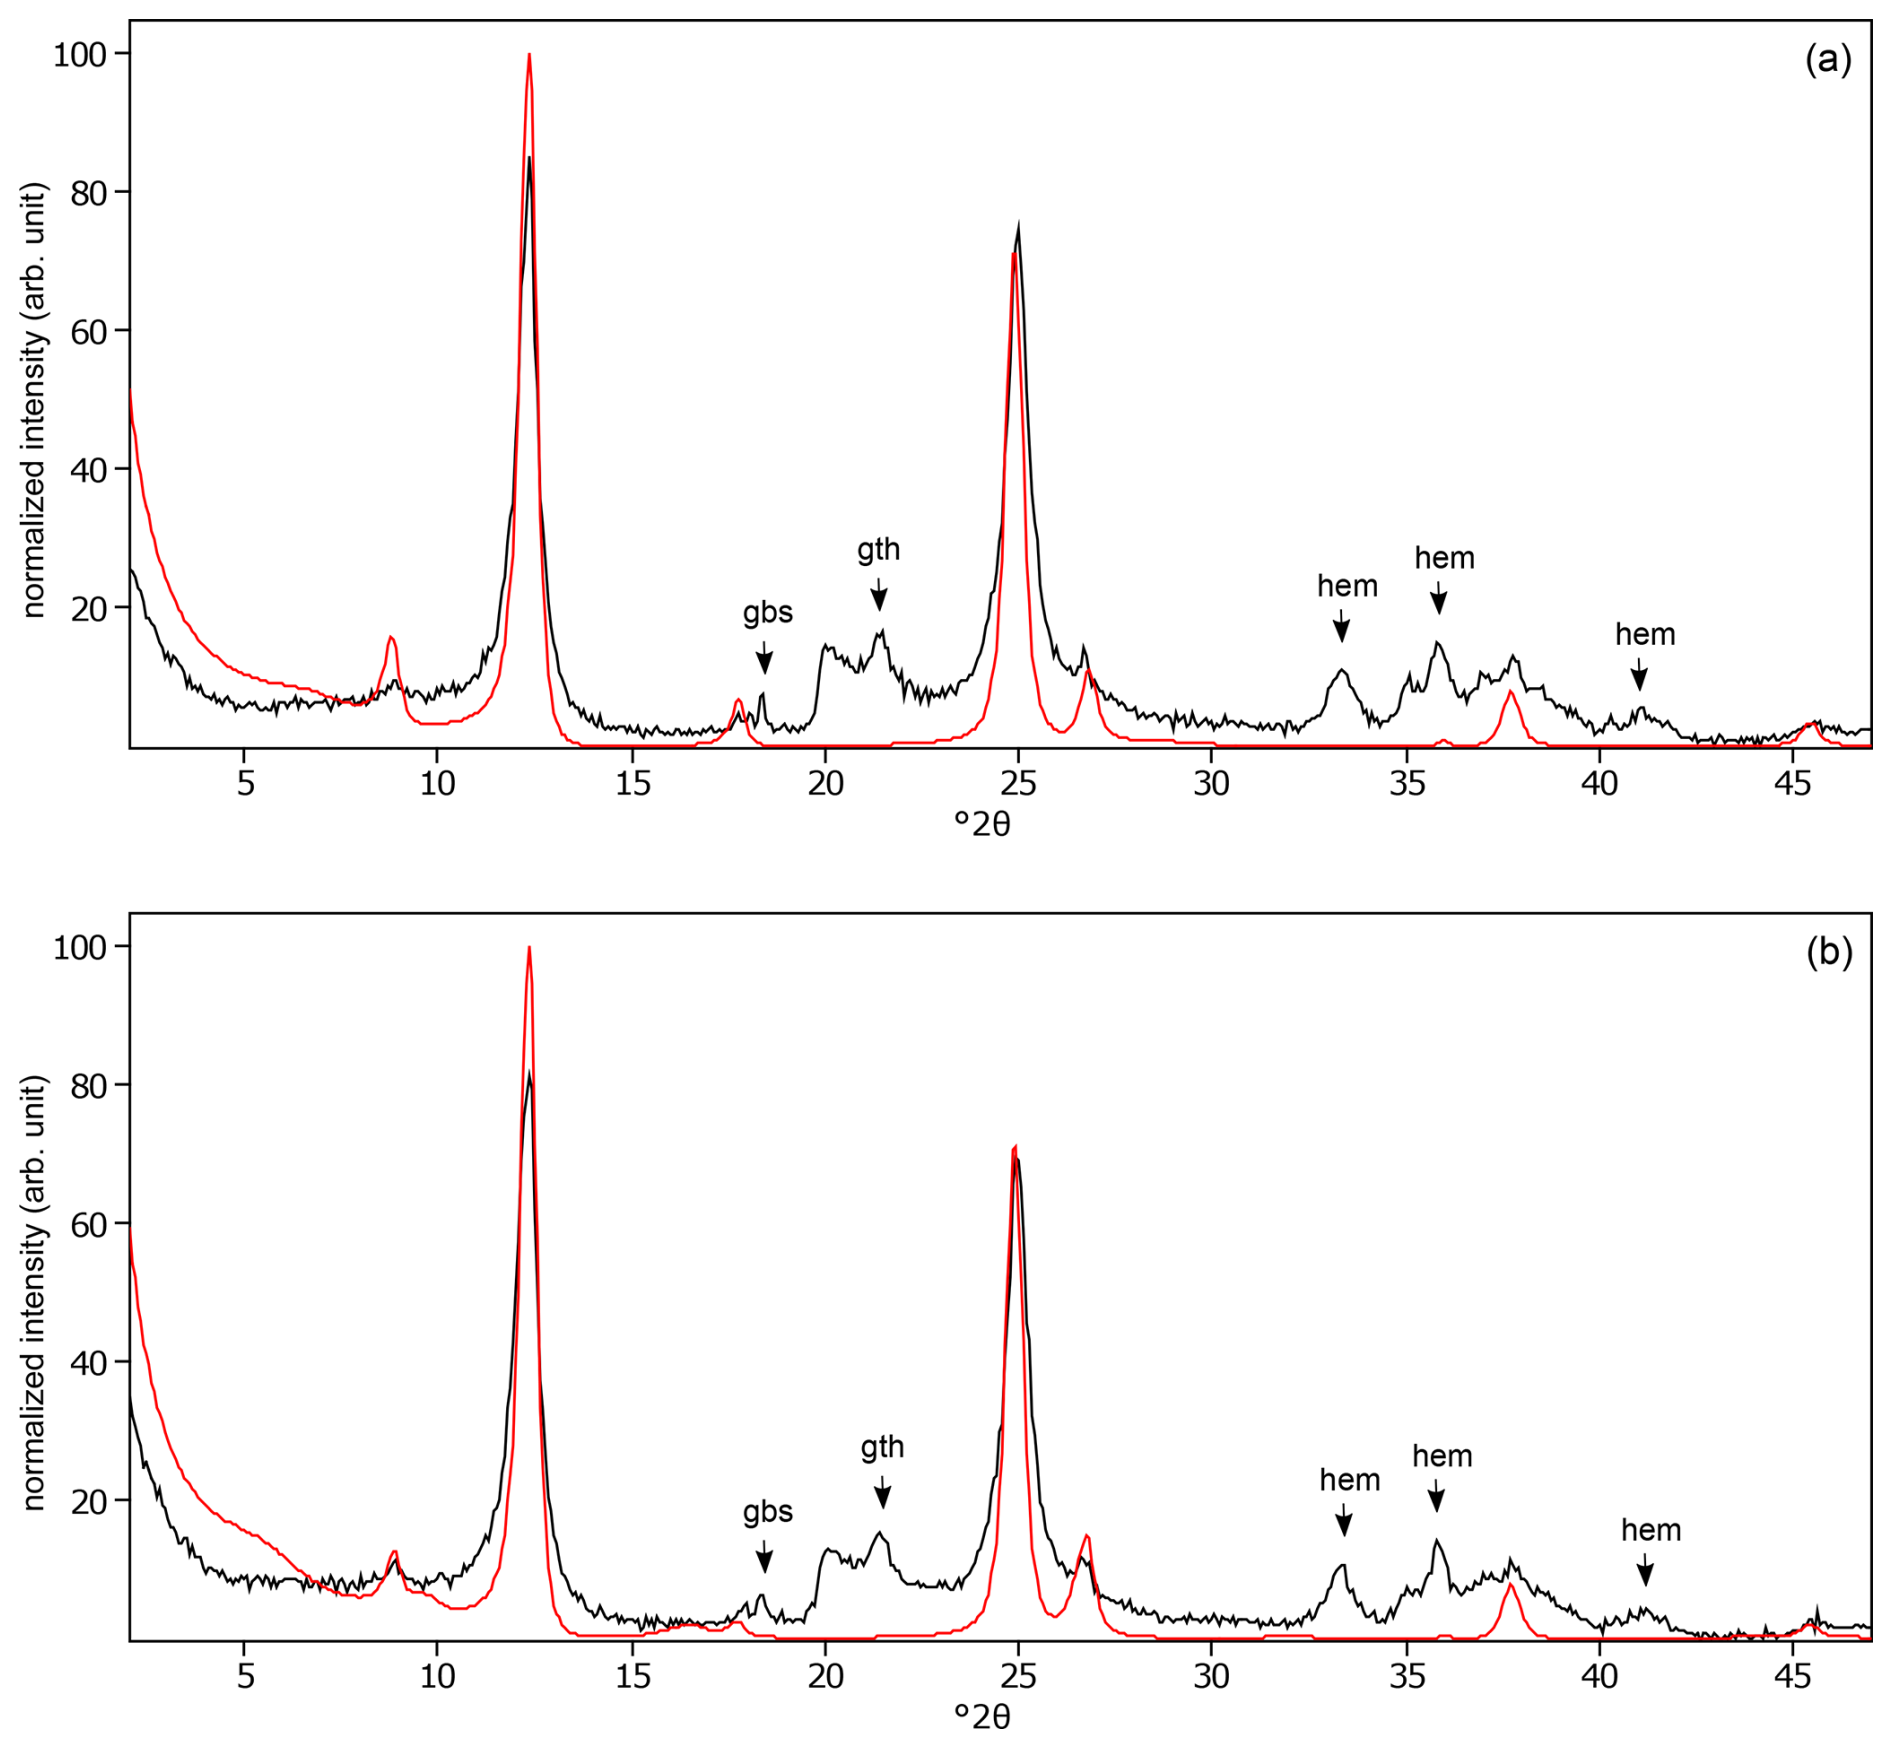
Figure C24The oriented clay fraction of soil from Kitale (Kenya 3). (a) Experimental XRD patterns in air-dried, Ca-saturated state (black) and the modeled pattern (red) of 73 % kaolinite, 20 % randomly interstratified illite–smectite (97:3), and 7 % randomly interstratified illite–smectite (60:40). (b) Experimental XRD patterns in ethylene-glycol-solvated, Ca-saturated state (black) and the modeled pattern (red) of 68 % kaolinite, 10 % randomly interstratified illite–smectite (97:3), and 22 % randomly interstratified illite–smectite (60:40). The arrows indicate gibbsite (gbs), goethite (gth), and hematite (hem) peaks.
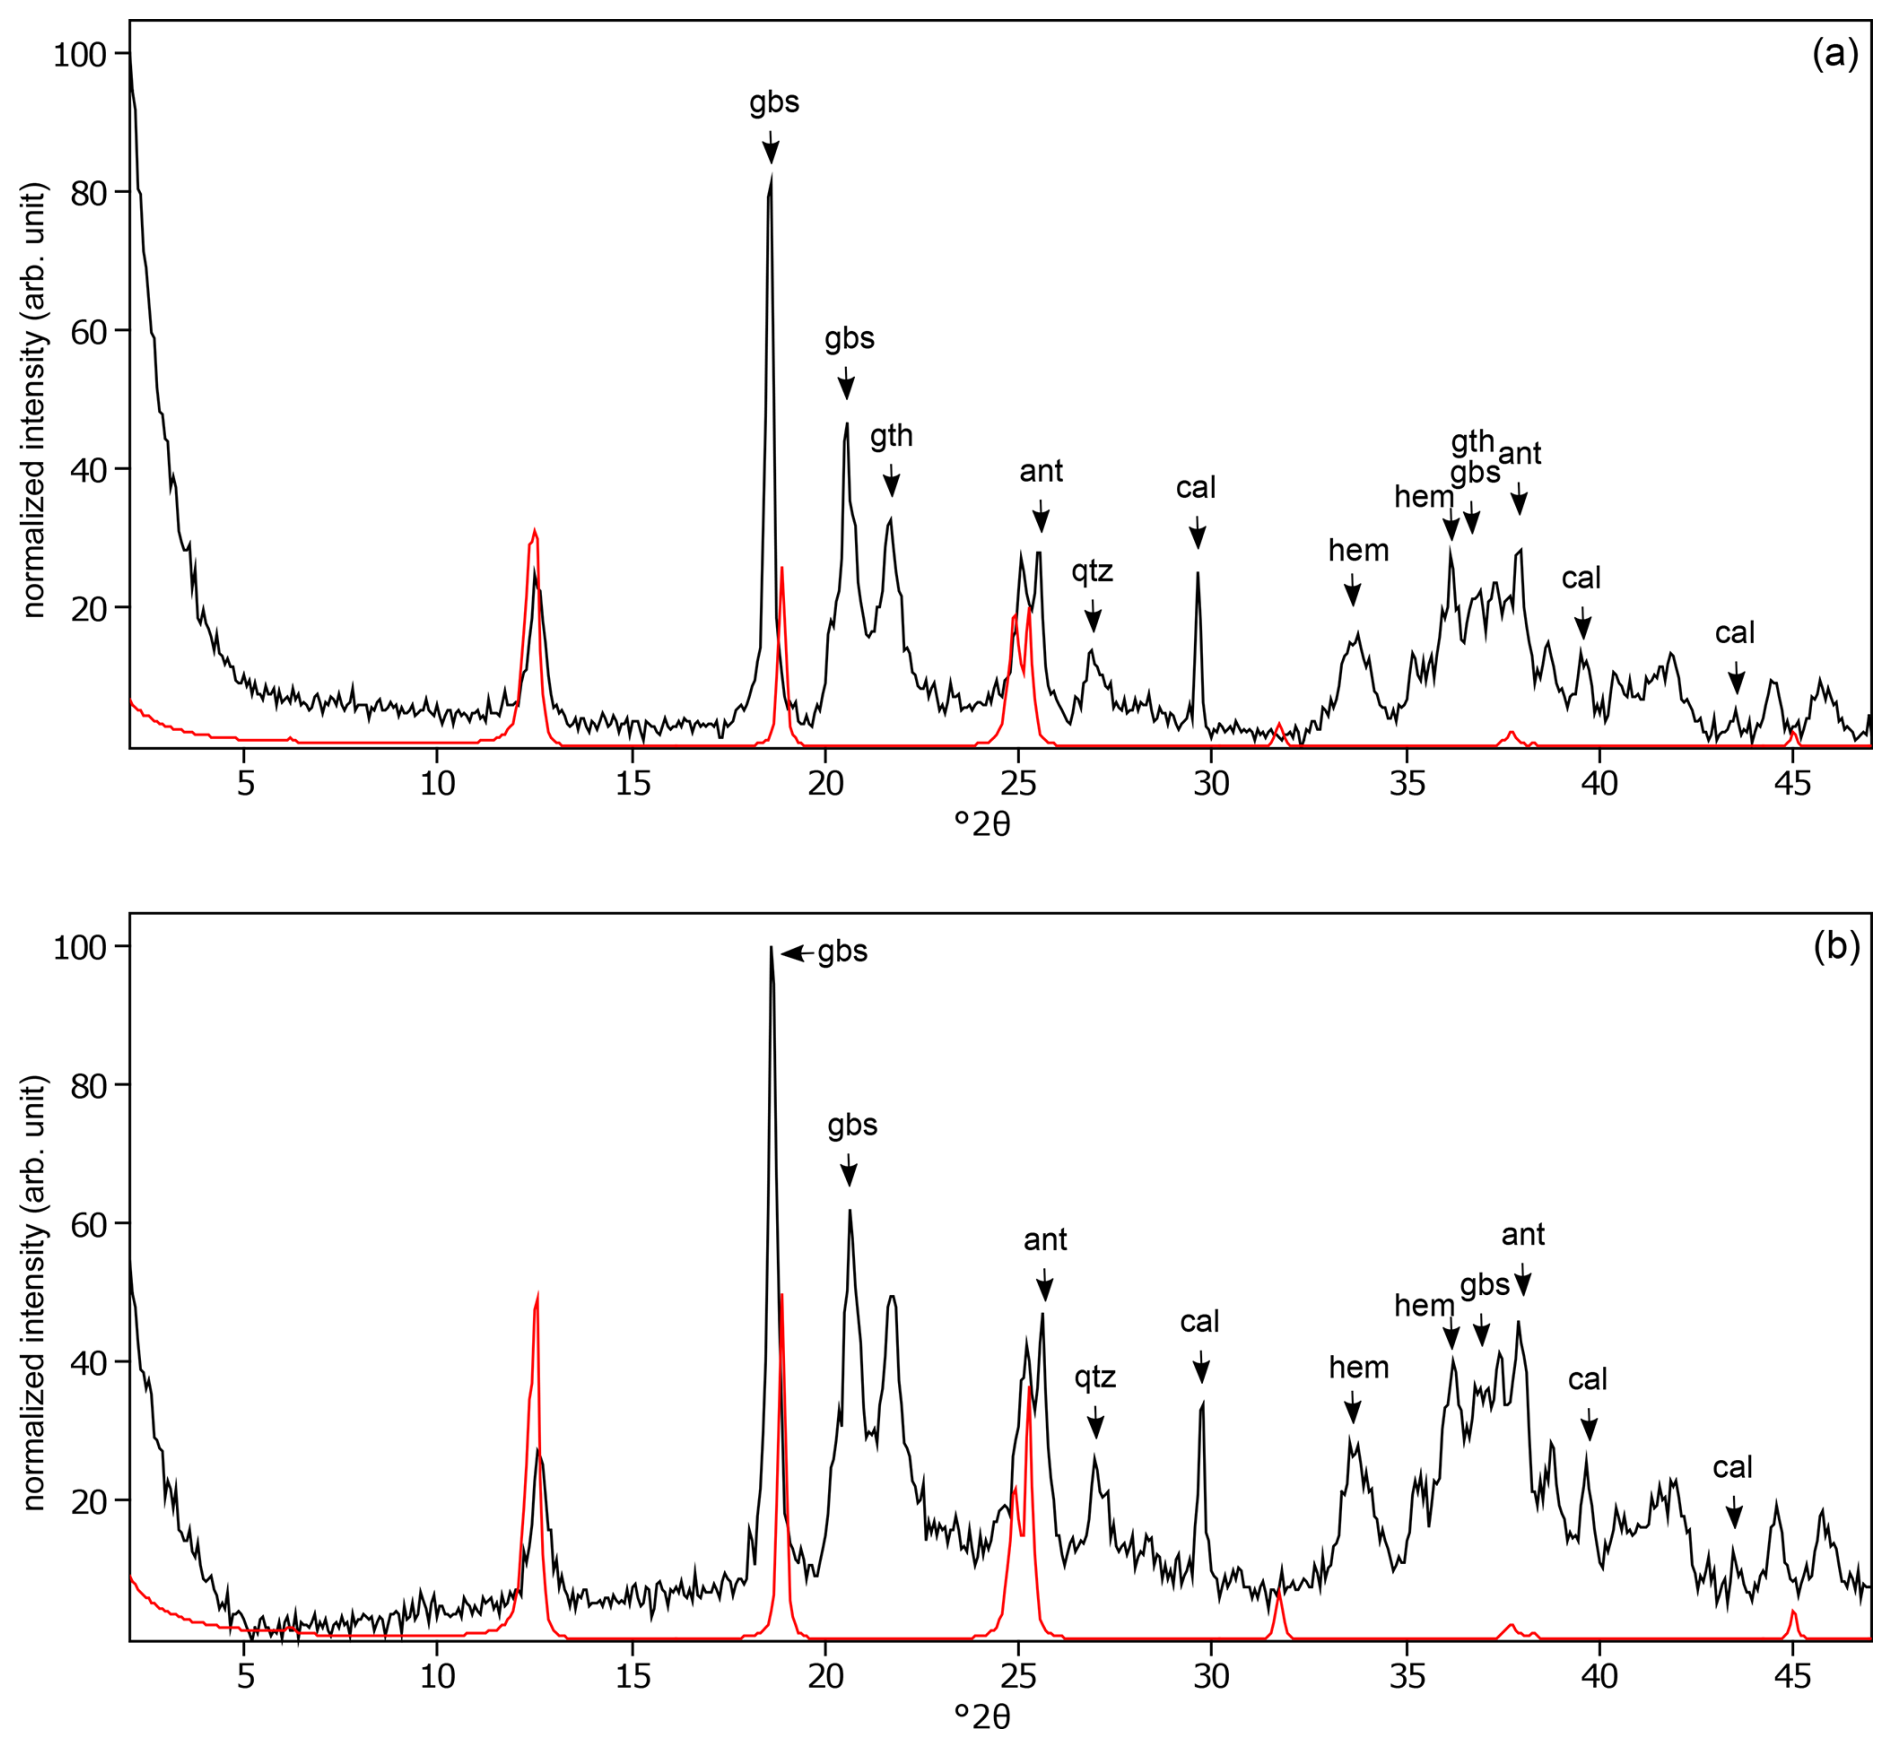
Figure C25The oriented clay fraction of soil from Behenjy (Madagascar). (a) Experimental XRD patterns in air-dried, Ca-saturated state (black) and the modeled pattern (red) of 54 % kaolinite and 46 % chlorite. (b) Experimental XRD patterns in ethylene-glycol-solvated, Ca-saturated state (black) and the modeled pattern (red) of 40 % kaolinite and 60 % chlorite. The arrows indicate quartz (qtz), gibbsite (gbs), goethite (gth), anatase (ant), hematite (hem), and calcite (cal) peaks.
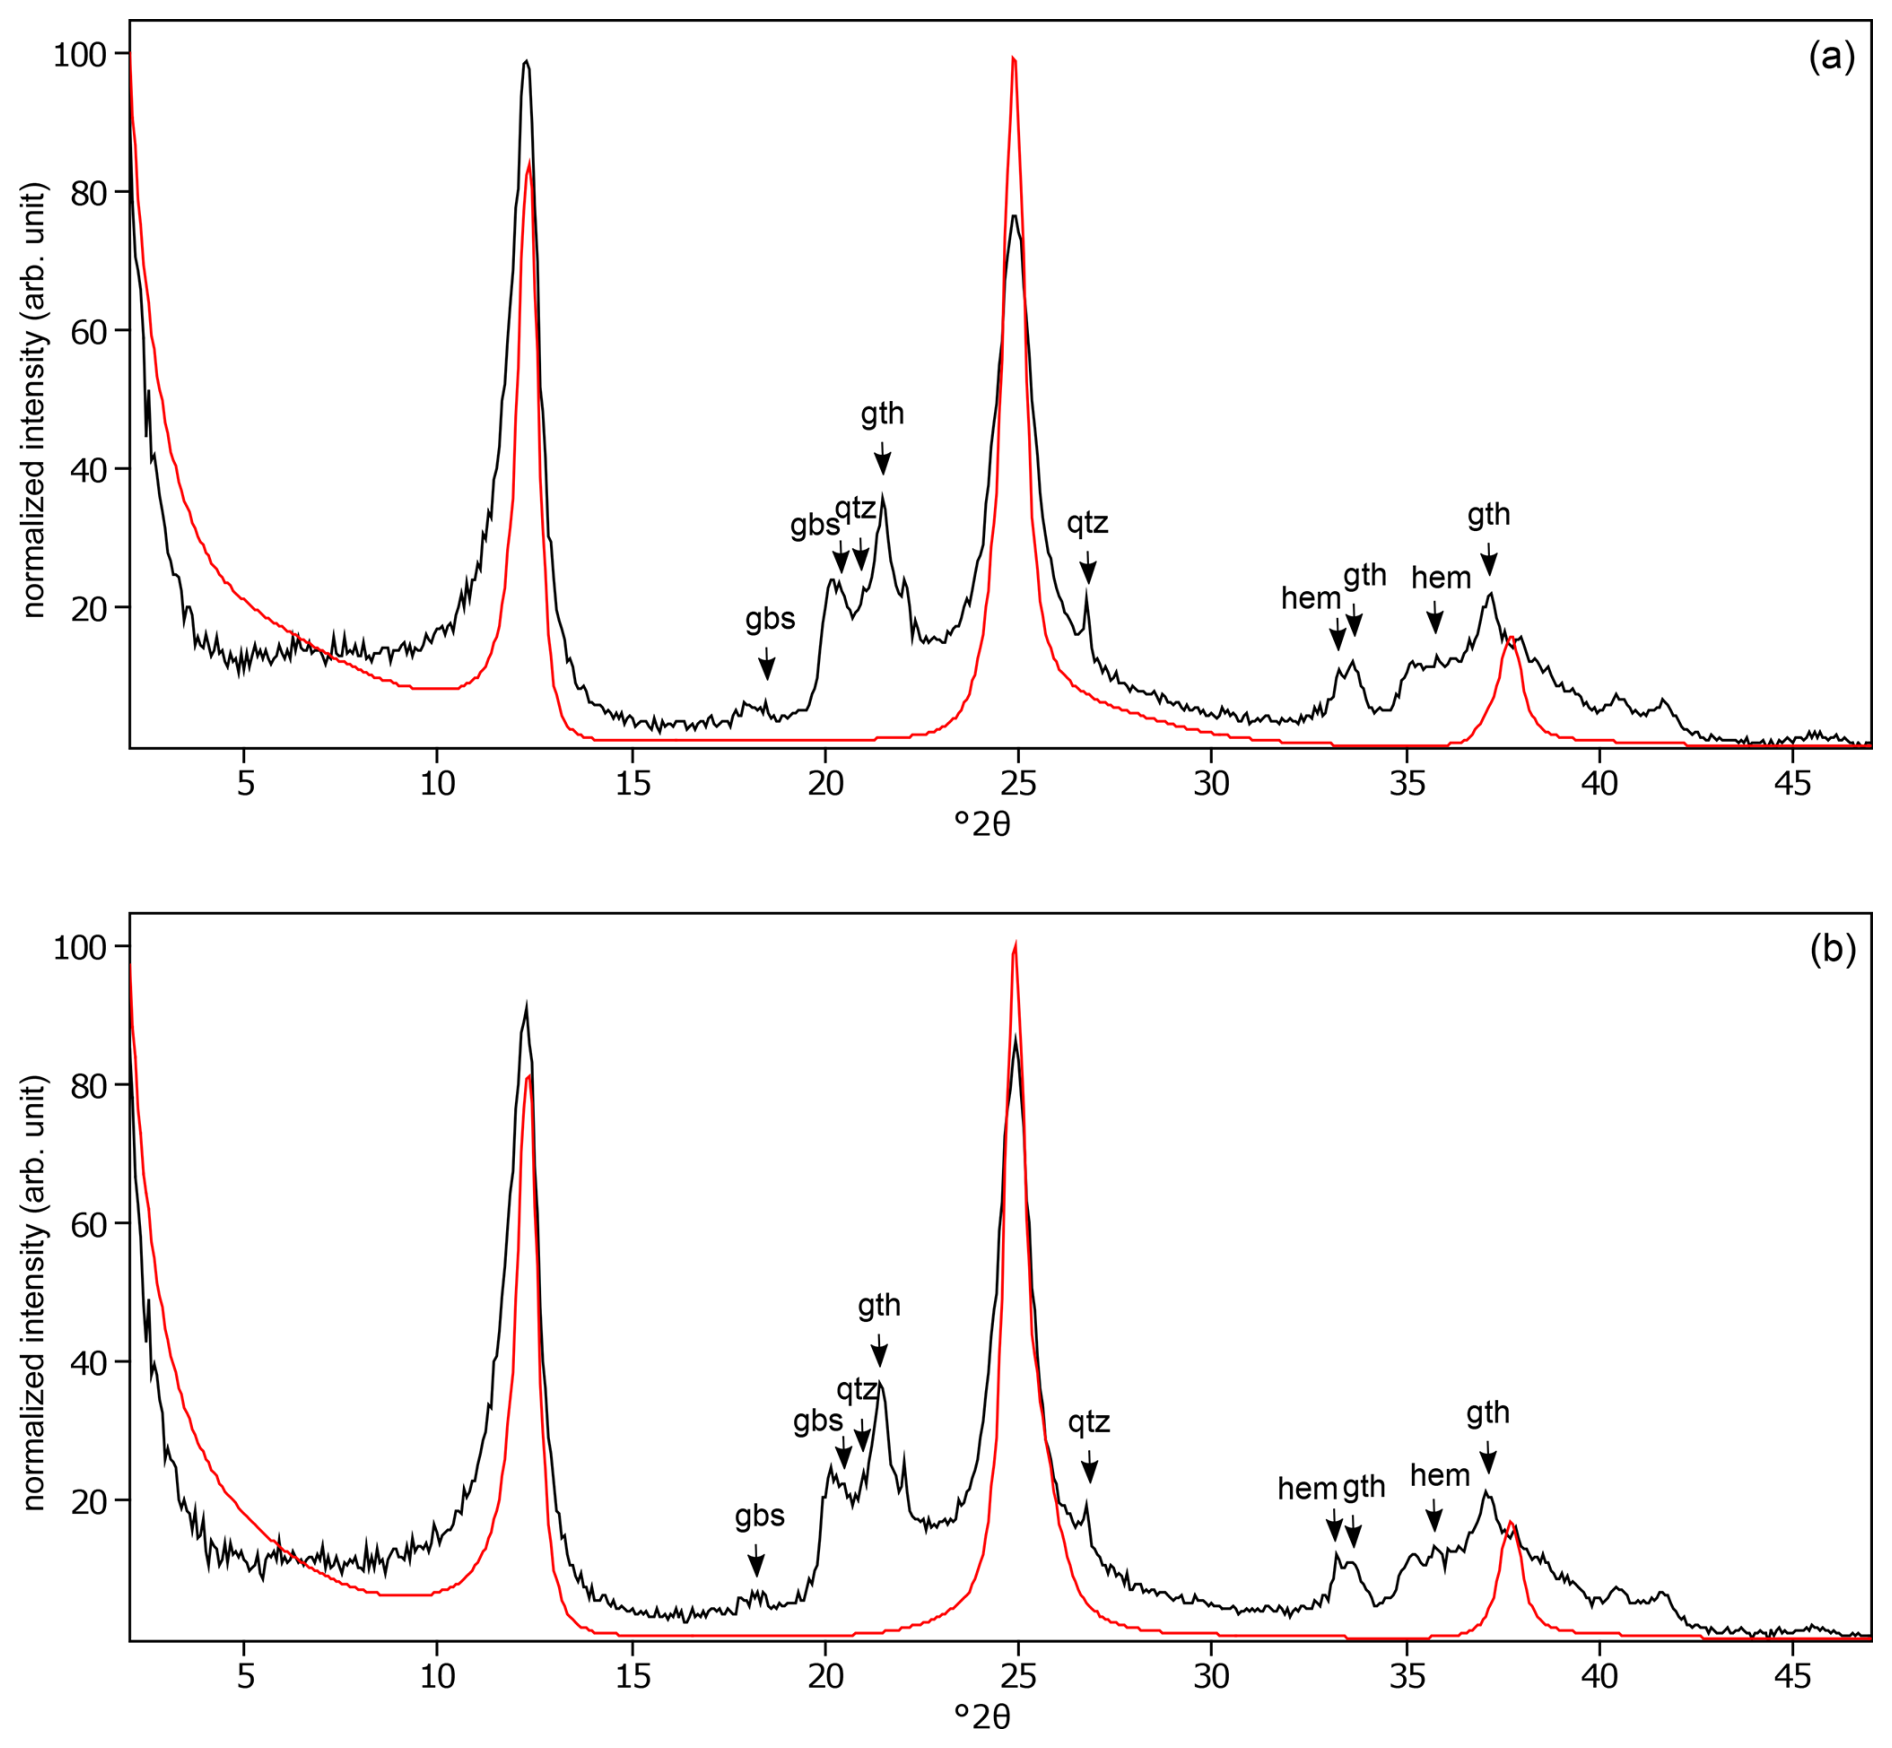
Figure C26The oriented clay fraction of soil from Cavinti (Philippines). (a) Experimental XRD patterns in air-dried, Ca-saturated state (black) and the modeled pattern (red) of 38 % kaolinite and 62 % randomly interstratified kaolinite–smectite (high charge) (). (b) Experimental XRD patterns in ethylene-glycol-solvated, Ca-saturated state (black) and the modeled pattern (red) of 42 % kaolinite and 58 % randomly interstratified kaolinite–smectite (high charge) (). The arrows indicate quartz (qtz), gibbsite (gbs), goethite (gth), and hematite (hem) peaks.
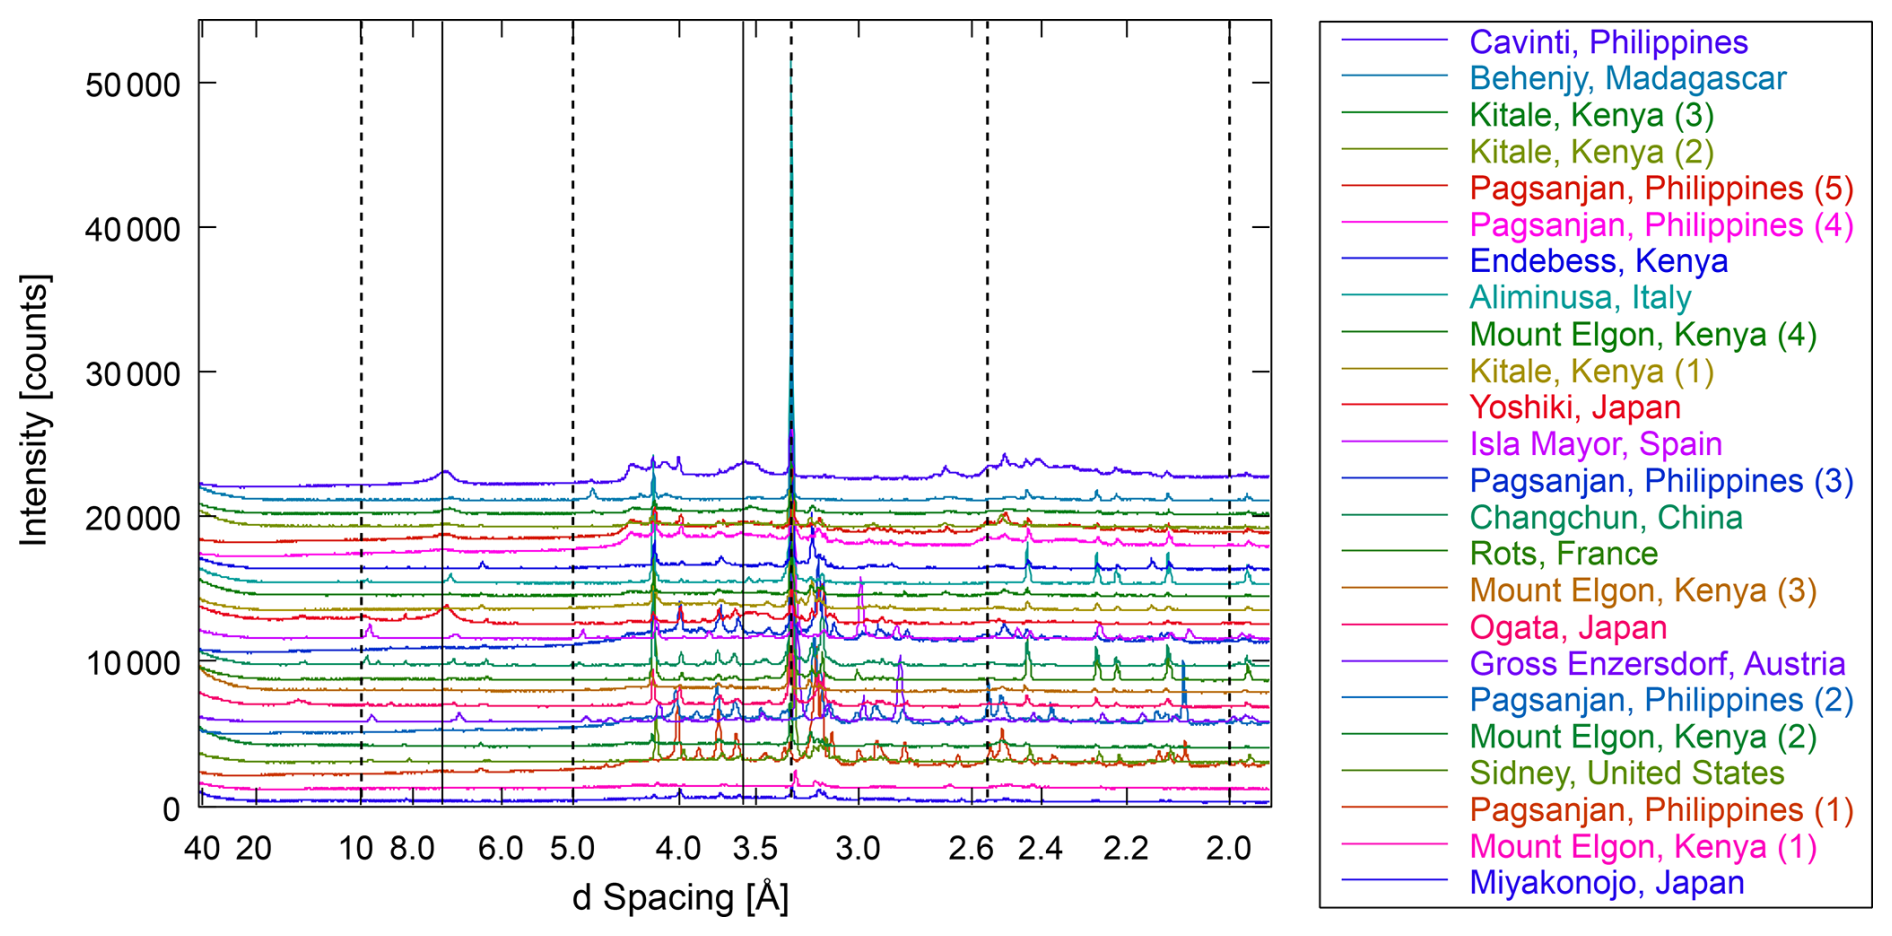
Figure C27Comparison of the oriented silt fractions in air-dried, Ca-saturated state of all soils in this study ordered from bottom to top by increased weathering stage. Full lines indicate peak positions of kaolinite at 7.17 and 3.58 Å, and dotted lines indicate peak positions of mica at 10, 5.0, 3.36, 2.56, and 2.00 Å. Quartz peaks are at 3.34, 4.26, and 2.46 Å.
Table C1Mineralogy of the < 2 µm fraction of soils. Soils are ordered by increasing WI and grouped as young (WI = 2.5–4.7), intermediate (WI = 4.7–7.0), or weathered (WI = 7.0–9.2). K denotes kaolinite; I denotes illite; S denotes regular smectite; Sb denotes high-charge smectite, i.e., expandable layers with vermiculite-like swelling behavior; and C denotes chlorite. Combinations are randomly mixed-layered (i.e., interstratified) mineral phases. Illite is modeled as mixed-layered illite–smectite with 3 %–5 % smectite (ISc) to match the illite peaks better. Ratios show the percentage of the mineral phase. Note that mineral phases quantified are limited to illite, vermiculite, smectite, kaolinite, chlorite, and their mixed layers; other phases (e.g., allophane, mica, feldspars) were not included in the analysis.
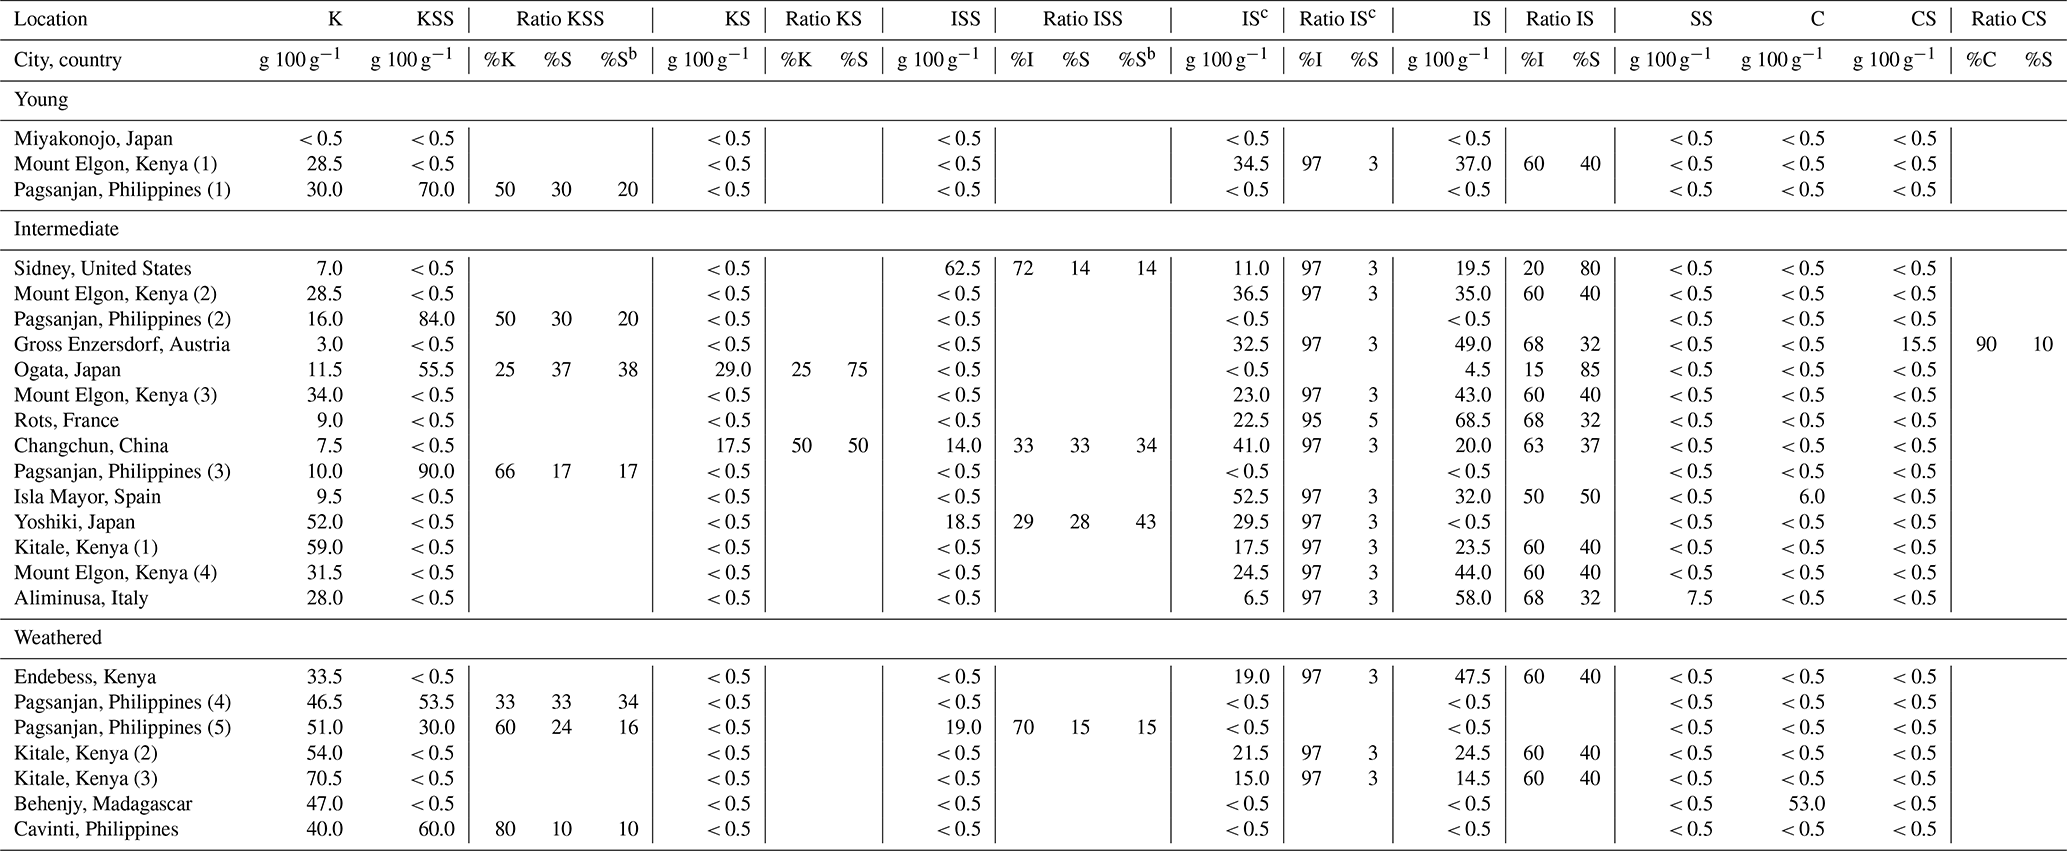
Table D1Pearson correlation coefficients estimated by pairwise method between measured variables (N=24) and the illite-equivalent clay. Significant correlations are p < 0.001, p < 0.01, * p < 0.05, and not significant (n.s.) if p > 0.05. I denotes illite, S denotes expanded phyllosilicate (regular and high-charge smectite), C denotes chlorite, and K denotes kaolinite.
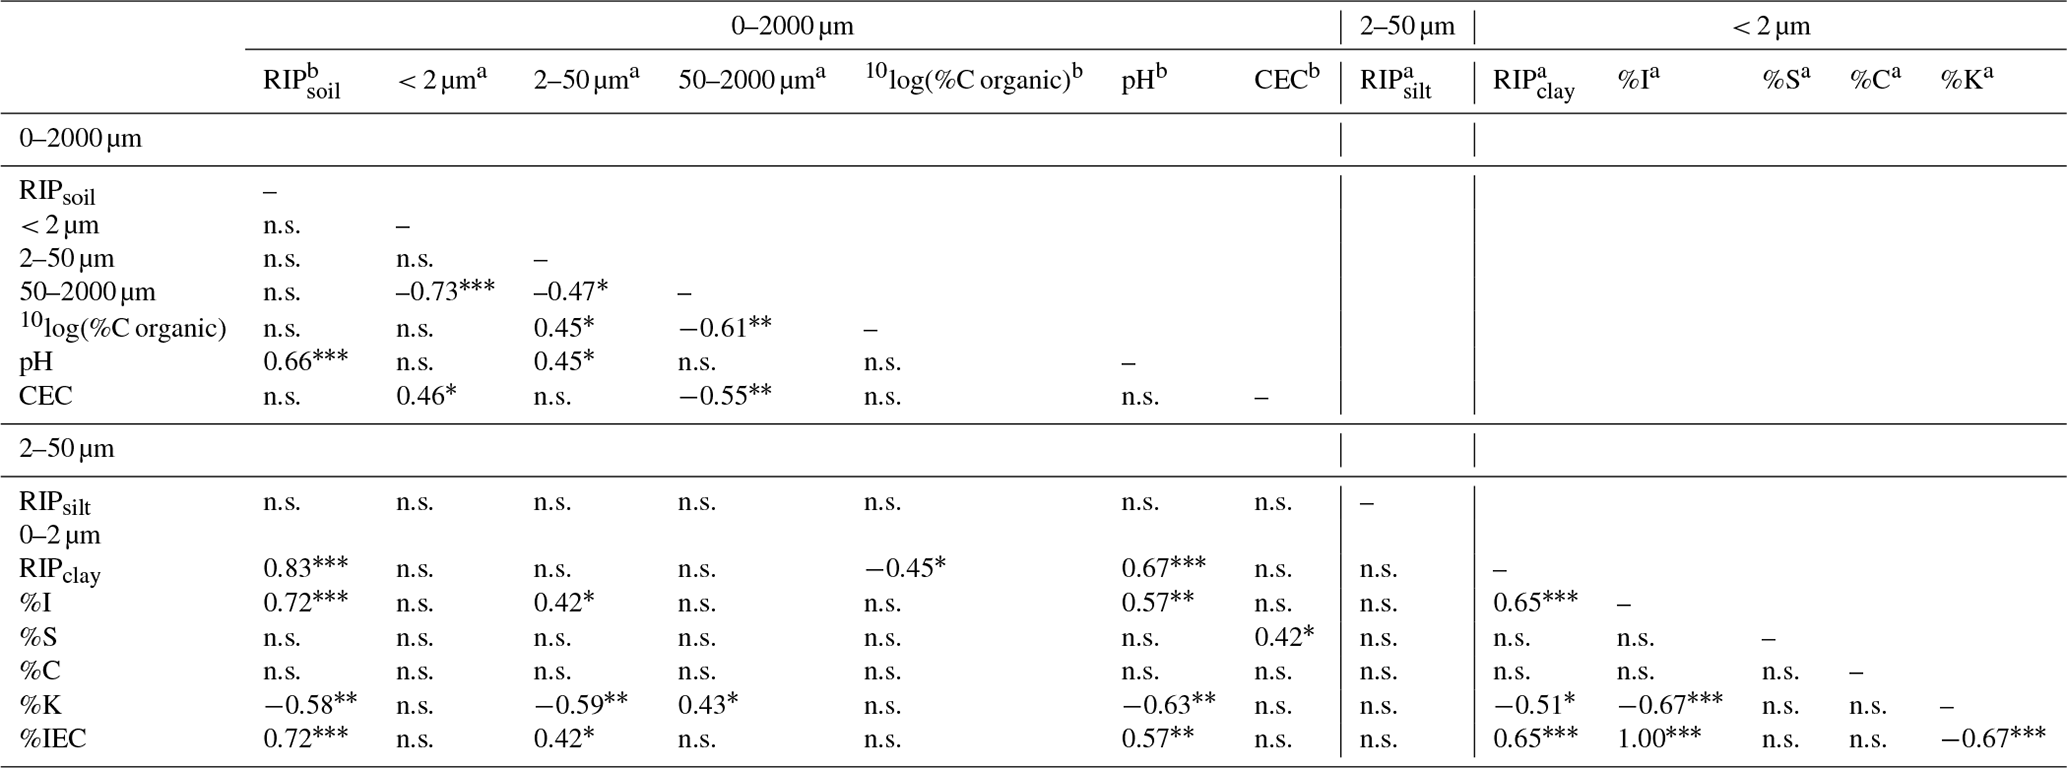
a n=1. b n=3.
Additional information is provided in the Appendices: validation of the Na+ resin method (Appendix A), soil bulk mineralogy and characteristics (Appendix B), interpretation of XRD patterns and clay mineralogy (Appendix C), and correlation coefficients (Appendix D). The X-ray diffraction patterns are openly available (https://doi.org/10.17632/nr4f6s23k6.1, Vanheukelom, 2024).
The paper was written with contributions by all of the authors. All the authors have given approval to the final version of the Paper. MV: conceptualization, data curation, formal analysis, investigation, methodology, validation, visualization, writing (original draft; review and editing). NH: data curation, formal analysis, methodology. TA: funding acquisition, project administration, resources, supervision, writing (review and editing). LS: funding acquisition, project administration, resources, supervision. NW: data curation, formal analysis, methodology. MVH: data curation, formal analysis, methodology. ES: conceptualization, formal analysis, funding acquisition, investigation, methodology, project administration, resources, supervision, visualization, writing (original draft; review and editing.
The contact author has declared that none of the authors has any competing interests.
Publisher’s note: Copernicus Publications remains neutral with regard to jurisdictional claims made in the text, published maps, institutional affiliations, or any other geographical representation in this paper. While Copernicus Publications makes every effort to include appropriate place names, the final responsibility lies with the authors.
The authors would like to thank Bruno Delvaux, Anne Iserentant, and Elodie Devos from the Soil Science Laboratory (UCLouvain) for sharing their expertise and protocols on the dispersion and isolation of fractions from various soils. The authors acknowledge the use of generative AI tools during the initial research and writing process of this paper for purposes of language assistance. The authors have reviewed and edited the content as needed and take full responsibility for the content of the publication.
This research was supported through a PhD grant provided by the Belgian Nuclear Research Centre (SCK CEN).
This paper was edited by Olivier Evrard and reviewed by two anonymous referees.
Absalom, J. P., Young, S. D., Crout, N. M. J., Nisbet, A. F., Woodman, R. F. M., Smolders, E., and Gillett, A. G.: Predicting soil to plant transfer of radiocesium using soil characteristics, Environ. Sci. Technol., 33, 1218–1223, https://doi.org/10.1021/es9808853, 1999.
Absalom, J. P., Young, S. D., Crout, N. M. J., Sanchez, A., Wright, S. M., Smolders, E., Nisbet, A. F., and Gillett, A. G.: Predicting the transfer of radiocaesium from organic soils to plants using soil characteristics, J. Environ. Radioact., 52, 31–43, https://doi.org/10.1016/S0265-931X(00)00098-9, 2001.
Bartoli, F., Burtin, G., and Herbillon, A. J.: Disaggregation and clay dispersion of Oxisols: Na resin, a recommended methodology, Geoderma, 49, 301–317, https://doi.org/10.1016/0016-7061(91)90082-5, 1991.
Brindley, G. W. and Brown, G. (Eds.): Crystal structures of clay minerals and their X-ray identification, Mineralogical Society, London, https://doi.org/https://doi.org/10.1180/mono-5, 1980.
Brown, J. E., Beresford, N. A., Hosseini, A., and Barnett, C. L.: Applying process-based models to the Borssele scenario, Radioprotection, 55, S109–S117, https://doi.org/10.1051/radiopro/2020020, 2020.
Christl, I. and Kretzschmar, R.: Interaction of copper and fulvic acid at the hematite-water interface, Geochim. Cosmochim. Ac., 65, 3435–3442, https://doi.org/10.1016/S0016-7037(01)00695-0, 2001.
Cremers, A., Elsen, A., De Preter, P., and Maes, A.: Quantitative analysis of radiocaesium retention in soils, Nature, 335, 247–249, https://doi.org/10.1038/335247a0, 1988.
Degryse, F., Smolders, E., and Cremers, A.: Enhanced sorption and fixation of radiocaesium in soils amended with K-bentonites, submitted to wetting-drying cycles, Eur. J. Soil Sci., 55, 513–522, https://doi.org/10.1111/j.1365-2389.2004.00619.x, 2004.
Delvaux, B., Herbillon, A. J., and Vielvoye, L.: Characterization of a weathering sequence of soils derived from volcanic ash in Cameroon. Taxonomic, mineralogical and agronomic implications, Geoderma, 45, 375–388, https://doi.org/10.1016/0016-7061(89)90017-7, 1989.
Eguchi, T., Ohta, T., Ishikawa, T., Matsunami, H., Takahashi, Y., Kubo, K., Yamaguchi, N., Kihou, N., and Shinano, T.: Influence of the nonexchangeable potassium of mica on radiocesium uptake by paddy rice, J. Environ. Radioact., 147, 33–42, https://doi.org/10.1016/j.jenvrad.2015.05.002, 2015.
Fanning, D. S., Keramidas, V. Z., and El-Desoky, M. A.: Micas, in: Minerals in Soil Environments, vol. 1, edited by: Dixon, J. B. and Weed, S. B., Soil Science Society of America, Madison, Wisconsin, USA, 551–634, https://doi.org/10.2136/sssabookser1.2ed.c12, 1989.
Fuller, A. J., Shaw, S., Ward, M. B., Haigh, S. J., Mosselmans, J. F. W., Peacock, C. L., Stackhouse, S., Dent, A. J., Trivedi, D., and Burke, I. T.: Caesium incorporation and retention in illite interlayers, Appl. Clay Sci., 108, 128–134, https://doi.org/10.1016/j.clay.2015.02.008, 2015.
ISO: Soil quality – Determination of particle size distribution in mineral soil material – Method by sieving and sedimentation, 1st Edn., Geneva, CH, 30 pp., 1998.
IUSS Working Group WRB FAO: World Reference Base for Soil Resources. International soil classification system for naming soils and creating legends for soil maps, 4th Edn., Vienna, ISBN 979-8-9862451-1-9, 2022.
Mackenzie, K. J. D., Brown, I. W. M., Cardile, C. M., and Meinhold, R. H.: The thermal reactions of muscovite studied by high-resolution solid-state 29-Si and 27-AI NMR, J. Mater. Sci., 22, 2645–2654, https://doi.org/10.1007/BF01082158, 1987.
Maes, A., Verheyden, D., and Cremers, A.: Formation of highly selective cesium-exchange sites in montmorillonites, Clays Clay Miner., 33, 251–257, https://doi.org/10.1346/ccmn.1985.0330312, 1985.
Maes, E., Vielvoye, L., Stone, W., and Delvaux, B.: Fixation of radiocaesium traces in a weathering sequence mica → vermiculite → hydroxy interlayered vermiculite, Eur. J. Soil Sci., 50, 107–115, https://doi.org/10.1046/j.1365-2389.1999.00223.x, 1999a.
Maes, E., Iserentant, A., Herbauts, J., and Delvaux, B.: Influence of the nature of clay minerals on the fixation of radiocaesium traces in an acid brown earth–podzol weathering sequence, Eur. J. Soil Sci., 50, 117–125, https://doi.org/10.1046/j.1365-2389.1999.00224.x, 1999b.
Marsh, A. T. M., Brown, A. P., Freeman, H. M., Walkley, B., Pendlowski, H., and Bernal, S. A.: Determining aluminium co-ordination of kaolinitic clays before and after calcination with electron energy loss spectroscopy, Appl. Clay Sci., 255, 107402, https://doi.org/10.1016/j.clay.2024.107402, 2024.
McKinley, J. P., Zachara, J. M., Heald, S. M., Dohnalkova, A., Newville, M. G., and Sutton, S. R.: Microscale Distribution of Cesium Sorbed to Biotite and Muscovite, Environ. Sci. Technol., 38, 1017–1023, https://doi.org/10.1021/es034569m, 2004.
Moore, D. M. M. and Reynolds Jr., R. C.: X-Ray Diffraction and the Identification and Analysis of Clay Minerals, 2nd Edn., Oxford University Press, 400 pp., ISBN 0-19-508713-5, 1997.
Mukai, H., Hirose, A., Motai, S., Kikuchi, R., and Tanoi, K.: Cesium adsorption/desorption behavior of clay minerals considering actual contamination conditions in Fukushima, Nature Publishing Group, 1–7, https://doi.org/10.1038/srep21543, 2016.
Nakao, A., Thiry, Y., Funakawa, S., and Kosaki, T.: Characterization of the frayed edge site of micaceous minerals in soil clays influenced by different pedogenetic conditions in Japan and northern Thailand, Soil Sci. Plant Nutr., 54, 479–489, https://doi.org/10.1111/j.1747-0765.2008.00262.x, 2008.
Nakao, A., Takeda, A., Ogasawara, S., Yanai, J., Sano, O., and Ito, T.: Relationships between Paddy Soil Radiocesium Interception Potentials and Physicochemical Properties in Fukushima, Japan, J. Environ. Qual., 44, 780–788, https://doi.org/10.2134/jeq2014.10.0423, 2015.
Nakao, A., Uno, S., Yanai, J., Kubotera, H., Tanaka, R., Root, R. A., and Kosaki, T.: Distance-dependence from volcano for Asian dust inclusions in Andosols: A key to control soil ability to retain radiocesium, Geoderma, 385, 114889, https://doi.org/10.1016/j.geoderma.2020.114889, 2021.
Roig, M., Vidal, M., Rauret, G., and Rigol, A.: Prediction of Radionuclide Aging in Soils from the Chernobyl and Mediterranean Areas, J. Environ. Qual., 36, 943–952, https://doi.org/10.2134/jeq2006.0402, 2007.
Rouiller, J., Burtin, G., and Souchier, B.: La dispersion des sols dans l'analyse granulometrique, methode utilisant les resines echangeuses d'ions, ENSAIA, 14, 194–205, 1972.
Sawhney, B. L.: Selective Sorption and Fixation of Cations by Clay Minerals: A Review, Clays Clay Miner., 20, 93–100, https://doi.org/10.1346/CCMN.1972.0200208, 1972.
Tarsitano, D., Young, S. D., and Crout, N. M. J.: Evaluating and reducing a model of radiocaesium soil-plant uptake, J. Environ. Radioact., 102, 262–269, https://doi.org/10.1016/j.jenvrad.2010.11.017, 2011.
Uematsu, S.: Radiocaesium transfer to crops in the Fukushima affected environments: a soil chemical and plant physiological approach, KULeuven, Doctoral Thesis, 160 pp., 2017.
Uematsu, S., Smolders, E., Sweeck, L., Wannijn, J., Van Hees, M., and Vandenhove, H.: Predicting radiocaesium sorption characteristics with soil chemical properties for Japanese soils, Sci. Total Environ., 524–525, 148–156, https://doi.org/10.1016/j.scitotenv.2015.04.028, 2015.
Uematsu, S., Vandenhove, H., Sweeck, L., Van Hees, M., Wannijn, J., and Smolders, E.: Variability of the soil-to-plant radiocaesium transfer factor for Japanese soils predicted with soil and plant properties, J. Environ. Radioact., 153, 51–60, https://doi.org/10.1016/j.jenvrad.2015.12.012, 2016.
Vandebroek, L., Van Hees, M., Delvaux, B., Spaargaren, O., and Thiry, Y.: Relevance of Radiocaesium Interception Potential (RIP) on a worldwide scale to assess soil vulnerability to 137Cs contamination, J. Environ. Radioact., 104, 87–93, https://doi.org/10.1016/j.jenvrad.2011.09.002, 2012.
Vanheukelom, M.: “Vanheukelom2025_XRD-pattern”, Mendeley Data, V1 [data set], https://doi.org/10.17632/nr4f6s23k6.1, 2024.
Vanheukelom, M., Sweeck, L., Van Hees, M., Weyns, N., Van Orshoven, J., and Smolders, E.: Quantitative clay mineralogy predicts radiocesium bioavailability to ryegrass grown on reconstituted soils, Sci. Total Environ., 873, 162372, https://doi.org/10.1016/J.SCITOTENV.2023.162372, 2023.
Vanheukelom, M., Sweeck, L., Almahayni, T., De Bruyn, M., Steegmans, P., Fondu, L., Van Gompel, A., Van Hees, M., Wannijn, J., and Smolders, E.: Highly weathered mineral soils have highest transfer risk of radiocaesium contamination after a nuclear accident: A global soil-plant study, Sci. Total Environ., 945, 173583, https://doi.org/10.1016/j.scitotenv.2024.173583, 2024.
Vermeer, A. W. P., McCulloch, J. K., Van Riemsdijk, W. H., and Koopal, L. K.: Metal ion adsorption to complexes of humic acid and metal oxides: Deviations from the additivity rule, Environ. Sci. Technol., 33, 3892–3897, https://doi.org/10.1021/es990260k, 1999.
Wauters, J., Sweeck, L., Valcke, E., Elsen, A., and Cremers, A.: Availability of radiocaesium in soils: a new methodology, Sci. Total Environ., 157, 239–248, https://doi.org/10.1016/0048-9697(94)90585-1, 1994.
Wauters, J., Elsen, A., Cremers, A., Konoplev, A. V., Bulgakov, A. A., and Comans, R. N. J.: Prediction of solid/liquid distribution coefficients of radiocaesium in soils and sediments. Part one: A simplified procedure for the solid phase characterisation, Appl. Geochem, 11, 589–594, https://doi.org/10.1016/0883-2927(96)00027-3, 1996a.
Wauters, J., Vidal, M., Elsen, A., and Cremers, A.: Prediction of solid/liquid distribution coefficients of radiocaesium in soils and sediments. Part two: A new procedure for solid phase speciation of radiocaesium, Appl. Geochem., 11, 595–599, https://doi.org/10.1016/0883-2927(96)00028-5, 1996b.
Zeelmaekers, E., Vandenberghe, N., Elsen, J., Środoń, J., and KU Leuven: Computerized qualitative and quantitative clay mineralogy: introduction and application to known geological cases, Doctoral Thesis, KU Leuven, Faculteit Wetenschappen, Leuven, 397 pp., 2011.