the Creative Commons Attribution 4.0 License.
the Creative Commons Attribution 4.0 License.
 | 28 May 2024
Optimized fertilization using online soil nitrate data
Yonatan Yekutiel
Yuval Rotem
Shlomi Arnon
Ofer Dahan
A new soil nitrate monitoring system that was installed in a cultivated field enabled us, for the first time, to control the nitrate concentration across the soil profile. The monitoring system was installed in a full-scale agricultural greenhouse setup that was used for growing a bell pepper crop. Continuous measurements of soil nitrate concentrations were performed across the soil profile of two plots: (a) an adjusted fertigation plot, in which the fertigation regime was frequently adjusted according to the dynamic variations in soil nitrate concentration, and (b) a control plot, in which the fertigation was managed according to a predetermined fertigation schedule that is standard practice for the area.
The results enabled an hourly resolution in tracking the dynamic soil nitrate concentration variations in response to daily fertigation and crop demand. Nitrate–nitrogen (N–NO3) concentrations in and below the root zone, under the control plot, reached very high levels of ∼ 180 ppm throughout the entire season. Obviously, this concentration reflects excessive fertigation, which is far beyond the plant demand, entailing severe groundwater pollution potential. On the other hand, frequent adjustments of the fertigation regime, which were carried out under the adjusted fertigation plot, enabled control of the soil nitrate concentration around the desired concentration threshold. This enabled a substantial reduction of 38 % in fertilizer application while maintaining maximum crop yield and quality. Throughout this experiment, decision-making on the fertigation adjustments was done manually based on visual inspections of the soil's reactions to changes in the fertigation regime. Nevertheless, it is obvious that an algorithm that continuously processes the soil nitrate concentration across the soil profile and provides direct fertigation commands could act as a “fertistat” that sets the soil nutrients at a desired optimal level. Consequently, it is concluded that fertigation that is based on continuous monitoring of the soil nitrate concentration may ensure nutrient application that accounts for plant demand, improves agricultural profitability, minimizes nitrate down-leaching and significantly reduces water resource pollution.
- Article
(3425 KB) - Full-text XML
- BibTeX
- EndNote


Groundwater pollution by nitrate constitutes one of the main factors in freshwater disqualification worldwide (Li et al., 2021; Abascal et al., 2022). High nitrate levels in drinking water have been correlated to health issues, such as digestive tract cancer (Powlson et al., 2008; Picetti et al., 2022) and blue baby syndrome (Knobeloch et al., 2000). In addition, excessive nitrate in the environment leads to algal blooms that, in turn, cause eutrophication and hypoxia in surface waterbodies, such as rivers, lakes and even oceans (Bijay-Singh and Craswell, 2021; Górski et al., 2019; Zhang et al., 2021; Wang et al., 2018; Scavia and Bricker, 2006). Water resource pollution by nitrate is primarily attributed to intensive agricultural fertilizer application (Li et al., 2023; Rahmati et al., 2015; Gu et al., 2013; Zhang et al., 2014). Excessive fertilization results in the down-leaching of nitrate from the soil through the unsaturated zone to the groundwater. Ultimately, polluted groundwater naturally discharges to associated surface waterbodies (Lasagna et al., 2016) or is pumped from abstraction wells for direct use.
Nitrogen use efficiency in agriculture refers to the fraction of nitrogen from the applied N fertilizer that is consumed by the plant. Unfortunately, on a global scale, nitrogen use efficiency is very low, with an estimated worldwide average of 55 % (FAO, 2022). Accordingly, any attempt to control nitrogen pollution in water resources requires fertilizer management that follows the actual dynamics of crop nitrogen demand, avoids excess fertilization and prevents nitrate leaching from the soil to the groundwater. This currently constitutes one of the greatest environmental challenges and a critical milestone for sustainable agriculture.
Presently, agricultural fertilization management relies mainly on predetermined programs that are based on farmers' experience, expert knowledge and fertilizer manufacturers' recommendations, all of which primarily aim to maximize crop yield. In practice, none of these fertilization practices correspond well with the actual dynamics of fertilizer mobility in the soil and plant uptake. Hence, most commonly, fertilization programs are deliberately designed for excess fertilization to prevent potential nutrient deficiencies and yield reduction. As a result, a major portion of the N fertilizers end up as nitrate, which is either transported with the irrigation water below the root zone to the groundwater or is transformed into N oxides, which may be released into the atmosphere (Minikaev et al., 2021). Unfortunately, the lack of real-time information on the nutrient concentration in the soil during the growing season pushes farmers toward undesirable excessive fertilization, regardless of the devastating environmental consequences.
Traditionally, controlled agricultural experiments have provided the basis for all agricultural development and fertilization protocols (Salvagiotti et al., 2008; Westermann and Kleinkopf, 1985). Obviously, these experiments primarily aim to achieve the highest yield while increasing nitrogen efficiency and reducing the overall costs of agricultural inputs (Cui et al., 2008; Li et al., 2007; Lollato et al., 2019; Piri and Naserin, 2020; Kurtzman et al., 2021; Nkebiwe et al., 2016). Such experiments naturally span over timescales of years, and implementing their results in the agricultural industry may take much longer. Along with field agricultural experiments, optimizing fertilization regimes is often investigated through numerical simulations, which are validated using data from field and controlled experiments (Zhang et al., 2020; Rezayati et al., 2020; Tafteh and Sepaskhah, 2012; Azad et al., 2019; Xu et al., 2020; Sela et al., 2018; Levy et al., 2017). Despite their robustness, numerical simulations require many variables, which depend on crop type, soil properties, atmospheric conditions, plant uptake, etc. (Šimůnek et al., 2016). Unfortunately, these variables are often very vague, with a wide range in terms of spatial and temporal variability, which reduces the applicability for large-scale or variable environmental conditions (Weissman et al., 2022). Moreover, these methodologies do not provide a real-time response to the temporal variation in soil nutrient conditions, which often results in over-fertilization.
Fertilization adjustment during the growing season is often based on measurements of the plant's state. These are often carried out through either tissue analysis, such as of chlorophyll content (Bijay-Singh and Ali, 2020; Mohamed Ali et al., 2015), or leaf spectral measurement (Bijay-Singh et al., 2015; Feng et al., 2008). These methods provide important indications of plant “health”. Nevertheless, due to the time lag in the plant's natural response to the soil nutrient state, observable phenotypic changes provide late indications of nutrient problems in the soil. Moreover, these methods can only detect nutrient deficiency and are not effective in detecting nutrient excess, which is a key factor in reducing environmental pollution.
Soil nutrient content is commonly determined through either water extraction from soil samples or analysis of soil porewater obtained by suction cups (suction lysimeters) (Carter and Gregorich, 2007). These water samples are then analyzed through standard laboratory techniques or through the use of on-site field analytical kits (Schmidhalter, 2005; Yamin et al., 2020). However, these soil and water analyses are expensive and time-consuming, which drives farmers and agricultural consultants to adopt over-fertilization practices to maximize yield. Recently, spectral methods to analyze soil nutrient content have also been developed (Zhang et al., 2016). However, nutrient mobility in the soil, which is controlled by the water and fertilizer application methodologies, along with the diurnal and seasonal root uptake, results in dynamic fluctuations of the nutrient concentration across the soil profile (Dahan et al., 2014; Turkeltaub et al., 2016). Often, nutrient concentration fluctuations in the soil range over several orders of magnitude, from a very low concentration, considered to indicate nutrient deficiency, to a very high concentration, considered to be excessive or even harmful to the crop (Wolf et al., 2023; Wey et al., 2022). Therefore, optimal fertilizer adjustment that accounts for the actual crop nutrient demand and that avoids excessive fertilization cannot rely solely on sporadic analyses of the soil nutrient state. Accordingly, optimization of fertilizer application and prevention of water resource pollution require real-time adjustments of fertilizer and water applications that account for the actual variations in soil nutrient concentration.
In this study, a novel soil nitrate monitoring system (SNS) (Yeshno et al., 2019), which enables continuous in situ measurements of the soil nitrate concentration, was implemented in a full-scale field agricultural experiment. The study aimed primarily at high-resolution characterization of the dynamic variations in soil nutrient concentration across the soil profile in response to variations in fertigation pattern. Accordingly, continuous data on variations in soil nitrate content enable frequent adjustment of the fertigation regime in an attempt to achieve the desired nutrient concentration across the soil profile. The SNS is based on continuous analysis of the soil porewater using UV absorption spectroscopy combined with an algorithm for eliminating DOC interference with nitrate measurements (Yeshno et al., 2021). Although nitrate is one component out of nitrogen forms, it is an important indicator of the N-fertilizer state in the soil. In most agricultural soils (aerobic conditions), other forms of N fertilizers (e.g., ammonium and organic nitrogen) eventually transform into nitrate through nitrification processes. Moreover, as opposed to other N forms, which tend to be absorbed by the soil, nitrate is a mobile form that is easily transported by percolating water and is, therefore, responsible for most environmental N pollution. Accordingly, the objective of this study is to enable fertilizer application adjustments during the growing season in an agricultural field based on real-time continuous measurements of soil nitrate concentrations across the soil profile. Ultimately, real-time adjustment of fertilizer application aims to achieve desired nitrate concentrations across the soil profile while preserving optimal crop yield.
2.1 Soil nitrate monitoring system
A custom-made soil nitrate monitoring system was constructed in Ben-Gurion University laboratories, in cooperation with DOTS Ltd (patent no. US20200072737A1). The SNS enables real-time continuous monitoring of nitrate concentrations across the soil profile. The SNS's technical structure has been described in previous publications (Yeshno et al., 2019, 2021). Therefore, only a brief overview of the system structure is provided here. The SNS consists of a UV light source and a UV–VIS spectrometer that measures the absorbance properties of soil porewater within an optical flow cell. The flow cells are connected to customized suction cups that are installed at the desired depths across the soil profile. The SNS control panel contains a pumping system that generates a continuous low flux of soil porewater (<10 mL h−1) through the optical flow cell. Each suction cup has its own optical flow cell for spectral analysis and real-time determination of the soil nitrate concentration across the soil profile. In addition, the SNS enables automated collection of the soil porewater for validation and calibration through lab chemical analysis. Customized suction cups, designed with a small dead volume and high sampling capacity, are connected to the optical flow cell through small-diameter tubing (1.6 mm inner diameter) to minimize the dead volume between the monitored zone in the soil and the optical flow cell in the control panel.
2.2 Study site
The experiment was conducted during the bell pepper growing season at the Yair Agricultural R&D Center, Central Arava Valley, Israel (30°46′40.1′′ N, 35°14′21.8′′ E). The region is a hyper-arid desert with average annual precipitation of 28 mm and potential evaporation of 4400 mm yr−1 (Israel Meteorological Service, 2013). Despite these harsh conditions, this region has been intensively cultivated for over 6 decades using local groundwater combined with sophisticated floodwater harvesting systems and agricultural technologies. In recent years, a growing component of desalinated water has been introduced to the valley water system. Unfortunately, intensive agriculture in the area has resulted in severe degradation of the groundwater quality, which is mainly reflected in elevated nitrate concentrations and salinity (Shalev et al., 2015).
2.3 Experimental setup
Bell peppers (Capsicum annuum, Cannon and Galiano varieties) were planted in a mesh greenhouse (30 m × 25 m (750 m2)) on 10 August 2021, and the growing season lasted 9 months till 30 April 2022. A total of 12 harvests were performed during the season, and the fruits were counted, weighed and sorted according to their quality.
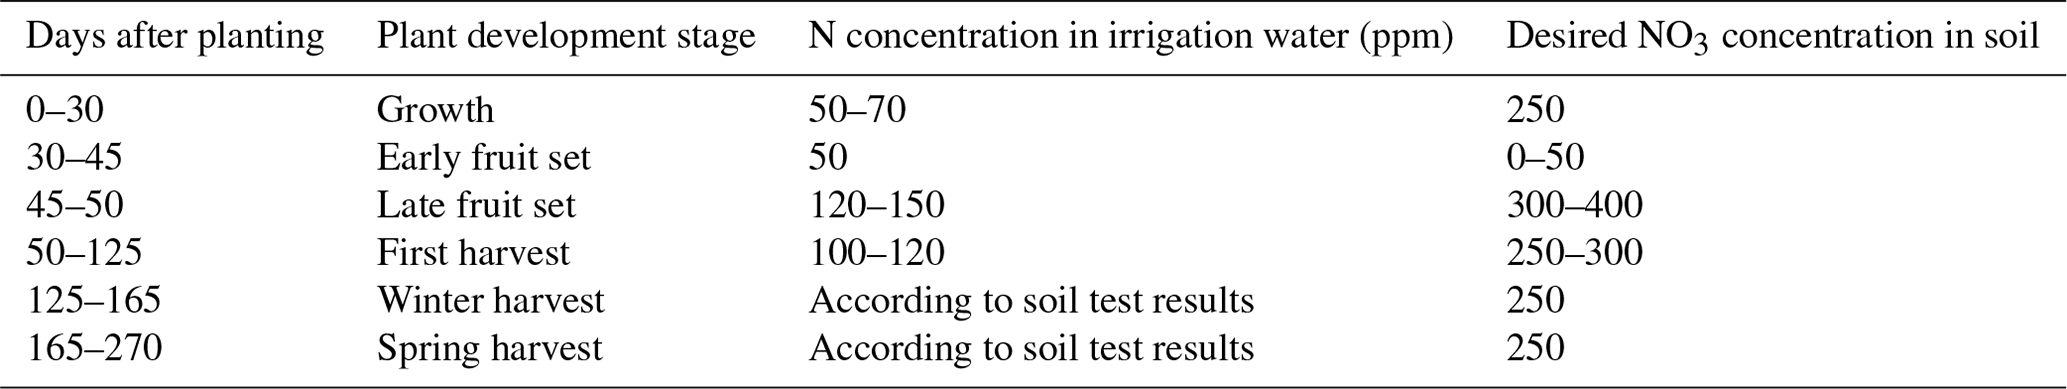
Nitrate concentration in the soil porewater was monitored by the SNS with an hourly resolution at 18 points, which were distributed over three depths (20, 40, 60 cm) in three replicates under two plots, experimental (adjusted fertigation) and control (Fig. 1). In addition, water content sensors (GS3, METER Group, Pullman, WA, USA) were installed adjacently to the suction cups in the adjusted fertigation plot. Bell pepper plants typically have a shallow root system, where ∼ 80 % of the root length density is concentrated in the upper 30 cm of the soil profile, with almost no roots below 40 cm depth (Kong et al., 2012). Hence, nitrate measurements at depths of 20 and 40 cm are considered to represent the active part of the root zone for nutrient and water uptake, and nitrate presence at 60 cm is considered to be lost to down-leaching to the groundwater. The control treatment had a predetermined fertilization regime that relies on the standard practice growth protocol in the Arava region (Appendix A). Fertigation of the adjusted fertigation plot was frequently manipulated according to the observed variations in soil nitrate concentration. Due to operational delays, reliable SNS measurements started 100 d after plantation and continued successfully for a period of 5 months until the last harvest, 260 d after plantation.
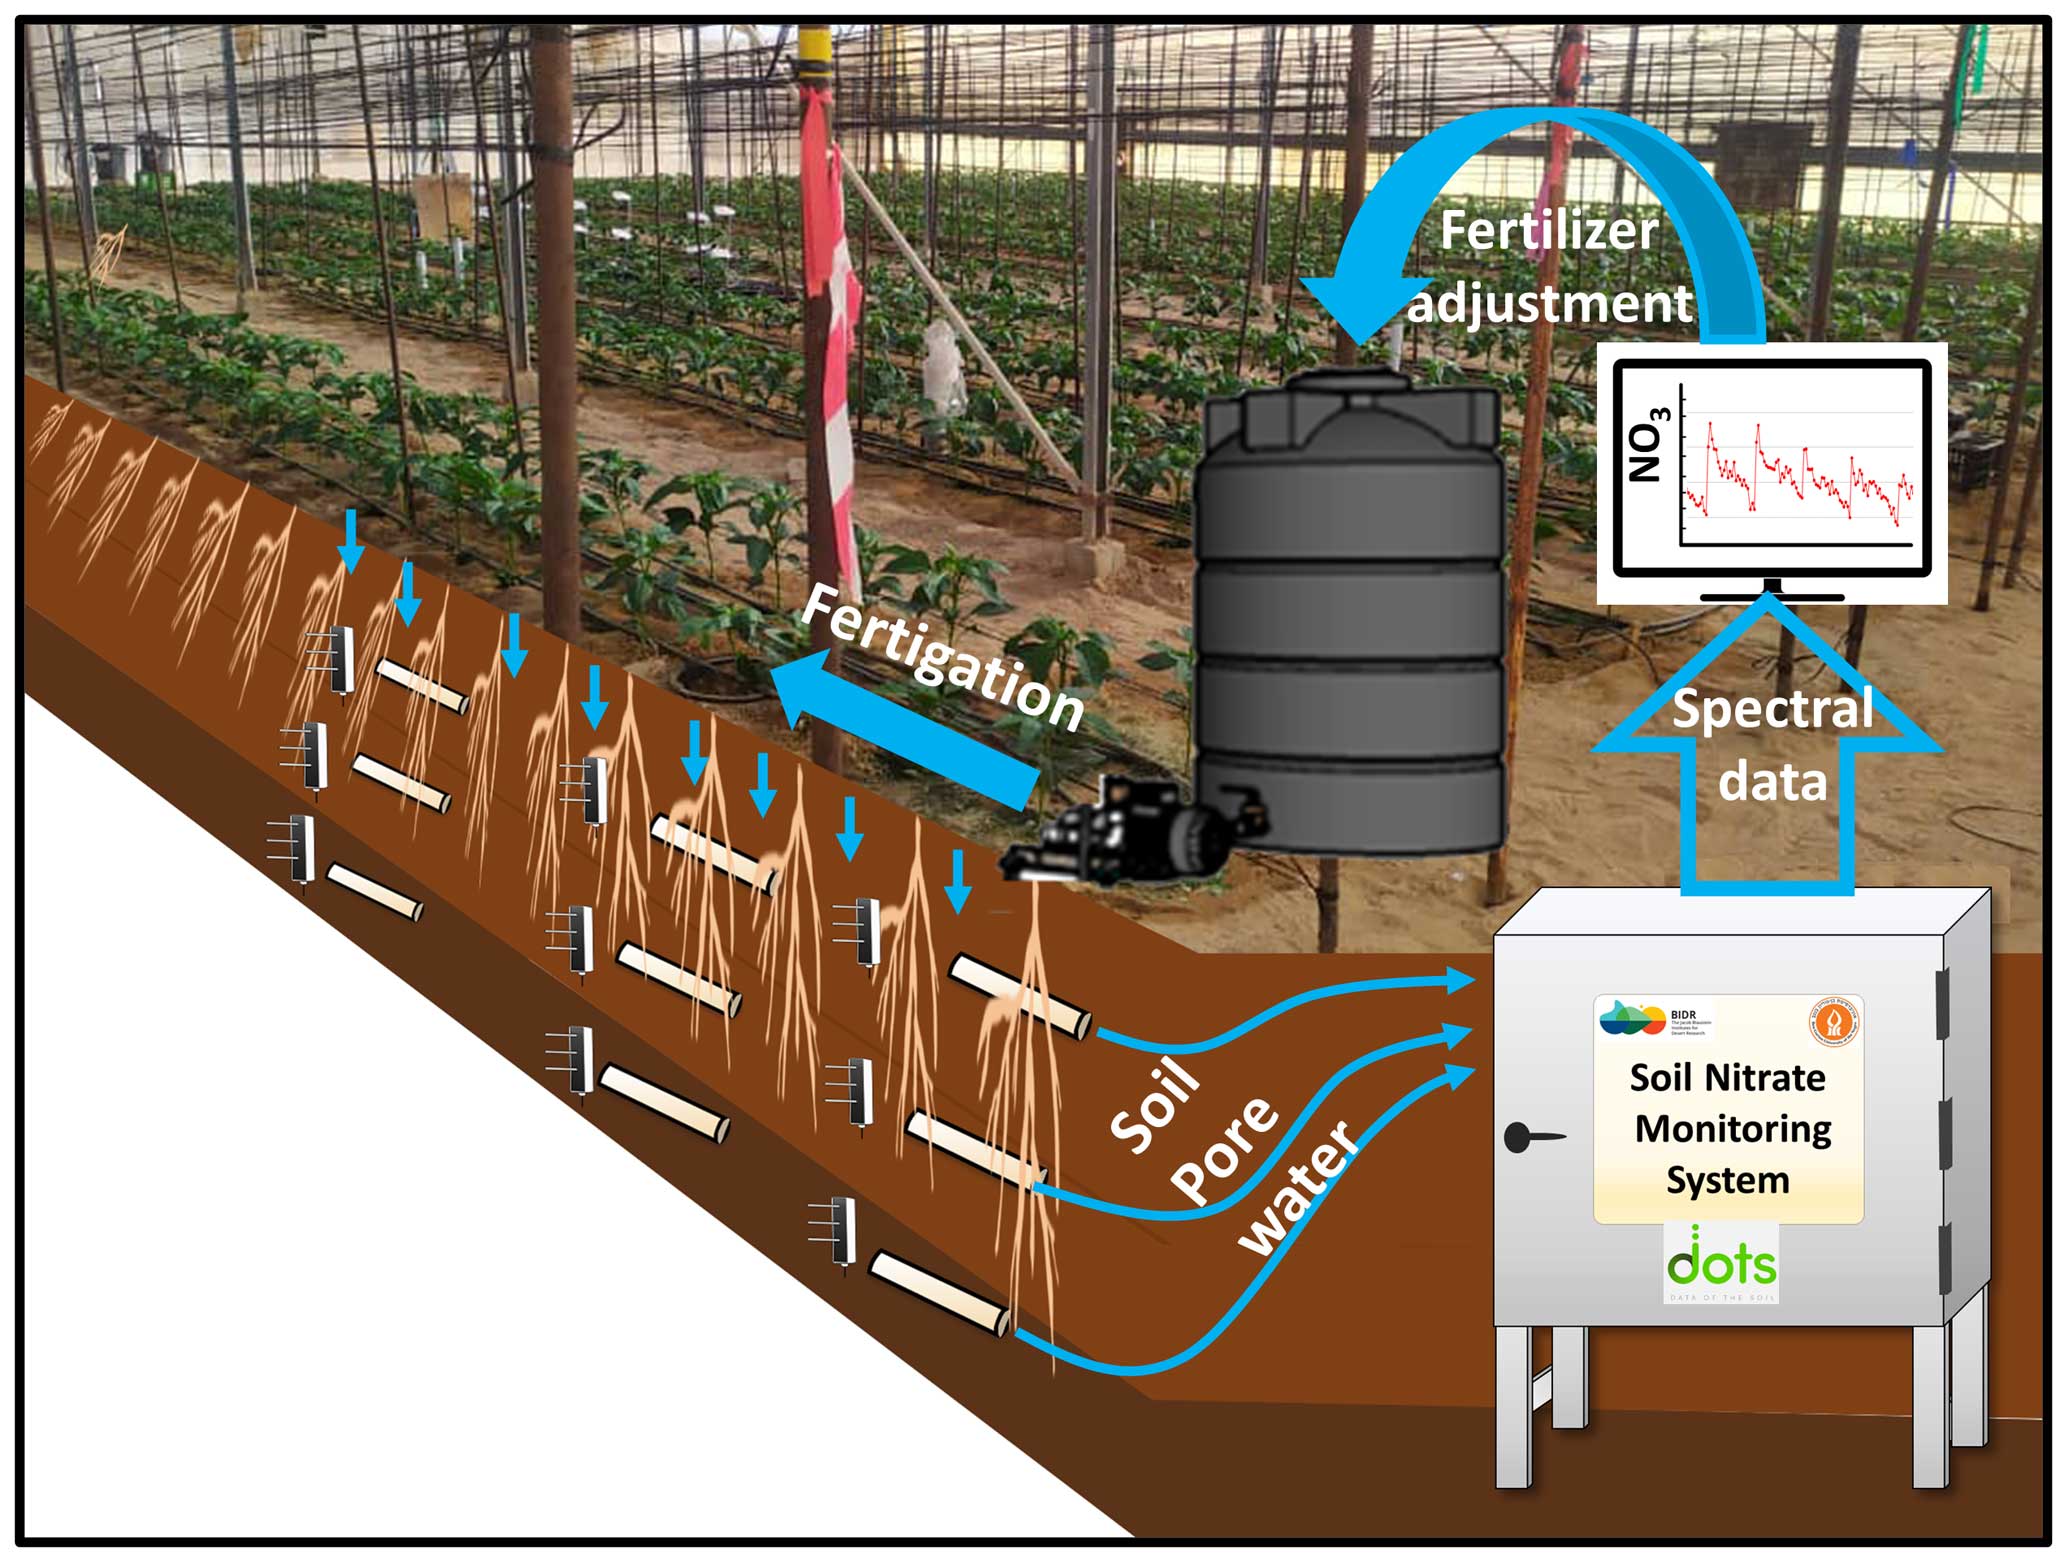
Figure 1Schematic illustration of the soil nitrate monitoring setup and fertigation adjustment process.
The greenhouse consists of 40 plots, 12.5 m × 1.5 m each. The two treatments had eight randomly distributed repetitions, while eight plots were used for margins, and others were allocated to different experiments, which are not reported in this paper. Each plot had two plant rows spaced 40 cm apart and with a 40 cm distance between plants. Irrigation was conducted using a drip line (Netafim, 1.6 L h−1) at 40 cm drip intervals along the line. Accordingly, the plant density was 3.3 plants m2. The soil in the growing pad consisted of imported well-drained coarse sand (86 % sand, 8.5 % silt, 5.5 % clay, 2 % Corganic, pH = 7.89). Irrigation water for agriculture in the area mainly comes from brackish water from local aquifers diluted with some desalinated drinking water, which yields water with an EC of ∼ 2–2.5 mS cm−1. Fertigation was based on liquid fertilizer NPK 7-3-7 (Arava, ICL group), in which 66.6 % of the N is in nitrate form, and 33.3 % is ammonium. The fertilizer was diluted in a tank and applied through the drip irrigation system by a fertilizer injector. Both treatments were irrigated once or twice every day.
Throughout the first stages of the experiment, manipulations of the fertigation regime in the adjusted fertigation plot were primarily aimed at investigating the dynamic variations in nitrate concentration across the soil profile in response to variations in fertilizer and water application. Later, real-time data on variations in nitrate concentration across the soil profile were used to achieve the desired concentration range. In this experiment, we defined a soil nitrate concentration threshold of 45 mg L−1 N–NO3 as the minimal desired value to prevent nutrient shortage and to achieve a healthy crop. Although nitrate concentrations of ∼ 25–30 mg L N–NO3 should be sufficient to avoid yield loss (Kurtzman et al., 2021), here we deliberately aimed for higher threshold concentrations since this experiment is pioneering and aimed to investigate the ability to control the soil nutrient concentration and not necessarily to reach the lowest possible concentration. Accordingly, fertilization adjustments were primarily made to maintain the soil nitrate concentration at or above the threshold levels.
2.4 Calibration and validation
To measure nitrate concentration with UV absorption spectroscopy, a multiwavelength method with a stepwise regression was implemented to overcome DOC interference (Etheridge et al., 2014). Calibrating the nitrate concentration was carried out through a set of soil porewater solutions that were collected from the field. The water samples were collected from different points in the field and, therefore, contained a range of DOC and nitrate concentrations. The initial DOC values of the soil water samples were measured using an Analytik Jena multi-N/C 2100s TOC/TN analyzer and nitrate concentrations by Dionex ICS-5000 Ion Chromatography. To include a wide range of nitrate levels, as one would expect to find in agricultural fields, some of the samples were spiked with KNO3. Overall, 20 water samples of known nitrate and DOC concentrations were taken, ranging from 5 to 25 ppm DOC and from 20 to 170 ppm N–NO3. A stepwise regression was used to determine the linear combination of wavelengths in the nitrate absorption range, which can predict the solution's known concentration. Stepwise regression is a dimensionality reduction method that removes less important predictors with an automatic iterative process. By the end of the process, the stepwise algorithm yields a set of significant predictors, which are assigned their coefficient following Eq. (1):
where xn is a specific wavelength, xn is the corresponding coefficient, and a0 is an intercept. Here, we identify a set of seven predictors that yield good results, and all the predictors are statistically significant with a coefficient of determination (R2) of 0.976 and a root mean square error (RMSE) of 8.33 (Table 1).
Table 1Selected wavelength and their coefficients for N–NO3 concentration prediction.

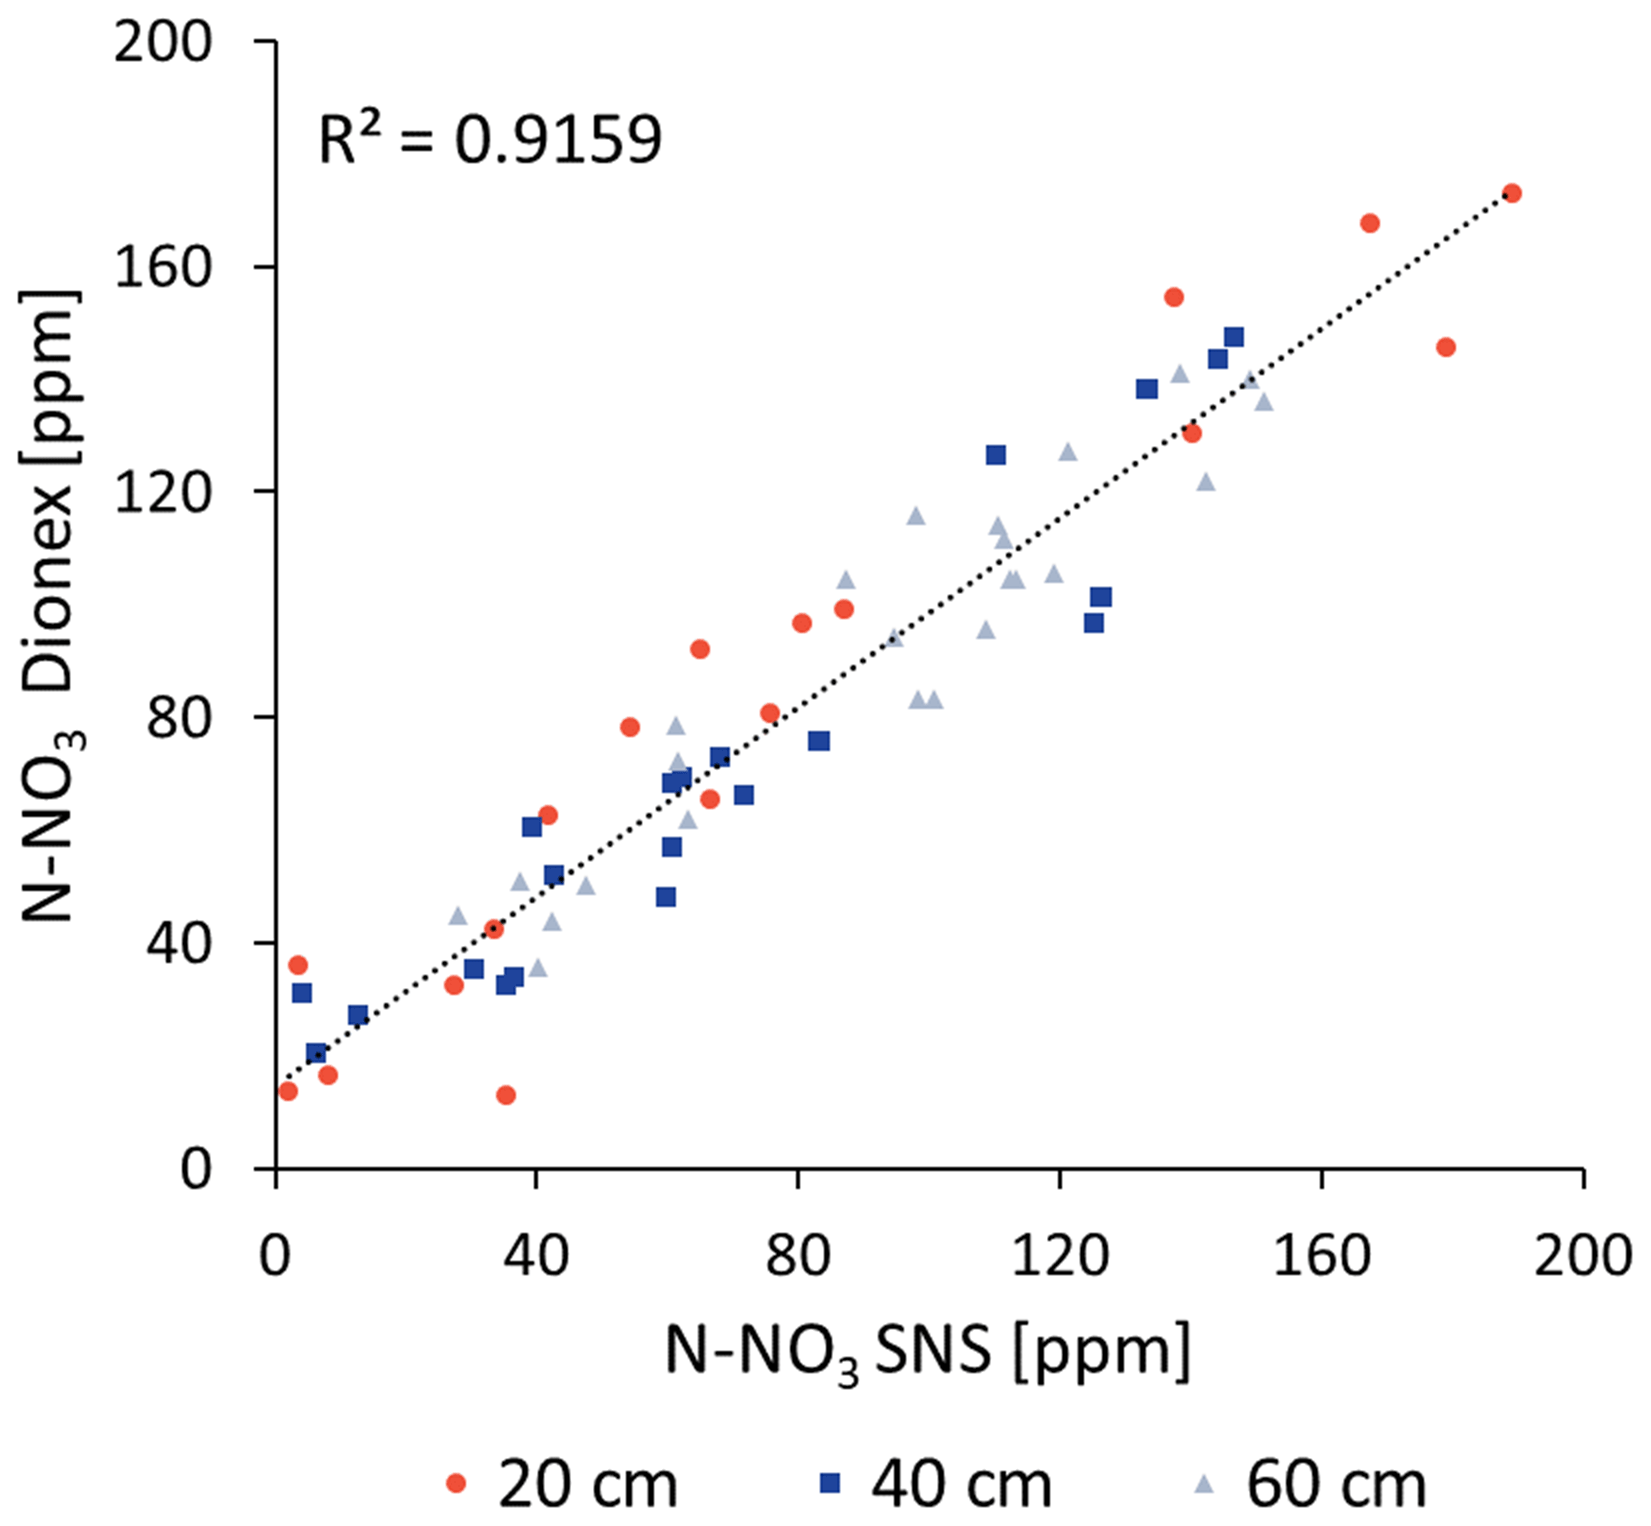
To validate the accuracy of the SNS spectral measurements, water extracted by the SNS was sampled approximately once every 2 weeks and analyzed through the standard laboratory method. The samples were filtered through a 0.45 µm filter and were stored refrigerated at a temperature of 4 °C. Over the entire period (160 d), 60 samples were randomly selected (∼ 20 samples for each depth from three different locations) for nitrate lab analysis using Dionex ICS-5000 Ion Chromatography. Comparing the nitrate concentration measurements that were continuously taken in the field by the SNS with the nitrate concentration measurements of the water samples that were frequently collected indicated high accuracy and reliability (R2 of 0.916 and an RMSE of 11.5) (Fig. 2). It should be noted that, while the SNS measured the nitrate concentration online in the flow cell, the water sample that was used for validation was a cumulative sample that was collected over several hours in a sampling cell. In light of the diurnal variation in concentration (see “Results and discussion” section with regard to diurnal variations in soil nitrate concentration), it is obvious that some differences between the online SNS measurement and the cumulatively collected water sample are expected.
3.1 Controlling soil nitrate concentrations
In the following, we present the dynamic variations in nitrate concentration and water content across the adjusted fertigation plot's soil profile in response to variations in fertilizer and water application (Fig. 3). Soil nitrate concentration is presented as the daily average of the hourly measurements at the three different measuring points for each depth (Fig. 3a). The soil water content is presented as the average values of three spatial points at an hourly resolution (Fig. 3b).
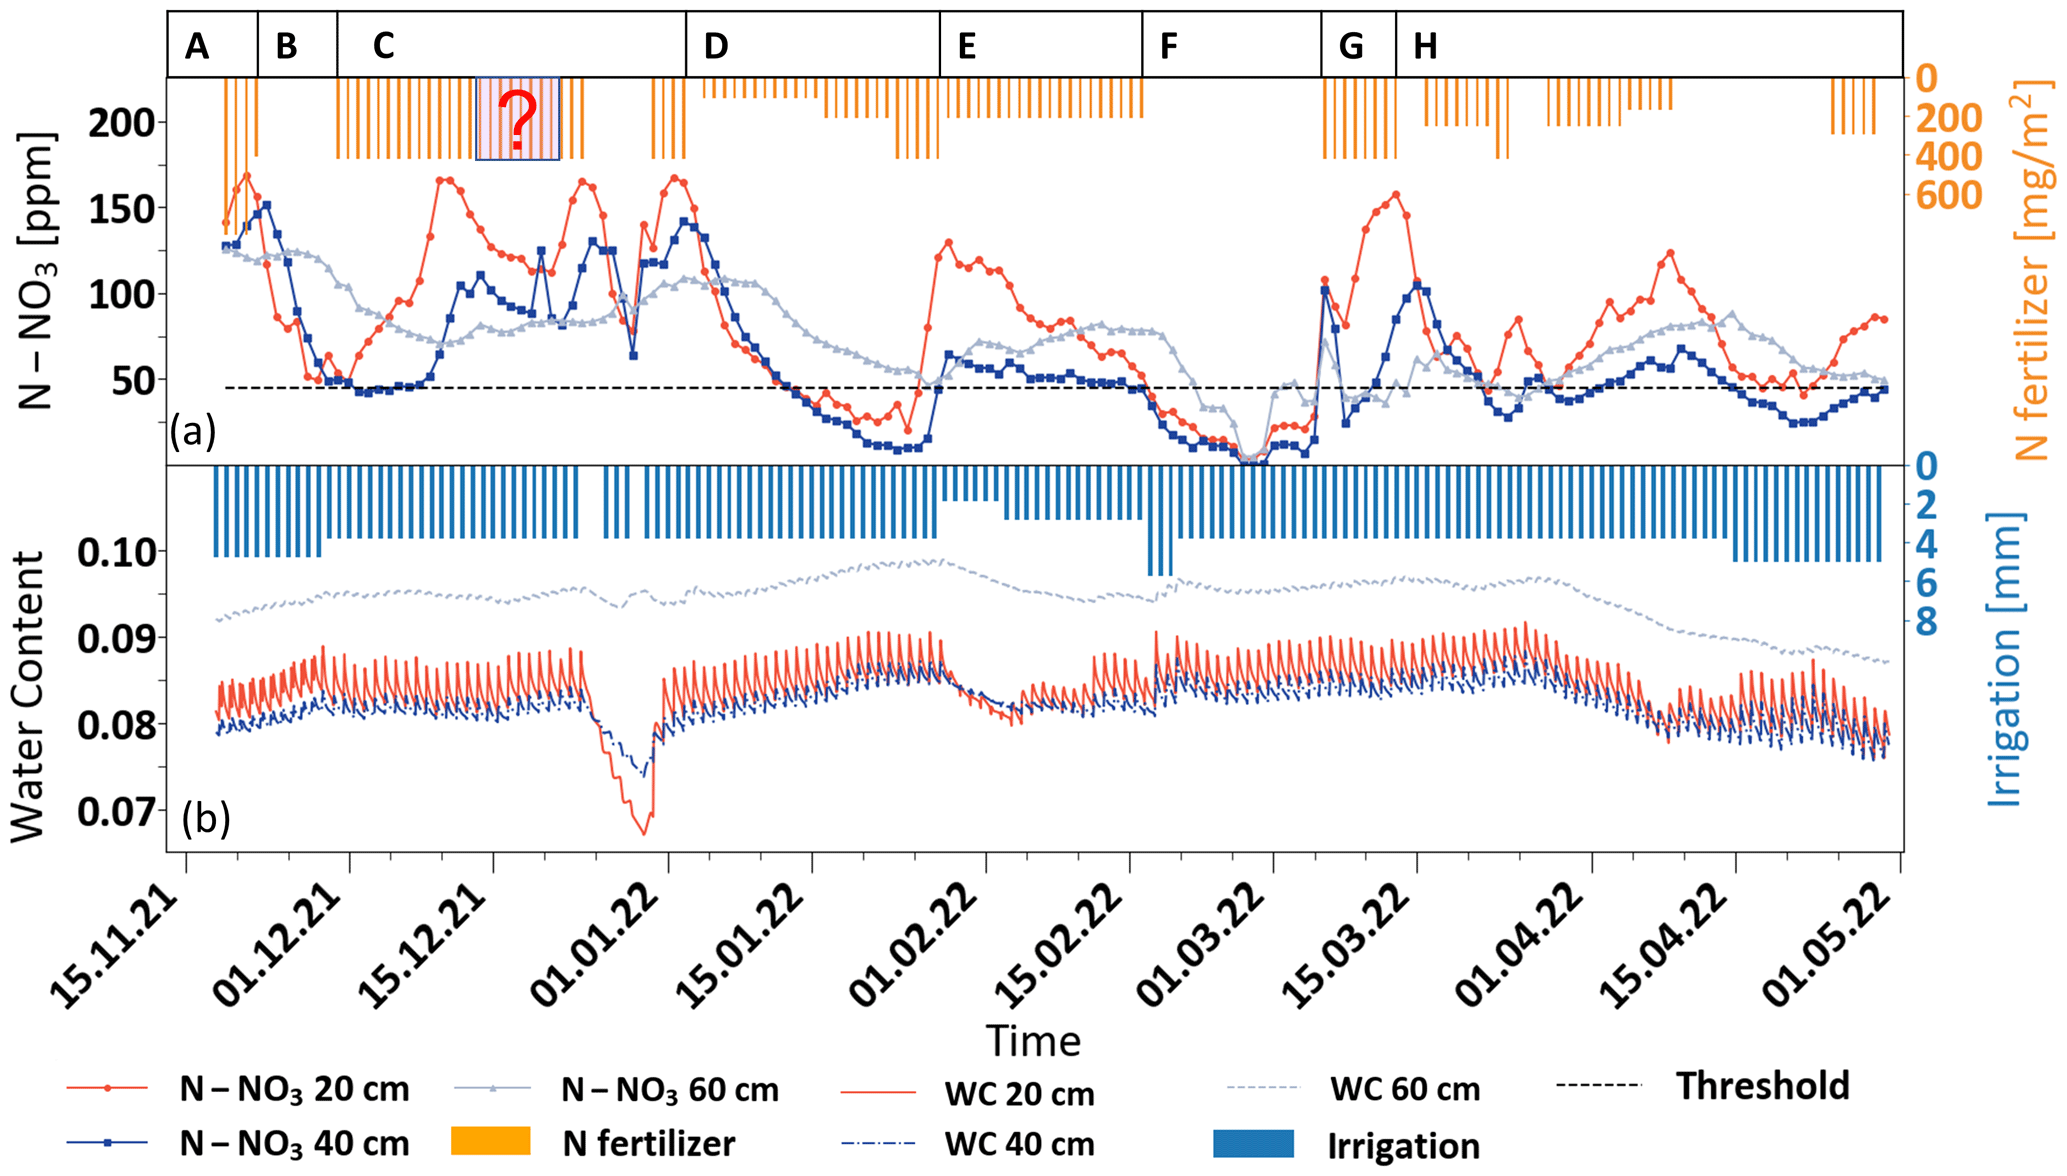
Figure 3Variations in soil nitrate concentration (a) and water content (b) in the adjusted fertigation plot during the growing season, along with the daily irrigation and N-fertilizer application.
The variations in both nitrate concentration and soil moisture are presented, along with the irrigation and fertilization application quantities. During the first 100 d of the growing season, the water and fertilizer application in both plots was mostly fixed, with approximately 4 mm d−1 water and 425 mg m−2 d−1 N fertilizer (equivalent to 106 ppm N in the irrigation water). For convenience, variations in the irrigation and fertilizer amounts will be described here as a percentage of the fixed amount that is the standard practice in the region (Appendix A).
As soon as the nitrate measurements began (100 d after plantation), N–NO3 concentrations across the entire soil profile exhibited extremely high values, ranging from 140 to 170 ppm (stage A in Fig. 3a). This concentration range is ∼ 6 times higher than the maximum concentration viable for plant uptake (Kurtzman et al., 2021). The daily fluctuations in soil water content across the profile provide a clear indication that, during this stage, a substantial flux of nitrate leaches down from the root zone to deep sections of the unsaturated zone and ultimately to the groundwater (stage A in Fig. 3b).
Following the observation of the very high soil nitrate concentration under the common fertigation program, fertilizer application was completely halted under the adjusted fertigation plot for a period of 8 d (stage B in Fig. 2a). During this time, water application was maintained at 100 % of the prescribed dose. As a result, the nitrate concentrations at depths of 20 and 40 cm dropped dramatically to the threshold concentration (∼ 45 ppm N–NO3) at a rate of ∼ 40 ppm d−1. At a depth of 60 cm, a gradual decrease in nitrate concentration only started 5 d later, reaching a minimum concentration value of 65 ppm N–NO3 13 d later at a rate of ∼ 11 ppm d−1. Obviously, the observed reduction in nitrate concentration may be attributed to both plant consumption and to transport and down-leaching. After the nitrate concentration in the root zone reached the threshold values, fertigation resumed at 100 %, and the nitrate concentration at 20 cm immediately rose to 170 ppm N–NO3 (stage C in Fig. 3a). Deeper in the soil profile, at a depth of 40 cm, the nitrate concentration increase was delayed for 2 d at ∼ 100 ppm N–NO3. During this period, the nitrate concentration below the root zone at a depth of 60 cm remained stable at ∼ 65 ppm N–NO3. This stage enabled a definition of the time lag that is required to achieve a significant decrease in nitrate concentration in the profile following a reduction in fertilizer application, along with the recovery time after fertilizer re-application. Moreover, the concentration differences between the depths reflect both the root uptake and the unavoidable nitrate down-leaching to the unsaturated zone under these conditions. Note that, during stage C, there were two periods with unexpected decreases in nitrate concentration, which are especially notable at the 20 cm depth. Both are obviously a direct indication of a failure in fertilizer application. While the first period was unnoticed and not recorded (marked by a question mark on the fertilizer application bars), the second reduction in nitrate concentration raised an alarm for a system check, and, indeed, a break in fertilizer application was detected and fixed. As a result, the nitrate concentration in the soil rose again to the maximum value of 170 ppm N–NO3 at 20 cm and 135 ppm N–NO3 at 40 cm.
Since, during stage C, the concentration in the soil rose again to undesirably high levels, an adaptive fertilization regime was implemented (stage D in Fig. 3). In this stage, the fertilizer application was evaluated according to the actual measured soil nitrate concentration, and the fertilizer amount was frequently changed, while the irrigation amount remained fixed. Reducing the fertilizer amount to 25 % resulted in an immediate and sharp concentration drop toward the threshold. To avoid a nitrate concentration decrease below the threshold values, fertilizer application was increased to 50 %. However, the decreasing trend did not stop, and a few days later, the concentration dropped below the threshold. Hence, 100 % fertilizer amounts were implemented again, and the nitrate concentration at 20 cm quickly rose to undesirably high values (130 ppm N–NO3). Throughout this period, a gradual decrease in nitrate concentration, from ∼ 90 to ∼ 45 ppm N–NO3, was also observed at 60 cm, providing encouraging indications of a reduction in nitrogen flux from the root zone down to the deep unsaturated zone.
Even though stage D provided significant potential to control the nitrate concentration in the root zone, the concentration below the root zone was still high, reaching ∼ 45 ppm N–NO3, which is far above the requirement for safe groundwater recharge (Council Directive, 1991). However, this stage was conducted with a fixed amount of irrigation water and variable fertilizer applications. To reduce nitrate leaching below the root zone, the fertilizer dose was reduced to a fixed value of 50 %, while the irrigation amount was changed in an attempt to reduce nitrate transport below the root zone (stage E in Fig. 3). It has been hypothesized that, since the soil is composed of coarse sand, excessive irrigation leads to the leaching of water with a high nitrate concentration below the root zone before the plant uptake is completed. Accordingly, it has been hypothesized that reduced water application could increase nitrate retention in the root zone. During the first 6 d of stage E, the irrigation was reduced to 50 %. As a result, the nitrate concentration at 20 cm gradually dropped, while at 40 cm, the concentration remained near the threshold values. As expected, the reduction in water application resulted in a decrease in water content at all depths (stage E in Fig. 3b). However, water shortages in the soil resulted in increased salinity that was noticed on the plant as leaf damage. Hence, irrigation was increased to 75 % for 8 d and later to 100 % for an additional 6 d. Soil salinity was enhanced since this field is irrigated with high-EC brackish water (2–2.5 mS cm−1). As such, preventing salinity impacts requires a high leaching fraction to avoid salt accumulation. To prevent salinity damage to the crop, the irrigation was increased to 150 % for 3 d to wash away the accumulated salts and to allow plant recovery.
During stage F (18 d), no fertilizer was applied due to a technical failure in the fertilization system. However, water application was maintained at a level of 100 %. Obviously, this resulted in soil wash-down, which was reflected in a dramatic decrease in nitrate concentrations at all depths to practically zero concentration, which is obviously below the desired threshold and dangerous to the crop. Accordingly, in stage G, fertilizer application was intentionally increased again to 100 %, although it is obvious that the concentration in the soil would rise again beyond the desired levels. At this stage, no attempt to maintain nitrate levels at the concentration threshold was made to allow other research groups in the project to examine the relation between soil nitrate concentration increase and nitrous oxide (N2O) emissions. This part is beyond the scope of this paper.
To reduce the magnitude of fluctuations around the threshold, it has been concluded that daily evaluation of variations in the concentration trend is necessary for proper decision-making on the fertigation regime (stage H in Fig. 3). In this stage, the irrigation was kept constant at 100 %, while the fertilizer was adjusted daily according to the measured variations in nitrate concentration across the soil profile. During the last 50 d of the growing season, one out of four fertilization regimes was selected for application: 100 %, 50 %, 25 % or 0 %. It should be noted that this approach was conservatively biased to satisfy the plant needs and to prevent concentration drops below the threshold value while considering the fact that a change in the fertilization regime can affect the soil at a lag time of 2–3 d. This fertigation approach successfully decreased the nitrate concentration in the root zone and partially stabilized the concentrations around the desired threshold. Accordingly, it may be concluded that frequent adjustment of fertilizer application can improve the ability to control the fertilization regime at the desired threshold. However, the nitrate concentration at 60 cm, which represents the leachate concentration, was still very high at 45–90 ppm N–NO3, similarly to the concentration in the root zone. Obviously, this is a direct result of the low irrigation efficiency, which is dictated by the irrigation water's high salinity. Nevertheless, during stage H, when the nitrate concentration in the root zone was preserved slightly above the desired threshold, the fertilizer application was only 52 % of the recommended amount.
Soil nitrate measurements under the control plot show that, for most of the season, the soil nitrate concentration remained significantly high, ranging from approximately ∼ 110 to ∼ 180 ppm N–NO3 at all depths (Fig. 4). Note that fertigation of this plot was presumably fixed on daily rates, which were pre-scheduled according to the recommendation for growers in this region (Appendix A).
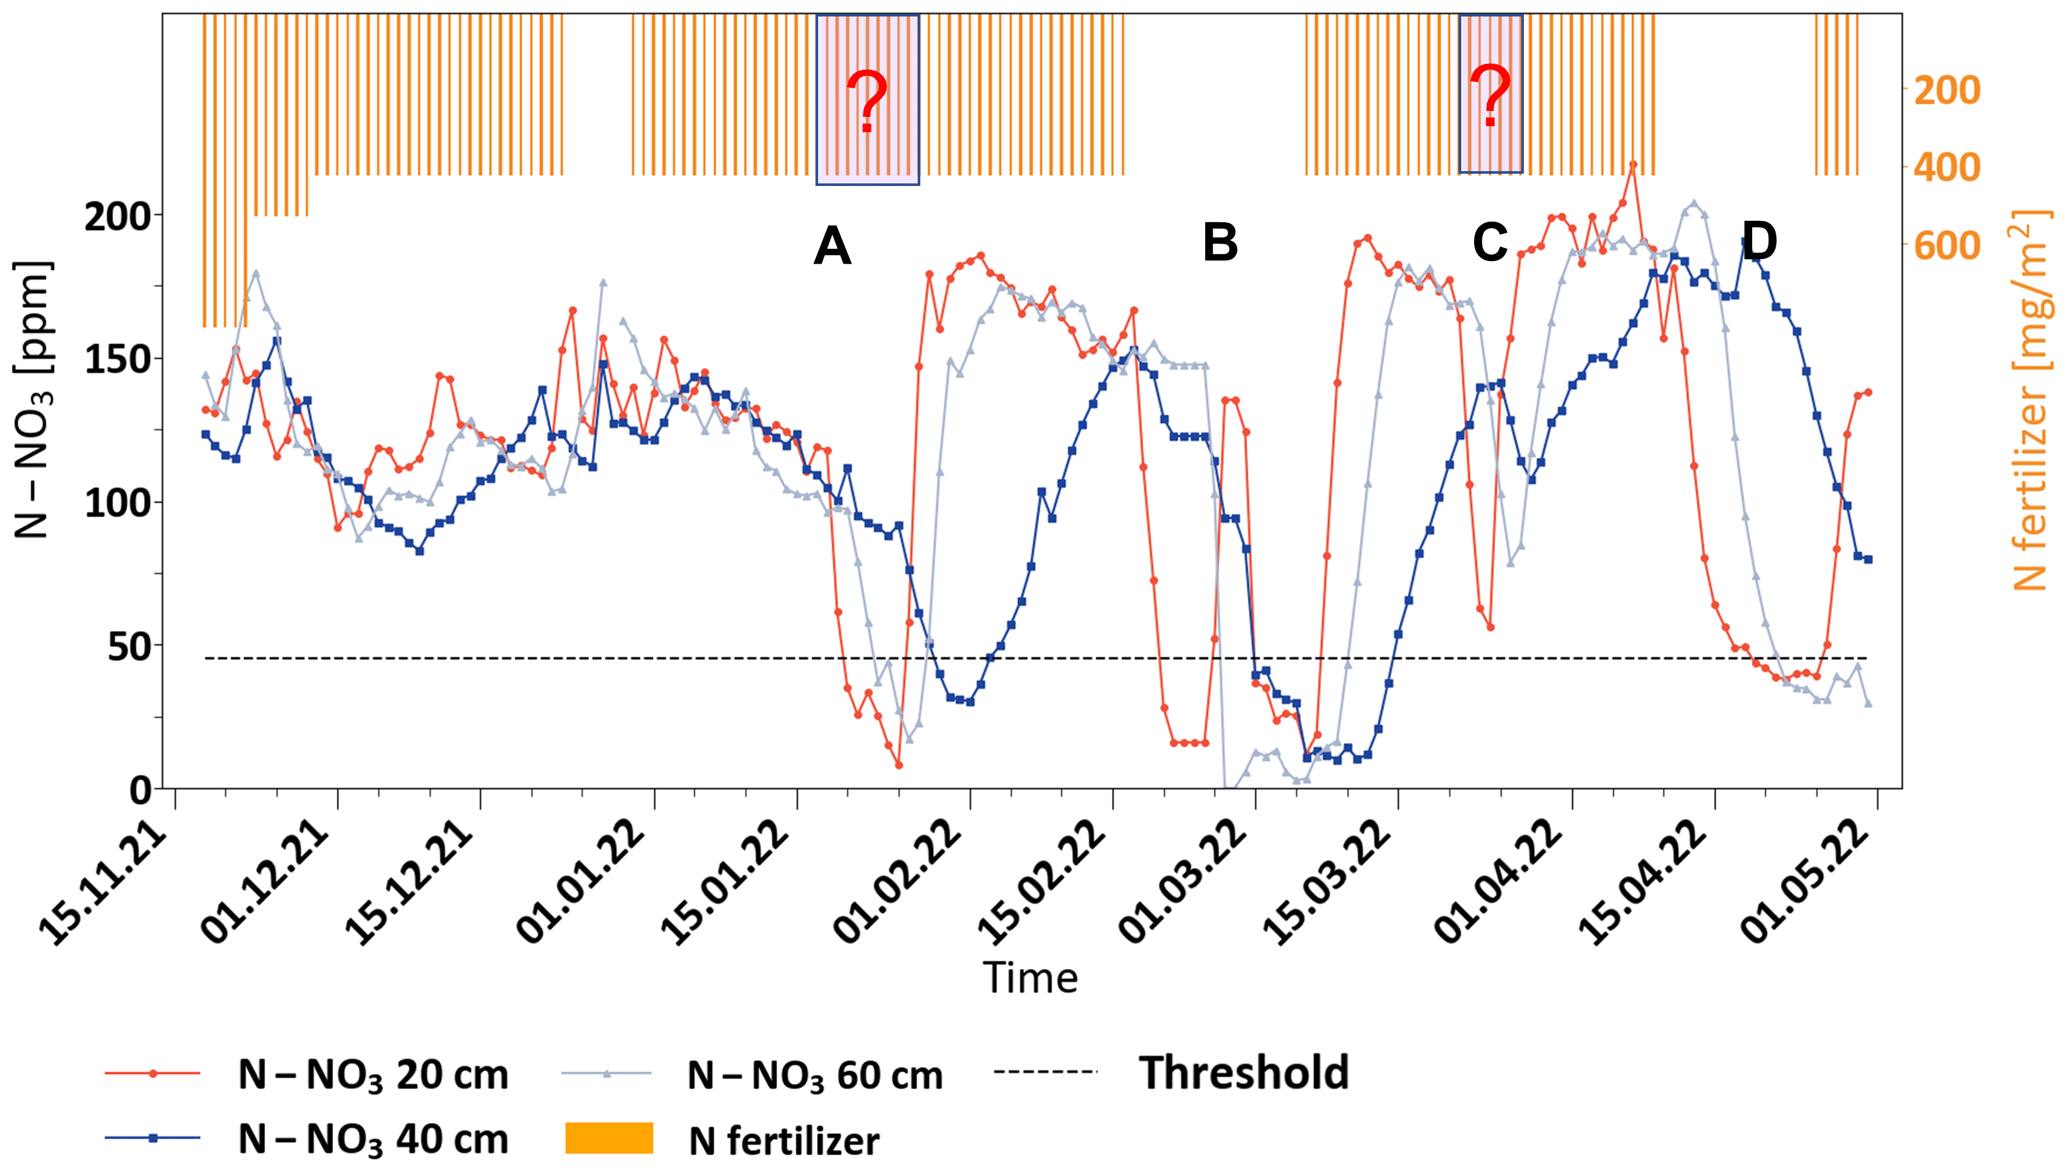
Figure 4Variations in soil nitrate concentration and daily N-fertilizer application in the control plot.
Although the data from the control plot were not used for managing fertigation, the recorded variations in nitrate concentration exhibit four distinct periods in which a sharp decrease in nitrate concentration was monitored (stages A, B, C and D). Obviously, such a reduction in soil nitrate concentration is a direct outcome of a technical failure in the fertigation system, which was supposed to provide daily fixed fertigation amounts. In two of these events (stages B and D in Fig. 4), the reduction in soil nitrate concentration was noticeable and was also recorded as a technical failure in the fertigation system. On the other hand, in the two other events (marked as A and C), the fertilization failure was not detected and, therefore, not indicated as a no-fertilization period. Nevertheless, the sharp reduction in soil nitrate concentration provides a retrospective identification of a fertigation problem, which may raise an alarm for an actual fertigation problem and potential nutrient deficiencies to the crop. The measured high nitrate concentration across the entire profile during most of the growing season reflects excessive fertilization with evident down-leaching of nitrate from the root zone to the groundwater. Obviously, these results show that predetermined fertigation schedules that do not take into account the actual soil nutrient state lead to excess nutrients in the root zone, as well as groundwater pollution.
3.2 Diurnal variation in soil nitrate concentration
Throughout the experiment, decision-making on fertigation management in the adjusted fertigation plot relied on daily averages of hourly nitrate measurements (Fig. 3). Nevertheless, the hourly resolution reveals a notable diurnal variation in soil nitrate concentrations – from ∼ 90 to ∼ 200 ppm N–NO3 – for the presented period of 12 d in Fig. 5. The variations in soil nitrate concentration follow fertigation event patterns, along with the diurnal crop nutrient consumption. Close inspection of variations in soil nitrate concentration shows a sharp concentration increase immediately after each morning fertigation, which is followed by a gradual decrease during the daytime. The initial 3 d showcased correspond to the end of period D (Fig. 3), characterized by 100 % fertigation. Accordingly, daily fluctuations were particularly significant, peaking at 110–135 ppm N–NO3. Subsequent days represent period E (Fig. 3), where irrigation and fertilization were reduced to 50 %; consequently, fluctuations were slightly smaller and reached around 65–90 ppm N–NO3. Obviously, the sharp increase in nitrate concentration is attributed to the infiltration of a concentrated irrigation solution. However, the nitrate concentration in the irrigation water is only 100 ppm N, even during the 50 % fertigation period, where the reduction is in mass rather than concentration. Therefore, the top daily concentration of 160–200 ppm N–NO3 reflects down-leaching of the concentrated solution from the top 20 cm of the soil profile, where evapotranspiration is most effective. On the other hand, the daily decrease in nitrate concentration is attributed to both the downward transport of the irrigation water and plant consumption. While nitrate is indeed taken up by plants at this depth, a reduction of 100 ppm N–NO3 exceeds the daily plant uptake capability and cannot be solely explained by it. Hence, it is estimated that a substantial portion of the concentration decrease is attributed to a downward transport of the irrigation solution and the influx of water with a lower nitrate concentration, which is closer to the initial fertilizer concentration. Although transport and nitrate consumption may be the main reason for the observed daily decrease in nitrate concentration, it is possible that other microbial processes, such as denitrification and N-oxide release, could also contribute to reductions in nitrate concentration. These results highlight the potential of micro-managing fertilizer application to reduce nitrate leaching and to enhance nutrient uptake by plants.
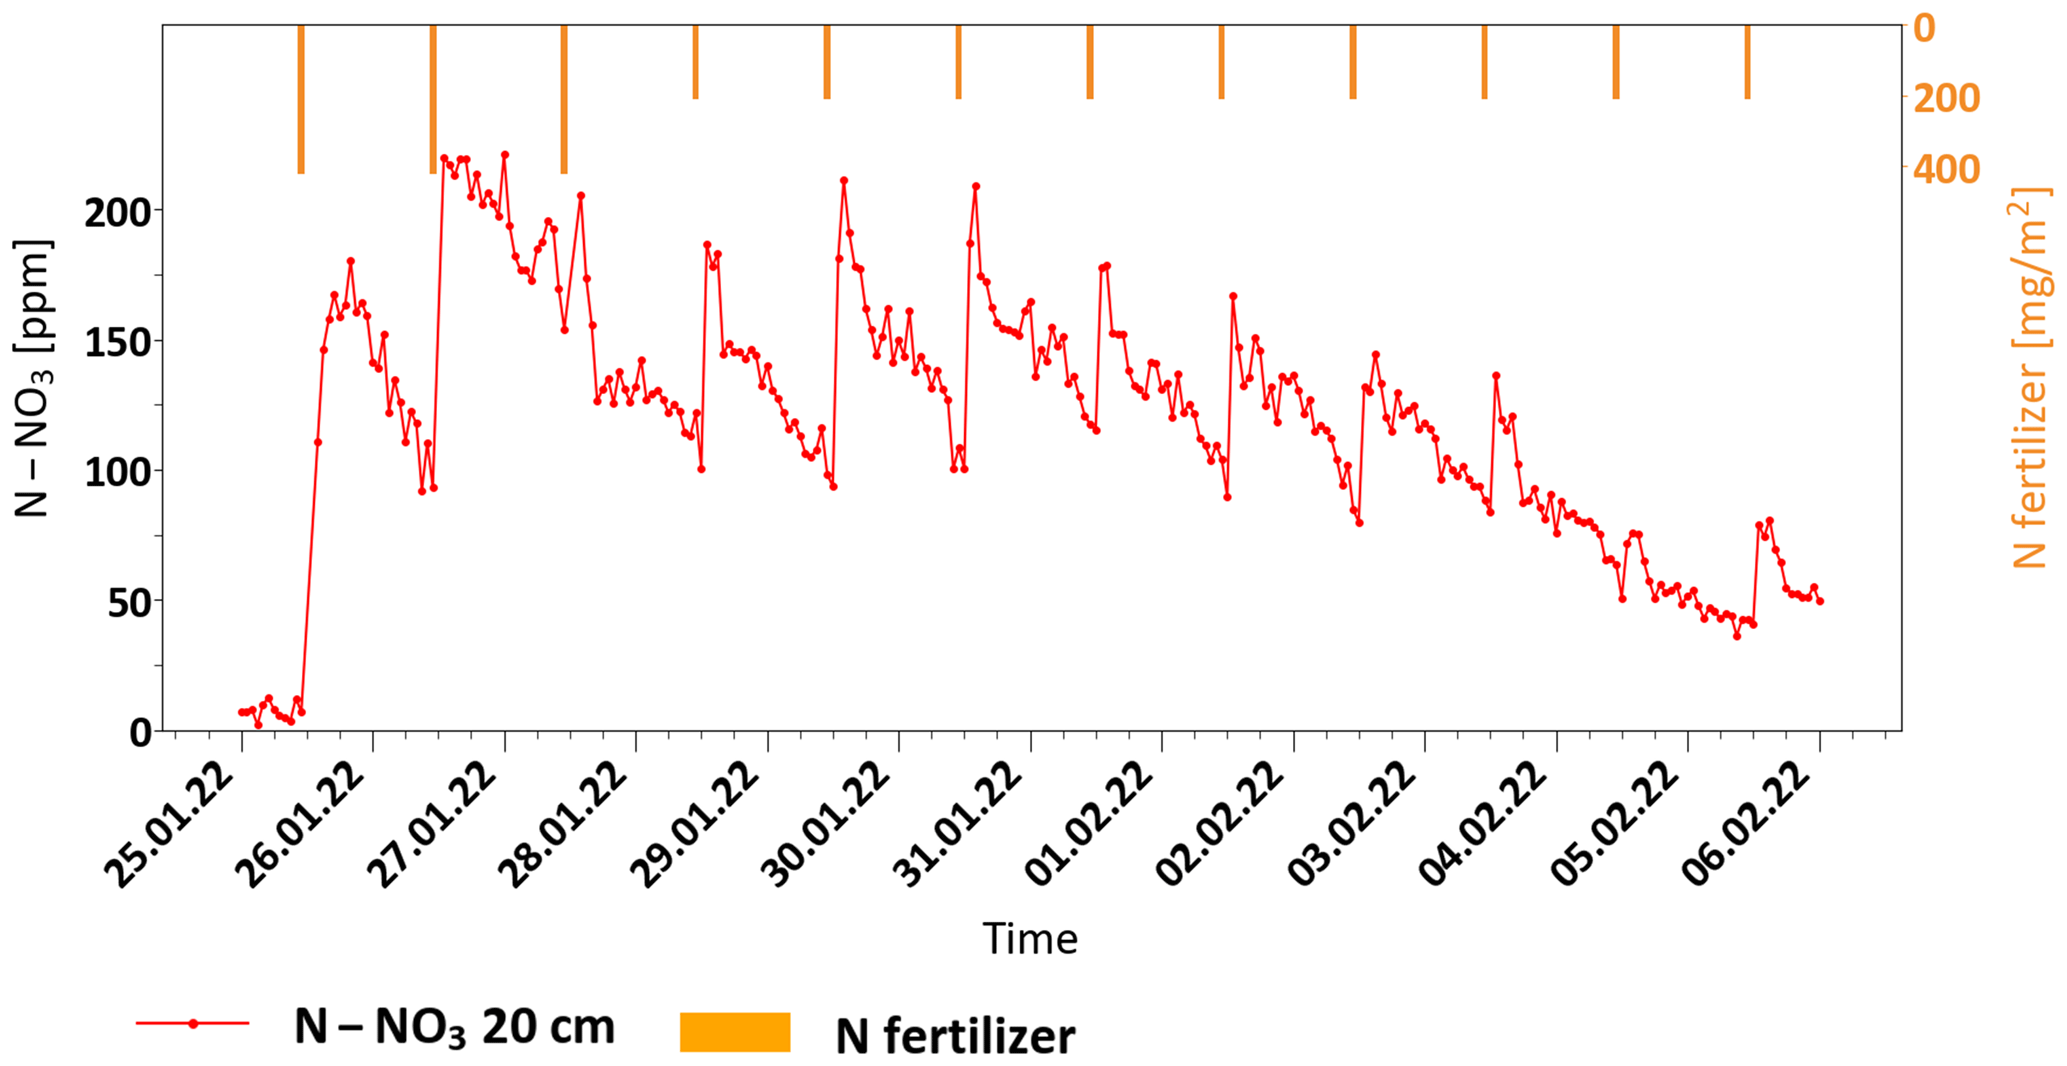
Figure 5Soil nitrate concentration at 20 cm depth and daily N-fertilizer dose in the adjusted fertigation plot.
3.3 Fertilizer application and yield
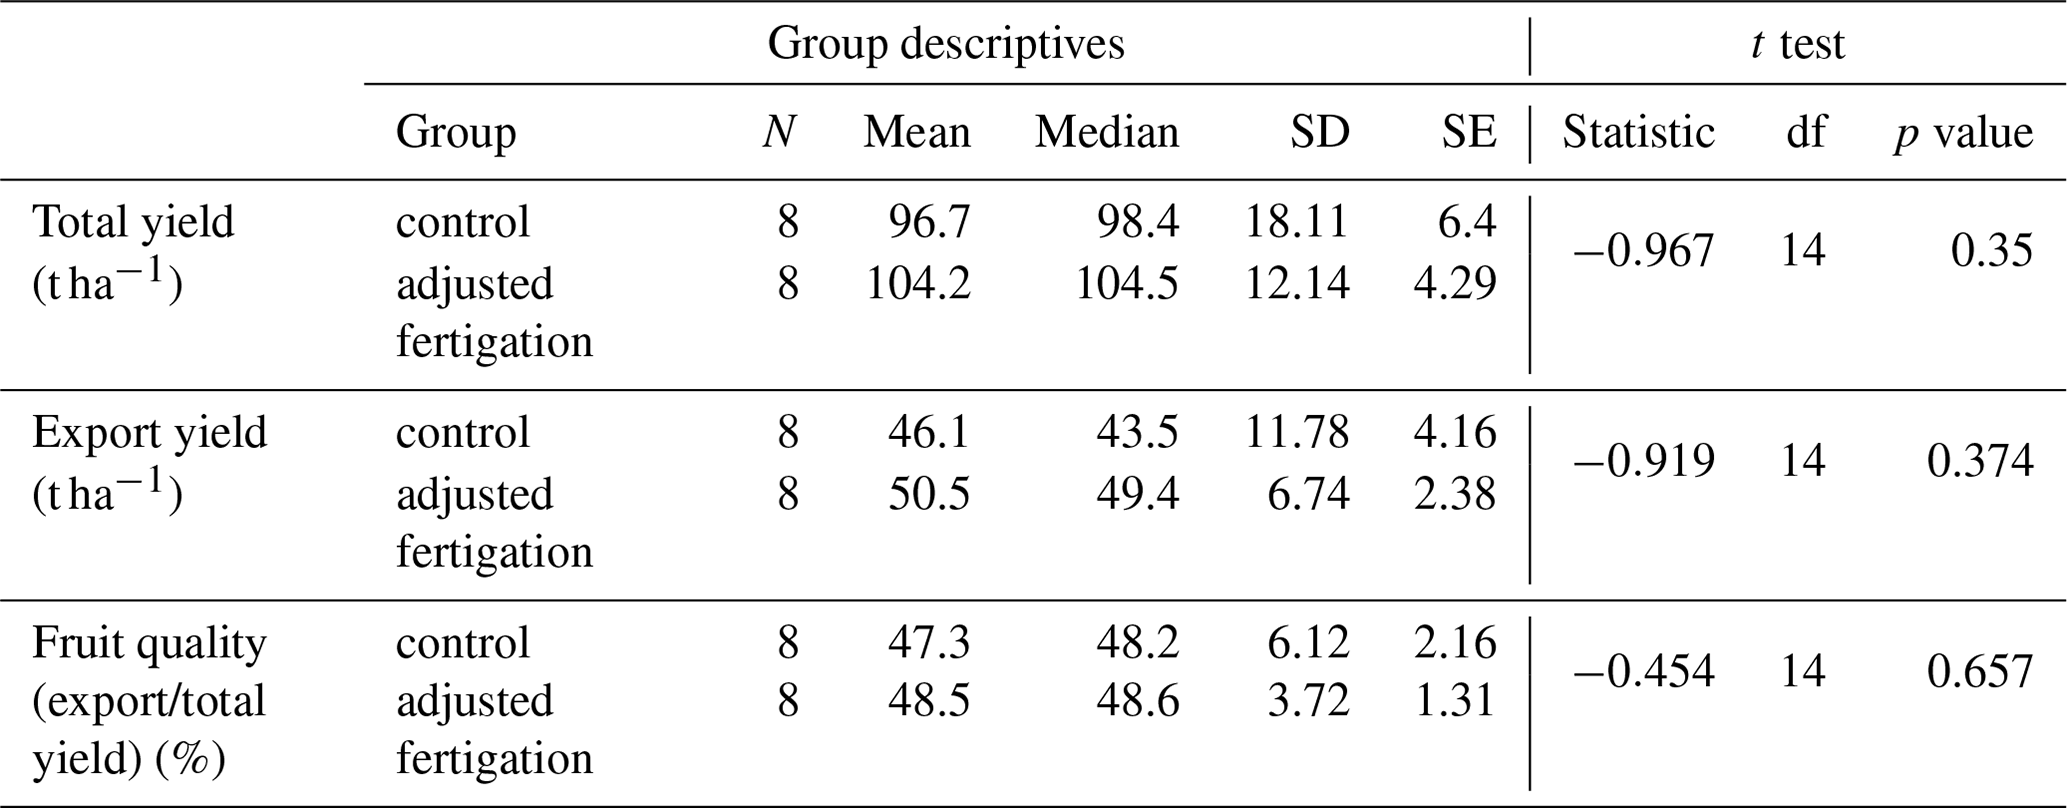
During the monitoring period (60 % of the growing season), 559 kg N ha−1 was applied in the control treatment, and only 349 kg N ha−1 was applied in the adjusted fertigation plot, exhibiting a 38 % reduction in fertilizer application. Nevertheless, reducing N fertilizers did not affect the total yield or fruit quality – measured as the ratio between export yield and total yield. The total-yield results were based on 12 harvests throughout the season and represent the mean of eight plots for each treatment. The mean total yield in the control treatment reached 95.6 t ha−1, while the mean total yield in the adjusted fertigation plot was slightly higher, reaching 105.6 t ha−1. This difference was found to be non-significant in a t test (p value = 0.35, degrees of freedom = 14) (Table 2). Furthermore, fruit quality was also slightly higher, although also non-significant, in the adjusted fertigation plot, where 48.4 % of the total fruits were classified as export yield, with 47.6 % classified as such in the control plot (p value = 0.657, degrees of freedom = 14). The export yield was 46.0 t ha−1 in the adjusted fertigation plot and 50.4 t ha−1 in the control plot (p value = 0.374, degrees of freedom = 14). A reduction in fertilizer application was achieved even though the soil nitrate concentration was mostly maintained above the 45 ppm N–NO3 threshold. These results emphasize that fertilizer application that is carried out through a fixed protocol, as is commonly practiced today in most agricultural fields all over the world, releases high nitrate concentrations into the environment, which are 3 to 5 times higher than the level required for a healthy crop and optimal yield.
Table 2Descriptive statistics and t-test results for yield, export yield, and fruit quality across eight plots in the two treatments.
3.4 Nitrate down-leaching
To calculate nitrate down-leaching, we considered the leachate fraction of the irrigation water and the nitrate concentration at a depth of 60 cm. Previous studies on bell pepper crops in this region have shown that this area's high-salinity water requires irrigation amounts that are at least twice the actual plant evapotranspiration to prevent salt accumulation in the soil (Ben-Gal et al., 2008). Plant daily evapotranspiration for this crop in this region at different growth stages had previously been calculated in a large-scale lysimeter experiment conducted by the R&D Center (Water recycling project Pharan, Shabtai Cohen, 2007, unpublished, in Hebrew), and irrigation recommendation tables for the farmer were published, including daily evapotranspiration and recommended irrigation amounts (Oded Friedman et al., unpublished, in Hebrew). Following these recommendations, irrigation was carried out in both the adjusted fertigation and the control plots for most of the season. The calculation of the cumulative nitrate flux is performed following Eq. (2):
where I is the daily irrigation amount, et is the daily actual evapotranspiration, and NO3(60 cm) is the daily average of nitrate concentration at 60 cm depth.
Cumulative nitrate nitrogen leachate amounts for the monitored period were 280 and 196 kg N–NO3 ha−1 in the control and adjusted fertigation plots, respectively. This significant reduction of 30 % in nitrate down-leaching was achieved even though fertilizer adjustments were performed manually for part of the growing season. Although nitrate down-leaching was successfully reduced in the adjusted fertigation plot, the results still indicate extremely high nitrate leachate. Furthermore, when considering the fraction of N loss through leachate in relation to the applied total N fertilizer, this was found to be similar in both the adjusted fertigation and the control treatments, with values of 56 % and 50 %, respectively. This suggests that nitrogen efficiency was very low, and a significant portion of the N fertilizer is transformed into nitrate, which then leaches down from the root zone to the groundwater. Since nitrate leachate is influenced by both water flux from excessive irrigation and nitrate concentrations below the root zone, both water efficiency and nitrogen efficiency play crucial roles in minimizing N leaching. However, it is essential to note that the results presented here are based on an experiment conducted in very coarse sandy soil, irrigated with high-salinity water. Under such conditions, high drainage and difficulty in controlling nitrate down-leaching were observed in both treatments. It can be noted that, during the last month of the growing season, applied irrigation closely matched actual evapotranspiration. Consequently, there was hardly any nitrate leaching, although the nitrate concentration increased below the root zone.
3.5 Fertistat
During the experiment, real-time measurements were used to guide fertilization decisions, but the exact amounts of fertilizer were still determined through trial and error. This method resulted in a 38 % reduction in fertilizer usage but could be further optimized with the use of an algorithm that calculates required fertilization amounts based on real-time measurements. Such a fertigation algorithm, based on continuous analysis of soil nitrate, would function as a fertistat that controls the soil nitrate concentration at the desired levels. Analogously to temperature control by a thermostat in any heat process, a fertistat mechanism would act to achieve the desired soil nutrient concentrations that are required for optimal yield while preventing nutrient excesses or deficiencies. Hence, the fertistat mechanism does not depend on soil type, plant demand or climatic conditions as it enables direct control of the soil nutrient concentration to attain these desired values. Results from this study show that the application of a fertistat mechanism may dramatically reduce fertilizer applications while achieving high crop yields.
Continuous in situ monitoring of nitrate concentrations across the soil profile was used for real-time management of fertilizer and water application in an agricultural field. The following conclusive results were obtained throughout the experiment.
-
A soil nitrate monitoring system (SNS), which is based on continuous spectral analysis of the soil porewater, was operated during the growing season of a bell pepper crop in a greenhouse. The SNS exhibited robustness and accuracy, which proved its suitability for optimizing fertilizer and water application in agricultural field conditions.
-
Real-time monitoring of the soil nitrate concentration revealed the dynamic responses of the soil to water and fertilizer application. Hourly measurements showed daily fluctuations in nitrate concentrations, which correspond well with the daily fertigation events and plant nutrient demand.
-
Soil nitrate concentration under the control plots, which were fertigated according to the standard regional fertigation plan, exhibited a very high concentration range of ∼ 130 to ∼ 180 ppm N–NO3, which persisted for most of the growing season (apart from short periods of technical failure in the fertigation system). Since achieving a healthy yield of bell pepper, in this particular case, requires soil nitrate concentrations of 20–35 ppm N–NO3, these results demonstrate that fertigation that is based on a pre-scheduled fertigation plan can lead to excessive fertilization, posing the risk of severe groundwater pollution.
-
Continuous data on variations in soil nitrate concentrations enabled the manipulation of the applied fertigation regime while driving the soil nitrate towards the desired concentration range. In this experiment, the nitrate concentration threshold was set at 45 ppm N–NO3, which is well above the minimum required for the maximum yield. Nevertheless, a reduction of 38 % in fertilizer application was achieved without affecting the total yield or the fruit quality.
-
Manipulation of the fertigation plan to achieve the desired soil nitrate concentration resulted in a reduction of 30 % in nitrate flux below the root zone. However, despite the successful reduction, the findings still indicate notably high nitrate leachate that does not meet groundwater quality objectives. This is primarily attributed to very low irrigation efficiency, which is dictated by the irrigation water's high salinity (EC of ∼ 2–2.5 mS cm−1). Therefore, an additional reduction of nitrate down-leaching requires irrigation with lower-salinity water.
-
Combining real-time soil nitrate monitoring technology with an automated fertigation program has the potential to significantly reduce fertilizer usage, minimizing nitrate down-leaching and water resource pollution.
Table A1Pre-scheduled fertilization plan: control treatment (Oded Friedman et al., unpublished, in Hebrew).
All data generated during the current study are available from the corresponding author on reasonable request.
Conceptualization: YY, OD. Experimental setup: YY, YR, OD. Analysis: YY, YR, OD. Writing: YY, OD. Project supervision: OD, SA.
The contact author has declared that none of the authors has any competing interests.
Publisher’s note: Copernicus Publications remains neutral with regard to jurisdictional claims made in the text, published maps, institutional affiliations, or any other geographical representation in this paper. While Copernicus Publications makes every effort to include appropriate place names, the final responsibility lies with the authors.
We would like to express our gratitude to Michael Kugel and Yuval Shani for supporting all the technical aspects of this research.
This research was funded by (1) Israel's Ministry of Agriculture and Rural Development under the project name “Reducing nitrate fluxes to groundwater from agricultural fields” (grant no. 16-34-0005) as part of the program The Root of the Matter and (2) the Nekudat Hen Foundation. In addition, scholarships were granted by (1) the Harbour Foundation for a Fay and Bert Harbour Award, (2) the Yair Guron Scholarship Fund and (3) the JNF Scholarship Program.
This paper was edited by Luisella Celi and reviewed by two anonymous referees.
Abascal, E., Gómez-Coma, L., Ortiz, I., and Ortiz, A.: Global diagnosis of nitrate pollution in groundwater and review of removal technologies, Sci. Total Environ., 810, 152233, https://doi.org/10.1016/j.scitotenv.2021.152233, 2022.
Azad, N., Behmanesh, J., Rezaverdinejad, V., Abbasi, F., and Navabian, M.: Evaluation of fertigation management impacts of surface drip irrigation on reducing nitrate leaching using numerical modeling, Environ. Sci. Pollut. R., 26, 36499–36514, https://doi.org/10.1007/s11356-019-06699-2, 2019.
Ben-Gal, A., Ityel, E., Dudley, L., Cohen, S., Yermiyahu, U., Presnov, E., Zigmond, L., and Shani, U.: Effect of irrigation water salinity on transpiration and on leaching requirements: A case study for bell peppers, Agr. Water Manage., 95, 587–597, https://doi.org/10.1016/j.agwat.2007.12.008, 2008.
Bijay-Singh and Ali, A. M.: Using hand-held chlorophyll meters and canopy reflectance sensors for fertilizer nitrogen management in cereals in small farms in developing countries, Sensors, 20, 1127, https://doi.org/10.3390/s20041127, 2020.
Bijay-Singh and Craswell, E.: Fertilizers and nitrate pollution of surface and ground water: an increasingly pervasive global problem, SN Appl. Sci., 3, 518, https://doi.org/10.1007/s42452-021-04521-8, 2021.
Bijay-Singh, Varinderpal-Singh, Jaspreet Purba, Sharma, R. K., Jat, M. L., Yadvinder-Singh, Thind, H. S., Gupta, R. K., Chaudhary, O. P., Chandna, P., Khurana, H. S., Kumar, A., Jagmohan-Singh, Uppal, H. S., Uppal, R. K., Vashistha, M., and Gupta, R.: Site-specific fertilizer nitrogen management in irrigated transplanted rice (Oryza sativa) using an optical sensor, Precis. Agric., 16, 455–475, https://doi.org/10.1007/s11119-015-9389-6, 2015.
Carter, M. R. and Gregorich, E. G. (Eds.): Soil sampling and methods of analysis, 2nd Edn., CRC press, https://doi.org/10.1201/9781420005271, 2007.
Council Directive: Council Directive 91/676/EEC of 12 December 1991 concerning the protection of waters against pollution caused by nitrates from agricultural sources, Official J. L, 375, 1–8, 1991.
Cui, Z., Zhang, F., Chen, X., Miao, Y., Li, J., Shi, L., Xu, J., Ye, Y., Liu, C., Yang, Z., Zhang, Q., Huang, S., and Bao, D.: On-farm evaluation of an in-season nitrogen management strategy based on soil Nmin test, Field Crop. Res., 105, 48–55, https://doi.org/10.1016/j.fcr.2007.07.008, 2008.
Dahan, O., Babad, A., Lazarovitch, N., Russak, E. E., and Kurtzman, D.: Nitrate leaching from intensive organic farms to groundwater, Hydrol. Earth Syst. Sci., 18, 333–341, https://doi.org/10.5194/hess-18-333-2014, 2014.
Etheridge, J. R., Birgand, F., Osborne, J. A., Osburn, C. L., Burchell, M. R., and Irving, J.: Using in situ ultraviolet-visual spectroscopy to measure nitrogen, carbon, phosphorus, and suspended solids concentrations at a high frequency in a brackish tidal marsh, Limnol. Oceanogr. Meth., 12, 10–22, https://doi.org/10.4319/lom.2014.12.10, 2014.
FAO: World Food and Agriculture – Statistical Yearbook 2022, FAO, https://doi.org/10.4060/cc2211en, 2022.
Feng, W., Yao, X., Zhu, Y., Tian, Y. C., and Cao, W. X.: Monitoring leaf nitrogen status with hyperspectral reflectance in wheat, Eur. J. Agron., 28, 394–404, https://doi.org/10.1016/j.eja.2007.11.005, 2008.
Górski, J., Dragon, K., and Kaczmarek, P. M. J.: Nitrate pollution in the Warta River (Poland) between 1958 and 2016: trends and causes, Environ. Sci. Pollut. R., 26, 2038–2046, https://doi.org/10.1007/s11356-017-9798-3, 2019.
Gu, B., Ge, Y., Chang, S. X., Luo, W., and Chang, J.: Nitrate in groundwater of China: Sources and driving forces, Global Environ. Chang., 23, 1112–1121, https://doi.org/10.1016/j.gloenvcha.2013.05.004, 2013.
Israel Meteorological Service: Weather history for Hatzeva, centeral Arava valley (1994–2013), Israel Meteorological Service, 2013.
Knobeloch, L., Salna, B., Hogan, A., Postle, J., and Anderson, H.: Blue Babies and Nitrate-Contaminated Well Water, Environ. Health Persp., 108, 675–678, https://doi.org/10.1289/ehp.00108675, 2000.
Kong, Q., Li, G., Wang, Y., and Huo, H.: Bell pepper response to surface and subsurface drip irrigation under different fertigation levels, Irrig. Sci., 30, 233–245, https://doi.org/10.1007/s00271-011-0278-0, 2012.
Kurtzman, D., Kanner, B., Levy, Y., Nitsan, I., and Bar-Tal, A.: Maintaining intensive agriculture overlying aquifers using the threshold nitrate root-uptake phenomenon, J. Environ. Qual., 50, 979–989, https://doi.org/10.1002/jeq2.20239, 2021.
Lasagna, M., De Luca, D. A., and Franchino, E.: Nitrate contamination of groundwater in the western Po Plain (Italy): the effects of groundwater and surface water interactions, Environ. Earth Sci., 75, 1–16, https://doi.org/10.1007/s12665-015-5039-6, 2016.
Levy, Y., Shapira, R. H., Chefetz, B., and Kurtzman, D.: Modeling nitrate from land surface to wells' perforations under agricultural land: success, failure, and future scenarios in a Mediterranean case study, Hydrol. Earth Syst. Sci., 21, 3811–3825, https://doi.org/10.5194/hess-21-3811-2017, 2017.
Li, P., Karunanidhi, D., Subramani, T., and Srinivasamoorthy, K.: Sources and Consequences of Groundwater Contamination, Arch. Environ. Con. Tox., 80, 1–10, https://doi.org/10.1007/s00244-020-00805-z, 2021.
Li, X., Hu, C., Delgado, J. A., Zhang, Y., and Ouyang, Z.: Increased nitrogen use efficiencies as a key mitigation alternative to reduce nitrate leaching in north china plain, Agr. Water Manage., 89, 137–147, https://doi.org/10.1016/j.agwat.2006.12.012, 2007.
Li, Z., Yang, Q., Xie, C., and Lu, X.: Source identification and health risks of nitrate contamination in shallow groundwater: a case study in Subei Lake basin, Environ. Sci. Pollut. R., 30, 13660–13670, https://doi.org/10.1007/s11356-022-23129-y, 2023.
Lollato, R. P., Figueiredo, B. M., Dhillon, J. S., Arnall, D. B., and Raun, W. R.: Wheat grain yield and grain-nitrogen relationships as affected by N, P, and K fertilization: A synthesis of long-term experiments, Field Crop. Res., 236, 42–57, https://doi.org/10.1016/j.fcr.2019.03.005, 2019.
Minikaev, D., Zurgel, U., Tripler, E., and Gelfand, I.: Effect of increasing nitrogen fertilization on soil nitrous oxide emissions and nitrate leaching in a young date palm (Phoenix dactylifera L., cv. Medjool) orchard, Agr. Ecosyst. Environ., 319, 107569, https://doi.org/10.1016/j.agee.2021.107569, 2021.
Mohamed Ali, A., Singh Thind, H., and Sharma, S.: Site-Specific Nitrogen Management in Dry Direct-Seeded Rice Using Chlorophyll Meter and Leaf Colour Chart, Pedosphere, 25, 72–81, https://doi.org/10.1016/S1002-0160(14)60077-1, 2015.
Nkebiwe, P. M., Weinmann, M., Bar-Tal, A., and Müller, T.: Fertilizer placement to improve crop nutrient acquisition and yield: A review and meta-analysis, 196, 389–401, https://doi.org/10.1016/j.fcr.2016.07.018, 2016.
Picetti, R., Deeney, M., Pastorino, S., Miller, M. R., Shah, A., Leon, D. A., Dangour, A. D., and Green, R.: Nitrate and nitrite contamination in drinking water and cancer risk: A systematic review with meta-analysis, Environ. Res., 210, 112988, https://doi.org/10.1016/j.envres.2022.112988, 2022.
Piri, H. and Naserin, A.: Effect of different levels of water, applied nitrogen and irrigation methods on yield, yield components and IWUE of onion, Sci. Hortic, 268, 109361, https://doi.org/10.1016/j.scienta.2020.109361, 2020.
Powlson, D. S., Addiscott, T. M., Benjamin, N., Cassman, K. G., de Kok, T. M., van Grinsven, H., L'hirondel, J.-L., Avery, A. A., and van Kessel, C.: When Does Nitrate Become a Risk for Humans?, J. Environ. Qual., 37, 291–295, https://doi.org/10.2134/jeq2007.0177, 2008.
Rahmati, O., Samani, A. N., Mahmoodi, N., and Mahdavi, M.: Assessment of the Contribution of N-Fertilizers to Nitrate Pollution of Groundwater in Western Iran (Case Study: Ghorveh–Dehgelan Aquifer), Water Qual. Expos. Hea., 7, 143–151, https://doi.org/10.1007/s12403-014-0135-5, 2015.
Rezayati, S., Khaledian, M., Razavipour, T., and Rezaei, M.: Water flow and nitrate transfer simulations in rice cultivation under different irrigation and nitrogen fertilizer application managements by HYDRUS-2D model, Irrig. Sci., 38, 353–363, https://doi.org/10.1007/s00271-020-00676-1, 2020.
Salvagiotti, F., Cassman, K. G., Specht, J. E., Walters, D. T., Weiss, A., and Dobermann, A.: Nitrogen uptake, fixation and response to fertilizer N in soybeans: A review, 108, 1–13, https://doi.org/10.1016/j.fcr.2008.03.001, 2008.
Scavia, D. and Bricker, S. B.: Coastal eutrophication assessment in the United States, Biogeochemistry, 79, 187–208, https://doi.org/10.1007/s10533-006-9011-0, 2006.
Sela, S., van Es, H. M., Moebius-Clune, B. N., Marjerison, R., and Kneubuhler, G.: Dynamic model-based recommendations increase the precision and sustainability of N fertilization in midwestern US maize production, Comput. Electron. Agr., 153, 256–265, https://doi.org/10.1016/j.compag.2018.08.010, 2018.
Shalev, N., Burg, A., Gavrieli, I., and Lazar, B.: Nitrate contamination sources in aquifers underlying cultivated fields in an arid region – The Arava Valley, Israel, Appl. Geochem., 63, 322–332, https://doi.org/10.1016/j.apgeochem.2015.09.017, 2015.
Šimůnek, J., Genuchten, M. T., and Šejna, M.: Recent Developments and Applications of the HYDRUS Computer Software Packages, Vadose Zone J., 15, 1–25, https://doi.org/10.2136/vzj2016.04.0033, 2016.
Tafteh, A. and Sepaskhah, A. R.: Application of HYDRUS-1D model for simulating water and nitrate leaching from continuous and alternate furrow irrigated rapeseed and maize fields, Agr. Water Manage., 113, 19–29, https://doi.org/10.1016/j.agwat.2012.06.011, 2012.
Turkeltaub, T., Kurtzman, D., and Dahan, O.: Real-time monitoring of nitrate transport in the deep vadose zone under a crop field – implications for groundwater protection, Hydrol. Earth Syst. Sci., 20, 3099–3108, https://doi.org/10.5194/hess-20-3099-2016, 2016.
Schmidhalter, U.: Development of a quick on-farm test to determine nitrate levels in soil, J. Plant Nutr. Soil Sc., 168, 432–438, https://doi.org/10.1002/jpln.200520521, 2005.
Wang, B., Xin, M., Wei, Q., and Xie, L.: A historical overview of coastal eutrophication in the China Seas, Mar. Pollut. Bull., 136, 394–400, https://doi.org/10.1016/j.marpolbul.2018.09.044, 2018.
Weissman, G., Dahan, O., and Bel, G.: Probability Distribution for Water Fluxes in a Heterogeneous Unsaturated Zone Using an Ensemble of 1D Simulations, Water Resour. Res., 58, e2022WR032322, https://doi.org/10.1029/2022WR032322, 2022.
Westermann, D. T. and Kleinkopf, G. E.: Nitrogen Requirements of Potatoes, Agron J., 77, 616–621, https://doi.org/10.2134/agronj1985.00021962007700040024x, 1985.
Wey, H., Hunkeler, D., Bischoff, W. A., and Bünemann, E. K.: Field-scale monitoring of nitrate leaching in agriculture: assessment of three methods, Environ. Monit. Assess., 194, 4, https://doi.org/10.1007/s10661-021-09605-x, 2022.
Wolf, K. A., Pullens, J. W. M., and Børgesen, C. D.: Optimized number of suction cups required to predict annual nitrate leaching under varying conditions in Denmark, J. Environ. Manage., 328, 116964, https://doi.org/10.1016/j.jenvman.2022.116964, 2023.
Xu, J., Cai, H., Wang, X., Ma, C., Lu, Y., Ding, Y., Wang, X., Chen, H., Wang, Y., and Saddique, Q.: Exploring optimal irrigation and nitrogen fertilization in a winter wheat-summer maize rotation system for improving crop yield and reducing water and nitrogen leaching, Agr. Water Manage., 228, 105904, https://doi.org/10.1016/j.agwat.2019.105904, 2020.
Yamin, M., Bin Wan Ismail, W. I., Bin Mohd Kassim, M. S., Aziz, S. B. A., Akbar, F. N., Shamshiri, R. R., Ibrahim, M., and Mahns, B.: Modification of colorimetric method based digital soil test kit for determination of macronutrients in oil palm plantation, Int. J. Agr. Biol. Eng., 13, 188–197, https://doi.org/10.25165/j.ijabe.20201304.5694, 2020.
Yeshno, E., Arnon, S., and Dahan, O.: Real-time monitoring of nitrate in soils as a key for optimization of agricultural productivity and prevention of groundwater pollution, Hydrol. Earth Syst. Sci., 23, 3997–4010, https://doi.org/10.5194/hess-23-3997-2019, 2019.
Yeshno, E., Dahan, O., Bernstain, S., and Arnon, S.: A novel analytical approach for the simultaneous measurement of nitrate and dissolved organic carbon in soil water, Hydrol. Earth Syst. Sci., 25, 2159–2168, https://doi.org/10.5194/hess-25-2159-2021, 2021.
Zhang, H., Yang, R., Guo, S., and Li, Q.: Modeling fertilization impacts on nitrate leaching and groundwater contamination with HYDRUS-1D and MT3DMS, Paddy Water Environ., 18, 481–498, https://doi.org/10.1007/s10333-020-00796-6, 2020.
Zhang, X., Zhang, Y., Shi, P., Bi, Z., Shan, Z., and Ren, L.: The deep challenge of nitrate pollution in river water of China, Sci. Total Environ., 770, 144674, https://doi.org/10.1016/j.scitotenv.2020.144674, 2021.
Zhang, Y., Li, F., Zhang, Q., Li, J., and Liu, Q.: Tracing nitrate pollution sources and transformation in surface- and ground-waters using environmental isotopes, Sci. Total Environ., 490, 213–222, https://doi.org/10.1016/j.scitotenv.2014.05.004, 2014.
Zhang, Y., Li, M. Z., Zheng, L. H., Zhao, Y., and Pei, X.: Soil nitrogen content forecasting based on real-time NIR spectroscopy, Comput. Electron. Agr., 124, 29–36, https://doi.org/10.1016/j.compag.2016.03.016, 2016.