the Creative Commons Attribution 4.0 License.
the Creative Commons Attribution 4.0 License.
 | 17 May 2024
The effect of soil moisture content and soil texture on fast in situ pH measurements with two types of robust ion-selective electrodes
Katja Emmerich
Ingmar Schröter
Eric Bönecke
Wolfgang Schwanghart
Jörg Rühlmann
Eckart Kramer
Robin Gebbers
In situ soil pH measurements with ion-selective electrodes (ISEs) are receiving increasing attention in soil mapping for precision agriculture as they can avoid time-consuming sampling and off-site laboratory work. However, unlike the standard laboratory protocol, in situ pH measurements are carried out at lower and varying soil moisture contents (SMCs), which can have a pronounced effect on the sensor readings. In addition, as the contact with the soil during in situ measurements should be relatively short, effects of soil texture could be expected because texture controls the migration of protons to the electrode interface. This may be exacerbated by the fact that the electrodes used for in situ measurements are made of less sensitive but more robust materials as compared to the standard glass electrode. Therefore, the aim of the present study was to investigate the effect of soil moisture and soil texture on pH measurements using robust antimony and epoxy-body ISEs pressed directly into the soil for 30 s. The SMC was gradually increased from dry conditions to field capacity. A wide range of soil texture classes were included, with sand, silt, and clay contents ranging from 16 % to 91 %, 5 % to 44 %, and 4 % to 65 %, respectively. An exponential model was fitted to the data to quantify the relationship between SMC and pH. The results show that an increase in SMC causes a maximum increase in pH of approximately 1.5 pH units, regardless of the type of pH ISE used. Furthermore, for sandy soil textures, a rather linear relationship between pH and SMC was observed, whereas, with decreasing mean particle diameter (MPD), the model had a pronounced exponential shape, i.e., a greater pH increase at low SMC and a plateau effect at high SMC. With increasing SMC, the pH values asymptotically approached the standard pH measured with a glass electrode in 0.01 M CaCl2 (soil : solution ratio of 1:2.5). Thus, at high SMC, subsequent calibration of the sensor pH values to the standard pH value is negligible, which may be relevant for using the sensor pH data for lime requirement estimates. The pH measurement error decreases exponentially with increasing soil moisture and increases with decreasing MPD. Using a knee point detection, reliable pH values were obtained for SMC > 11 %, irrespective of the pH ISE used. An analysis of the regression coefficients of the fitted exponential model showed that the maximum pH increase also depends on soil texture; i.e., the influence of soil moisture variation on the pH value increases with decreasing MPD. Moreover, the concavity of the exponential curve increases with decreasing MPD.
- Article
(5131 KB) - Full-text XML
-
Supplement
(520 KB) - BibTeX
- EndNote


In agriculture, soil acidity is one of the fundamental soil properties for characterizing soil fertility and soil health because it directly and indirectly controls a series of soil physical, chemical, and biological properties that are important for plant growth (Robson, 1989; Epstein and Bloom, 2001; Mengel and Kirkby, 2002). Since extreme acidic or alkaline conditions can constitute undesirable yield-limiting factors, an accurate assessment of soil acidity by measuring the pH value of arable soils is a prerequisite to sustain or increase crop productivity. In humid climates, where soils naturally tend to acidify, soil acidity can be managed by means of lime fertilization. Precise soil acidity management should comply with site-specific lime demands, which requires pH data in a high spatial resolution (Brouder et al., 2005; Gebbers et al., 2009). However, conventional grid sampling and standard laboratory pH analyses are too tedious and expensive. As an alternative, mobile pH sensors are increasingly applied for fast and cost-effective in situ pH measurements (Adamchuk and Lund, 2008; Adamchuk et al., 1999; Viscarra Rossel et al., 2005; Viscarra Rossel and McBratney, 1997; Schirrmann et al., 2011; Bönecke et al., 2020). The pH sensor system should enable frequent and fast measurements (e.g., less than 1 min) in order to map a field within reasonable time. Moreover, the system must be robust, and the results must be comparable to the standard lab-based pH measurements. To meet these requirements, strategies should include the reduction of sample preparation and measurement time (Adamchuk et al., 1999; Adamchuk and Lund, 2008), as well as the use of different sensors as compared to the standard lab procedure, e.g., colorimetric approaches, ion-selective field effect transistors (ISFETs), or metallic ion-selective electrodes (ISEs) (Adamchuk and Lund, 2008; Viscarra Rossel and McBratney, 1997; Yuqing et al., 2005).
The pH ISE with a bulb-type glass membrane is the standard sensor for measuring pH in the laboratory (Thomas, 1996; Essington, 2015). It is composed of a measuring electrode that responds to changes in the hydrogen ion (H+) concentration of a sample solution via a thin H+-sensitive membrane and a reference electrode providing a constant electrical potential. During measurement, a pH-dependent potential is generated between the sample solution and the membrane. The potential difference, determined between the measuring and the reference electrode, is linearly related to the pH value of the sample according to the Nernst equation (Thomas, 1996; Essington, 2015). A high positive potential implies a high H+ concentration and low pH, while a low (negative) potential implies a low H+ concentration and a high pH value. The membrane of a standard pH ISE for laboratory use is made of glass, making them very fragile and unsuitable for in situ soil pH measurements. Thus, colorimetric approaches, ISFETs, and metallic electrodes were investigated as possible alternatives (Viscarra Rossel and McBratney, 1997), and glass electrodes were ruggedized. Among these, pH ISEs based on antimony turned out to have favorable properties, even though some manufacturers also suggest glass electrodes with flat-surface tips and with epoxy bodies for measurements in difficult environments (like soil). Several studies have compared the performance of antimony and glass electrodes and showed good agreement when measuring the pH value in soil solutions (e.g., Conkling and Blanchar, 1988; Baghdady and Sommer, 1990; Decker et al., 2017).
Besides the type of electrode, another fundamental disparity between the laboratory and in situ measurements of pH is the pre-treatment of the sample. In the lab, soil samples are standardized by drying and sieving to < 2 mm. In contrast, in the field, the measurement conditions are affected by spatially and temporally fluctuating soil moisture content (SMC), which is highly influenced by soil texture and topographic position. In addition to the mechanical stress and variable moisture conditions, in situ measurements can create problems due to losses of the inner aqueous electrolyte solution to the unsaturated soil, drying of the glass membrane, and the suspension effect (Thiele-Bruhn et al., 2015). The suspension effect is named after the observation that pH readings are different from clear solutions of soil extracts (filtrates or the clear supernatant solution of suspensions) as compared to measurements in the sediments of a soil suspension (Essington, 2015). According to Sumner (1994) and Essington (2015), the cation exchange capacity (CEC) of the soil affects the mobility of K+ ions in the K+–Cl− salt bridge of the potentiometric electrode system. In soil suspensions with high CEC, K+ ions can be attracted by the negatively charged soil colloids and will move faster trough the salt bridge than the Cl− ions. This can result in a lower pH reading in the suspension as compared to the clear supernatant. Conversely, in suspensions with low CEC (due to high amounts of hydrous Fe and Al at low pH), the mobility of Cl− through the liquid junction may be greater than that of K+, resulting in higher pH readings. While the suspension effect can be controlled in laboratory measurements, this is not the case for in situ measurements.
Previous studies have investigated the effect of varying SMC on the pH measurements in different soils (Schaller and Fischer, 1981; Adamchuk et al., 1999; Kahlert et al., 2004; Oliviera et al., 2018; de Souza Silva and Molin, 2018; Patil et al., 2019). However, most of the studies have been carried out with glass electrodes, and detailed evaluation of antimony electrode performance under low-moisture regimes in different soil textures is lacking.
Early research on the SMC–pH relationship for glass electrodes was reported by Keaton (1938) and Davis (1943). Keaton (1938) observed a pronounced influence of the soil–water ratio on the pH readings in his laboratory experiments. He found a pH decrease of up to 2 units, with a reduction in SMC from 1000 % (1:10 ratio) to saturation, while the pH rose again when the SMC was further reduced to field moisture. He explained this with the low-enough proportion of metallic cations to H+, producing counteraction of the Debye–Hückel activity effect as a result of the effect of preferential dissociation. Davis (1943) investigated pH measurements in soils with SMC at and below 100 % (dry-weight basis). The pH values obtained immediately after inserting the electrode into the soil increased with SMC and leveled out at about 35 %. However, readings for the electrode exposed to the soil for 14 h produced an inverse relationship. The pH from dryer soils (below 35 % SMC) jumped to very high values, and the pH dropped with increasing SMC. This, along with a lack of reproducibility in dryer soils, led Davis (1943) to the conclusion that pH should not be measured in soils below the moisture equivalent. He explained the elevated inaccuracy of measurements, partly with lacking soil contact, and problems of the amplifier in the measuring instrument in handling the high resistance. Thus, he concluded that there is no evidence that dry soils are characteristically more acid or alkaline than moist soils. Davis (1943) also investigated the effects of the treatment of the electrode prior to use. If the electrode was stored in an alkaline solution, pH values in dry soils were higher than in moist soils. When storing the electrode in acid solutions or water, the pH values in dry soils were lower than in wet soils.
Schaller and Fischer (1981) observed lower pH values in slightly moistened soil samples compared to water-saturated samples and concluded that the pH value decreases with increasing soil water tension. Adamchuk et al. (1999) developed an automated system for in situ pH measurements and tested it on soils in Indiana (USA). They observed a slight pH increase with increasing SMC. However, this variation was within the 95 % confidence interval of a standard soil pH measurement. Hence, they concluded that pH can be accurately measured in situ at SMCs ranging between 15 % to 25 % (dry-weight basis) for sandy soils and 20 % to 30 % for clayey soils. Oliviera et al. (2018) evaluated the influence of soil moisture on pH determination using antimony ISEs on tropical soils. They found an exponential relationship between pH and SMC and concluded that SMC influenced the electrode output of the pH ISE mainly when SMC was low. With increasing SMC, the pH value increased and finally stabilized at an SMC > 25 % (dry-weight basis). Furthermore, they observed a strongly increased dispersion of the pH measurements at low SMC. Another study on Oxisoles in São Paulo (Brazil) by de Souza Silva and Molin (2018) reported that SMC interferes with the readings of antimony pH ISEs in the manner that pH values proportionally increased with increasing SMC by about 0.9 units. Thus, they concluded that SMC should be considered an issue when measuring pH in situ. However, they highlighted the need for additional studies on a range of different soil landscapes. Patil et al. (2019) investigated the pH response to SMC changes from 5 % to 40 % (wet-weight basis) in red and bentonite soil in India. They found linearly increasing pH values of 1 and 1.7 units with increasing SMCs for red and bentonite soils, respectively. Finally, Zong et al. (2021) investigated the influence of SMC on antimony ISE pH readings in the laboratory. At 1 % SMC, the pH value was slightly higher than at 3% SMC, which gave the lowest readings. Then, the pH strongly increased from 4.8 to 7.6 between 3 % and 7 % SMC and reached a plateau from 7 % to 23 % SMC, with only a minor pH increase of 0.5 units.
Thomas (1996) states that the general increase in pH with SMC is much lower than one would expect; i.e., a 10-fold increase in SMC does not give a pH increase of 1 unit – rather, this is often only about 0.4 units. He explains that, in acid soils, the addition of water increases the dissociation of H+ from soil surfaces and increases the hydrolysis of Al species. This creates a buffer effect, which maintains pH at a relatively stable value over a wide range of soil–water ratios. In soils with higher pH, hydrolysis of basic cations creates a similar buffer effect. Thomas (1996) concludes that these buffer effects are responsible for the observation that water–soil ratios are not a highly important factor to consider when interpreting soil suspension pH values. However, this statement applies only for suspensions with a moisture content of 100 % or more.
The question can be raised as to whether the deviation of in situ pH values from laboratory measurements in suspensions, in particular at lower SMC, might just be artifacts of the potentiometric measurement principle caused by, e.g., the selective mechanisms of the binding of the membrane with H+, influences on the salt bridge, or problems with the electrical signal amplifier in the instrument. However, this seems not to be the case because similar deviations were observed with pH sensors based on different measurement principles (Kahlert et al., 2004; Matthiesen, 2004; Merl et al., 2022). Merl et al. (2022) compared an optical pH sensor (pH optode) with a conventional glass pH electrode at different soil moisture levels down to 5 % and observed a similar response of the pH readings to the SMC. While pH glass electrodes can suffer from failing connectivity between reference and measurement electrodes in very dry soils, pH optodes do not have this problem (Merl et al., 2022). Merl et al. conclude that proton activity at low SMC, where the standard assumptions of aqueous solutions are no longer valid, is not fully understood, and further investigations are needed. In the absence of a sufficient theory and accorded algorithms for predicting the dependencies of soil pH at lower moisture levels, empirical studies play a major role in describing the phenomenon.
The main goal of the present paper is to study the effects of different soil textures and SMCs on sensor-based pH value measurements using two ion-selective pH electrodes, i.e., an antimony electrode and an epoxy-body electrode, on soils of a quaternary landscape in northeastern Germany. Specific objectives are (i) to determine general trends of the pH response behavior under varying soil textures and SMCs, (ii) to identify SMC-related measurement discrepancies between the two pH electrodes, and (iii) to derive recommendations for a robust and precise sensor-based in situ soil acidity mapping under varying soil moisture conditions.
2.1 Study area and soil samples
Soil samples with varying soil texture were studied, taken from arable land in a quaternary landscape of northeastern Germany (Fig. 1a). This region was largely shaped by the Pleistocene glaciations and the Scandinavian inland ice sheet, most of all by the youngest Weichselian (115–12 ka) and the preceding Saalian glacial belt (150–130 ka; Krbetschek et al., 2008). Glacial, periglacial, and interglacial processes created a mosaic of landforms and unconsolidated sediments, which tend to vary in terms of their physical and chemical properties over small distances. During the Holocene, soil formation was additionally controlled by land use. The predominant soil types were Cambisols, Luvisols, and Podzols on till plains and terminal moraines; Arenosols on glaciofluvial sands and eolian sands; and Gleysols, Histosols, and Fluvisols in groundwater-influenced valleys and basins (Janetzko and Schmidt, 2014). Soil textures range from pure sand (class: Ss) to loamy clay (class: Tl), showing a dominance of sand and loam (classes: Sl, Su, St, Ls), according to the German soil classification system (KA5, Eckelmann et al., 2005). Soil pH values naturally range from acidic to alkaline as carbonates from glacial tills may occur in some places. Especially under agricultural use, soil pH is anthropogenically adjusted by lime fertilization, and soils are predominantly poor in soil organic matter. Following the Köppen–Geiger climate classification system, the study area is classified as temperate oceanic, with an increasing influence of continental circulations. The mean annual temperature is around 9 °C, with January being the coldest month and July being the warmest month. With a total annual precipitation of 550 mm, the area is one of the driest regions in Germany.
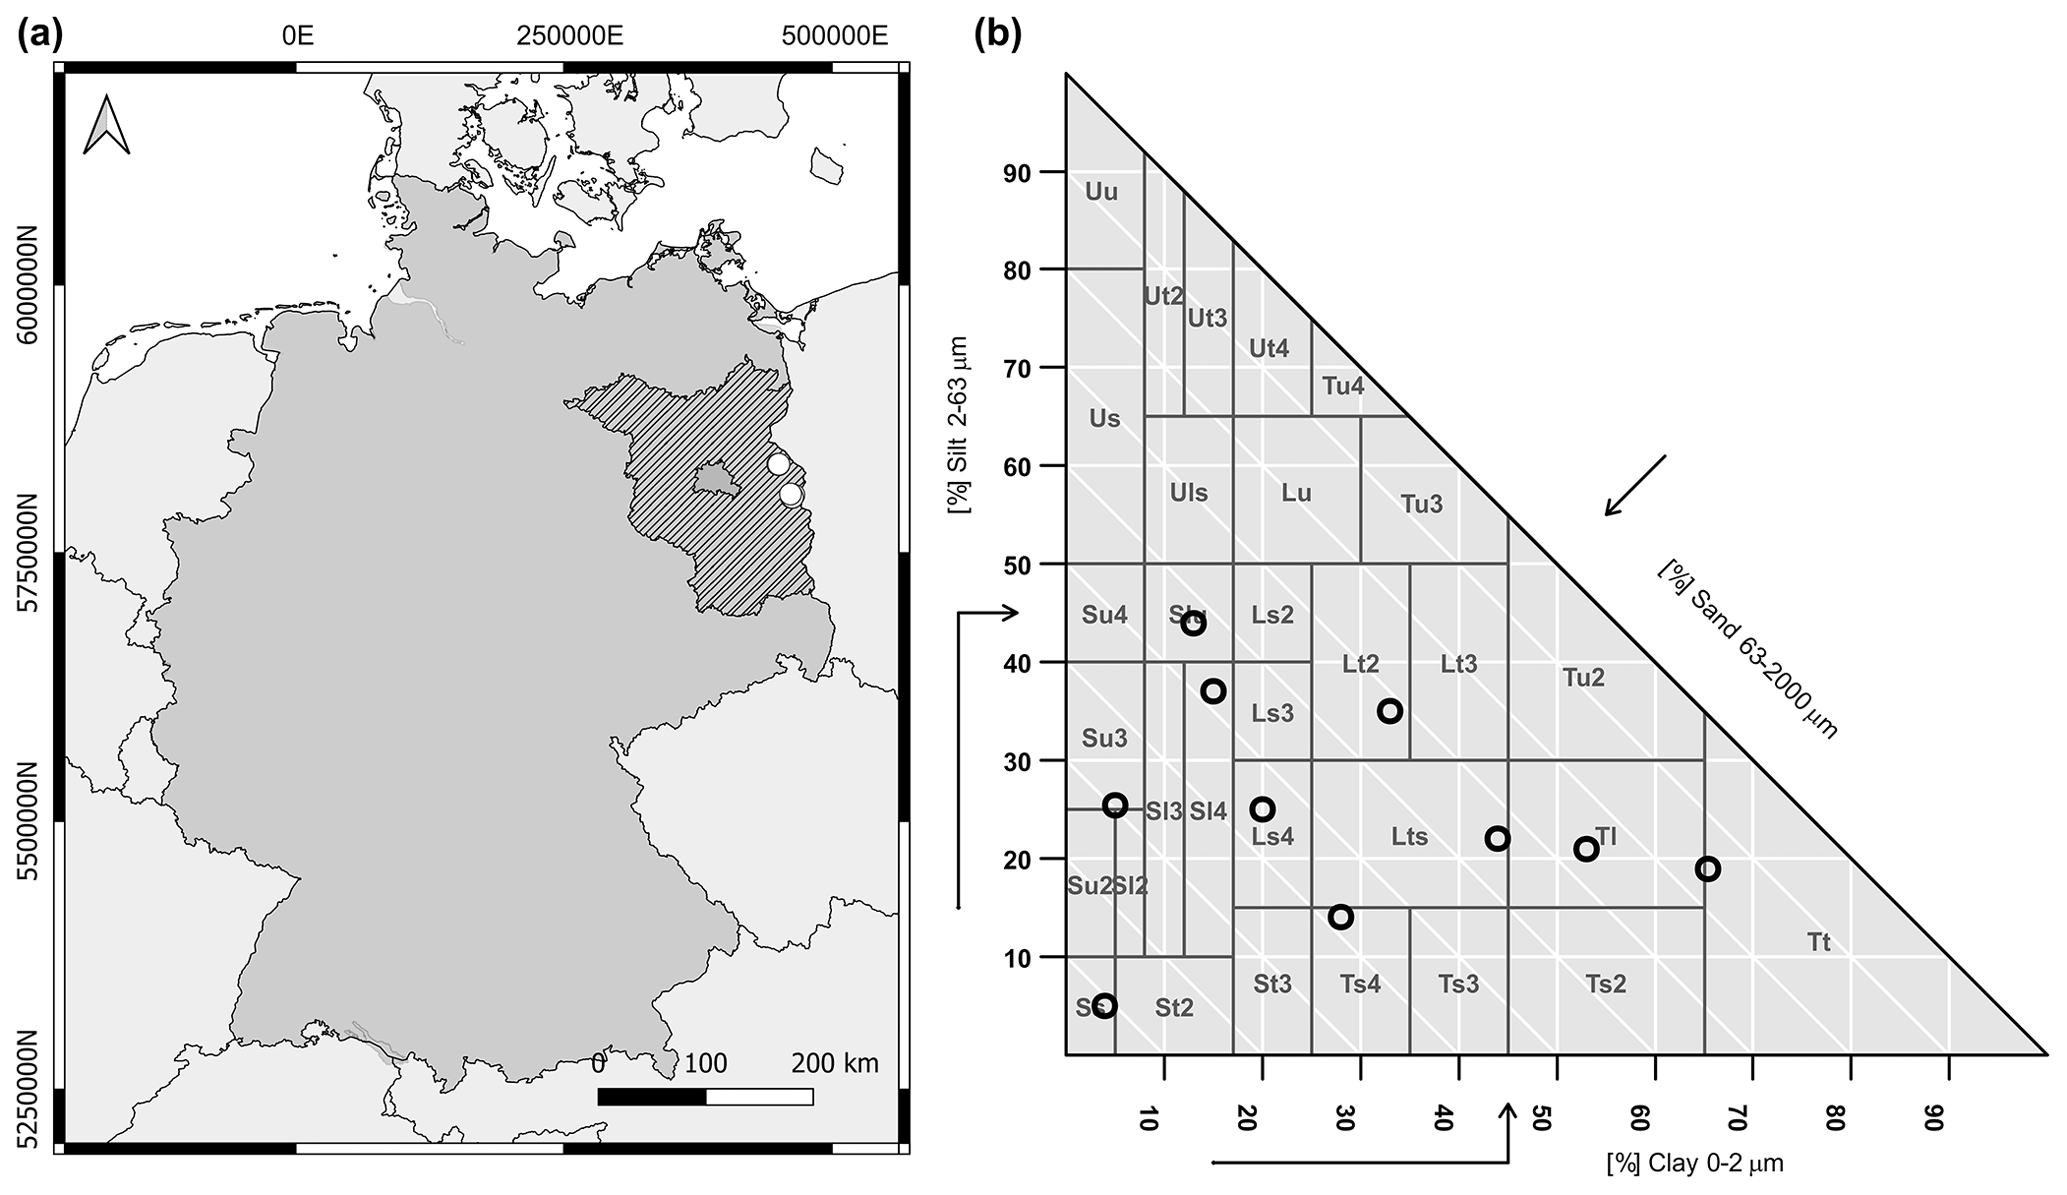
Figure 1(a) Map of Germany, with the location of the study sites (white dots) in the federal state of Brandenburg (shaded area). (b) Classification of the 10 soil samples using the soil texture triangle of the German soil survey manual KA5 (Eckelmann et al., 2005).
In order to determine the effect of different soil moisture contents and soil textures on sensor pH measurements, 10 soil samples with a great range of values in terms of the grain size fractions of sand, silt, and clay were selected using the soil texture triangle of the German soil survey manual KA5 (Eckelmann et al., 2005; Fig. 1b, Table 1). This includes the following 10 soil textures: sandy sand (Ss), strongly loamy sand (Sl4), medium silty sand (Su3), silty loamy sand (Slu), strongly sandy loam (Ls4), sandy clayey loam (Lts), slightly clayey loam (Lt2), strongly sandy clay (Ts4), loamy clay (Tl), and clayey clay (Tt). They cover 3 out of 4 soil texture main groups (sand, loam, and clay) and 6 out of 11 soil texture groups (pure sand, silt sand, sand loam, normal loam, clay loam, and loam clay; Eckelmann et al., 2005). Hence, sand, silt, and clay contents range from 16 % to 91 %, 5 % to 44 %, and 4 % to 65 %, respectively.
2.2 Measurement setup and procedure
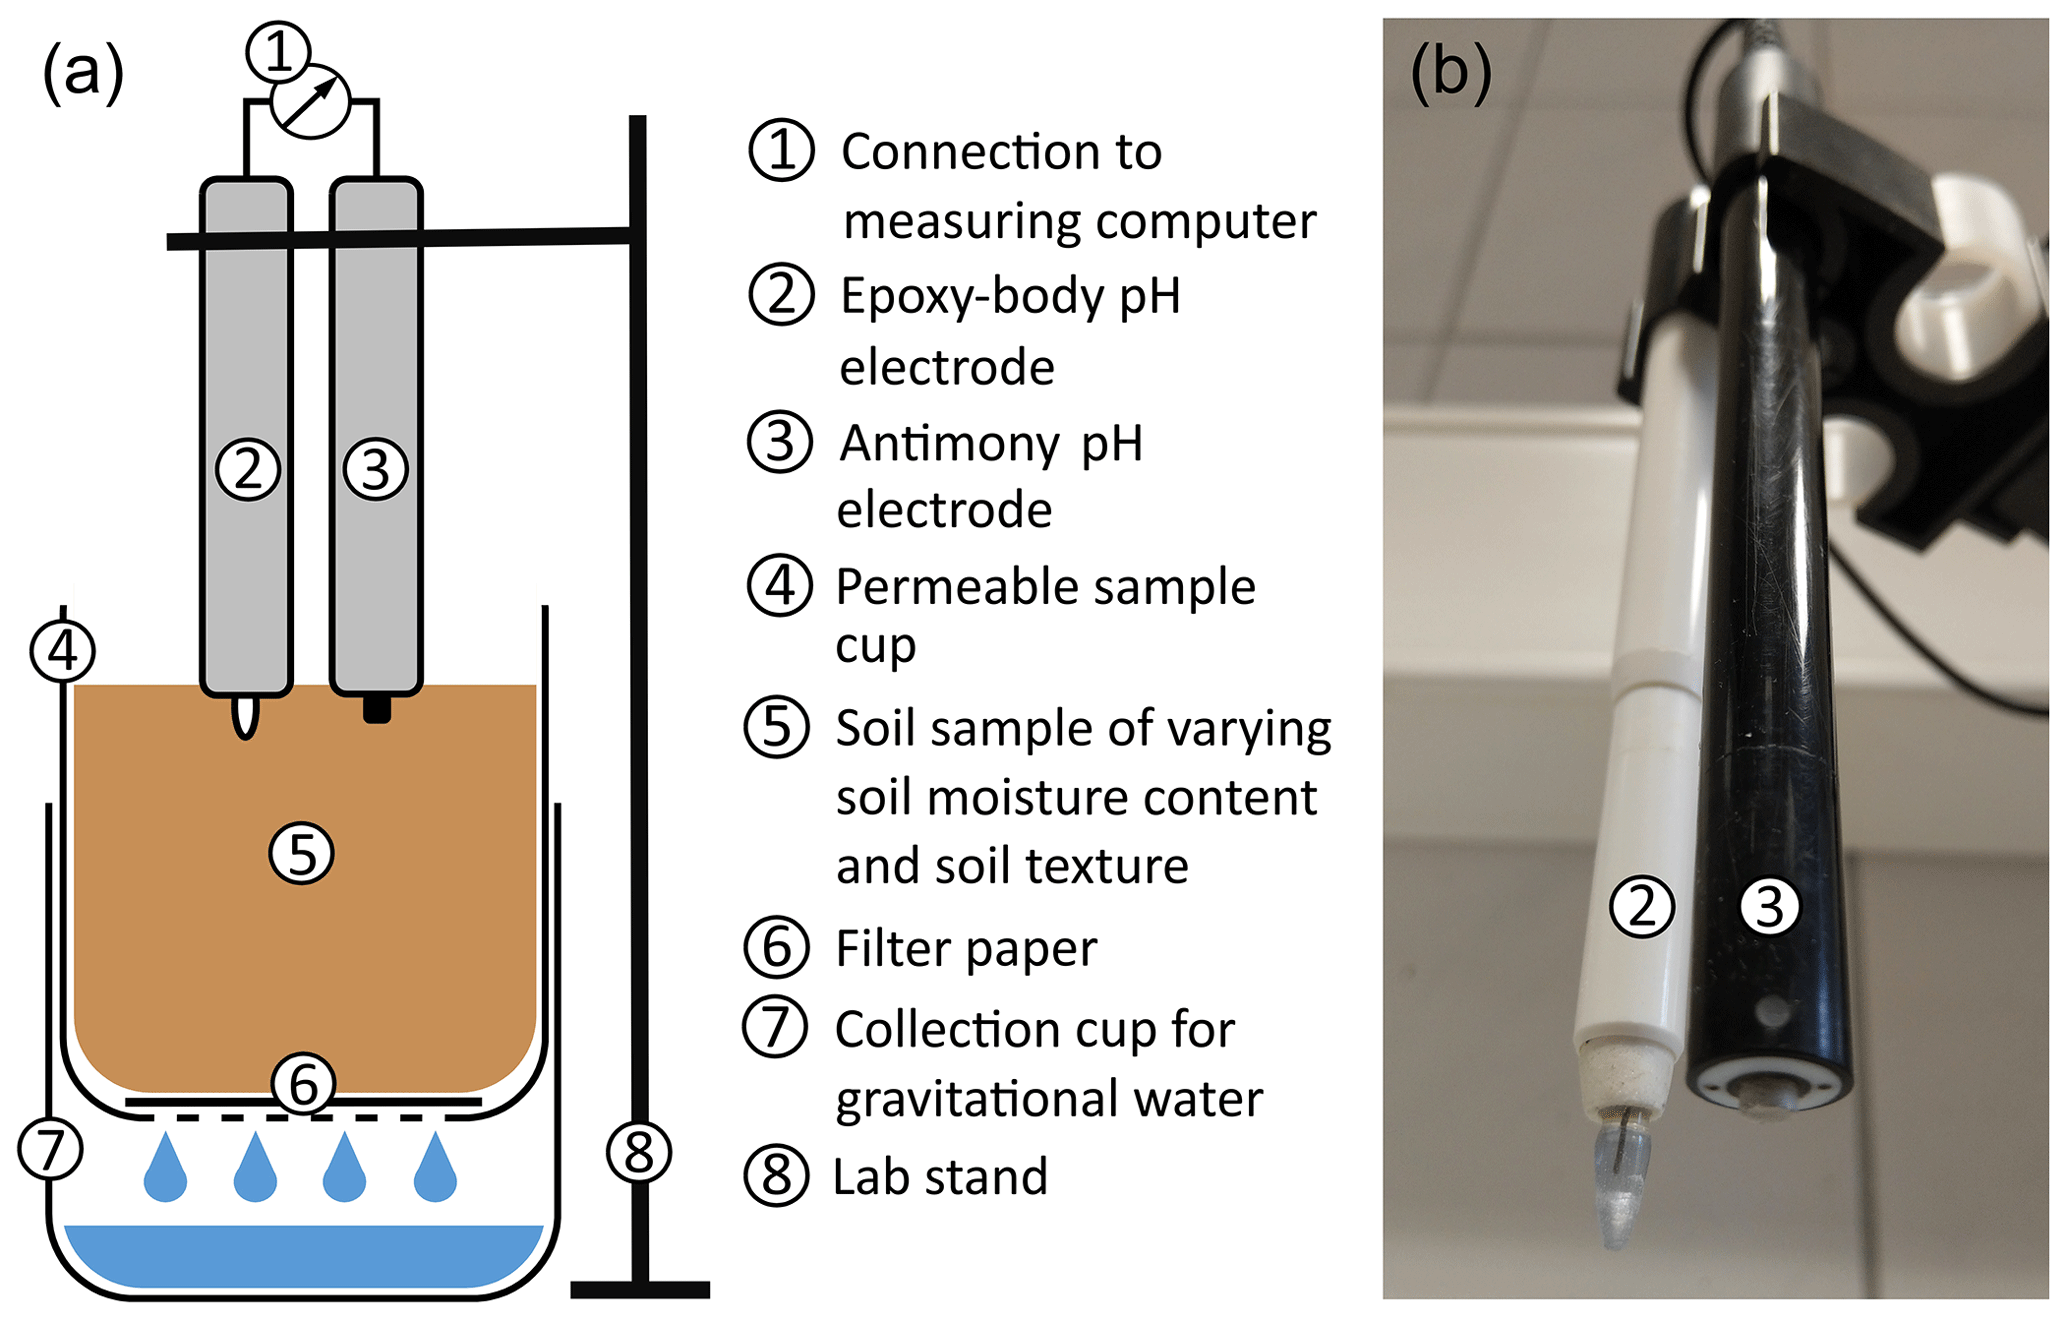
For baseline comparison, at first, the standard laboratory pH value of the soil samples was measured in 10 g of soil and 25 mL of 0.01 M CaCl2 (soil : solution ratio of 1:2.5) with a glass electrode after 60 min (DIN ISO 10390). In order to measure the pH values of the soil samples under different soil textures and SMCs, an individual laboratory-based measurement setup was developed and applied on oven-dried (70 °C) and sieved (< 2 mm) soil samples. It is schematically illustrated in Fig. 2. Two pH sensors were used: (a) an antimony electrode by Geoprobe (Geoprobe Systems, Salina, KS, USA) and (b) a ruggedized glass membrane electrode with a spear tip packaged in an epoxy body (hereafter called epoxy-body electrode) by PCE Instruments (PCE Deutschland GmbH, Meschede, Germany).
The membrane of the antimony electrode consists of a thin layer of antimony trioxide (Sb2O3), formed by oxidation of the surface of a cylindric piece of antimony at the tip of the electrode. It has an Ag AgCl system as reference electrode. The electrode potential is generated by the reaction of the Sb2O3 layer with the H+ ions in the sample solution. Antimony electrodes can be used to reliably measure the pH in a range between 3 and 11 (Parks and Beard, 1933; Bates, 1961). The epoxy-body electrode is made of a rugged epoxy body and has a glass membrane formed in a spear shape, which served as the measuring tip. Thus, it is more resistant to mechanical stress compared to standard glass electrodes with glass bodies. It consists of an Ag AgCl reference electrode and covers a pH measuring range of 1 to 13. For more detailed information regarding the glass and antimony pH ISEs, the reader is referred to Fujimoto et al. (1980) and Schirrmann et al. (2011).
Ion-selective pH electrodes are generally considered to be reliable and accurate, but they can experience drift over time, which refers to a slow, gradual change in their response or calibration over time, leading to inaccurate pH measurements. Possible factors that can contribute to drift are electrode aging, reference electrode issues, ion-selective membrane contamination, temperature changes, sample contamination, or improper storage (Durst, 1978; Comer, 1991; Orellana et al., 2011). Regular calibration and maintenance are essential to minimize drift in ion-selective pH electrodes. Calibrating the electrode with standard buffer solutions, following proper storage and handling procedures, and replacing the electrode or its components when necessary can help maintain accuracy and reliability in pH measurements over time.
The pH ISE should be calibrated at least at the beginning of each day or before each set of measurements. For in situ measurements, changing environmental conditions, such as major temperature fluctuations during the day, can impact the electrode performance. In this case, it may be necessary to calibrate more often or to perform a temperature compensation by integrating temperature measurements. Temperature and pH value are related as the activity of ions in solution is temperature dependent. This relationship is described by the Nernst slope in the Nernst equation (Barron et al., 2006). For the analysis, 100 g of soil was weighed into a 125 mL sample cup that has a perforated lid on the underside. This allows excess water to leave the soil into a sample cup underneath. A filter paper was placed on the perforated lid of the cylinder to protect sample material from being washed out. The two pH ISEs were fixed side by side in a laboratory stand and connected to self-developed ISE hardware and data acquisition software on a measuring computer. The setup is used for sensor calibration and data logging and was especially designed for measuring simultaneously with multiple ISEs. The ISE hardware has a high impedance input amplifier for measuring the low-output voltages of the antimony electrode.
Before each set of measurements, the pH electrodes were calibrated at the beginning of a measurement day using pH 7.01 and pH 4.01 buffer solution (Hanna Instruments). The electrodes were immersed in the buffer solution for 2 min for the pH readings to stabilize. The sensor pH values of the buffer solutions were simultaneously measured for both pH ISEs, and a calibration line was generated and displayed by the software. After each pH measurement, the sensor heads were cleaned with distilled water to prevent carry-over effects.
The very first pH measurements were conducted on dry soil samples, with only the final droplet of distilled water from the cleaning remaining on the sensor heads. Measurements were conducted for 30 s with five repetitions. The pH data were automatically recorded seven to eight times per second and were continuously displayed in a diagram. After completing the measurements, the samples were oven-dried at 70 °C.
After drying, 4 mL of distilled water was added to the same soil sample. In order to obtain a homogeneous distribution of the water in the sample, the pH values were measured after a settling time of 30 min. After pH measurement, the sample cup with the moist sample was weighted, oven-dried at 70 °C, and reweighted to determine its exact gravimetrical SMC on a wet-weight basis.
In a next step, the previous amount of distilled water was increased by 4 mL, adding 8 mL to the dried sample, and the pH values were measured again after 30 min of equilibration. After weighting, drying, and reweighting, the procedure began again. The added water was continuously increased by 4 mL until the maximum capacity of capillary water was obtained in the sample (near field capacity) and gravitational water began to flow out of the sample via the perforation at the bottom of the sample cup. The same procedure was repeated for all 10 soil texture samples.
It has to be emphasized that the soil samples are disturbed, and capillary water is only held by the texture-related primary structure of the soil. Consequently, the maximum capacity of capillary water deviates from field capacity under undisturbed conditions, additionally taking into account the secondary or aggregate structure of the soil. The maximum SMC near field capacity was 16 % for sandy soils (21 mL of water added) and 29 % for clayey soils (40 mL of water added).
2.3 Data analysis
All data were processed and visualized in the free software environment for statistical computing and graphics R (version 4.1.0; R Core Team, 2018). Arithmetic means and standard deviations (σ) of the five repeated pH measurements were calculated. The R functions lm and nls, implemented in the stats package (R Core Team, 2018), were used for fitting linear and non-linear regression curves, respectively. The Spearman rank correlation coefficient (Spearman's rho) was used in order to quantify and compare both linear and non-linear relationships. Furthermore, as it is based on the ranks of the data rather than actual values, Spearman's rho can handle non-normally distributed data and is less sensitive to outliers compared to other correlation metrics.
To correlate the data with the soil texture, the mean particle diameter (MPD) of the fine-earth fraction (< 2 mm) was calculated. It was determined by the geometric mean of the particle diameter, which was obtained from transformation of the sand, silt, and clay contents (Shirazi et al., 1988; Shiozawa and Campell, 1991) following Eq. (1):
where MPD is given in 10−3 m, mi is the mass fraction of the particle size class i (kg kg−1), and di is the associated geometric mean diameter (10−3 m). The MPD was established by Shirazi et al. (1988) and applied in the context of soil pH management by Ruehlmann et al. (2021). The MPD has the advantage of being able to subsume the three grain size fractions of sand, silt, and clay into one single value for soil texture characterization. As the MPD of the 10 soil textures used is skewed, it was converted into phi scale following Krumbein (1934, 1938; Eq. 2):
where ϕ is the negative logarithm to the base 2 of the mean particle diameter (10−3 m). This allows us to put more emphasis on the finer grain sizes (Donoghue, 2016).
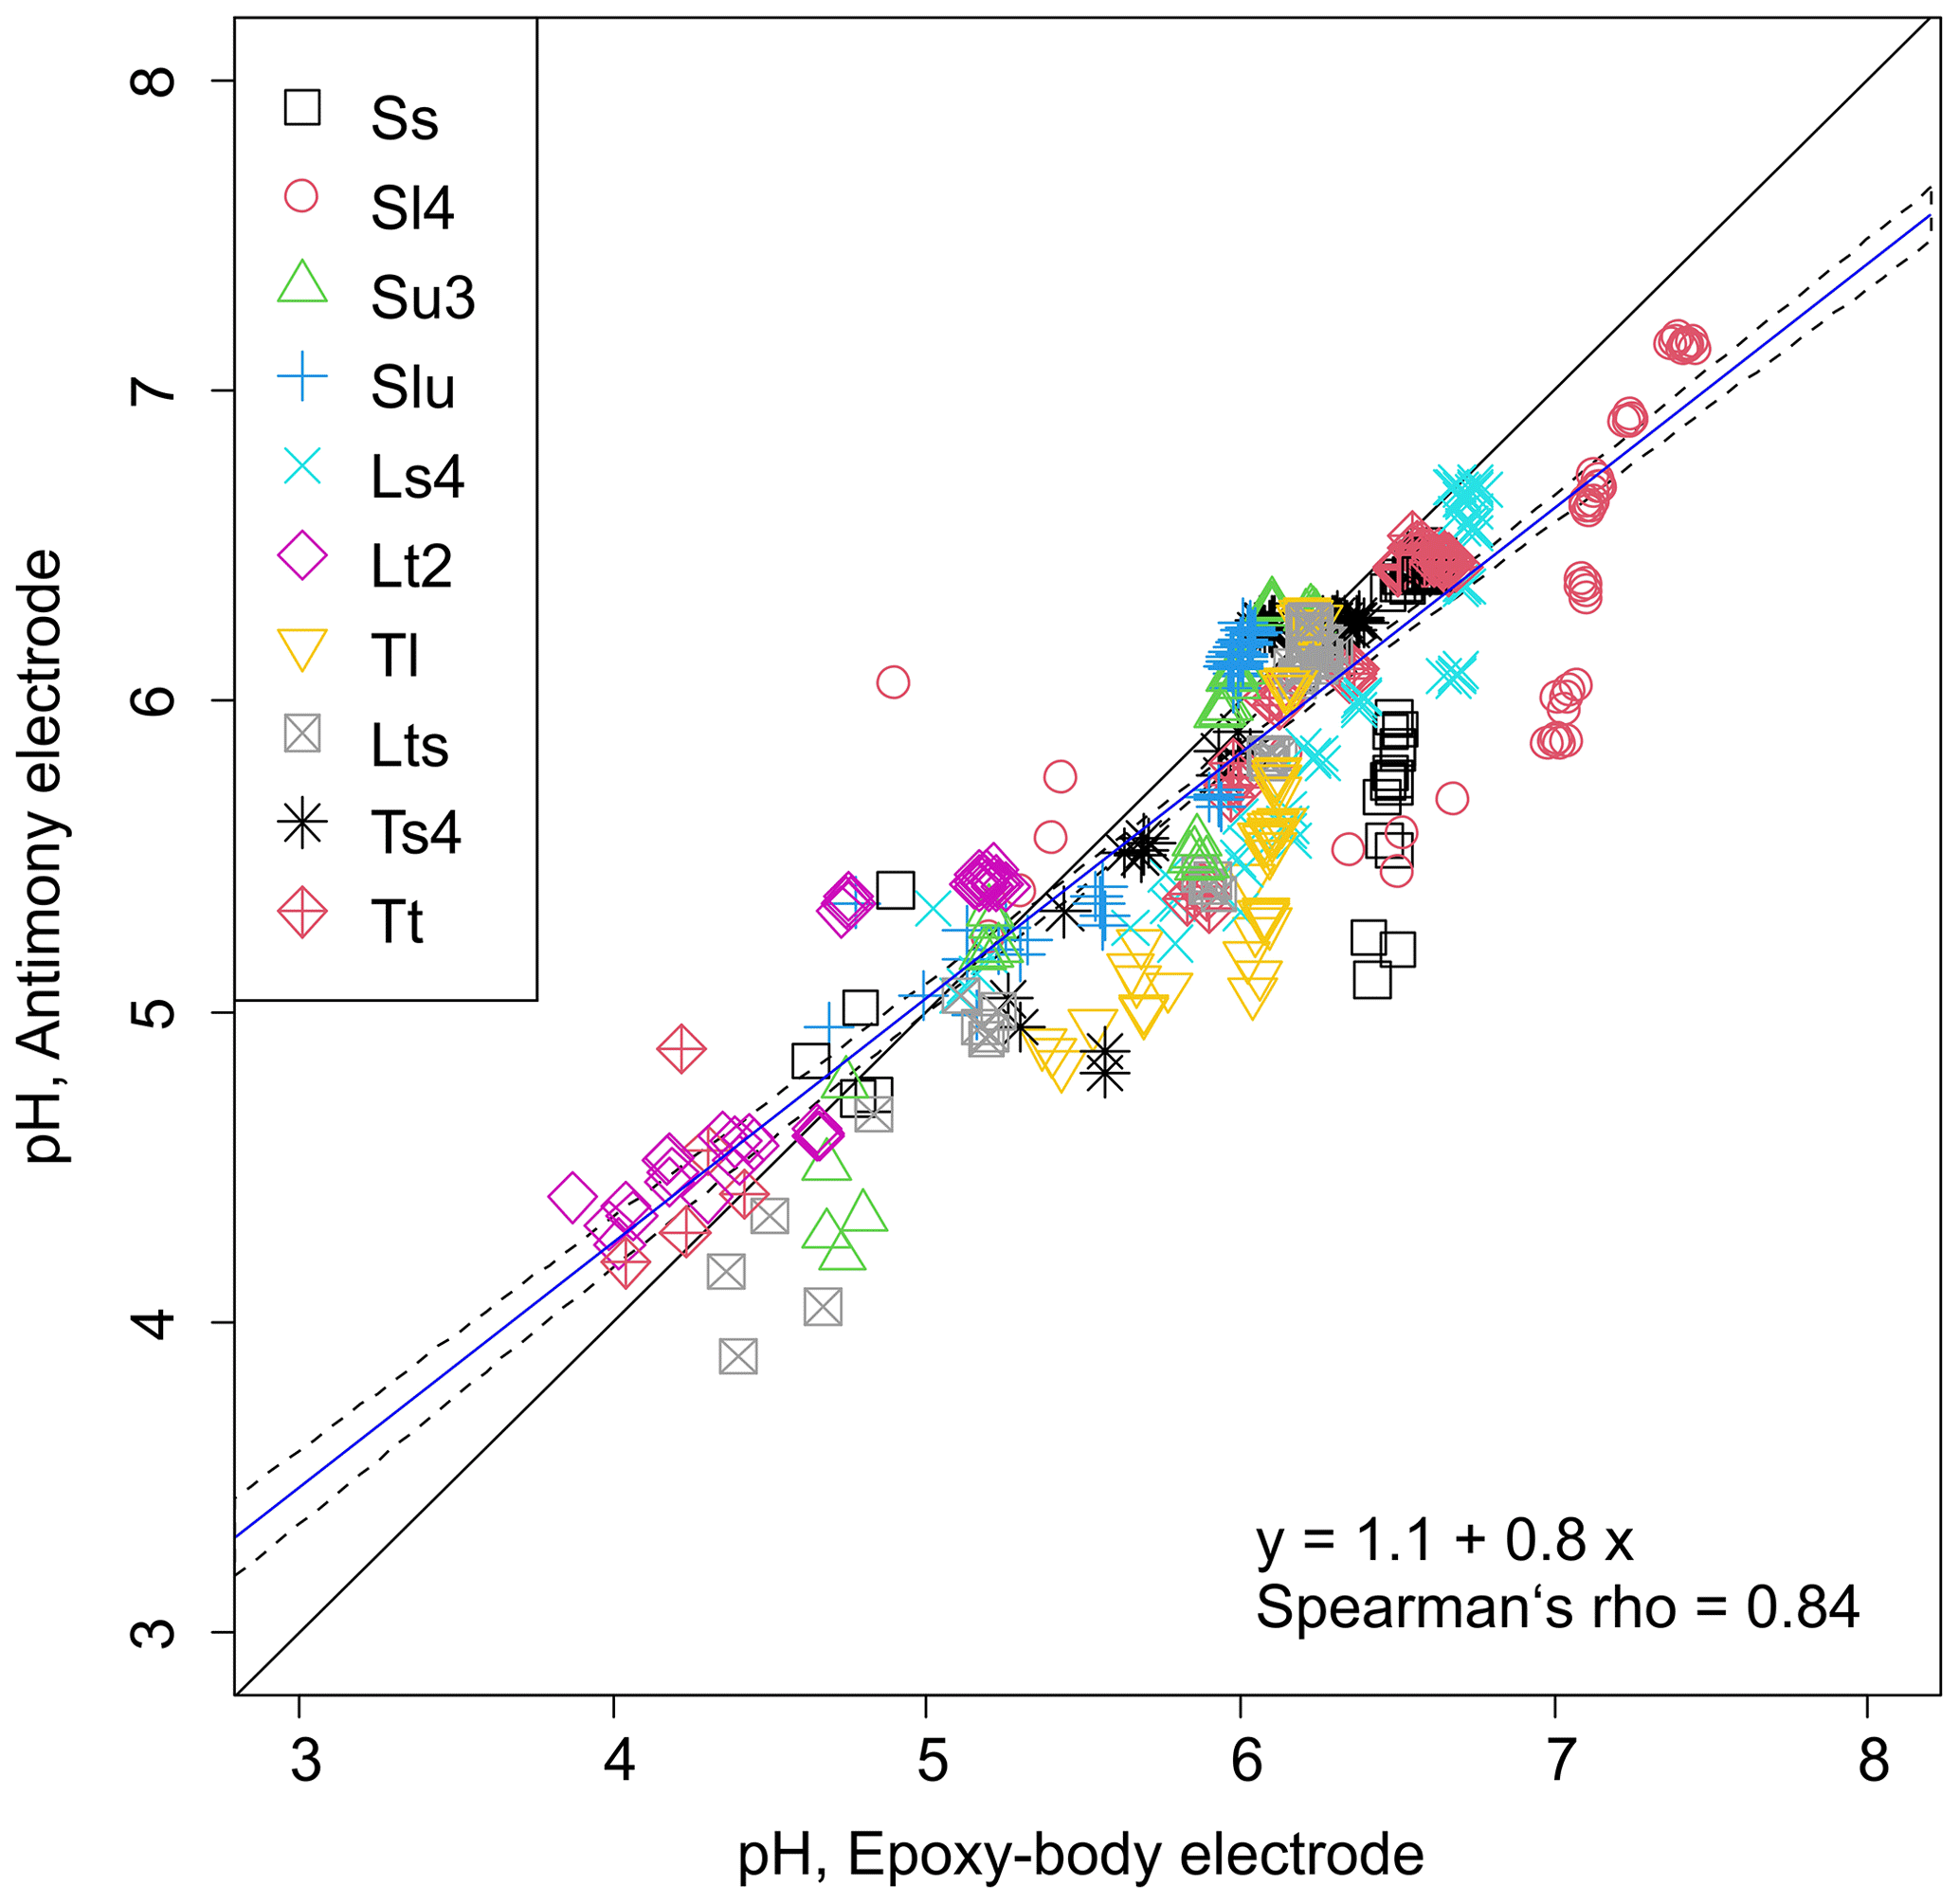
Figure 3Correlation between pH values measured with the epoxy-body electrode and the antimony pH electrode in different soil textures and under different soil moisture regimes (solid black line: 1:1 line, solid blue line: linear regression model, dashed black lines: 95 % confidence interval).
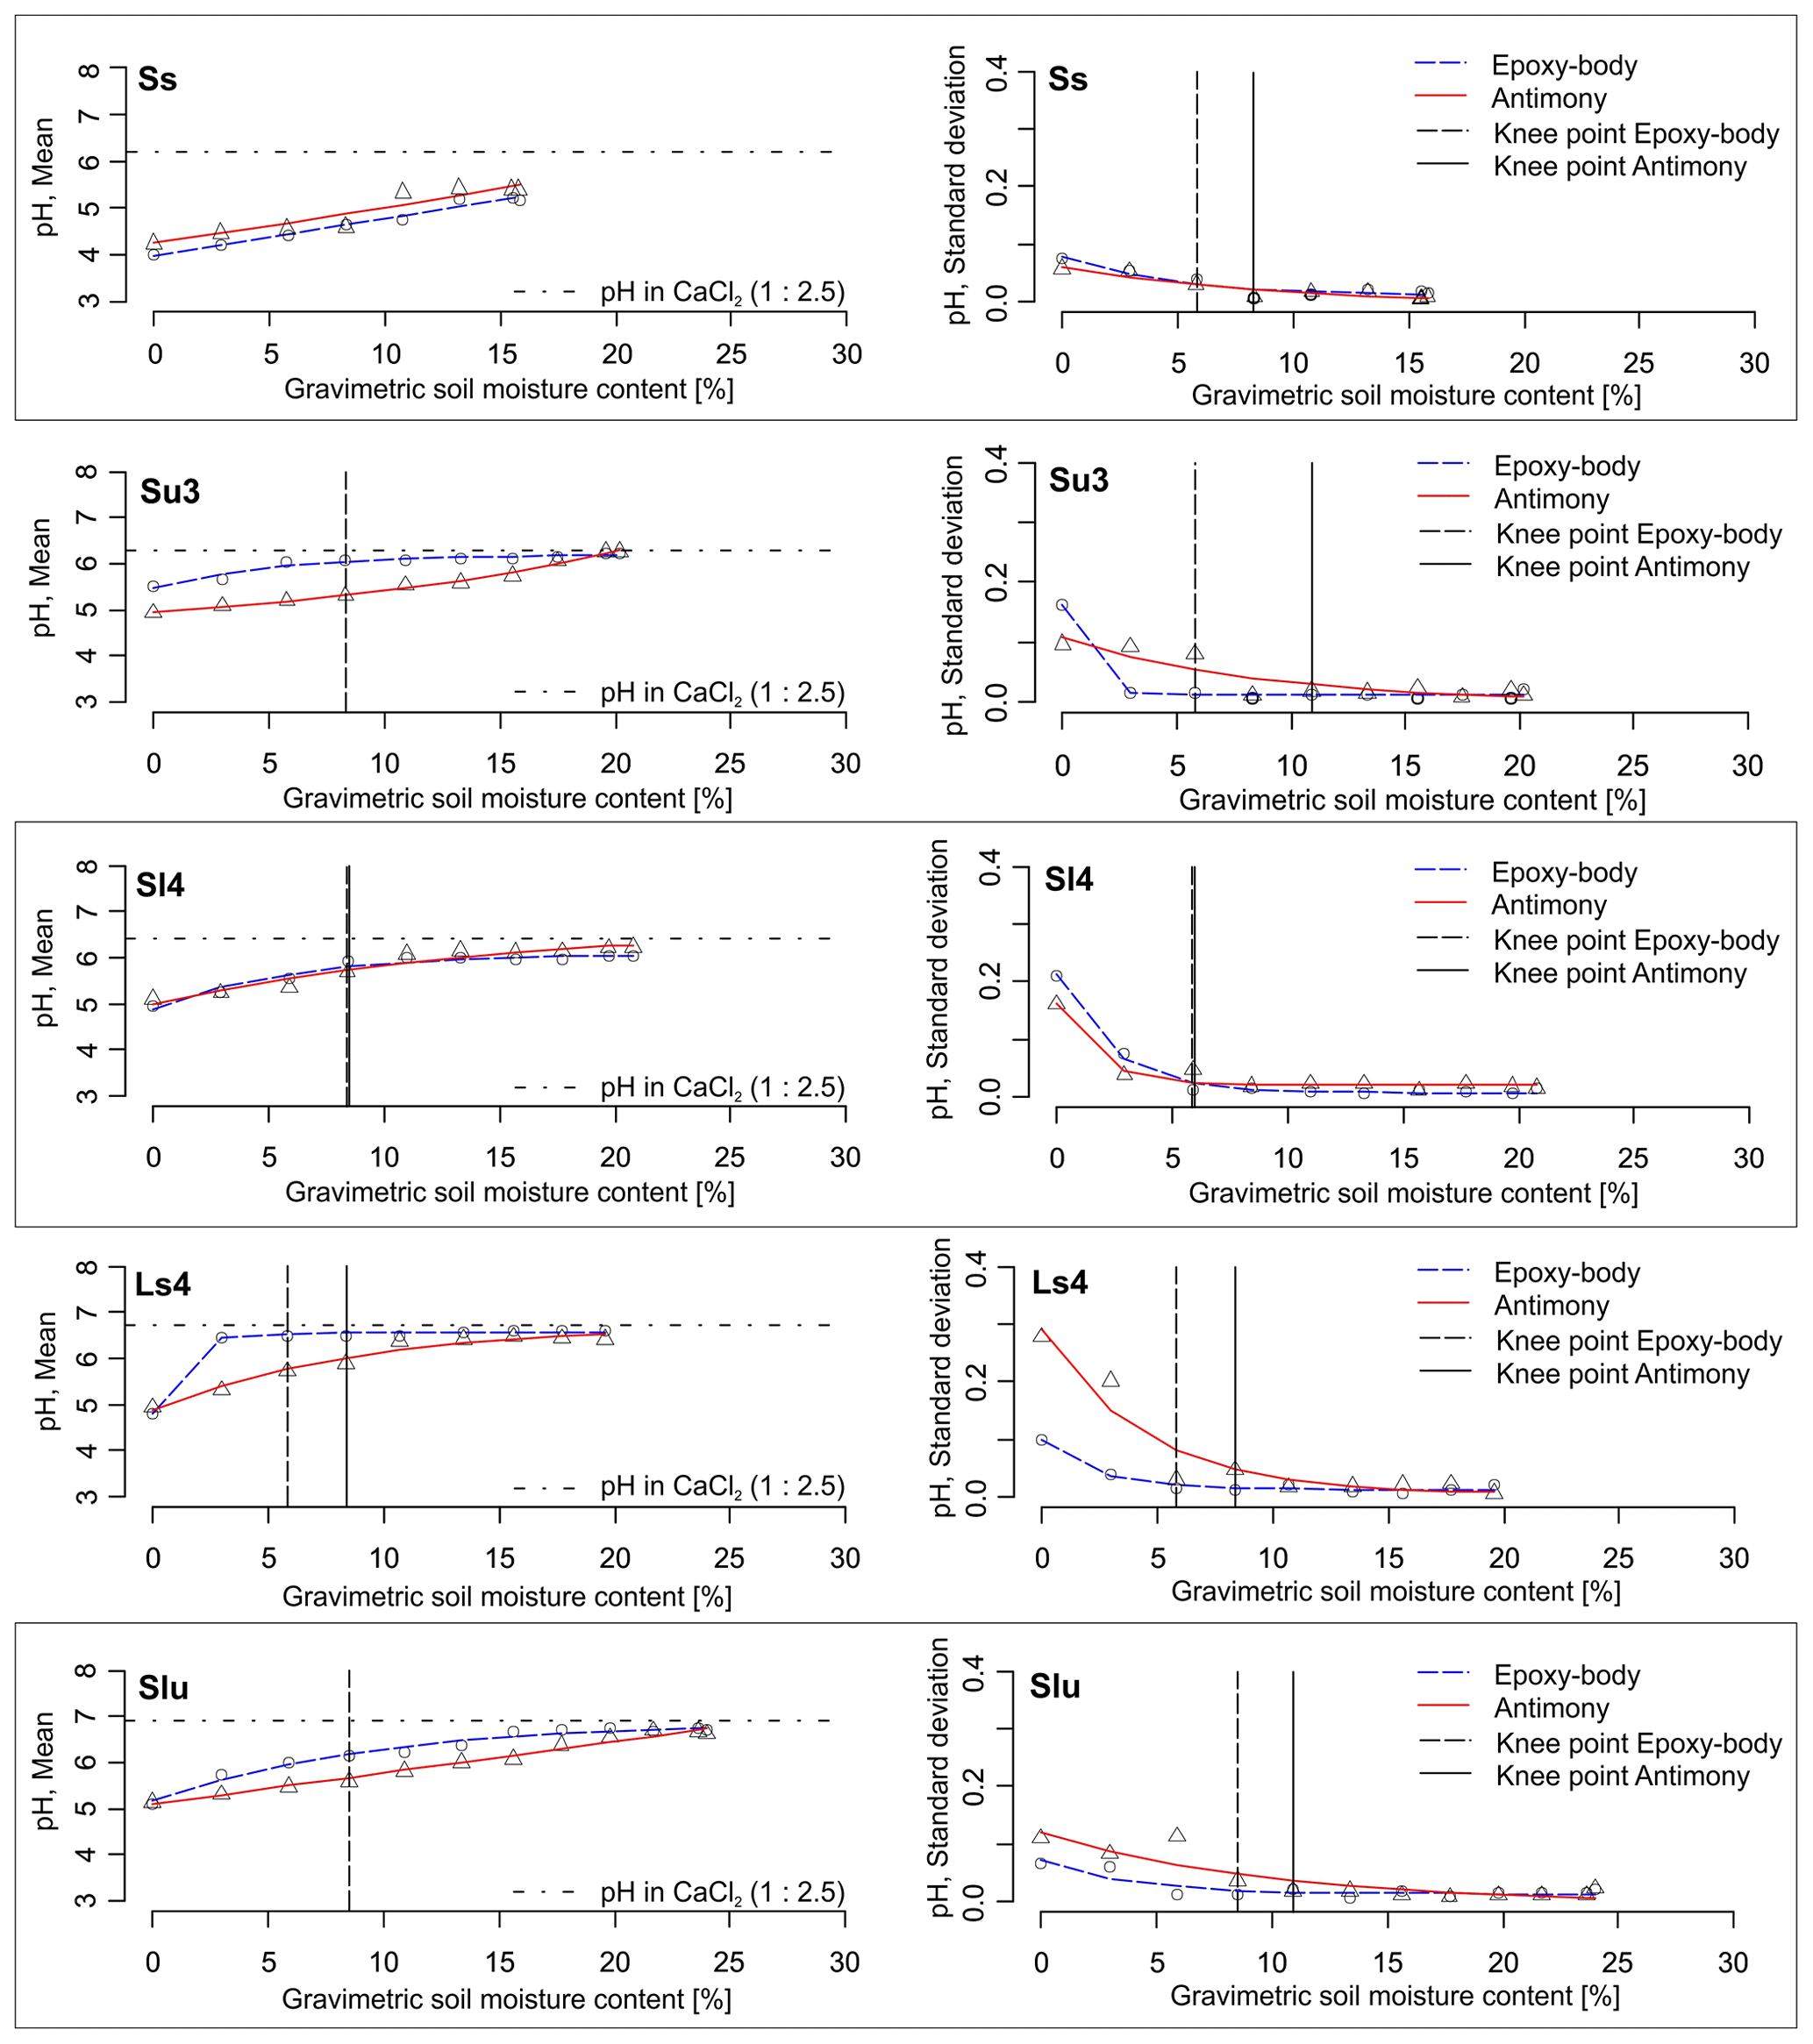
Figure 4pH–SMC plots for different soil textures measured with the epoxy-body electrode and the antimony electrode. Left: mean pH values, right: standard deviations (n=5). Knee points are indicated by vertical lines.
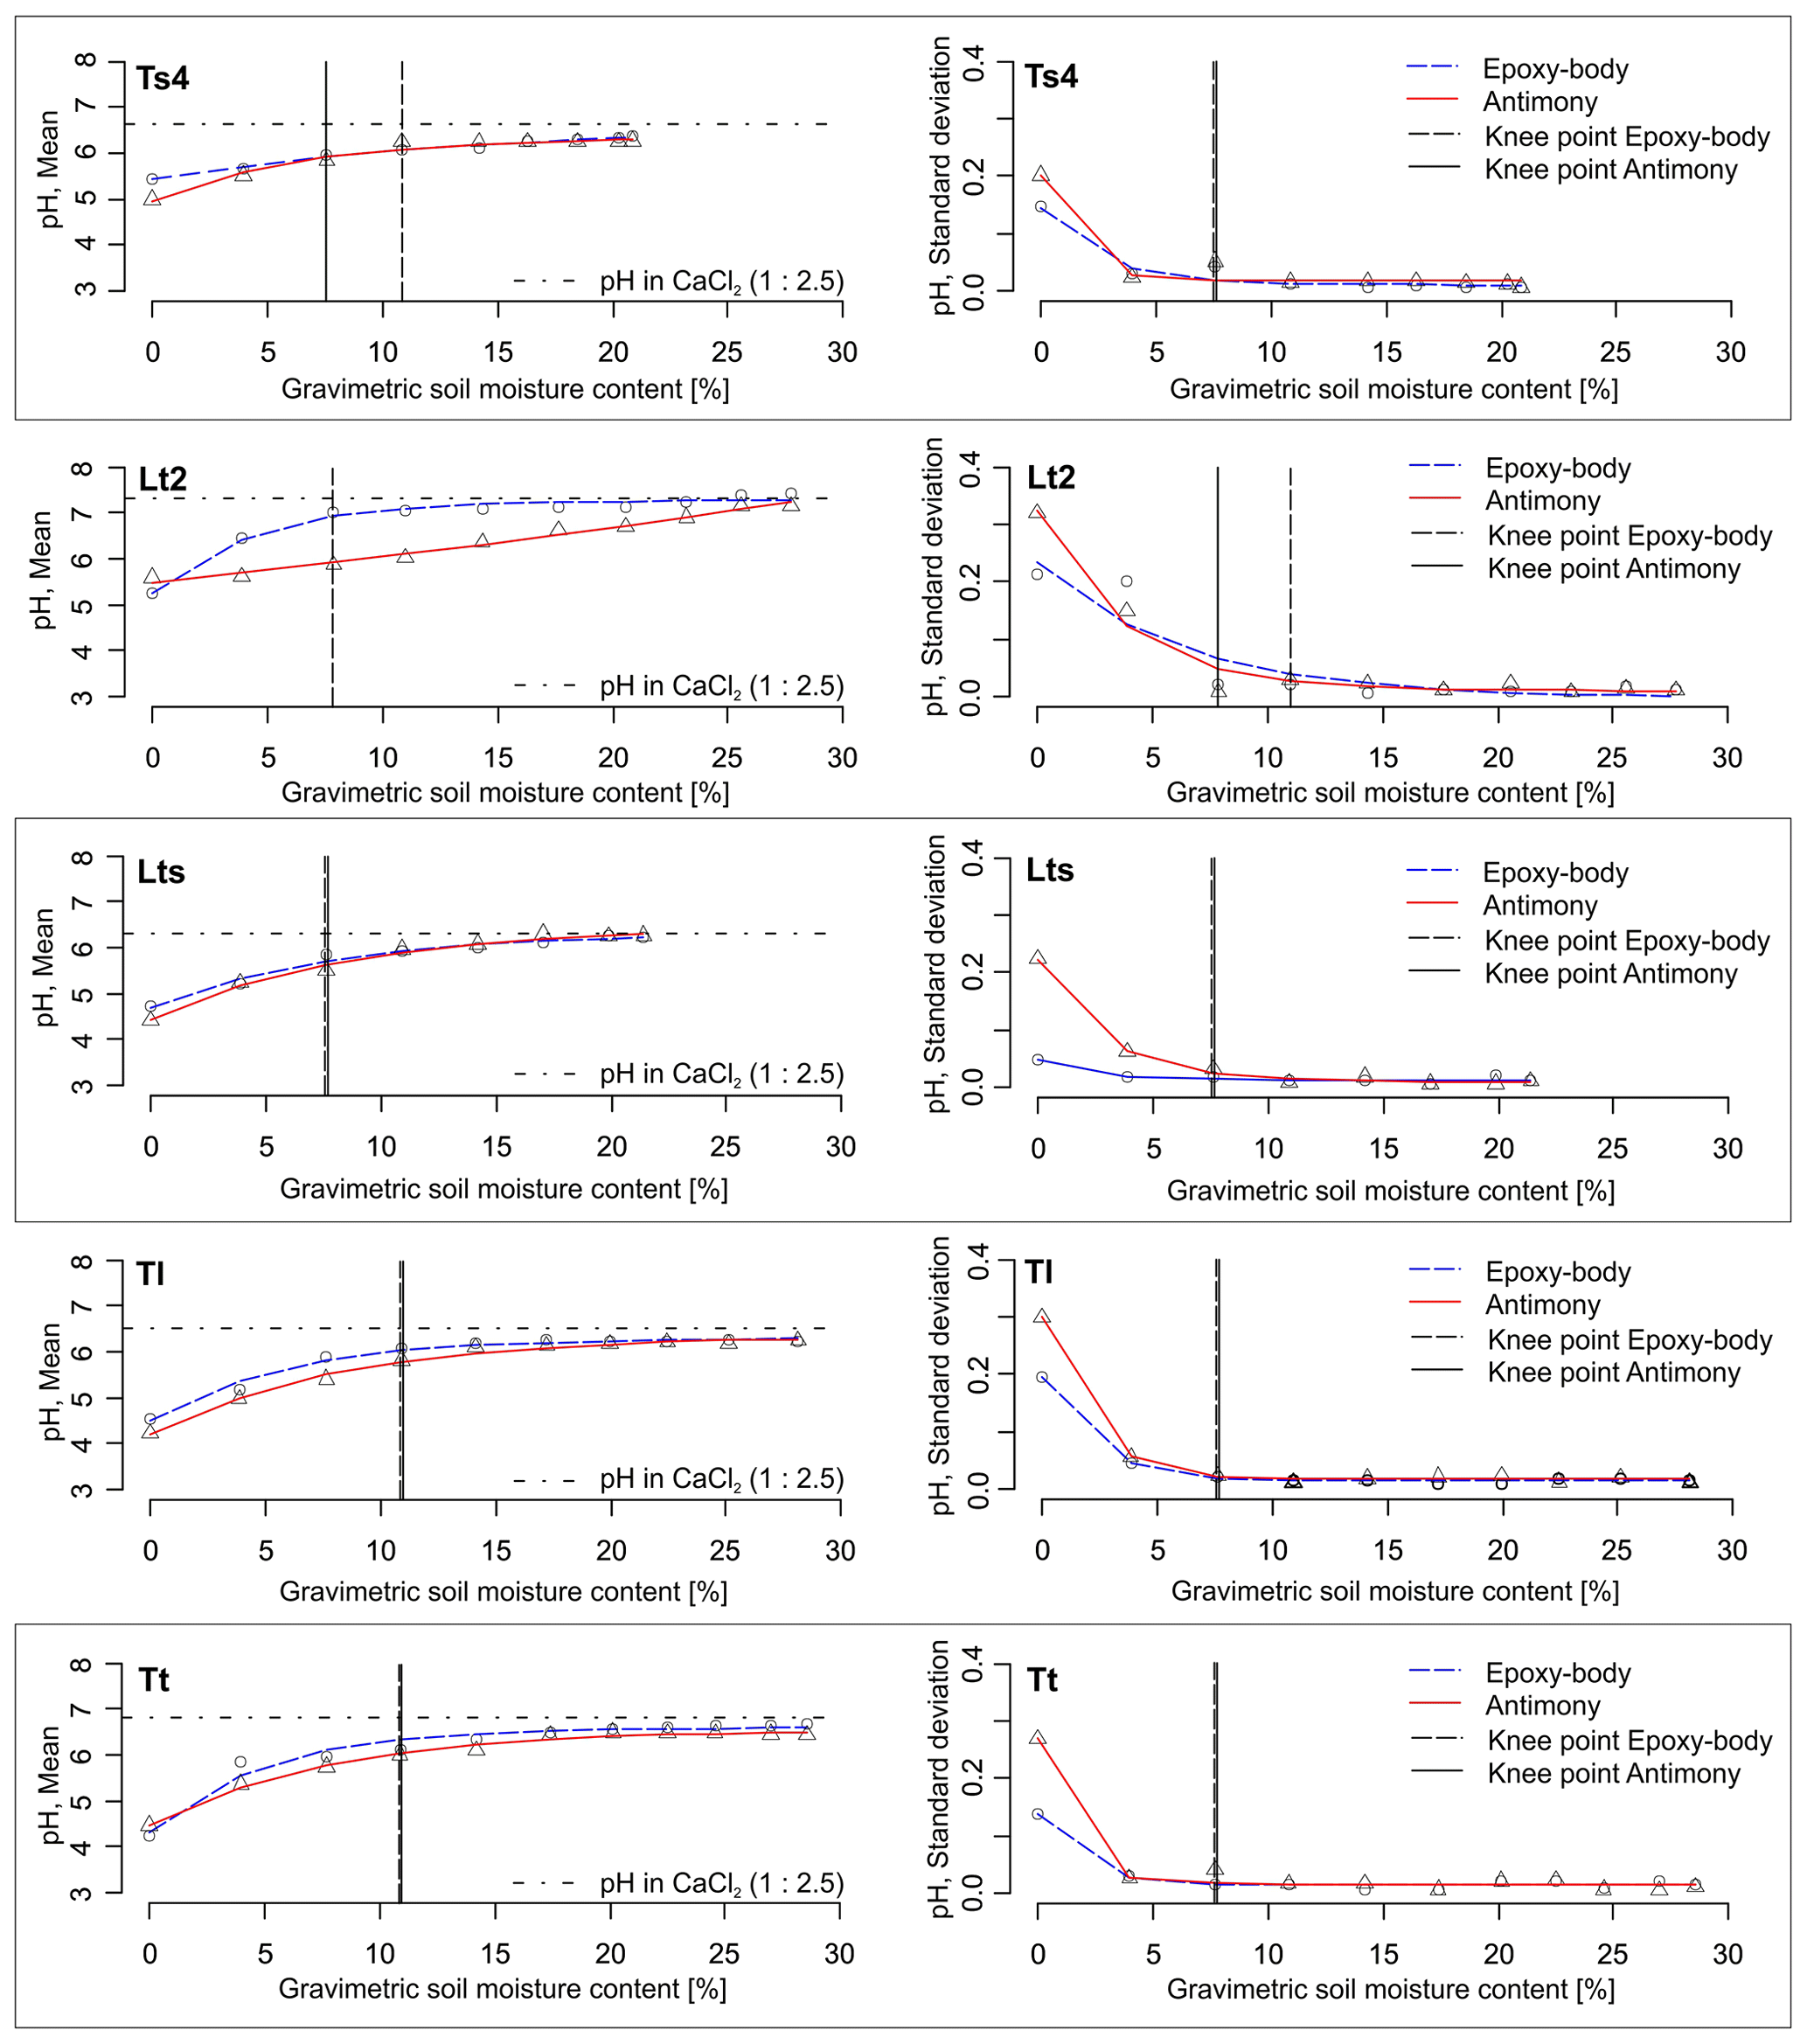
Figure 5pH–SMC plots for different soil textures measured with the epoxy-body electrode and the antimony electrode. Left: mean pH values, right: standard deviations (n=5). Knee points are indicated by vertical lines.
To approximate the SMC at which the mean pH readings of the ISE begin to stabilize and the standard deviation of repeated measurements is minimized, the knee points of the regression curves were detected using the kneer package in R, which implements the kneedle algorithm by Satopää et al. (2011). A knee of a graph can be considered to be an operating point, where the perceived cost to alter a system parameter is no longer worth the expected performance benefit (Satopää et al., 2011). In the context of the present study, a knee can be defined as the point from which the pH change with continuously increasing SMC is negligible. For knee point detection, the mathematical definition of curvature is used, where, for a continuous function f, there exists a standard closed-form Kf (x); the curvature of f at any point is a function of its first (f′) and second (f′′) derivative (Satopää et al., 2011):
Figure 3 shows the linear correlation between pH values measured with the epoxy-body electrode and the antimony pH electrode. It has a Spearman's correlation coefficient of 0.84 and a regression line that deviates slightly from the 1:1 line by having an intercept of 1.1 and a slope of 0.8. This indicates a non-conformance in the pH measurements of the two ISEs, which increases towards lower and higher pH values, respectively. It is ± 0.1 pH units between pH 4.7 and 5.7 and rises to 0.5 pH units at pH 7.5. From the scatterplot, it can be seen that a large fraction of pH data of the same soil texture class are clustered around similar pH values. Hence, the non-conformance in pH data from the epoxy-body and antimony ISEs may, in part, be texture related. Furthermore, it can be observed from the pronounced vertical distribution of pH values parallel to the y axis, especially for Ss, Sl4, and Tl, that the measurements of the antimony ISE are scattered over a wider pH range compared to those of the epoxy-body ISE.
The arithmetic means and standard deviations of the five repeated sensor pH measurements at varying SMCs and soil textures are shown in Table 1 and Figs. 4 and 5. The corresponding data table with all measured pH values can be found in Tables S1 and S2 in the Supplement. In dry soils (0 % gravimetric SMC), the epoxy-body electrode measured pH values between 4 (strongly acidic) and 5.5 (weakly acidic). Near field capacity, the pH increased to values between 5.2 (moderately acidic) and 7.4 (weakly alkaline). The measurement with the antimony electrode produced similar results, measuring pH values between 4.2 (strongly acidic) and 5.6 (weakly acidic) in dry soils and between pH 5.4 (weakly acidic) to 7.1 (weakly alkaline) near field capacity. The data show that, with increasing SMC, pH values successively increased by approximately 1.5 pH units with both pH ISEs used. This pH increase is considerably higher compared to that of de Souza Silva and Molin (2018), who observed a pH increase of 0.9 units in Brazilian Oxisoles and an increase within the upper range of 1 to 1.7 pH units, as reported by Patil et al. (2019), in red and bentonite soils in India. Figure 6 illustrates that this maximum pH increase is soil texture dependent. It is lower for sandy soils (higher mean particle diameter (MPD), lower phi-scaled MPD) and higher for clayey soils (lower MPD, higher phi-scaled MPD; Table 1). Thus, the influence of soil moisture variation on the sensor pH measurement is lower for sandy soils and higher for clayey soils.
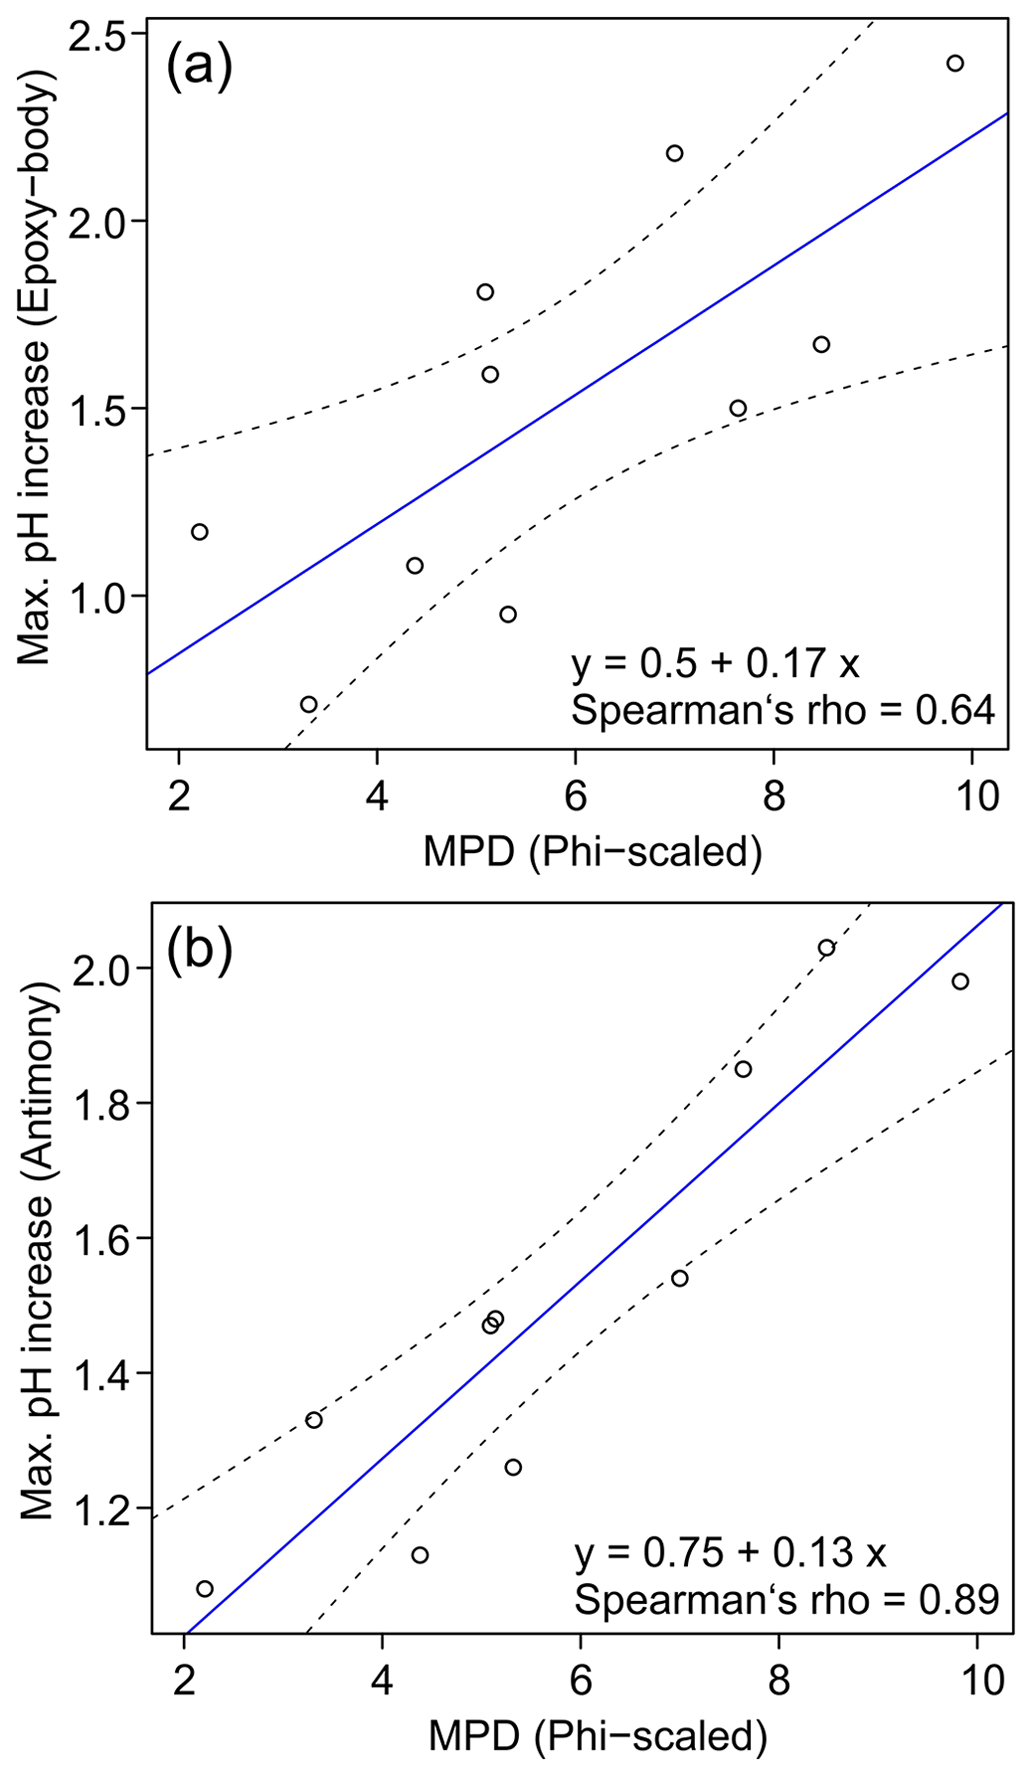
Figure 6Correlation between mean particle diameter (phi-scaled) and maximum pH increase for the epoxy-body electrode (a) and the antimony electrode (b) (solid blue line: regression model, dashed black lines: 95 % confidence interval).
The increase in the mean pH value with increasing SMC can be best described by an exponential model of the following type:
where α, β, and γ are the regression coefficients of the exponential function describing the geometry of the graph. While α represents the maximum pH value at the soil's maximum amount of capillary water near field capacity, β is the difference between the starting point (SMC = 0) and the end point of the graph (near field capacity), i.e., the maximum pH increase. Finally, γ refers to the curvature of the graph. When γ is near 1, the graph has a nearly linear course, and when γ approaches 0, the curve runs at an almost right angle, exhibiting a strong concavity with a steep ascent.
For pure sand, the relation between pH and SMC is linear, with γ being close to 1 irrespective of the pH ISE used. That means the pH value increases constantly with increasing SMC over a wide range of moisture regimes. For the epoxy-body ISE and all other soil textures, γ ranges between 0.4 and 0.9 (Table 1), indicating a pronounced curvature of the fitted functions. In contrast, for the antimony ISE, a nearly linear curve, with γ close to 1, is additionally observed for the soil textures Su3, Slu, and Lt2. For the other soil textures, especially the finer textures, the shape of the curve is also exponential (Table 1). As the mean γ of the epoxy-body ISE is slightly lower compared to that of the antimony ISE, the exponential character of the pH curve obtained with the epoxy-body ISE is slightly more pronounced.
As can be seen in Figs. 4 and 5, the pH values measured during our experiment were always lower compared to the standard laboratory pH value measured with a glass electrode in 0.01 M CaCl2 (soil : solution ratio of 1:2.5), irrespective of the pH ISE used and the soil texture and SMC the pH was measured in. In fact, with increasing SMC, the pH values approach this standard pH asymptotically. Consequently, for both ISEs, the pH value near field capacity is very similar to the standard pH value of a soil : solution ratio of 1:2.5. However, since the graph of the epoxy-body ISE shows a stronger concavity (lower mean γ), it comes near the standard pH value earlier, i.e., at lower SMC (Figs. 4 and 5). This implies that, at high SMC near field capacity, subsequent calibration of the sensor pH values to the standard pH value becomes less necessary. This is particularly interesting if the sensor pH data are to be used for lime requirement estimates.
Table 1Soil data and coefficients and Spearman'r rho of the exponential models, as well as SMC at knee points.
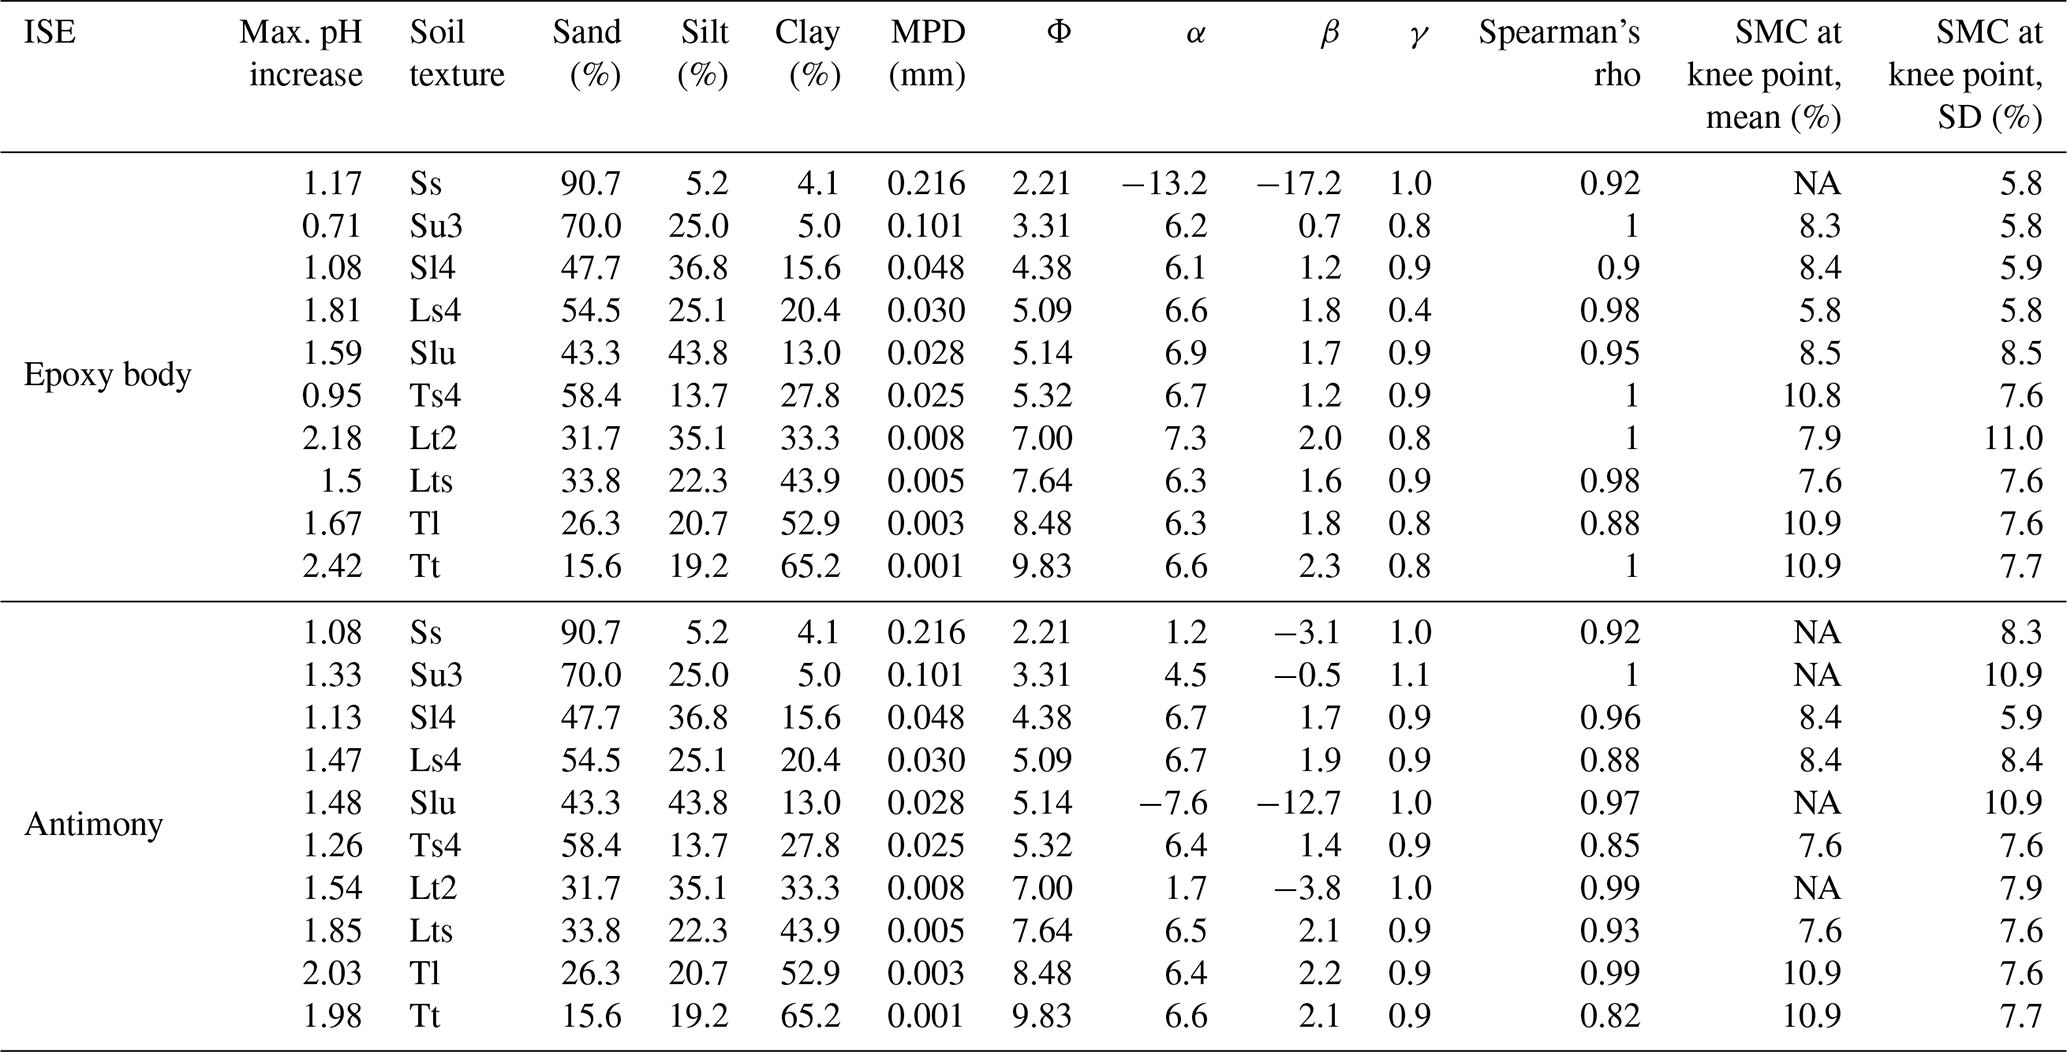
NA: not available.
The observed exponential pH increase with respect to increasing SMC is consistent with the findings of Oliviera et al. (2018) from tropical soils. However, besides for clayey soil textures, they also found an exponential relationship for sandy soils, which is in contrast to the present results. Patil et al. (2019) reported linearly increasing pH values for Indian red and bentonite soils. However, bentonite soils are characterized by a high clay content, which could not be confirmed in the present study, where a linear correlation was only observed for sandy soils. Zong et al. (2021) also observed an exponential pH increase with increasing SMC very similar to the observations for clayey textures in our study. However, in Zong et al. (2021), the soil texture was not reported.
From the knee point detection of the exponential curves, it can be seen that stable pH readings are expected at an SMC between 6 % (Ls4) and 11 % (Tt) for the epoxy-body ISE and between 8 % (Ts4) and 11 % (Tt) for the antimony electrode (Table 1, Figs. 4, 5). Even though, for Tl and Tt, the knee points were detected at the highest SMC, no clear relation to the soil texture was observed.
The standard deviations (σ) of the five repeated pH measurements in relation to SMC and soil texture show high σ at low SMCs for both pH ISEs and exponentially decreasing values towards higher SMCs. Between 6 % and 11 % SMC, σ is minimized, and robust pH values can be measured with both pH ISEs independently from soil texture (Table 1, Figs. 4, 5). Antimony ISEs showed slightly higher σ in dry soils and robust pH values at slightly higher SMCs. These findings are in agreement with Keaton (1938) and Davis (1943) for glass-membrane electrodes and with Oliviera et al. (2018) and Zong et al. (2021) for antimony electrodes. Oliviera et al. (2018) and Zong et al. (2021) also observed a strongly increased scattering of repeated pH measurements at low SMCs. Zong et al. (2021) determined a threshold for a minimized standard deviation at an SMC of 7 %. A decreased pH dispersion at higher SMCs was explained by Davis (1943) with the better soil contact at higher SMCs. This is caused by the composition and operating principle of electro-chemical pH electrodes, requiring an ion-conductive connection between the reference and the measuring electrode, which is often not the case under dry conditions (Merl et al., 2022).
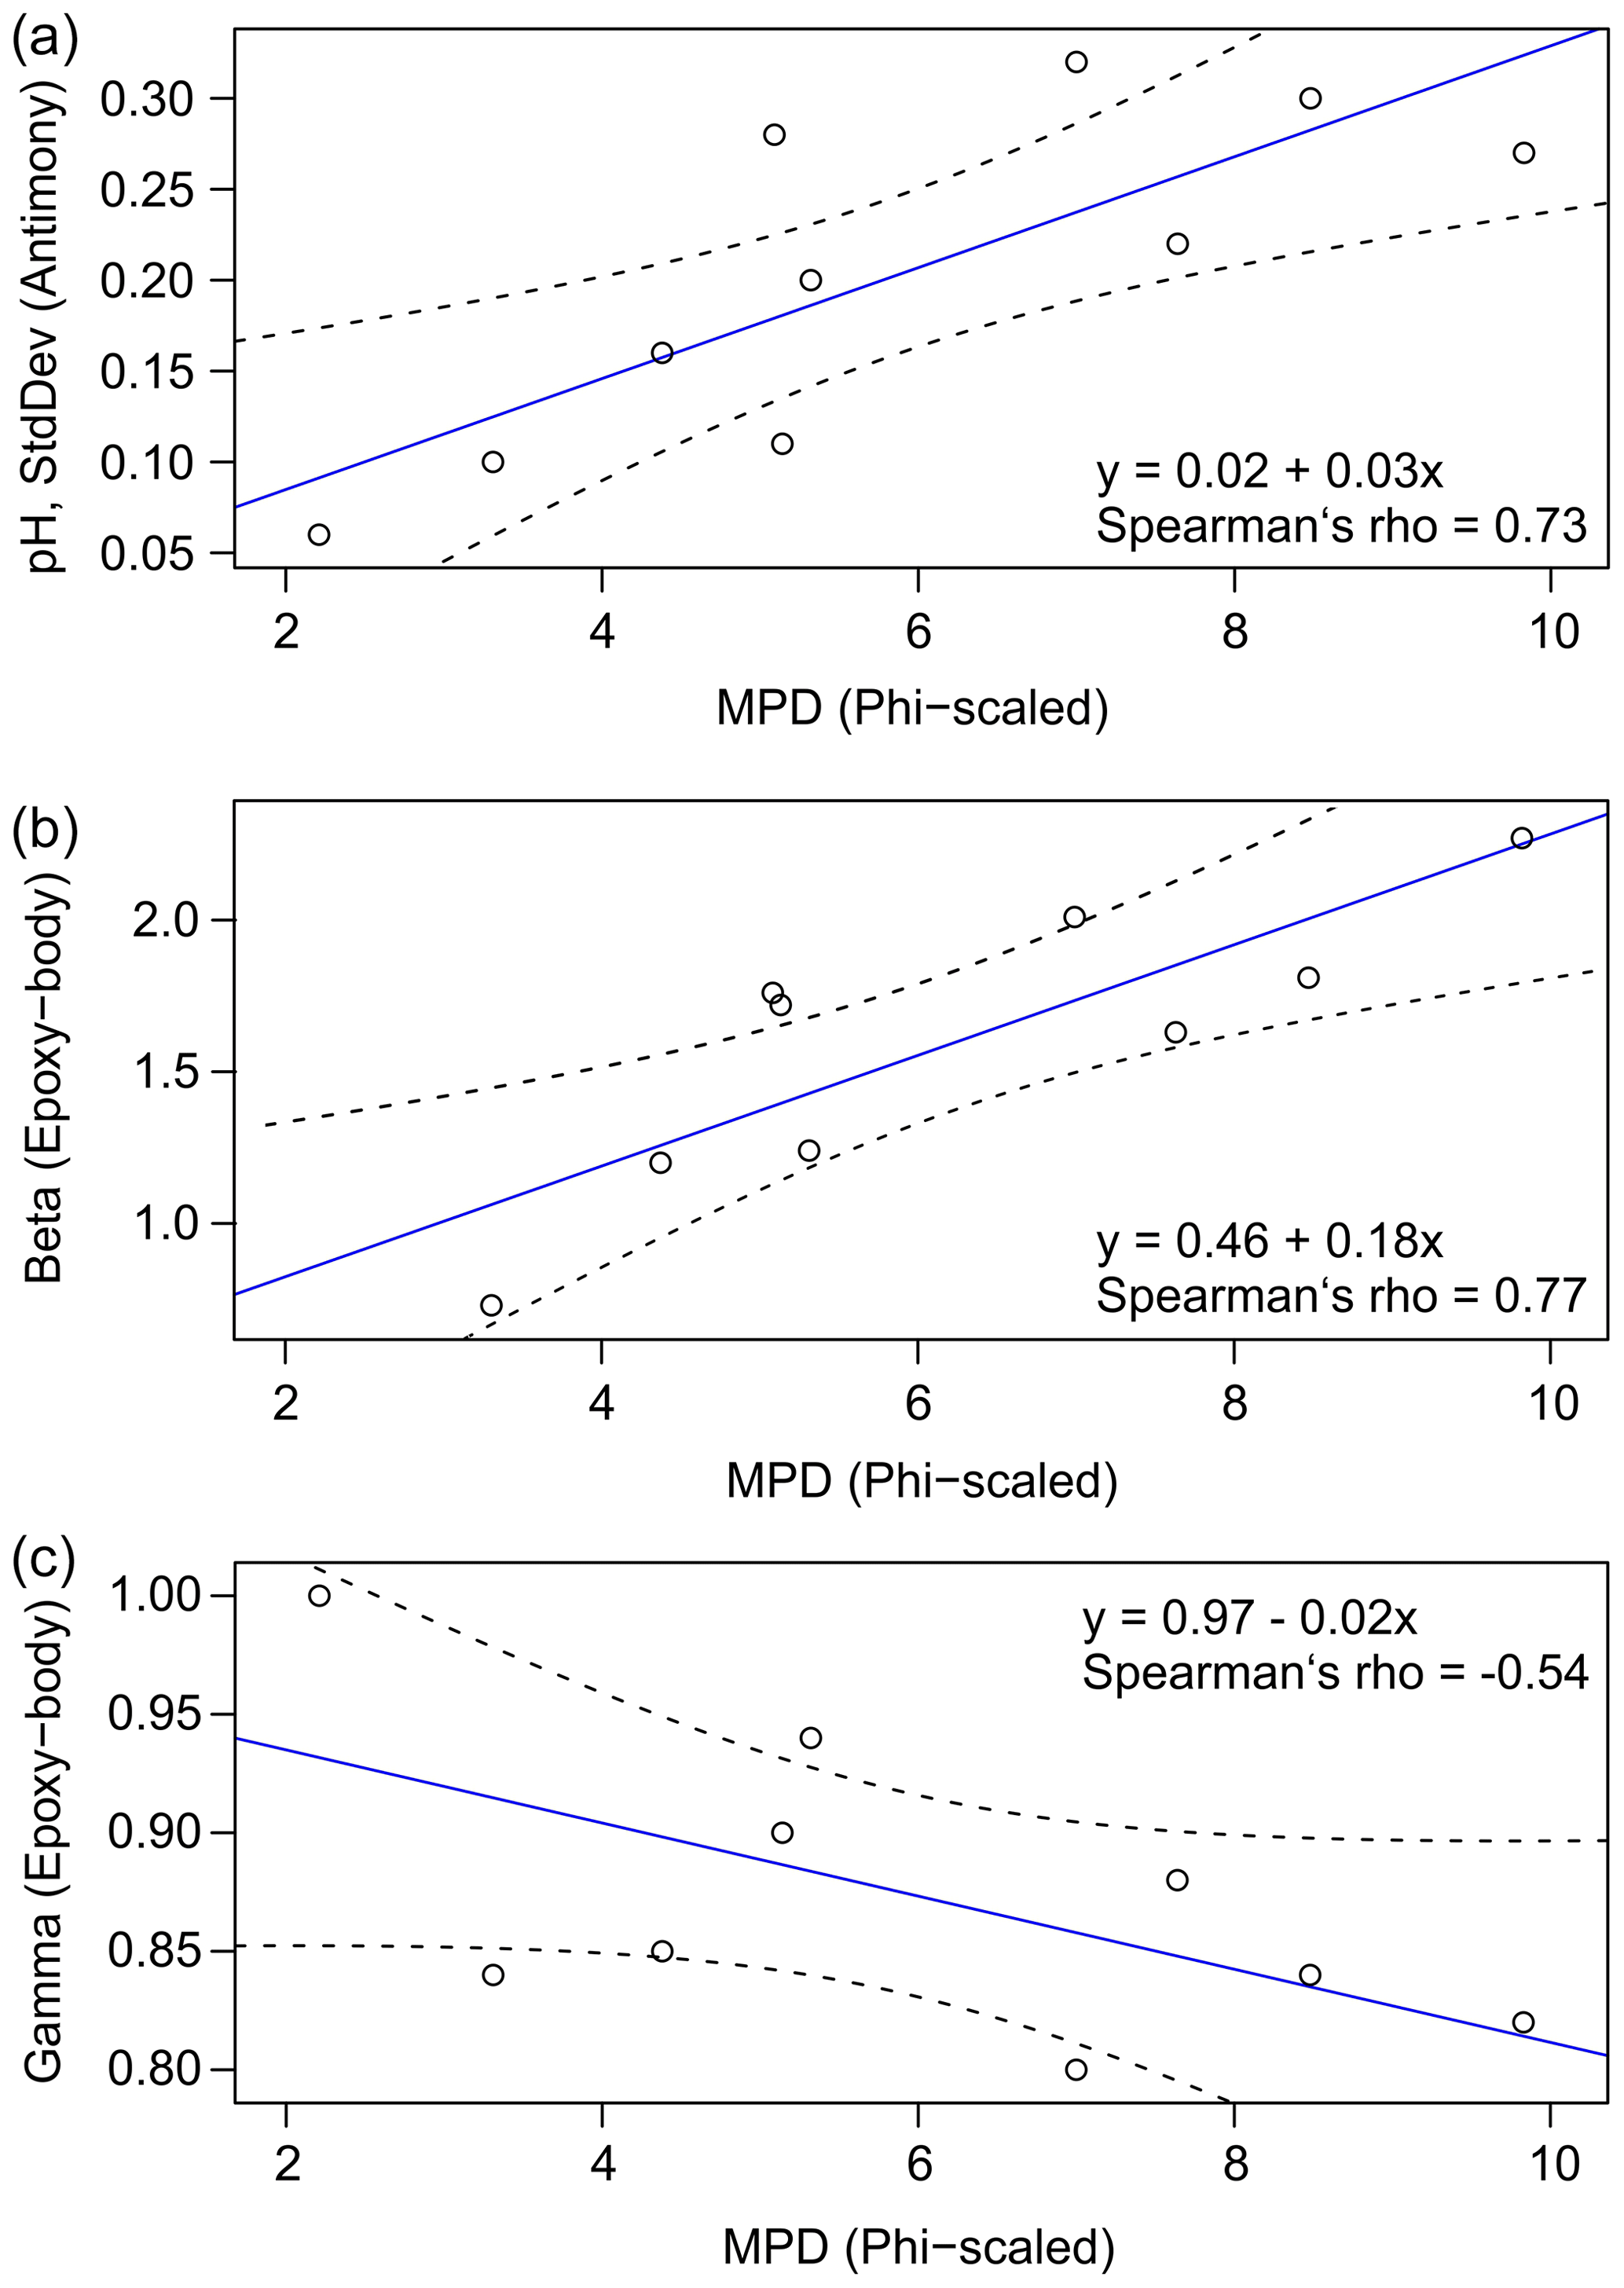
Figure 7Correlation between mean particle diameter (phi-scaled) and standard deviation (a), as well as regression coefficients β (b) and γ (c) (solid blue line: regression model, shaded area: 95% confidence interval).
Figure 7 illustrates the dependence of soil texture represented by the phi-scaled MPD on the above-described SMC–pH relationship. For the antimony ISE and at low SMCs, it can be seen that σ of the repeated pH measurements increases from 0.05 to 0.3 pH units with decreasing MPD and increasing phi (Fig. 7a). Thus, the measurement error is greater for clayey soils compared to sandy soils. Furthermore, the shape of the exponential pH curves also seems to be affected by soil texture. For the epoxy-body ISE, it was observed that the coefficient β, which represents the maximum pH increase of the exponential curve, increases from 0.7 to 2.3 pH units when MPD decreases and phi increases (Fig. 7b). This confirms the above-stated maximum pH increase calculated from the pH raw data (Table 1). Finally, γ, affecting the curvature of the model, decreases with decreasing MPD and increasing phi (Fig. 7c). Hence, for sandy soil textures, the correlation between sensor pH and SMC is rather linear, whereas, for clayey soils, the graph has a pronounced exponential geometry, showing a strong concavity with a steep ascent at lower SMCs and a plateau effect at higher SMCs.
An explanation of the exponential relationship between pH and SMC was given by Thomas (1996). He states that an increase in SMC favors the dissociation of protons from the exchange sites of the soil, as well as the hydrolysis of Al species at lower pH values and of basic cations at higher pH values. These processes generate a buffer effect, which tends to stabilize the pH value with increasing SMC. Since sandy soils have a smaller specific surface area and consequently lower cation exchange capacity, this buffer effect is less pronounced in sandy soils compared to in clayey soils, resulting in a rather linear SMC–pH relationship. In contrast, in clayey soils, the buffer effect results in a successive reduction in the pH increase with increasing SMC and in the described exponential behavior.
In the present study, soil samples of 10 different soil textures from a quaternary landscape in northeastern Germany were exposed to different soil moisture contents (SMCs), and the sensor pH values were measured with two different types of robust ion-selective electrodes. A change in soil moisture affected sensor pH readings, especially at low SMCs and for soils with increasing amounts of clay. While sandy soils show a linear relationship between pH and SMC or an exponential curve with low curvature, in clayey soils, the concavity of the exponential model is more pronounced. The results show that reliable pH values are obtained for SMCs > 11 %. The standard deviations (σ) of repeated measurements of both electrodes decreased with increasing soil moisture and showed a good precision at SMC > 11 %. However, at low SMCs, σ was higher for clayey soils than for sandy soils. With increasing SMC, the pH values measured by ISEs approach the standard pH measured with a glass electrode in 0.01 M CaCl2 (soil : solution ratio of 1:2.5) asymptotically. Thus, optimal measurement conditions can be considered to be found near field capacity as a subsequent calibration of the sensor pH values to the standard pH value is negligible. In contrast, at low SMCs, sensor data calibration is recommended. However, when the soil texture is known and the in situ soil moisture is measured, the regression curves can be used for sensor pH correction. Since only 6 out of 11 soil texture groups were part of the present study, further analyses should be carried out on the 5 remaining soil textures, especially the silty textures. Furthermore, more different soil landscapes should be involved.
All R codes used in the paper can be made available from the corresponding author upon reasonable request.
All data sets used in the text are available in the Supplement.
The supplement related to this article is available online at: https://doi.org/10.5194/soil-10-321-2024-supplement.
Conceptualization: SV. Methodology: SV, KE. Formal analysis: KE, SV. Investigation: KE, SV. Data curation: KE, SV. Writing – original draft preparation: SV, KE, RG. Writing – review and editing: IS, EB, WS, JR, EK. Visualization: SV. Supervision: SV, WS. Project administration: RG, JR, EK. Funding acquisition: RG, JR, EK.
The contact author has declared that none of the authors has any competing interests.
Publisher’s note: Copernicus Publications remains neutral with regard to jurisdictional claims made in the text, published maps, institutional affiliations, or any other geographical representation in this paper. While Copernicus Publications makes every effort to include appropriate place names, the final responsibility lies with the authors.
Special gratitude goes to Mohamed Bourouah (Hahn Schickard Society for Applied Research) for providing the self-developed ISE hardware and software.
This work was partly funded by the agricultural European Innovation Partnership program (EIP-AGRI, project “pH-BB: precision liming in Brandenburg” (http://ph-bb.com, last access: 14 May 2024), grant no. 204016000014/80168341), as well as by the German Federal Ministry of Education and Research (BMBF, project “BonaRes (Modul A, I4S – Intelligence for Soil: Integrated System for Site-specific Soil Fertility Management)”, grant no. 031B1069A).
The publication of this article was funded by the Open Access Fund of the Leibniz Association.
This paper was edited by Axel Don and reviewed by Rafael Lopez and one anonymous referee.
Adamchuk, V. I. and Lund, E. D.: On-The-Go Mapping of Soil pH Using Antimony Electrodes, Paper No. 083995, ASABE Annual International Meeting, 29 June–2 July 2008, Rhode Island (USA), https://elibrary.asabe.org/abstract.asp?aid=24748 (last access: 14 May 2024), 2008.
Adamchuk, V. I., Morgan M. T., and Ess, D. R.: An automated sampling system for measuring soil pH, T. ASAE, 42, 885–891, 1999.
Baghdady, N. H. and Sommer, K.: Application of an improved antimony micro-electrode for measuring pH-changes at the soil-root interface of maize, J. Plant Nutr. Soil Sci., 153, 323–326, 1990.
Barron, J. J., Ashton, C., and Geary, L.: The Effects of Temperature on pH Measurement, 57th Annual Meeting of the International Society of Electrochemistry, Edinburgh, UK, https://knowledge.reagecon.com/wp-content/uploads/2019/12/The-Effects-of-Temperature-on-PH-Measurement.pdf (last access: 14 May 2024), 2006.
Bates, R. G.: Electrodes for pH Measurement, J. Electroanal. Chem., 2, 93–109, 1961.
Bönecke, E., Meyer, S., Vogel, S., Schröter, I., Gebbers, R., Kling, C., Kramer, E., Lück, K., Nagel, A., Philipp, G., Gerlach, F., Palme, S., Scheibe, D., Zieger, K., and Rühlmann, J.: Guidelines for precise lime management based on high-resolution soil pH, texture and SOM maps generated from proximal soil sensing data, Precis. Agric., 22, 493–523, https://doi.org/10.1007/s11119-020-09766-8, 2020.
Brouder, S. M., Hofmann, B. S., and Morris, D. K.: Mapping soil pH: accuracy of common soil sampling strategies and estimation techniques, Soil Sci. Soc. Am. J., 69, 427–442, https://doi.org/10.2136/sssaj2005.0427, 2005.
Comer, J.: PH and Ion-Selective Electrodes, in: Instrumental Methods for Quality Assurance in Foods, edited by: Fung, D. Y. C. and Matthews, R. E., Routledge, New York, https://doi.org/10.1201/9780203750711, 1991.
Conkling, B. L. and Blanchar, R. W.: A comparison of pH measurements using the antimony microelectrode and glass electrode, Agron. J., 80, 275–278, 1988.
Davis, L. E.: Measurements of pH with the glass electrode as affected by soi moisture, Soil Sci., 56, 405–422, 1943.
Decker, M., Bause, S., Teichmann, P., Schneider, M., and Vonau, W.: Development of an automatic system for the on-site pH measurement of soil samples, Tech. Mess., 84, 659–671, 2017.
de Souza Silva, F. C. and Molin, J. P.: On-the-go tropical soil sensing for pH determination using ion-selective electrodes, Pesq. Agropec. Bras., 53, 1189–1202, https://doi.org/10.1590/S0100-204X2018001100001, 2018.
Donoghue, J. F.: Phi Scale, in: Encyclopedia of Estuaries, edited by: Encyclopedia of Earth Sciences Series, edited by: Kennish, M. J., Springer, Dordrecht, the Netherlands, https://doi.org/10.1007/978-94-017-8801-4_277, 2016.
Durst, R. A.: Sources of Error in Ion-Selective Electrode Potentiometry, in: Ion-Selective Electrodes in Analytical Chemistry, edited by: Freiser, H., Modern Analytical Chemistry book series, Springer New York, NY, 311–338, https://doi.org/10.1007/978-1-4684-2592-5, 1978.
Eckelmann, W., Sponagel, H., and Grottenthaler, W.: Bodenkundliche Kartieranleitung, 5th Edn., Schweizerbart Science Publishers, Stuttgart, Germany, ISBN 978-3-510-95920-4, 2005.
Epstein, E. and Bloom, A. J.: Mineral Nutrition of Plants: Principles and Perspectives, 2nd Edn., Sinauer Associates, Sunderland, MA, USA, ISBN 0878931724, 2001.
Essington, M. E.: Soil and water chemistry: An integrative approach, 2nd Edn., CRC Press, Boca Raton, FL, USA, https://doi.org/10.1201/b18385, 2015.
Fujimoto, M., Matsumura, Y., and Satake, N.: General Properties of Antimony Microelectrode in Comparison with Glass Microelectrode for pH Measurement, Jpn. J. Physiol., 30, 491–508, 1980.
Gebbers, R., Herbst, R., and Wenkel, K.-O.: Sensitivity analysis of soil nutrient mapping, Proceedings of the 7th Joint International Agricultural Conference, Wageningen, the Netherlands, edited by: Lokhorst, C., Huijsmans, J., and de Louw, R. P. M., Wageningen Academic Publishers, Wageningen, the Netherlands, 513–519, ISBN 978-90-8686-113-2, 2009.
Janetzko, P. and Schmidt, R.: Norddeutsche Jungmoränenlandschaften, in: Handbuch der Bodenkunde, edited by: Blume, H.-P., Stahr, K., Fischer, W., Guggenberger, G., Horn, R., Frede, H.-G., and Felix-Henningsen, P., Wiley-VCH, Weinheim, Germany, https://doi.org/10.1002/9783527678495.hbbk1995008, 2014.
Kahlert, H., Steinhardt, T., Behnert, J., and Scholz, F.: A New Calibration Free pH-Probe for In Situ Measurements of soil pH, Electroanalysis, 16, 2058–2064, 2004.
Keaton, C. M.: A theory explaining the relation of soil-water ratios to the pH values, Soil Sci., 46, 259–266, 1938.
Krbetschek, M. R., Degering, D., and Alexowsky, W.: Infrared radiofluorescence ages (IR-RF) of Lower Saalian sediments from Central and Eastern Germany, Zeitschr. Dtsch. Ges. Geowiss., 159, 133–140, 2008.
Krumbein, W. C.: Size frequency distributions of sediments, J. Sediment Petrol., 4, 65–77, 1934.
Krumbein, W. C.: Size frequency distributions of sediments and the normal phi curve, J. Sediment Petrol., 8, 84–90, 1938.
Matthiesen, H.: In situ measurement of soil pH, J. Archaeol. Sci., 31, 1373–1381, https://doi.org/10.1016/J.JAS.2004.03.005, 2004.
Mengel, K. and Kirkby, E. A.: Principles of Plant Nutrition, 5th Edn., Kluwer Academic Publishers, Dordrecht, the Netherlands, https://doi.org/10.1007/978-94-010-1009-2, 2001.
Merl, T., Rasmussen, M. R., Koch, L. R., Søndergaard, J. V., Bust, F. F., and Koren, K.: Measuring soil pH at in situ like conditions using optical pH sensors (pH-optodes), Soil Biol. Biochem., 175, 108862, https://doi.org/10.1016/j.soilbio.2022.108862, 2022.
Oliviera, I. S. D, Tavares, T. R., Trevisan, R. G., Bersani, V. H. S., and Molin, J. P.: Influence of soil moisture in pH Measurements using ion-selective electrodes, in: ConBAP 2018, Proceedings of the Congresso Brasileiro de Agricultura de Precisão, Curitiba, Paraná, Brazil, 66–73, 2018.
Orellana, G., Cano-Raya, C., López-Gejo, J., and Santos, A. R.: Online Monitoring Sensors, in: Treatise on Water Science, edited by: Wilderer, P., Elsevier, Amsterdam, the Netherlands, 221–261, https://doi.org/10.1016/B978-0-444-53199-5.00059-2, 2011.
Parks, L. R. and Beard, H. C.: The Theory of the Stick Antimony Electrode, J. Phys. Chem., 37, 821–822, 1933.
Patil, S., Ghadi, H., Ramgir, N., Adhikari, A., and Rao, V. R.: Monitoring soil pH variation using Polyaniline/SU-8 composite film based conductometric microsensor, Sens. Actuators B, 286, 583–590, 2019.
R Core Team: R: A Language and Environment for Statistical Computing, R Foundation for Statistical Computing, Vienna, Austria, https://www.R-project.org/ (last access: 14 May 2024), 2018.
Robson, A. D.: Soil Acidity and Plant Growth, Academic Press, Sydney, NSW, Australia, https://doi.org/10.1016/B978-0-12-590655-5.X5001-4, 1989.
Ruehlmann, J., Bönecke, E., and Meyer, S.: Predicting the lime demand of arable soils from pH value, soil texture and soil organic matter content, Agronomy, 11, p. 785, https://doi.org/10.3390/agronomy11040785, 2021.
Satopää, V., Albrecht, J., Irwin, D., and Raghavan, B.: Finding a “Kneedle” in a Haystack: Detecting Knee Points in System Behavior, Proceedings of the 31st International Conference on Distributed Computing Systems Workshops, 20–24 June 2011, Minneapolis, MN, USA, IEEE, https://doi.org/10.1109/ICDCSW.2011.20, 2011.
Schaller, G. and Fischer, W.: Die Verwendung von Antimon-Elektroden zur pH-Messung in Böden, J. Plant Nutr. Soil Sci., 144, 197–204, 1981.
Schirrmann, M., Gebbers, R., Kramer, E., and Seidel, J.: Soil pH Mapping with an On-The-Go Sensor, Sensors, 11, 573–598, https://doi.org/10.3390/s110100573, 2011.
Shiozawa, S. and Campell, G. S.: On the caculation of mean particle diameter and standard deviation from sand, silt, and clay fractions, Soil Sci., 152, 427–431, 1991.
Shirazi, M. A., Boersma, L., and Hart, J. W.: A unifying quantitative analysis of soil texture: Improvement of precision and extension of scale, Soil Sci. Soc. Am. J., 52, 181–190, 1988.
Sumner, M. E.: Measurement of soil pH: Problems and solutions, Commun. Soil Sci. Plant Anal., 25, 859–879, 1994.
Thiele-Bruhn, S., Wessel-Bothe, S., and Aust, M.-O.: Time resolved in-situ pH measurement in differently treated, saturated and unsaturated soils, J. Plant Nutr. Soil Sci., 178, 425–432, 2015.
Thomas, G. W.: Soil pH and Soil Acidity, in: Methods of Soil Analysis, Part 3, Chemical Methods, edited by: Sparks, D., Page, A., Helmke, P., Loeppert, R., Soltanpour, P. N., Tabatabai, M. A., Johnston, C. T., and Sumner, M. E., Soil Sci. Soc. Am.-Madinson, WI, USA, 475–490, https://doi.org/10.2136/sssabookser5.3.c16, 1996.
Viscarra Rossel, R. A., Gilbertson, M., Thylén, L., McVey, S., and McBratney, A. B.: Field measurements of soil pH and lime requirement using an on-the-go soil pH and lime requirement measurement system. In Precision agriculture '05, Proceedings of the 5th European Conference on Precision Agriculture, Uppsala, Sweden, edited by: Stafford, J. V., Wageningen Academic Publishers, Wageningen, the Netherlands, 511–520, ISBN 978-90-76998-69-5, 2005.
Viscarra Rossel, R. A. and McBratney, A. B.: Preliminary experiments towards the evaluation of a suitable soil sensor for continuous, “on-the-go” field pH measurements, in: Precision agriculture '97, Vol. II, Technology, IT and management, Proceedings of the 1st European Conference on Precision Agriculture, Warwick, UK, 7–10 September, BIOS Scientific Publishers, Oxford, UK, 493–501, ISBN 978-18-59962-36-7, 1997.
Yuqing, M., Jianrong, C., and Keming, F.: New technologies for detection of pH, J. Biochem. Bioph. Meth., 63, 1–9, 2005.
Zong, S., Zhang, X., Chen, C., Lu, C., Ni, M., Mao, T., and Su, X.: Study on water content compensation method and experimental for soil pH detection sensor, Turk. J. Field Crops, 26, 52–58, 2021.